
Influencing Factors Analysis and Simulation Calibration of Restitution Coefficient of Rice Grain

 ,
, 


 and
and 
Abstract
:Featured Application
Abstract

1. Introduction
2. Materials and Methods
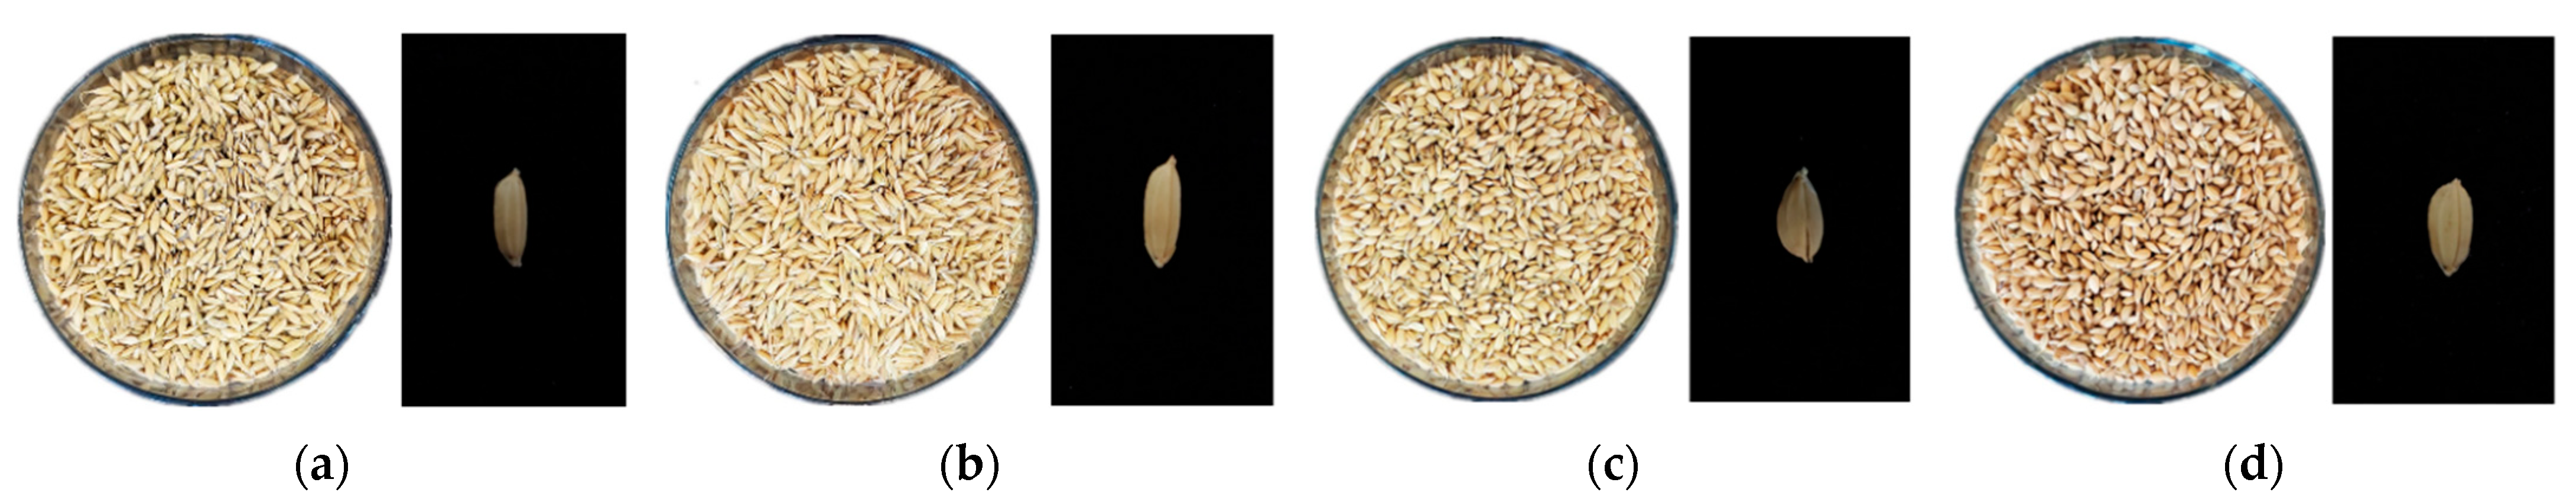
2.1. Materials
2.2. Methods
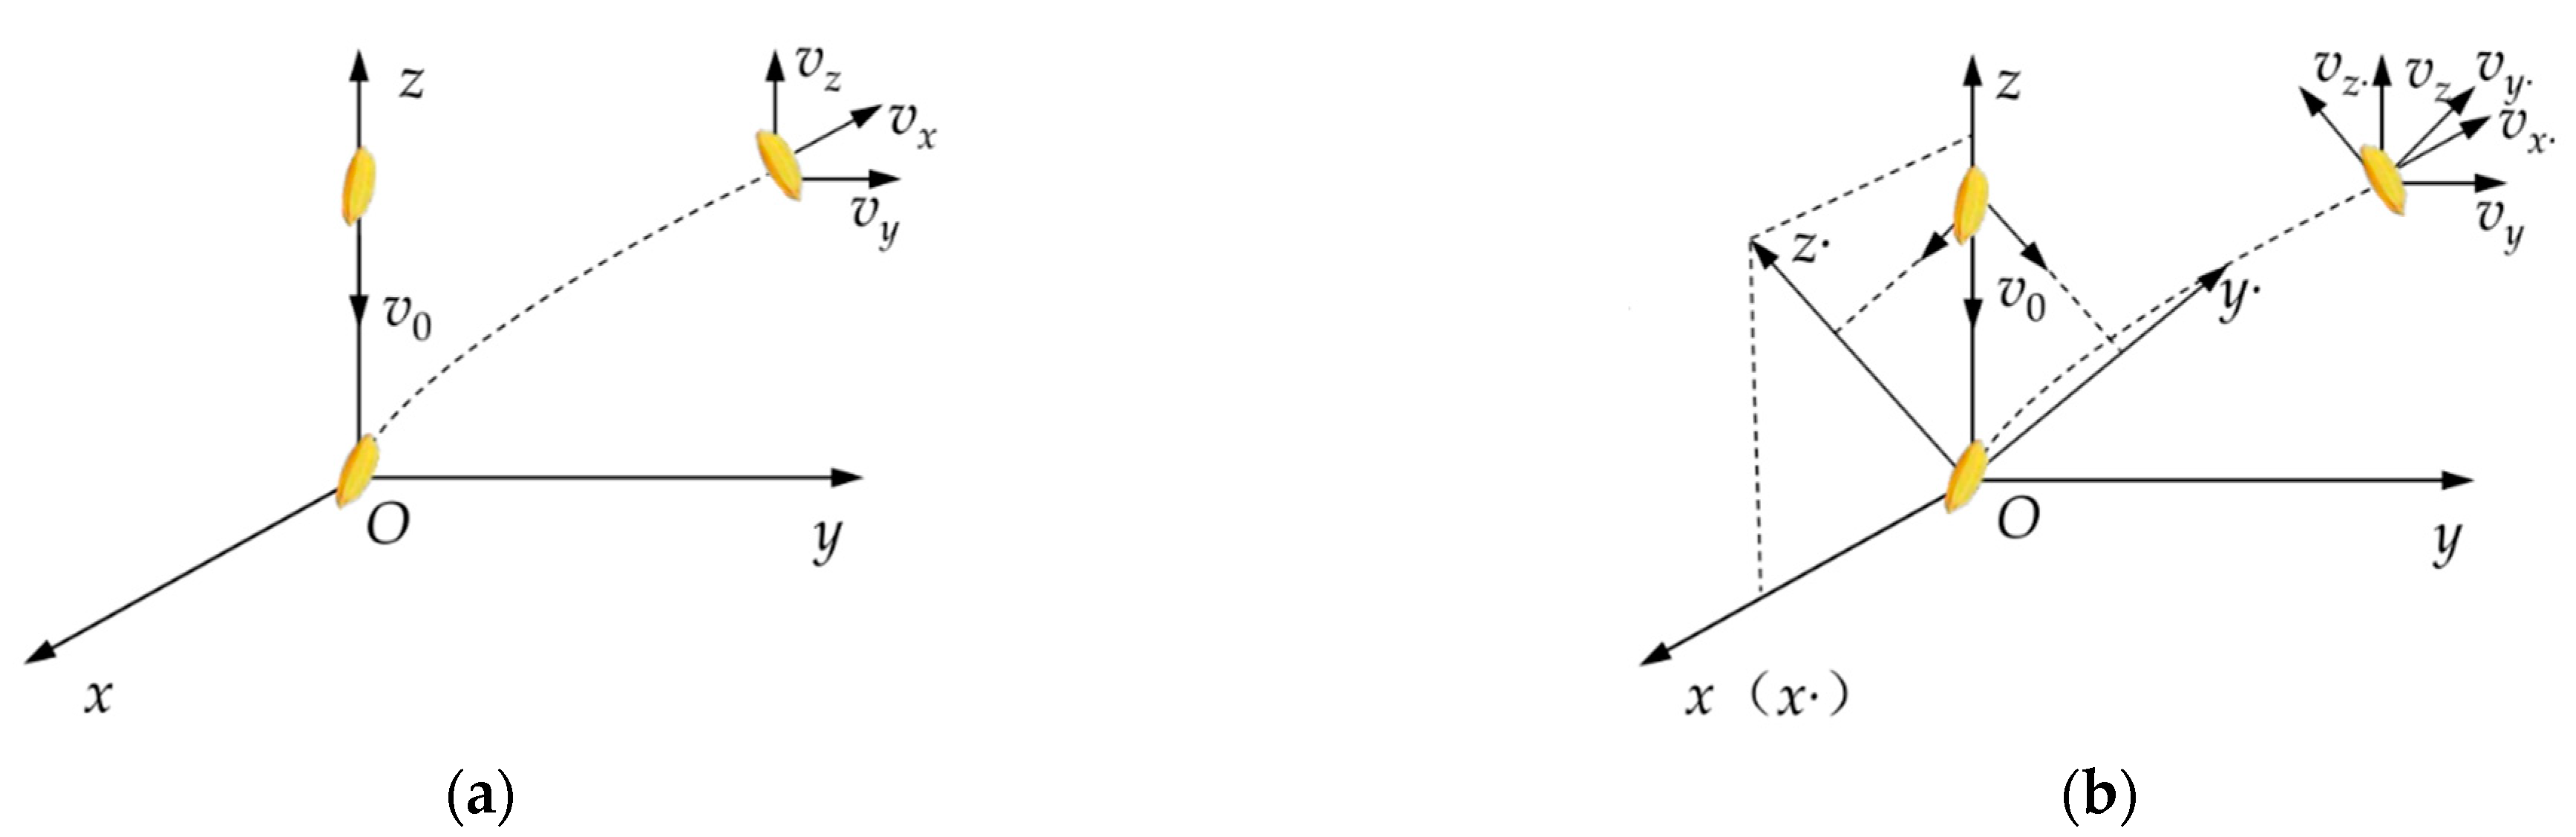
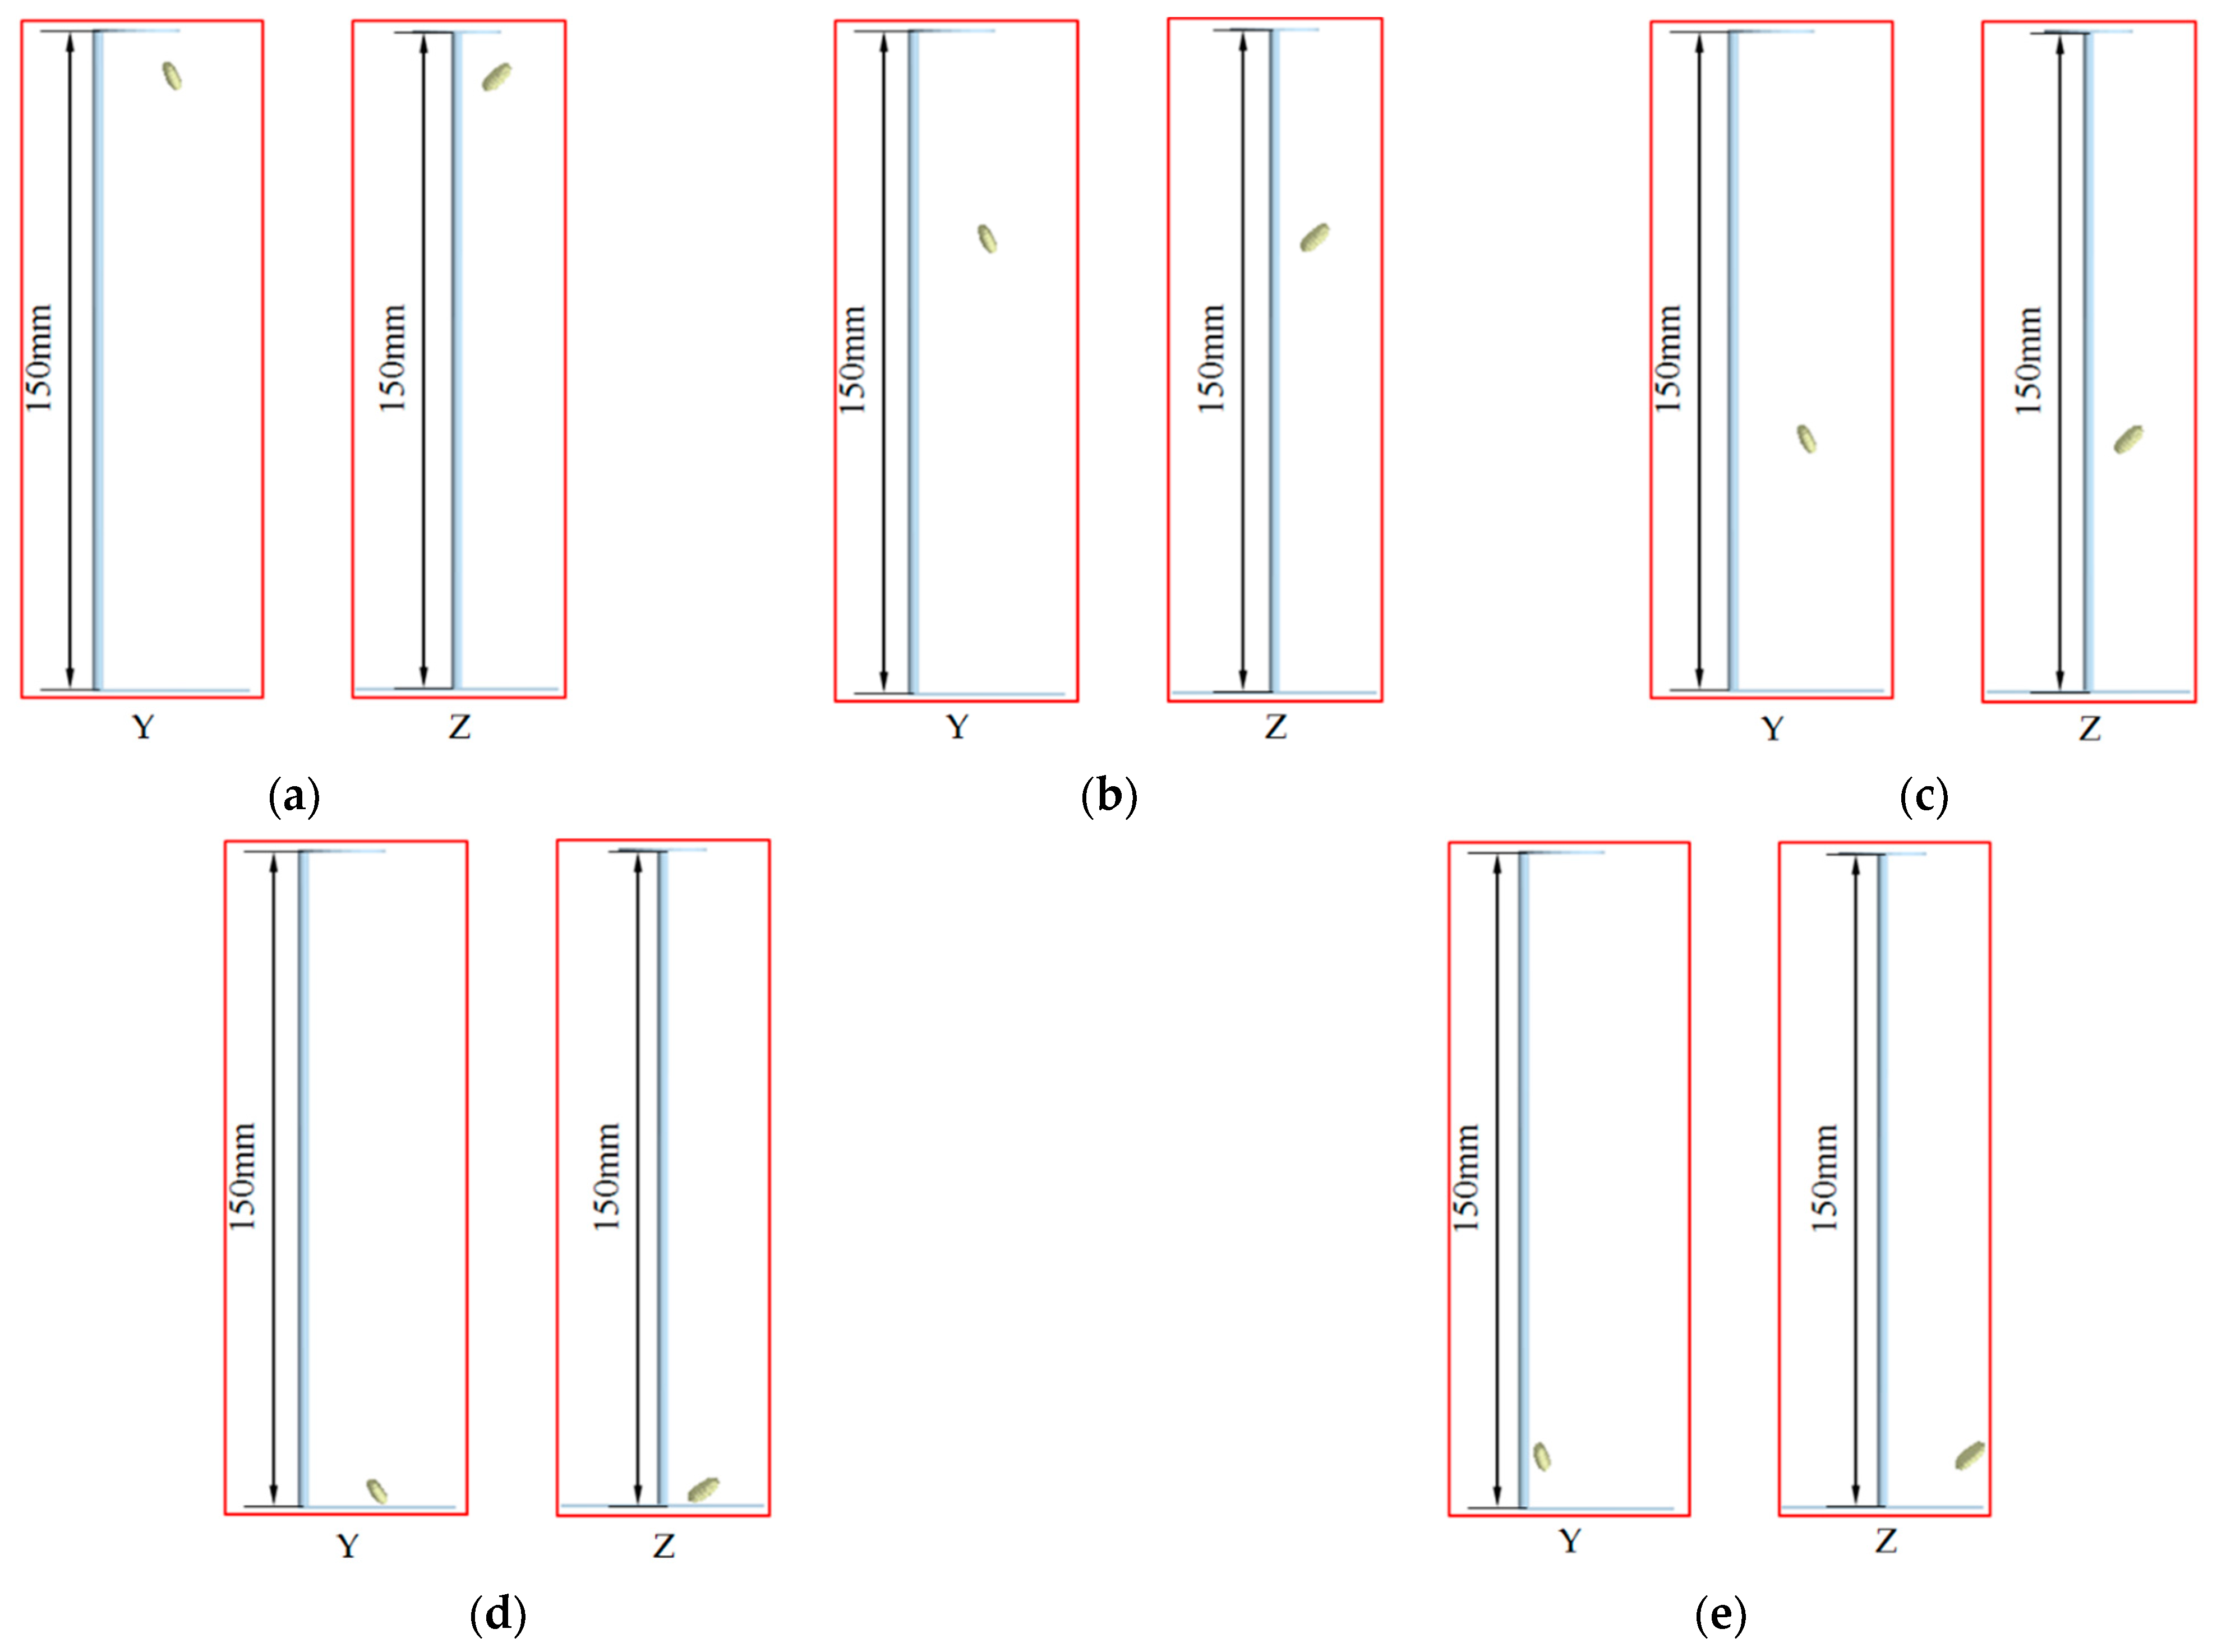
2.3. Test Principle
2.4. Test Design
2.5. Simulation Calibration
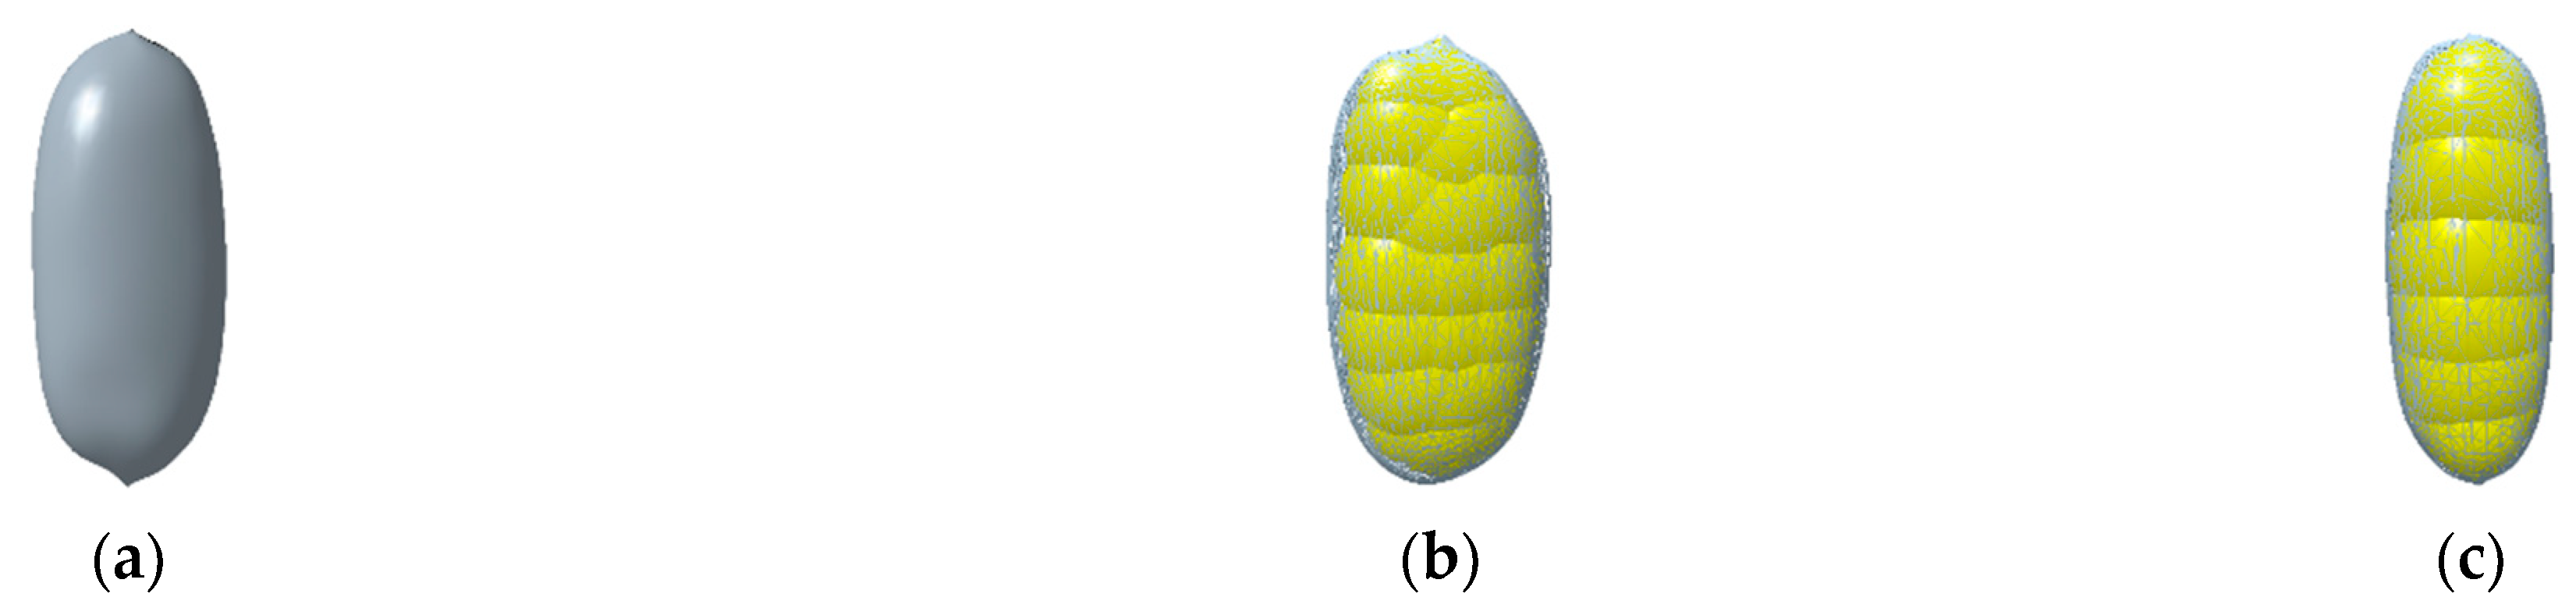
2.5.1. Establishment of Simulation Model
2.5.2. Parameters Setting of Simulation
3. Results and Discussion
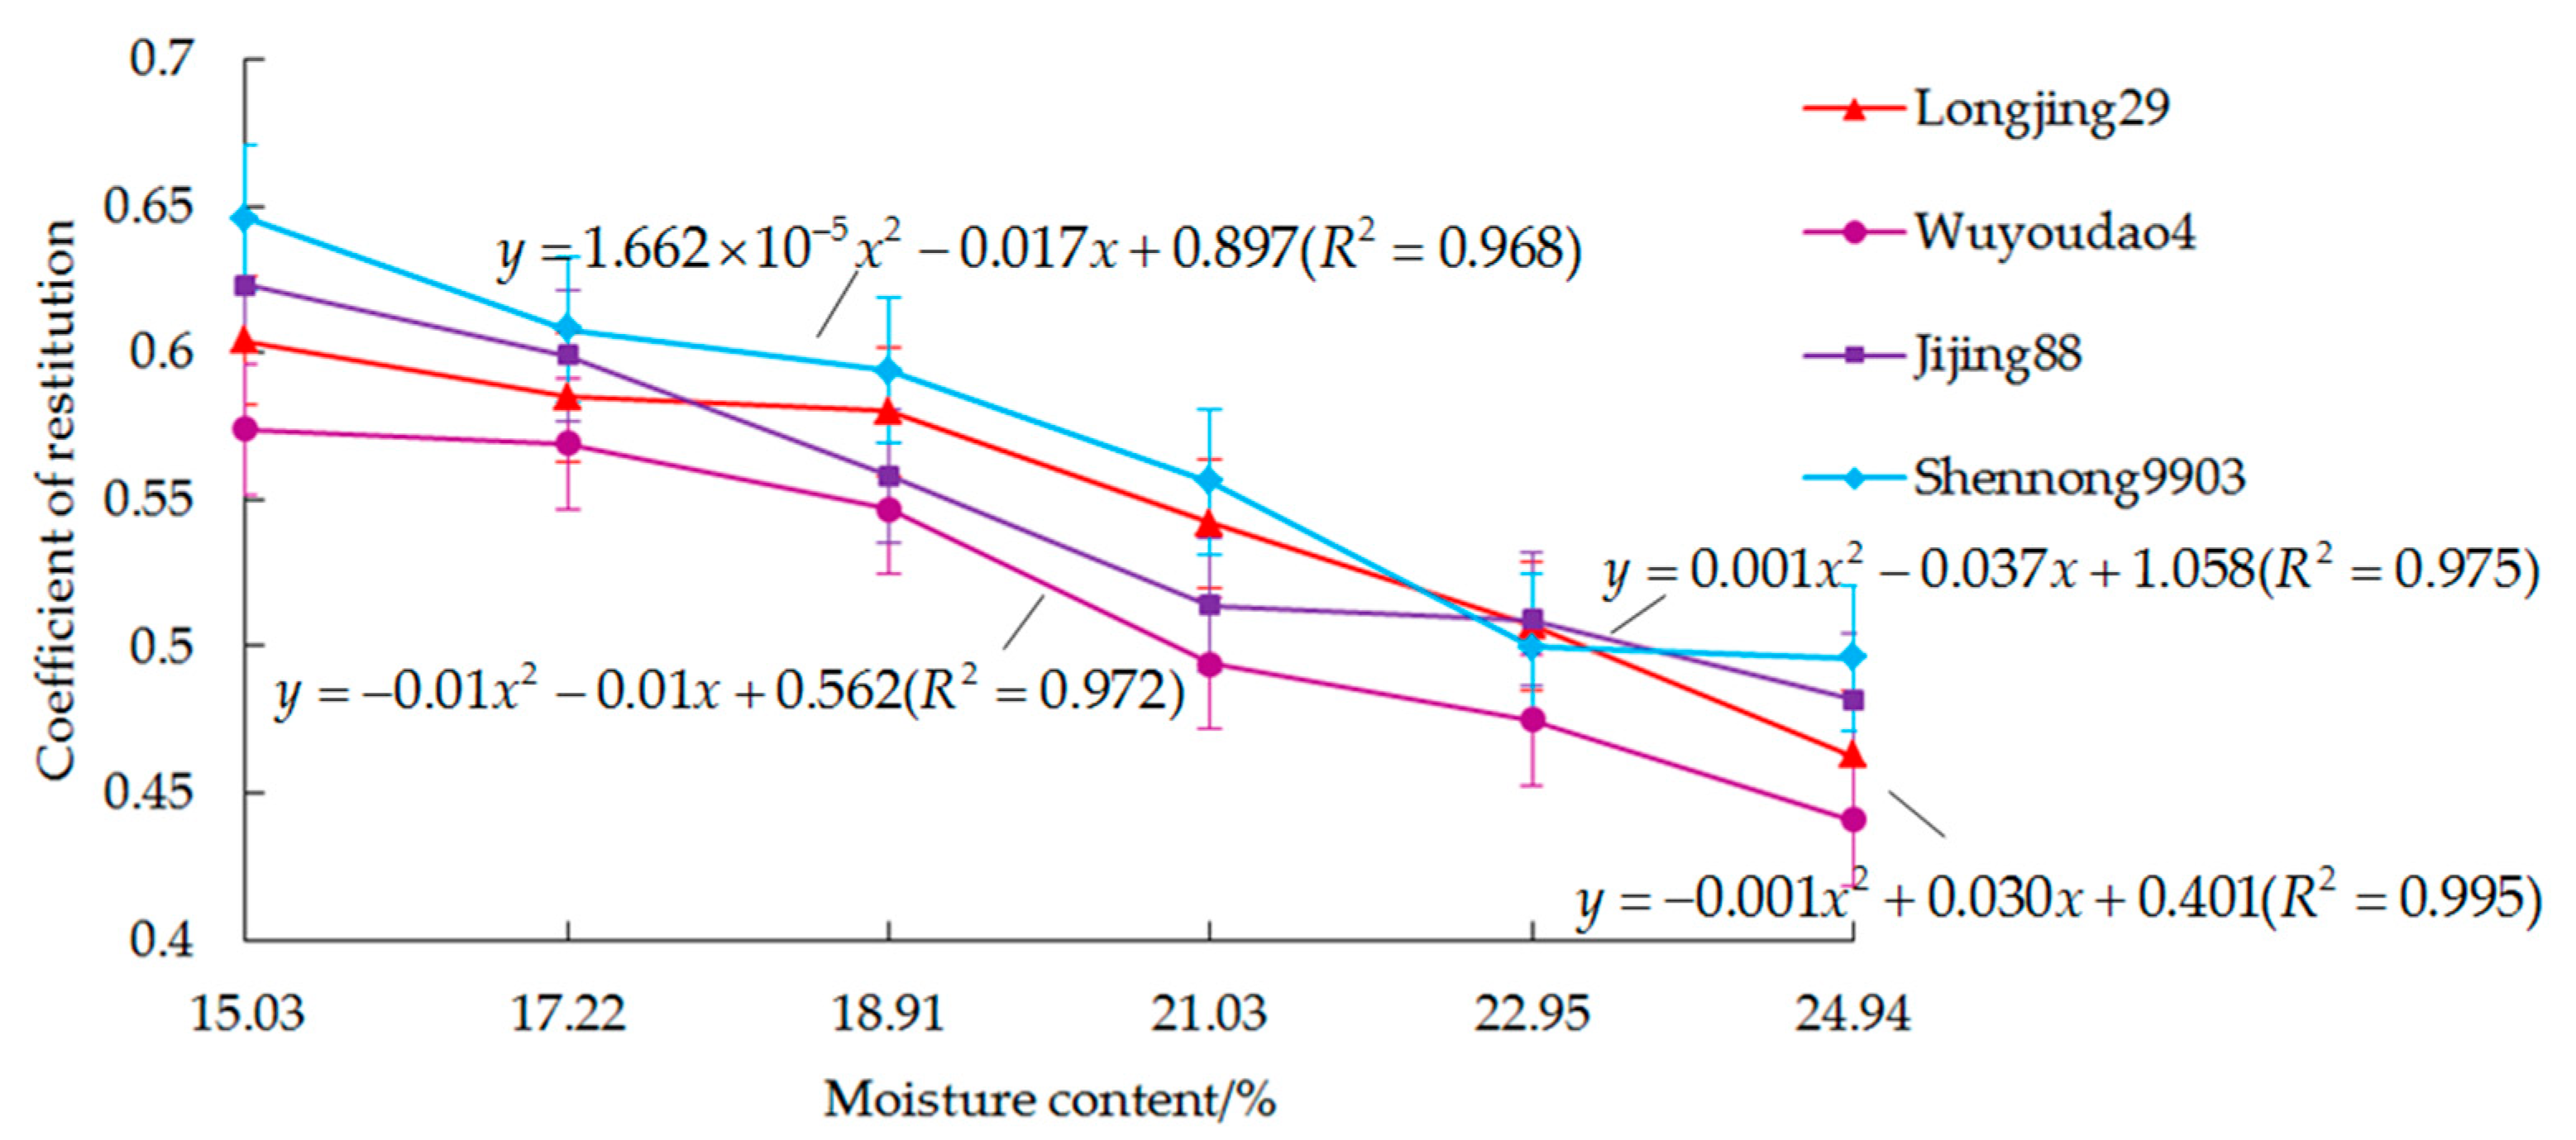
3.1. Results Analysis of Single Factor
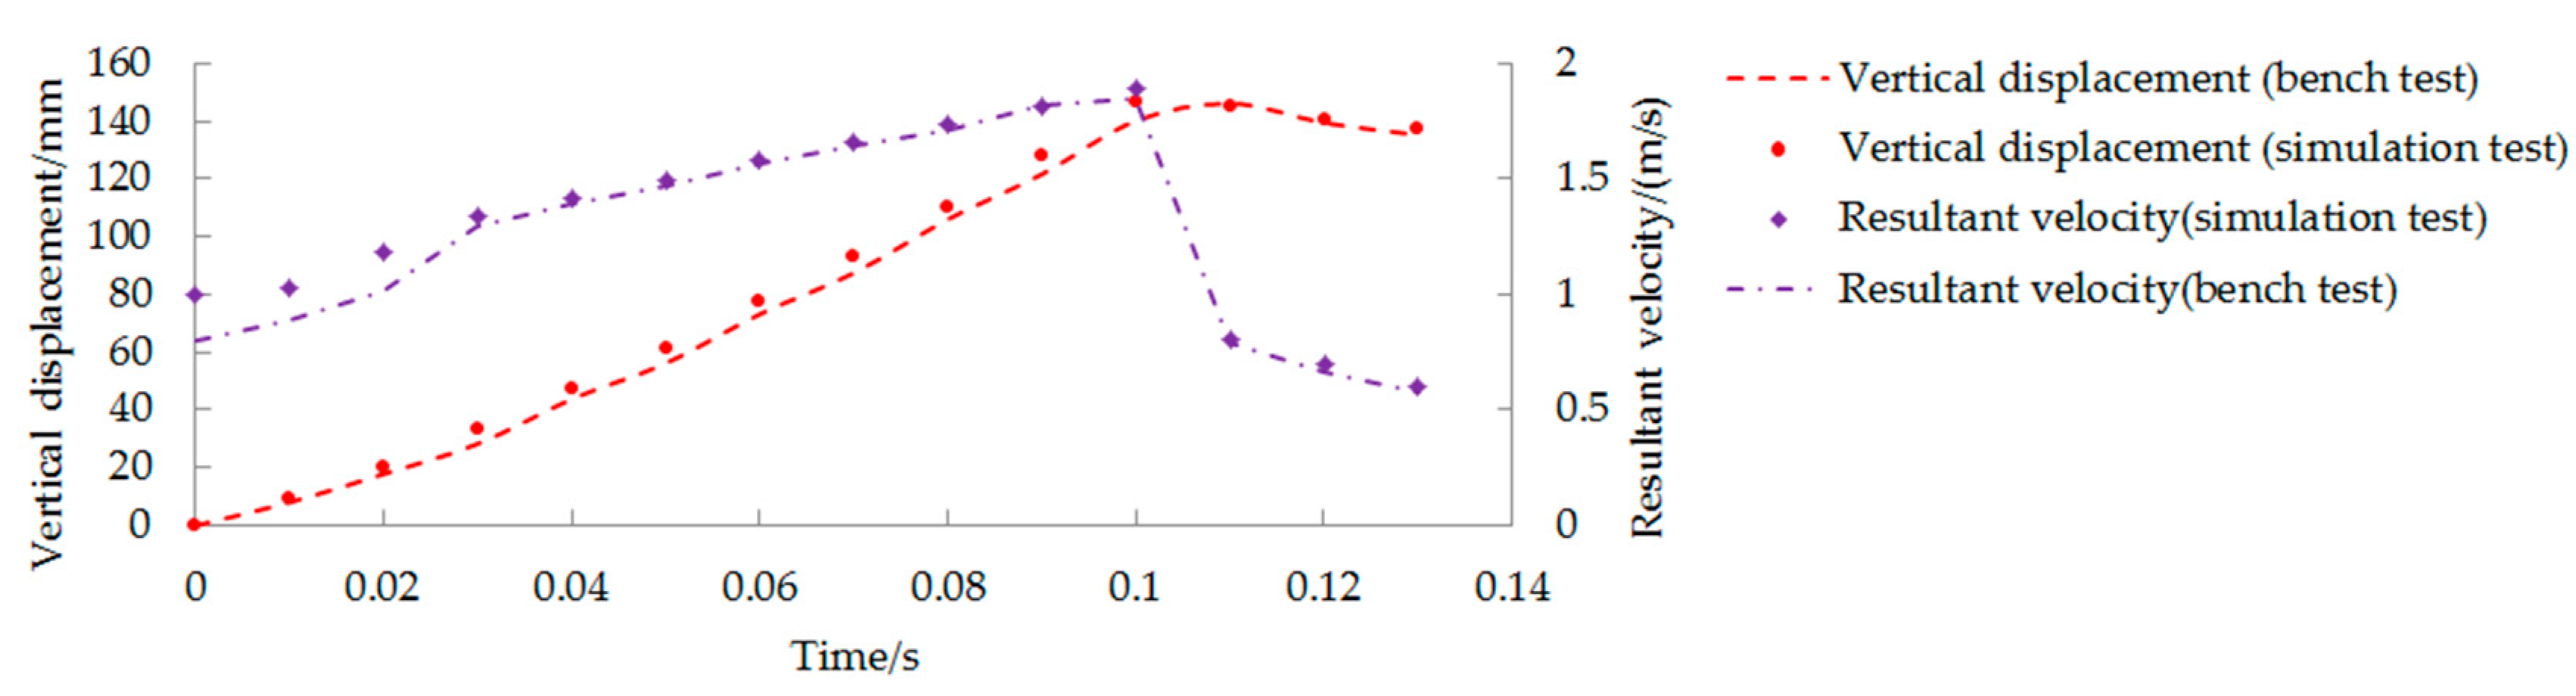
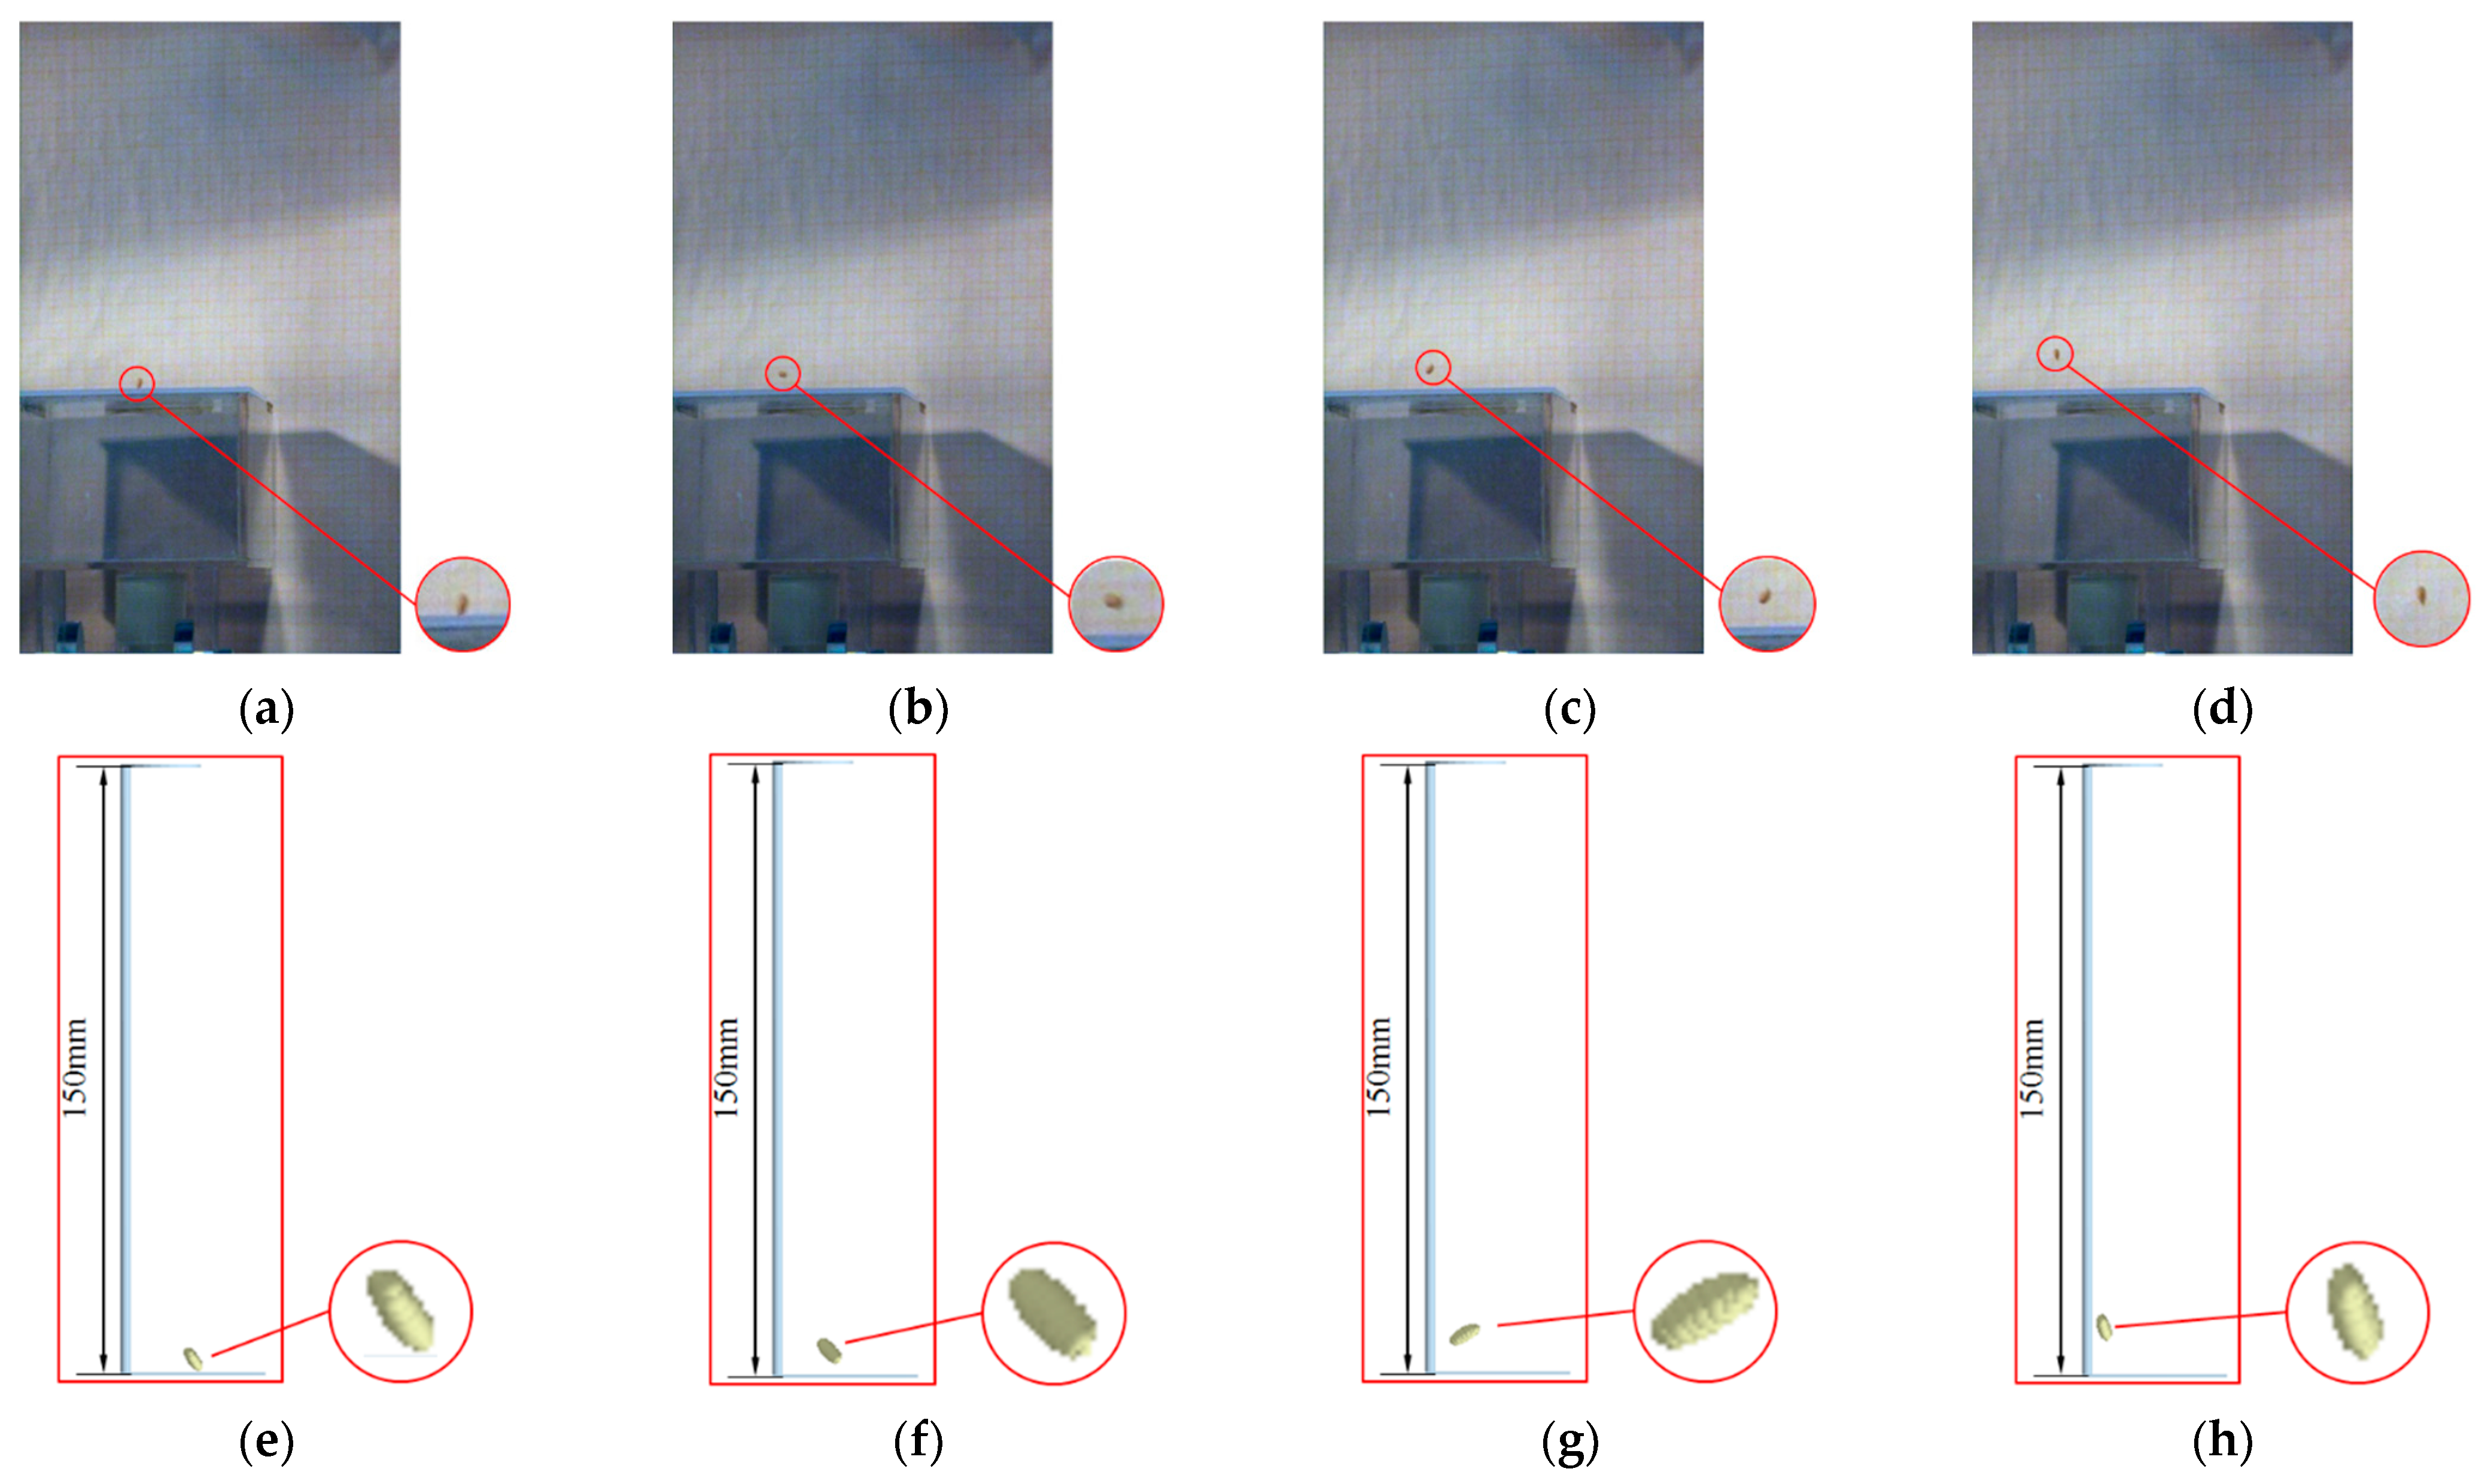
3.2. Results Analysis of Simulation Calibration
3.3. Discussion
4. Conclusions
Author Contributions
Funding
Institutional Review Board Statement
Informed Consent Statement
Data Availability Statement
Acknowledgments
Conflicts of Interest
References
- Zhao, H.; Mo, Z.; Lin, Q.; Pan, S.; Duan, M.; Tian, H.; Wang, S.; Tang, X. Relationships between grain yield and agronomic traits of rice in southern China. Chil. J. Agric. Res. 2020, 80, 72–79. [Google Scholar] [CrossRef] [Green Version]
- Dong, F.; Xu, J.H.; Shi, J.R.; Mokoena, M.P.; Olaniran, A.O.; Chen, X.Y.; Lee, Y.-W. First Report of Fusarium Head Blight Caused by Fusarium meridionale in Rice in China. Plant Dis. 2020, 104, 2726. [Google Scholar] [CrossRef]
- Chen, D.; Ye, X.; Zhang, Q.; Xiao, W.; Ni, Z.; Yang, L.; Zhao, S.; Hu, J.; Gao, N.; Huang, M. The effect of sepiolite application on rice Cd uptake—A two-year field study in Southern China. J. Environ. Manag. 2020, 254, 109788. [Google Scholar] [CrossRef]
- Zhou, M.; Wang, H.; Yang, S.; Fan, K. Influence of springtime North Atlantic Oscillation on crops yields in Northeast China. Clim. Dyn. 2013, 41, 3317–3324. [Google Scholar] [CrossRef]
- Petkevichius, S.; Shpokas, L.; Kutzbach, H.D. Investigation of the maize ear threshing process. Biosyst. Eng. 2008, 99, 532–539. [Google Scholar] [CrossRef]
- Tamura, M.; Singh, J.; Kaur, L.; Ogawa, Y. Impact of structural characteristics on starch digestibility of cooked rice. Food Chem. 2016, 191, 91–97. [Google Scholar] [CrossRef] [PubMed]
- Wang, L.; Zheng, Z.; Yu, Y.; Liu, T.; Zhang, Z. Determination of the energetic coefficient of restitution of maize grain based on laboratory experiments and DEM simulations. Powder Technol. 2020, 362, 645–658. [Google Scholar] [CrossRef]
- Lun, C.K.K.; Savage, S.B. The effects of an impact velocity dependent coefficient of restitution on stresses developed by sheared granular materials. Acta Mech. 1986, 63, 15–44. [Google Scholar] [CrossRef]
- Mangwandi, C.; Cheong, Y.S.; Adams, M.J.; Hounslow, M.J.; Salman, A.D. The coefficient of restitution of different representative types of granules. Chem. Eng. Sci. 2007, 62, 437–450. [Google Scholar] [CrossRef]
- Feng, B.; Sun, W.; Shi, L.; Sun, B.; Zhang, T.; Wu, J. Determination of restitution coefficient of potato tubers collision in harvest and analysis of its influence factors. Nongye Gongcheng Xuebao/Trans. Chin. Soc. Agric. Eng. 2017, 33, 50–57. [Google Scholar] [CrossRef]
- Liu, Y.; Zong, W.; Ma, L.; Huang, X.; Li, M.; Tang, C. Determination of three-dimensional collision restitution coefficient of oil sunflower grain by high-speed photography. Nongye Gongcheng Xuebao/Trans. Chin. Soc. Agric. Eng. 2020, 36, 44–53. [Google Scholar] [CrossRef]
- Liu, C.; Wang, Y.; Song, J.; Wang, C.; Li, Y. Experimental determination and simulation verification of granular material restitution coefficient. Int. Agric. Eng. J. 2016, 25, 48–56. [Google Scholar]
- Horabik, J.; Beczek, M.; Mazur, R.; Parafiniuk, P.; Ryżak, M.; Molenda, M. Determination of the restitution coefficient of seeds and coefficients of visco-elastic Hertz contact models for DEM simulations. Biosyst. Eng. 2017, 161, 106–119. [Google Scholar] [CrossRef]
- Marinack, M.C.; Jasti, V.K.; Choi, Y.E.; Higgs, C.F. Couette grain flow experiments: The effects of the coefficient of restitution, global solid fraction, and materials. Powder Technol. 2011, 211, 144–155. [Google Scholar] [CrossRef]
- Xu, Y.; Zhang, X.; Wu, S.; Chen, C.; Wang, J.; Yuan, S.; Chen, B.; Li, P.; Xu, R. Numerical simulation of particle motion at cucumber straw grinding process based on EDEM. Int. J. Agric. Biol. Eng. 2020, 13, 227–235. [Google Scholar] [CrossRef]
- XiaoLong, L.; YiTao, L.; QingXi, L. Simulation of seed motion in seed feeding device with DEM-CFD coupling approach for rapeseed and wheat. Comput. Electron. Agric. 2016, 131, 29–39. [Google Scholar]
- Su, Z.; Li, Y.; Dong, Y.; Tang, Z.; Liang, Z. Simulation of rice threshing performance with concentric and non-concentric threshing gaps. Biosyst. Eng. 2020, 197, 270–284. [Google Scholar] [CrossRef]
- Horabik, J.; Parafiniuk, P.; Molenda, M. Stress profile in bulk of seeds in a shallow model silo as influenced by mobilisation of particle-particle and particle-wall friction: Experiments and DEM simulations. Powder Technol. 2018, 197, 270–284. [Google Scholar] [CrossRef]
- Fields, P.; Korunic, Z. The effect of grain moisture content and temperature on the efficacy of diatomaceous earths from different geographical locations against stored-product beetles. J. Stored Prod. Res. 2000, 36, 1–13. [Google Scholar] [CrossRef]
- Tarui, F.; Takeuchi, M.; Kubo, H. Investigations on Drying Method of High Moisture Paddy at Rice-Center. Jpn. J. Farm Work Res. 1969, 1969, 58–61. [Google Scholar] [CrossRef]
- Wang, J.W.; Han, T.; Wang, J.F.; Jiang, D.X.; Li, X. Measurement and analysis of restitution coefficient between maize seed and soil based on high-speed photography. Int. J. Agric. Biol. Eng. 2017, 10, 102–114. [Google Scholar] [CrossRef]
- Dong, M.; Mei, Y.; Li, X.; Shang, Y.; Li, S. Experimental measurement of the normal coefficient of restitution of micro-particles impacting on plate surface in different humidity. Powder Technol. 2018, 335, 250–257. [Google Scholar] [CrossRef]
- Sakai, N.; Yonekawa, S. Three-dimensional image analysis of the shape of soybean seed. J. Food Eng. 1992, 15, 221–234. [Google Scholar] [CrossRef]
- Giammanco, I.M.; Maiden, B.R.; Estes, H.E.; Brown-Giammanco, T.M. Using 3D laser scanning technology to create digital models of hailstones. Bull. Am. Meteorol. Soc. 2017, 98, 1341–1347. [Google Scholar] [CrossRef]
- Gu, D.; Chen, Y.; Dai, K.; Zhang, S.; Yuan, J. The shape of the acetabular cartilage surface: A geometric morphometric study using three-dimensional scanning. Med. Eng. Phys. 2008, 30, 1024–1031. [Google Scholar] [CrossRef]
- Zhou, H.; Chen, Y.; Sadek, M.A. Modelling of soil-seed contact using the Discrete Element Method (DEM). Biosyst. Eng. 2014, 121, 56–66. [Google Scholar] [CrossRef]
- DKADA, T. Studies on Green Panic Seed: II. Method for measuring the volume weight of a small amount of seed. J. Jpn. Soc. Grassl. Sci. 1978, 24, 137–141. [Google Scholar] [CrossRef]
- Wang, J.; Jiang, Y.; Tang, H.; Xu, C.; Wang, Z. Physical characteristics determination and principal components analysis of typical single cropping rice in cold areas of north China. Int. Agric. Eng. J. 2020, 9, 309. [Google Scholar]
- Yu, L.; Witt, T.; Rincon Bonilla, M.; Turner, M.S.; Fitzgerald, M.; Stokes, J.R. New insights into cooked rice quality by measuring modulus, adhesion and cohesion at the level of an individual rice grain. J. Food Eng. 2019, 240, 21–28. [Google Scholar] [CrossRef]
- Zeng, Y.; Jia, F.; Xiao, Y.; Han, Y.; Meng, X. Discrete element method modelling of impact breakage of ellipsoidal agglomerate. Powder Technol. 2019, 346, 57–69. [Google Scholar] [CrossRef]
- Zaimar; Mursalim; Abbas, H. Supratomo Analysis of impact velocity of rice grain on impeller speed variation in the centrifugal flow thresher by using CFD. ARPN J. Eng. Appl. Sci. 2019, 14, 962–966. [Google Scholar]
- Bautista, R.C.; Siebenmorgen, T.J.; Mauromoustakos, A. The role of rice individual kernel moisture content distributions at harvest on milling quality. Trans. ASABE 2009, 52, 1493–1504. [Google Scholar] [CrossRef] [Green Version]


| Varieties | Length | Width | Thickness | 1000 Grain Weight | ||||
|---|---|---|---|---|---|---|---|---|
| Mean Value/mm | Standard Deviation | Mean Value/mm | Standard Deviation | Mean Value/mm | Standard Deviation | Mean Value/g | Standard Deviation | |
| Longjing 29 | 5.86 | 0.16 | 2.10 | 0.08 | 1.86 | 0.07 | 26.2283 | 0.89 |
| Wuyoudao 4 | 6.20 | 0.09 | 2.33 | 0.04 | 2.14 | 0.06 | 26.8745 | 0.75 |
| Jijing 88 | 4.37 | 0.11 | 2.51 | 0.05 | 2.07 | 0.06 | 22.5530 | 0.60 |
| Shennong 9903 | 4.75 | 0.15 | 2.79 | 0.10 | 2.31 | 0.11 | 24.8729 | 0.67 |
| Equipment | Technical Parameter | Diagram | Application |
|---|---|---|---|
| DL91150 digital vernier caliper | Measuring range: 0–150 mm Measurement accuracy: ±0.03 mm Resolving power: 0.01 mm |  | Measurement of rice grain triaxial size |
| DZF6051 electric blast drying oven | Temp Accuracy: ±1 °C Studio size: (415 370 345) mm Heating rate: 30 min |  | Controlling the moisture content of rice grain after harvest |
| FA1004 electronic analytical balance | Range: 100 g Index value: 0.1 mg Outer box size: (500 310 450) mm |  | Measurement of rice grain weight before and after drying |
| PCO high-speed CMOS camera | Resolving power: 1296 1024 Spectral range: 290–110 nm ISO sensitivity: 1250–16,000 |  | Dynamic photography of the state of rice grain collision, easy to calculate the speed |
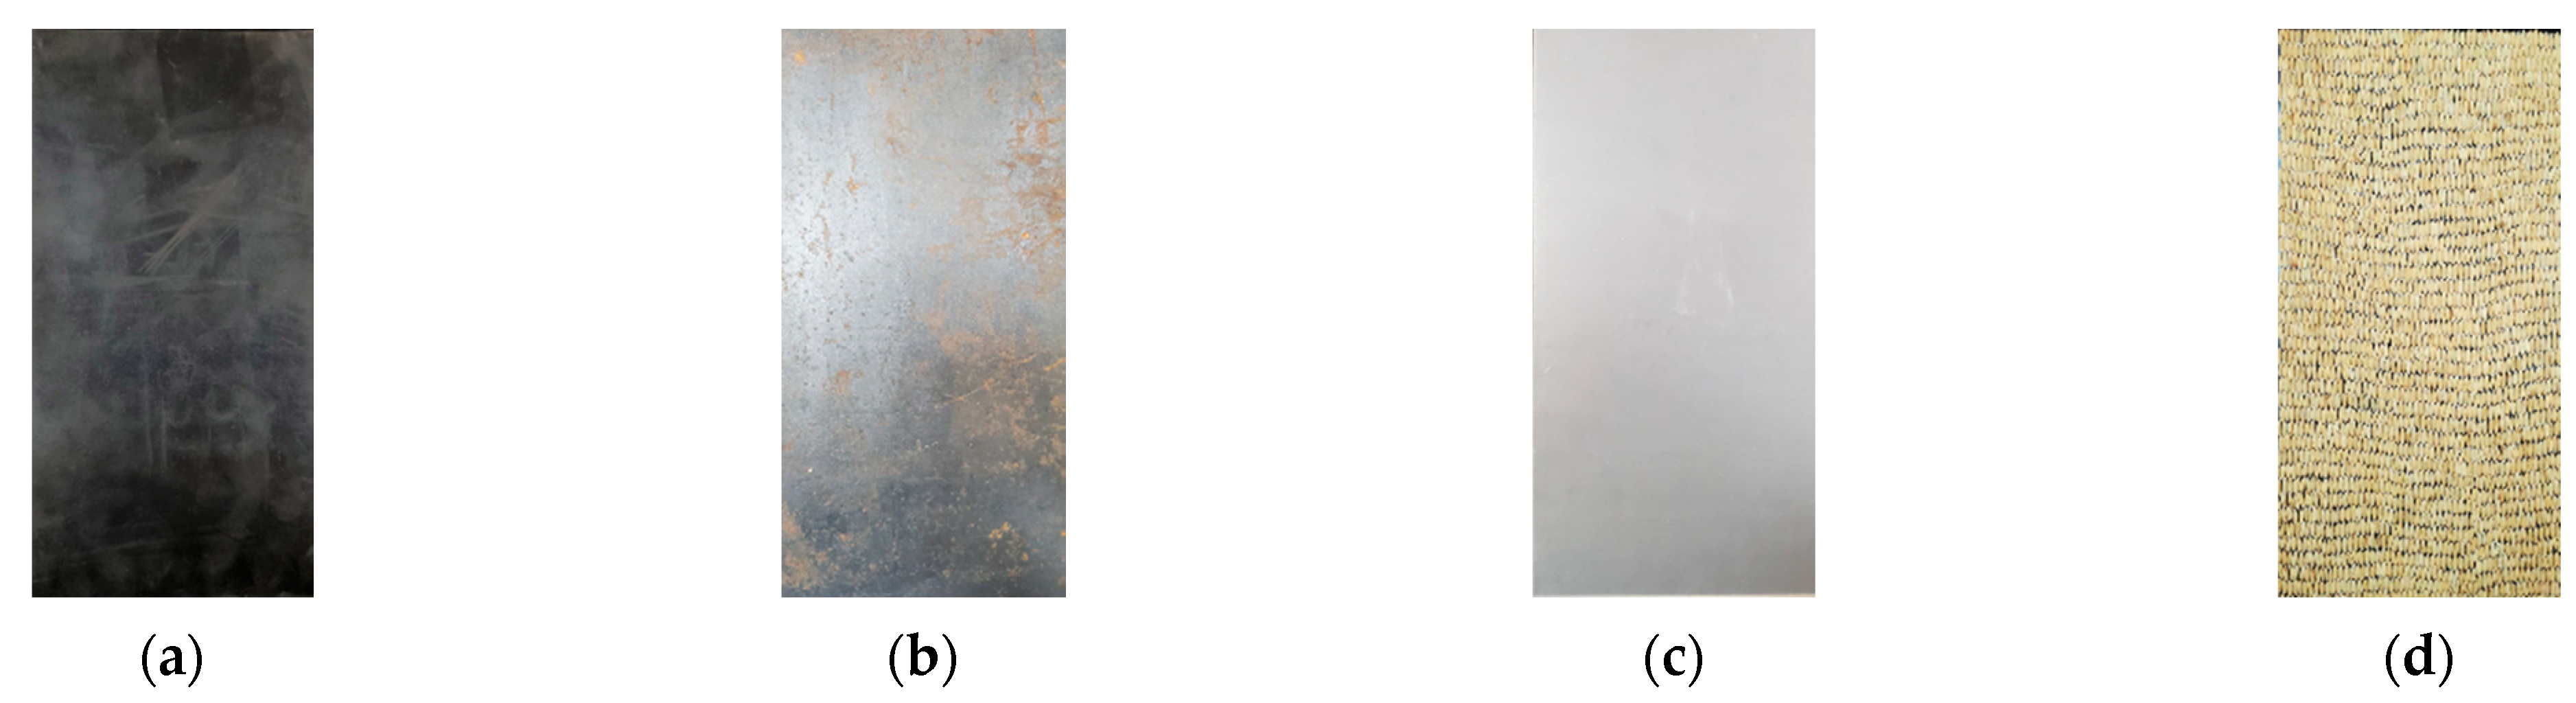
| Level | Contact Materials | Rice Varieties | Spring Compressions/mm | Moisture Contents/% |
|---|---|---|---|---|
| 1 | Rubber plate | Longjing 29 | 50 | 15.12 |
| 2 | Q235 steel plate | Wuyudao 4 | 100 | 18.05 |
| 3 | Plexiglass plate | Jijing 88 | 150 | 20.84 |
| 4 | Seed plate | Shennong 9903 | 200 | 23.90 |
| Order | Contact Materials(A) | Rice Varieties(B) | Spring Compressions(C)/mm | Moisture Contents(D)/% | Empty Column | Restitution Coefficient |
|---|---|---|---|---|---|---|
| 1 | 1 | 1 | 1 | 1 | 1 | 0.474 |
| 2 | 1 | 2 | 2 | 2 | 2 | 0.507 |
| 3 | 1 | 3 | 3 | 3 | 3 | 0.509 |
| 4 | 1 | 4 | 4 | 4 | 4 | 0.483 |
| 5 | 2 | 1 | 2 | 3 | 4 | 0.468 |
| 6 | 2 | 2 | 1 | 4 | 3 | 0.476 |
| 7 | 2 | 3 | 4 | 1 | 2 | 0.489 |
| 8 | 2 | 4 | 3 | 2 | 1 | 0.545 |
| 9 | 3 | 1 | 3 | 4 | 2 | 0.497 |
| 10 | 3 | 2 | 4 | 3 | 1 | 0.420 |
| 11 | 3 | 3 | 1 | 2 | 4 | 0.397 |
| 12 | 3 | 4 | 2 | 1 | 3 | 0.460 |
| 13 | 4 | 1 | 4 | 2 | 3 | 0.361 |
| 14 | 4 | 2 | 3 | 1 | 4 | 0.487 |
| 15 | 4 | 3 | 2 | 4 | 1 | 0.394 |
| 16 | 4 | 4 | 1 | 3 | 2 | 0.354 |
| K1 | 1.973 | 1.800 | 1.701 | 1.910 | 1.833 | |
| K2 | 1.978 | 1.890 | 1.829 | 1.810 | 1.847 | |
| K3 | 1.774 | 1.789 | 2.038 | 1.751 | 1.806 | |
| K4 | 1.596 | 1.842 | 1.753 | 1.850 | 1.835 | |
| k1 | 0.493 | 0.450 | 0.425 | 0.478 | 0.458 | |
| k2 | 0.495 | 0.473 | 0.457 | 0.453 | 0.462 | |
| k3 | 0.444 | 0.447 | 0.510 | 0.438 | 0.452 | |
| k4 | 0.399 | 0.461 | 0.438 | 0.463 | 0.459 | |
| R | 0.096 | 0.026 | 0.085 | 0.040 | 0.010 | |
| Factor arrangement | A > C > D > B | |||||
| Source of Variance | Derivate Square | Degree of Freedom | Mean of Derivate Square | F Value | p Value | Significance |
|---|---|---|---|---|---|---|
| Contact materials | 0.025000 | 3 | 0.008354 | 111.54 | 0.0014 | ** |
| Rice varieties | 0.001581 | 3 | 0.000527 | 7.04 | 0.0717 | |
| Spring compressions | 0.016000 | 3 | 0.005486 | 73.25 | 0.0026 | ** |
| Moisture contents | 0.003360 | 3 | 0.001120 | 14.95 | 0.0261 | * |
| Error | 0.000225 | 3 | 0.000075 | |||
| Sum | 0.047 | 15 |
| Parameter | Rice Grain | Plexiglass Plate |
|---|---|---|
| Density/(kg/m3) | 1095 | 1180 |
| Poisson’s ratio | 0.25 | 0.50 |
| Shear modulus/Pa | 1.81 108 | 1.77 108 |
| Static friction coefficient | 0.252 | |
| Rolling friction coefficient | 0.026 | |
| Restitution coefficient | 0.429 | |
Publisher’s Note: MDPI stays neutral with regard to jurisdictional claims in published maps and institutional affiliations. |
© 2021 by the authors. Licensee MDPI, Basel, Switzerland. This article is an open access article distributed under the terms and conditions of the Creative Commons Attribution (CC BY) license (https://creativecommons.org/licenses/by/4.0/).
Share and Cite
Wang, J.; Xu, C.; Xu, Y.; Wang, Z.; Qi, X.; Wang, J.; Zhou, W.; Tang, H.; Wang, Q. Influencing Factors Analysis and Simulation Calibration of Restitution Coefficient of Rice Grain. Appl. Sci. 2021, 11, 5884. https://doi.org/10.3390/app11135884
Wang J, Xu C, Xu Y, Wang Z, Qi X, Wang J, Zhou W, Tang H, Wang Q. Influencing Factors Analysis and Simulation Calibration of Restitution Coefficient of Rice Grain. Applied Sciences. 2021; 11(13):5884. https://doi.org/10.3390/app11135884
Chicago/Turabian StyleWang, Jinwu, Changsu Xu, Yanan Xu, Ziming Wang, Xin Qi, Jinfeng Wang, Wenqi Zhou, Han Tang, and Qi Wang. 2021. "Influencing Factors Analysis and Simulation Calibration of Restitution Coefficient of Rice Grain" Applied Sciences 11, no. 13: 5884. https://doi.org/10.3390/app11135884
APA StyleWang, J., Xu, C., Xu, Y., Wang, Z., Qi, X., Wang, J., Zhou, W., Tang, H., & Wang, Q. (2021). Influencing Factors Analysis and Simulation Calibration of Restitution Coefficient of Rice Grain. Applied Sciences, 11(13), 5884. https://doi.org/10.3390/app11135884