1. Introduction
As new types of codecs, transmission protocols, and application scenarios evolve, the importance of quality assessment methodologies for the different types of multimedia signals (including audio and video contents) increases. With the introduction of Quality of Experience (QoE) approaches, traditional methods based exclusively on Quality of Service (QoS) measurements are no longer the only way to measure the quality of a signal. In addition to QoS measurements, QoE approaches take into account characteristics of the Human Visual System (HVS) and the Human Auditory System (HAS). In the last decades, QoE approaches have been used to develop several objective quality metrics for digital videos and speech/audio signals [
1,
2,
3]. However, despite the achievements made in the area of visual quality [
4,
5,
6], several gaps remain open in the area of multimedia quality. As pointed out by Pinson et al. [
7], simultaneously measuring the quality of multimedia contents (e.g., video and audio) is still a pending issue.
Modelling human’s perception of audio and video signals individually is a challenging task. When the interaction between audio and video signals is considered, then the level of complexity increases. Part of the difficulty lies in the fact that the cognitive processing method used to interpret the interaction of audio and video stimulus is not yet completely understood [
6]. Therefore, understanding how humans perceive, process, and interpret different types of signals is key to develop an accurate audio-visual quality assessment model. To gain some knowledge in this direction, researchers have measured the audio-visual quality of video sequences by performing psychophysical tests with human participants (also known as perceptual or subjective experiments) [
8]. Such experiments can be used to provide a measure of the level of influence that certain (audio and video) distortions have on the audio-visual quality perceived by human users. This information is key in the process of testing and developing objective quality metrics, now more than before, since quality metrics based in Machine Learning (ML) techniques are highly dependent on annotated data for training and testing new models [
6,
9,
10,
11].
Psychophysical experiments are commonly carried out within a controlled environment (e.g., soundproof laboratories), where test stimuli (e.g., audio-visual sequences) is presented to a group of non-expert human participants (or experts depending on the application being studied). With the goal of generating reliable and reproducible results that represent quality as perceived by human users, several international agencies and research organizations have collected and published guidelines and recommendations on how to perform psychophysical experiments [
8,
12,
13,
14,
15]. Although these recommendations are widely adopted and applied in most perceptual studies, they often limit the representation of an authentic user experience, which is a requirement in multimedia applications. For this reason, researchers have created novel methods to deal with this matter. For example, an immersive methodology proposed by Pinson [
16] tried to recreate a more natural media consumption environment for a human consumer, thus, allowing to collect human responses that are more realistic and useful for a quality perception analysis.
Quality perception of audio-visual signals has been studied thought several perceptual experiments [
17,
18,
19,
20,
21]. Early experiments have identified the visual component as the dominant influence in the overall audio-visual quality; yet, it has been argued that this influence does not apply to all types of audio-visual applications. Studies have found the audio component as being very important in applications like video conference [
20]. Other studies have confirmed that audio and video interaction depends on human, technological, and contextual factors [
9]. In order to have a deeper understanding of this interaction, researchers have proposed new methods to subjectively assess audio-visual quality, more specifically, long-duration audio-visual stimuli [
22,
23]. However, there is a limited number of experiments that aim to study the overall audio-visual quality in video sequences. In the majority of these experiments, only the video component is processed and the audio component is left unimpaired [
24]. Among the few studies that have explored the overall audio-visual quality of sequences with distortions in both audio and video components, we can cite the works of Pinson [
19], Becerra [
25]. More recently, the study presented by Min et al. [
18] who conducted experiments in which the content had compression distortions in both audio and video components. Although their results confirmed the dominance of the video component on the overall quality, the audio component had a considerable impact on quality for some types of media content.
In summary, although several studies explored how users perceive audio-visual quality in common multimedia scenarios, most of these studies ignore the audio component and the effect of audio distortions on the overall audio-visual quality. Additionally, the complex interactions of audio and video components and the different factors influencing the perception of quality have not been properly studied. This work presents a compilation of the results from three psychophysical experiments where participants assessed the overall quality of a diverse set of audio-visual sequences. All three experiments used the immersive methodology, including audio and video impairments. In Experiment 1, artifacts were added to the visual component, while the audio component remained as is. In Experiment 2, the visual component was kept untouched while artifacts were added to the audio component. Finally, in Experiment 3, both video and audio components were impaired by audio and visual artifacts. This paper performs a detailed analysis of the experiments and compares their results, binding conclusions and insights among all three experimental scenarios. Our main goal is to present a wider picture of the audio-visual quality of video sequences and attempt to drive global conclusions.
The remainder of this document is divided as follows. In
Section 2, a summary of some relevant multimedia perceptual experiments is presented. In
Section 3, a description of the rationale behind the study and the experimental design is presented. In
Section 4, visual and audio degradations are presented. In
Section 5, experimental details are described. In
Section 6,
Section 7 and
Section 8, all three experiments are described and their corresponding results are presented.
Section 9 presents a comparison and a general discussion on the results from all three experiments. Finally, the overall conclusions of the study are presented in
Section 10.
2. Previous Work on Perceptual Quality Assessment
As commented before, perceptual experiments help researchers comprehend how different artifacts affect the perceived quality of media content such as audio, video and audio-visual. The studies listed in this section are presented in
Table 1. For visual content, the quality impact of packet-loss, bitrate compression and frame-freezing have been studied throughout a range of perceptual experiments. For example, the effects of frame-freezing and packet-loss over full-length movie clips were reported in a perceptual experiment conducted by Staelens et al. [
26]. The experiment collected the responses from 56 non-expert viewers for 80 DVD clips in a home viewing environment. The study concluded that participants were more tolerant towards frame-freezing errors, possibly due to the length of the stimuli and the viewing conditions. In another study, Moorthy et al. [
27] included a range of impairments such as video compression, frame-freezing, wireless-channel packet-loss and rate adaptation over a mobile-platform setup. A video-only dataset (with a range of content material) was presented to 30 participants during the experiment. The results concluded that viewers were more tolerant to few longer stalling events than several shorter ones. However, these results varied according to the type of content being displayed. A recent study explored the impact of video quality using several video encoding parameters like bitrate, frame-rate and video resolution in multiparty telemeetings. Perceptual results showed that participants’ detection of some visual distortions was influenced by how active they were during the calls. The study indicates that, for this particular scenario, ensuring enough resources to active participants and prioritizing the audio quality are key to the overall audio-visual quality [
28].
For audio content, a range of studies has focused on investigating the perceived quality effect of acoustic background noise [
34,
35]. In the study presented by Wendt et al. [
29], speech intelligibility was compared across different levels of background noise and syntactic structure complexity. Results suggested that intelligibility was more affected by background noise than syntactic complexity. In another study, Harte et al. [
30] explored the effects of several voice over IP (VoIP) distortions. The dataset included speech samples impaired with background noise, competing speaker effects, clipping, echo, and chopped speech, all added in isolation. The authors reported that echo and background noise had a heavier impact on the quality perceived by participants. A recent study presented by Schwind et al. [
31] investigated the stalling effect over music streaming. The authors state that music streaming consumption differs from a video streaming scenario since music is usually played in the background. In this study, the authors explored the perceived quality of users while they are performing other tasks. For speech enhancement, researchers have exploited the visual information available (e.g., lip movement, facial expression) to achieve stronger performance. Some relevant audio-visual speech datasets are listed in [
36,
37,
38].
In terms of audio-visual quality, a number of studies have explored the audio and video interactions and their corresponding contribution to the perceived overall quality. Some of these studies showed that, for certain types of content, the video component has a stronger influence on the audio-visual quality. In contrast, the study presented in [
20] reported that for certain communication scenarios (e.g., teleconference calls), the audio component plays a more important role in the overall perceived quality. In general, results in the literature show that the influence of the video and audio components on the perceived quality is related to several context factors (nature of experience, e.g., teleconference, sports events, movies, etc.). In addition, human and technological factors are also determinant to model the human perceived quality [
39]. Aiming to study these factors and their influence, researchers have explored different experimental methodologies, new and diverse media content, and new types of distortions. For example, Staelens et al. [
22] and Borowiak et al. [
23] have tried to capture the participants’ attention by using long-duration audio-visual stimuli. Both studies applied alternative methodologies to collect human responses.
Becerra et al. [
25] conducted a group of experiments to study the impact of heavy audio and video compression artifacts on quality. Similarly, Pinson et al. [
19] performed a study where ten different laboratories ran perceptual experiments, which consisted of presenting sequences with compressed audio and video components, considering different environments and devices. More recently, a study presented by Min et al. [
18] conducted an audio-visual perceptual experiment introducing distortions caused by audio and video compression and video compression combined with video scaling. Despite their setup differences, all these three studies agreed on the influence of audio on the perceived audio-visual quality. However, a more specific perceptual study presented by Rodrigues et al. [
32] explored the trade-off between audio and video quality over live music streaming sequences. The study applied distortions caused by audio and video compression for a mobile network environment. The study concluded that, for this particular case study, reducing the audio bitrate didn’t affect the overall audio-visual quality and, the video bitrate reduction had a great impact on the perceived audio-visual quality. In another study, Demirbilek et al. [
33] tried to reproduce a real-time communication scenario and performed a study that included variations of compression and network parameters, including video frame rates, quantization parameters, packet-loss rates (audio and video), noise filters, and compression bitrates (audio and video). Results showed that packet-loss errors (for audio and video) had a greater impact on the perceived audio-visual quality than other types of parameters.
Certainly, there is a need to fully understand the audio-visual quality perception process. The complex interactions between audio and video pose a challenge and demand new methods to conduct perceptual experiments. The Immersive Methodology has shown promising results and offers a reliable method to deal with non-traditional experimental scenarios (e.g., long-duration stimuli, numerous test conditions, and diverse content). In the following Section, the motivation behind this study and the experimental settings are presented.
3. Motivation
As commented before, the complexity of assessing audio-visual quality lies, among other factors, in the little understanding there is on how the auditory and visual stimuli are perceived, and also at what stage, and how, the human perceptual system integrates them. This reflects the gaps between neurophysiology and computer science in terms of quality assessment. Undoubtedly, there is still a great demand for studies that investigate the complexity involving the integration of multimodal stimuli, as stated by Akhtar and Falk in a recent survey [
6]. Unfortunately, many studies that assess the audio-visual quality consider impairments only in the video component and leave the audio unimpaired, i.e.; subjects are presented with audio-visual content but with no distortion in the audio component. As for the ones that do include audio distortions, they are usually limited to weak distortions caused by audio compression.
Table 2 presents a summary of some of the most important audio-visual databases and their corresponding perceptual experiments. As it can be observed, most of the available audio-visual material is limited in terms of audio distortion. These conditions make it difficult reaching to more significant conclusions in terms of visual and auditory stimuli integration.
In this study, we aim to use a wider collection of audio and video distortions, which are not commonly included in the available audio-visual databases. Such distortions were selected by the researchers based on previous studies from the literature and a particular interest in studying some specific types of distortions. Three types of visual distortions were selected: video coding, packet loss, and frame freezing. As for the audio component, four types of distortions were selected: background noise, clipping, echo, and chop. For each type of distortion, different levels of degradation were selected by audio and video experts using empirical criteria. This consisted of examining the audio and video sequences and choosing very clear quality levels, which will then be considered as the experimental test conditions of the study.
It is understood that the combination of some of these audio and video distortions, and the test conditions considered, do not necessarily appear in a real transmission scenario. Therefore, it is important to state that the purpose of using these distortions, and combining them in a perceptual experiment, is to investigate how human participants perceive them and at what level the audio and visual distortions influence their perception of the audio-visual quality. Then, recreating a particular application scenario is out of the scope of this study. It is expected that using diverse audio and video distortions and making available the annotated material will contribute to the study of multimodal quality perception, which is commonly restricted to a single type of audio distortion (i.e., audio compression). Based on these findings, more specific studies can be performed considering a particular use-case scenario, which will include specific types of degradation and content material.
4. Video and Audio Distortions
We used a large set of source sequences for this set of experiments and processed them, introducing video and audio distortions. The selected distortions were based on previous studies that analyzed audio and video distortions. For each type of degradation, we generated a number of distortion levels, which were used to establish the Hypothetical Reference Circuits (HRCs) for each perceptual experiment. This section describes the different types of degradations, detailing the procedure used to treat the source contents and generate the Processed Video Sequences (PVS).
4.1. Video Degradations
The video component of the source sequences was subject to three types of distortions: video coding, packet-loss, and frame-freezing. These types of degradations were applied to source sequences in Experiments 1 and 3 [
48,
49]. The processing algorithms used to generate the PVSs are described below.
4.1.1. Coding Artifacts (Compression)
The Advance Video Coding (AVC) H.264/ MPEG-4 and the High Efficiency Video Coding (HEVC) H.265 [
50,
51] standards were selected to compress the source stimuli. Throughout a visual examination, researchers selected four bitrate values for each coding standard and they labelled it as Low, Medium, High, and Very High quality. The sample sequences used for this analysis were not included in the main experiment. The selection was made by taking into account bitrate values used in previous works and picking four clear quality levels [
52,
53].
Table 3 presents the bitrate values used for each codec.
4.1.2. Packet-Loss
As a first step, video bit-streams for the corresponding H.264 and H.265 coding standards were generated. To simulate a packet-loss effect, packets from the Network Abstraction Layer (NAL) were discarded from the video bit-stream using the NALTools software, as done in similar studies [
54]. The packet-loss ratios used for this study were: 1%, 3%, 5%, 8%, and 10%. Although these values were taken from a real transmission scenario found in video streaming applications [
55,
56], recreating a particular use case scenario was not the main intention. These packet-loss ratios served to define five clear quality levels that could be distinguished by participants.
4.1.3. Frame-Freezing
For this study, a frame freezing without skipping was selected; that is, pauses of the video did not discard any of the incoming frames. To recreate a frame freezing event, the following parameters were considered: (a) number of events, (b) position in the sequence, and (c) length of the event. For each sequence, a maximum of three freezing events was inserted. These events were inserted at the “start”, “middle”, and “end” of the sequence. As for the length of the events, they were set to 1, 2, and 4 s.
Five levels of discomfort were established from the combination of these three parameters (number, position, and length of the events). The levels were labelled as “S1”, “S2”, “S3”, “S4”, and “S5”, scaling from a low annoyance effect (S1) to a high annoyance effect (S5).
Table 4 presents the parameter combination for these five annoyance levels.
It is important to mention that, since frame-freezing is only present in video services (Video-on-Demand or YouTube) based on reliable transport mechanisms (e.g., Transmission Control Protocol—TCP), a user of these services does not experience packet-loss distortions, which are common in services based in non-reliable transport mechanisms, such as User Datagram Protocol (UDP). Therefore, since frame-freezing and packet-loss degradations do not appear in the same types of scenarios, in our experiments, they were not inserted simultaneously into a single video sequence.
4.2. Audio Degradations
For this study, the audio component of the source sequences was impaired with four audio degradations: background noise, clipping, echo, and chop. The TCD-VoIP dataset [
30] was used as a reference to reproduce this set of distortions. As stated in [
30], these four audio degradations are platform-independent, i.e., they are not attached to a particular codec, network or hardware. As commented before, these distortions were selected with the purpose of studying their impact on the audio-visual quality independently of a particular use case scenario.
4.2.1. Background Noise
For background noise distortion, two parameters were considered to generate different test conditions: the type of noise (babble, car, road, and office) and the SNR level associated with the noise (5, 10, 15 dBs). Combining these parameters resulted in four test conditions (
Table 5).
4.2.2. Clipping
The clipping effect was generated by multiplying the audio signal by four different amplitude multipliers (11, 15, 25, 55). As a result, four different test conditions were generated for this audio distortion (
Table 5). The reference values used as amplitude multiplier were taken from the TCD-VoIP dataset [
30].
4.2.3. Echo
To recreate an echo effect, delayed samples were added to the original audio sample. Four test conditions (
Table 5) were obtained by varying three parameters: (a) amplitude percentage of the delayed sample, (b) time delay between the original and the delayed sample, and (c) percentage reduction of the delayed samples.
4.2.4. Chop
A choppy speech effect was generated by discarding samples from an audio signal. Four test conditions (
Table 5) were obtained by varying three parameters: (a) length of discarded samples, (b) sample discard frequency and (c) discarded samples treatment.
The audio and video degradations and their corresponding test conditions described in this section were used as the basis to build three audio-visual sub-sets, which compounds the UnB-AV dataset [
47]. Each sub-set was used in a different experiment which will be described in the following sections.
5. Immersive Audio-Visual Experiments
As mentioned earlier, in this work, we performed three different perceptual experiments. All three experiments used the immersive experimental methodology described by Pinson et al. [
16]. With the goal of capturing the real media-consumption experience, this methodology proposes an experimental environment that is supposed to be as natural as possible. The main goal of this methodology is to encourage the subject’s engagement with the test content. All experiments used three main aspects of the immersive methodology:
In addition, the immersive methodology poses a specific setup to generate the test stimuli for the experiment. One recommendation is to set the number of stimuli sources (w) in the experiment as an integer multiple of the number of HRCs (y). The combination of each source stimuli and HRC produce a total of () test stimuli. Then, each participant in the experiment rates () test stimuli for each HRC under study. It is expected that, when all participant’s responses are pooled, () participants have rated each individual test stimuli, where n is the number of human participants.
In this section, we describe the source stimuli, apparatus and physical conditions, experimental procedure, and statistical methods used in the conduction of this set of experiments.
5.1. Source Stimuli
The UnB-AV dataset [
47] was used for this study (this dataset is available for download from the site of the University of Brasília at
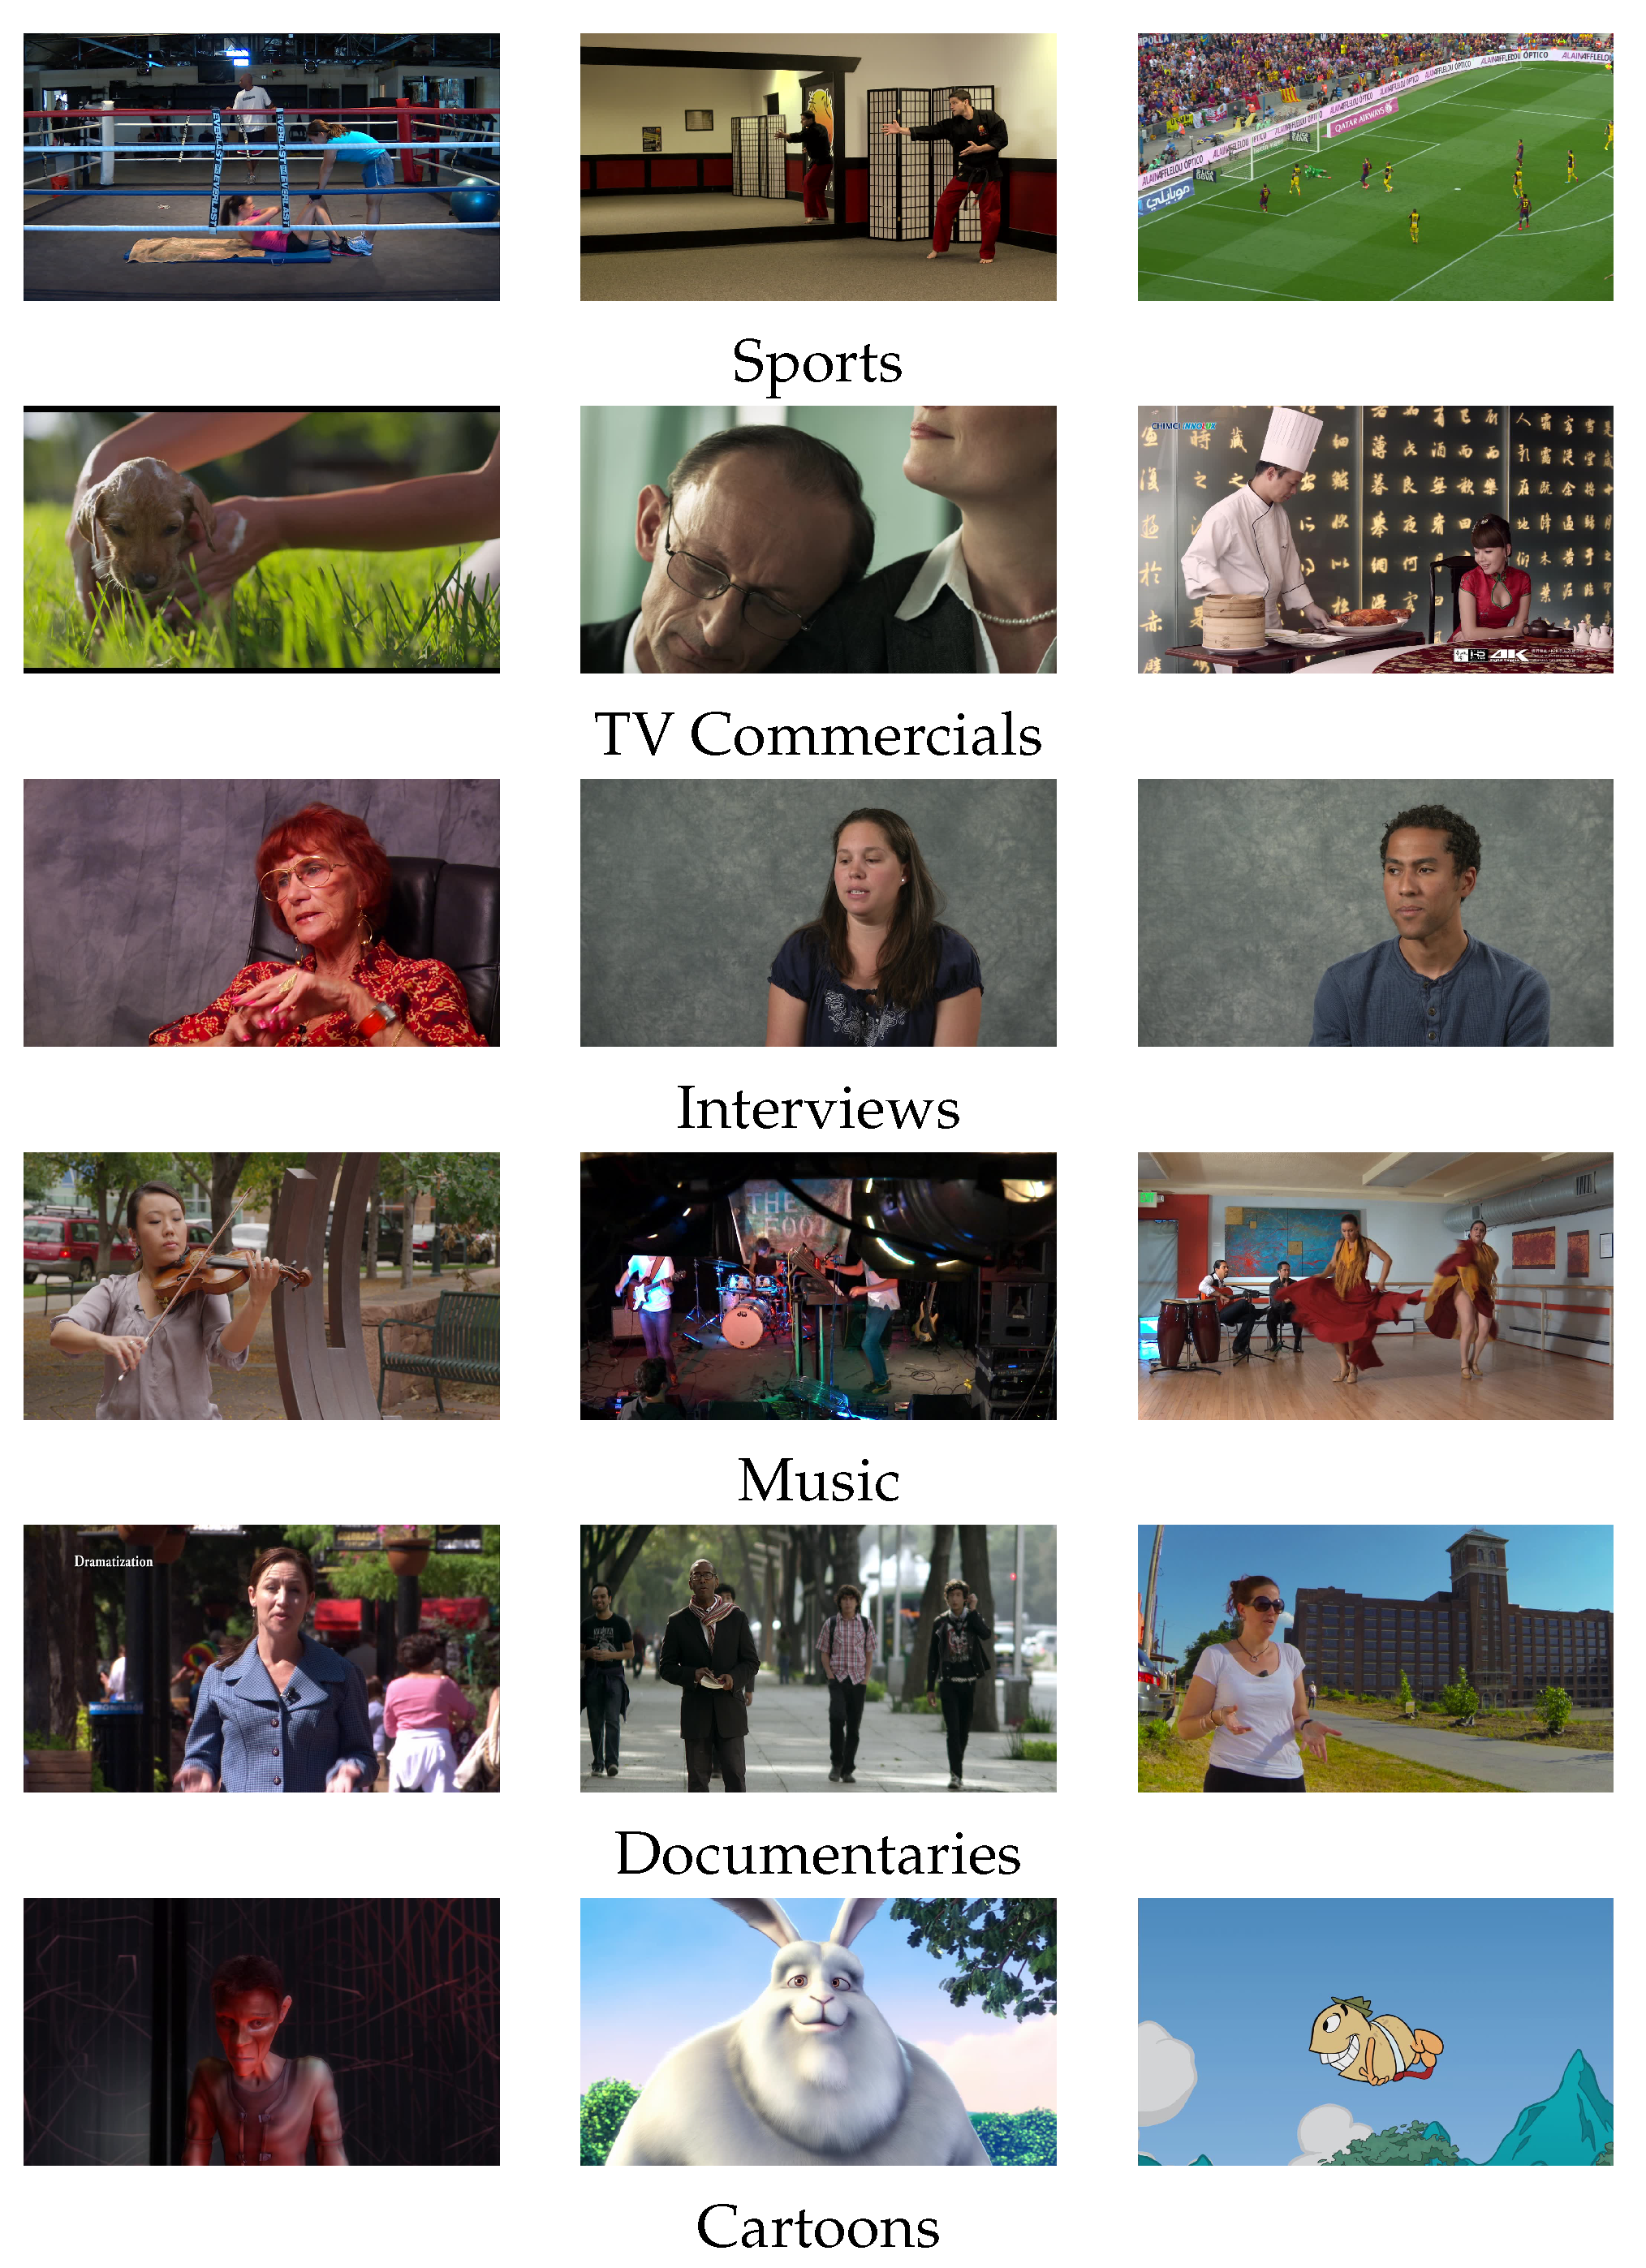
www.ene.unb.br/mylene/databases.html, accessed on 22 June 2021). This dataset contains one-hundred and forty (140) video clips (with accompanying audio) distributed in three sub-sets and used in three different perceptual experiments: Experiment 1 (60 sequences), Experiment 2 (40 sequences) and Experiment 3 (40 sequences). Pristine versions of these video clips were pre-processed to standardize some video and audio characteristics. For the video component, the spatial and temporal resolutions were set to 1280 × 720 (720p) and 30 frames per second (fps), plus the color space configuration was set to 4:2:0. As for the audio component, the sampling frequency and bit-depth were fixed to 48 kHz and 16 bits, respectively. Note that all videos considered for the study had characteristics equal or above the ones set in this pre-processing phase. Video clips were 19 to 68 s long, with an average duration of 36 s. Sample frames of 18 video clips grouped by content genres are presented in
Figure 1. Content material was selected based on the recommendations found in [
16] and the Final Report on the validation of objective models multimedia quality assessment (phase 1) of the Video Quality Experts Group (VQEG) [
57]. A scatter-plot showing the distribution of the spatial and temporal information, defined by Ostaszewska and Kloda [
58], for all video clips is presented in
Figure 2.
5.2. Apparatus and Physical Conditions
A recording studio from the Núcleo Multimedia e Internet (NMI) of the Department of Engineering (ENE) of the University of Brasília (UnB) was used to conduct the perceptual experiments. This type of facility guaranteed sound isolation during each experimental session, in which only one participant was admitted. All participants were assigned the same workstation (
Table 6). Lighting and viewing conditions were set following the recommendations in ITU-T BT.500.1 [
8,
59].
A quality assessment web-based platform, developed by the Grupo de Processamento Digital de Sinais (GPDS), was used for displaying the test clips and collecting the responses from participants. The experiments were carried out with volunteers (mostly graduate students) from the Electrical Engineering and Computer Science Departments from the University of Brasília. No particular expertise was needed in terms of digital video and audio defects. Although no vision or hearing tests were requested from participants, unimpaired hearing was a pre-requirement. In addition, any participant that wears glasses or contact lenses to watch TV was asked to use them for the experimental session. Details about the participants’ genders and ages are presented in
Table 6.
5.3. Experimental Procedure
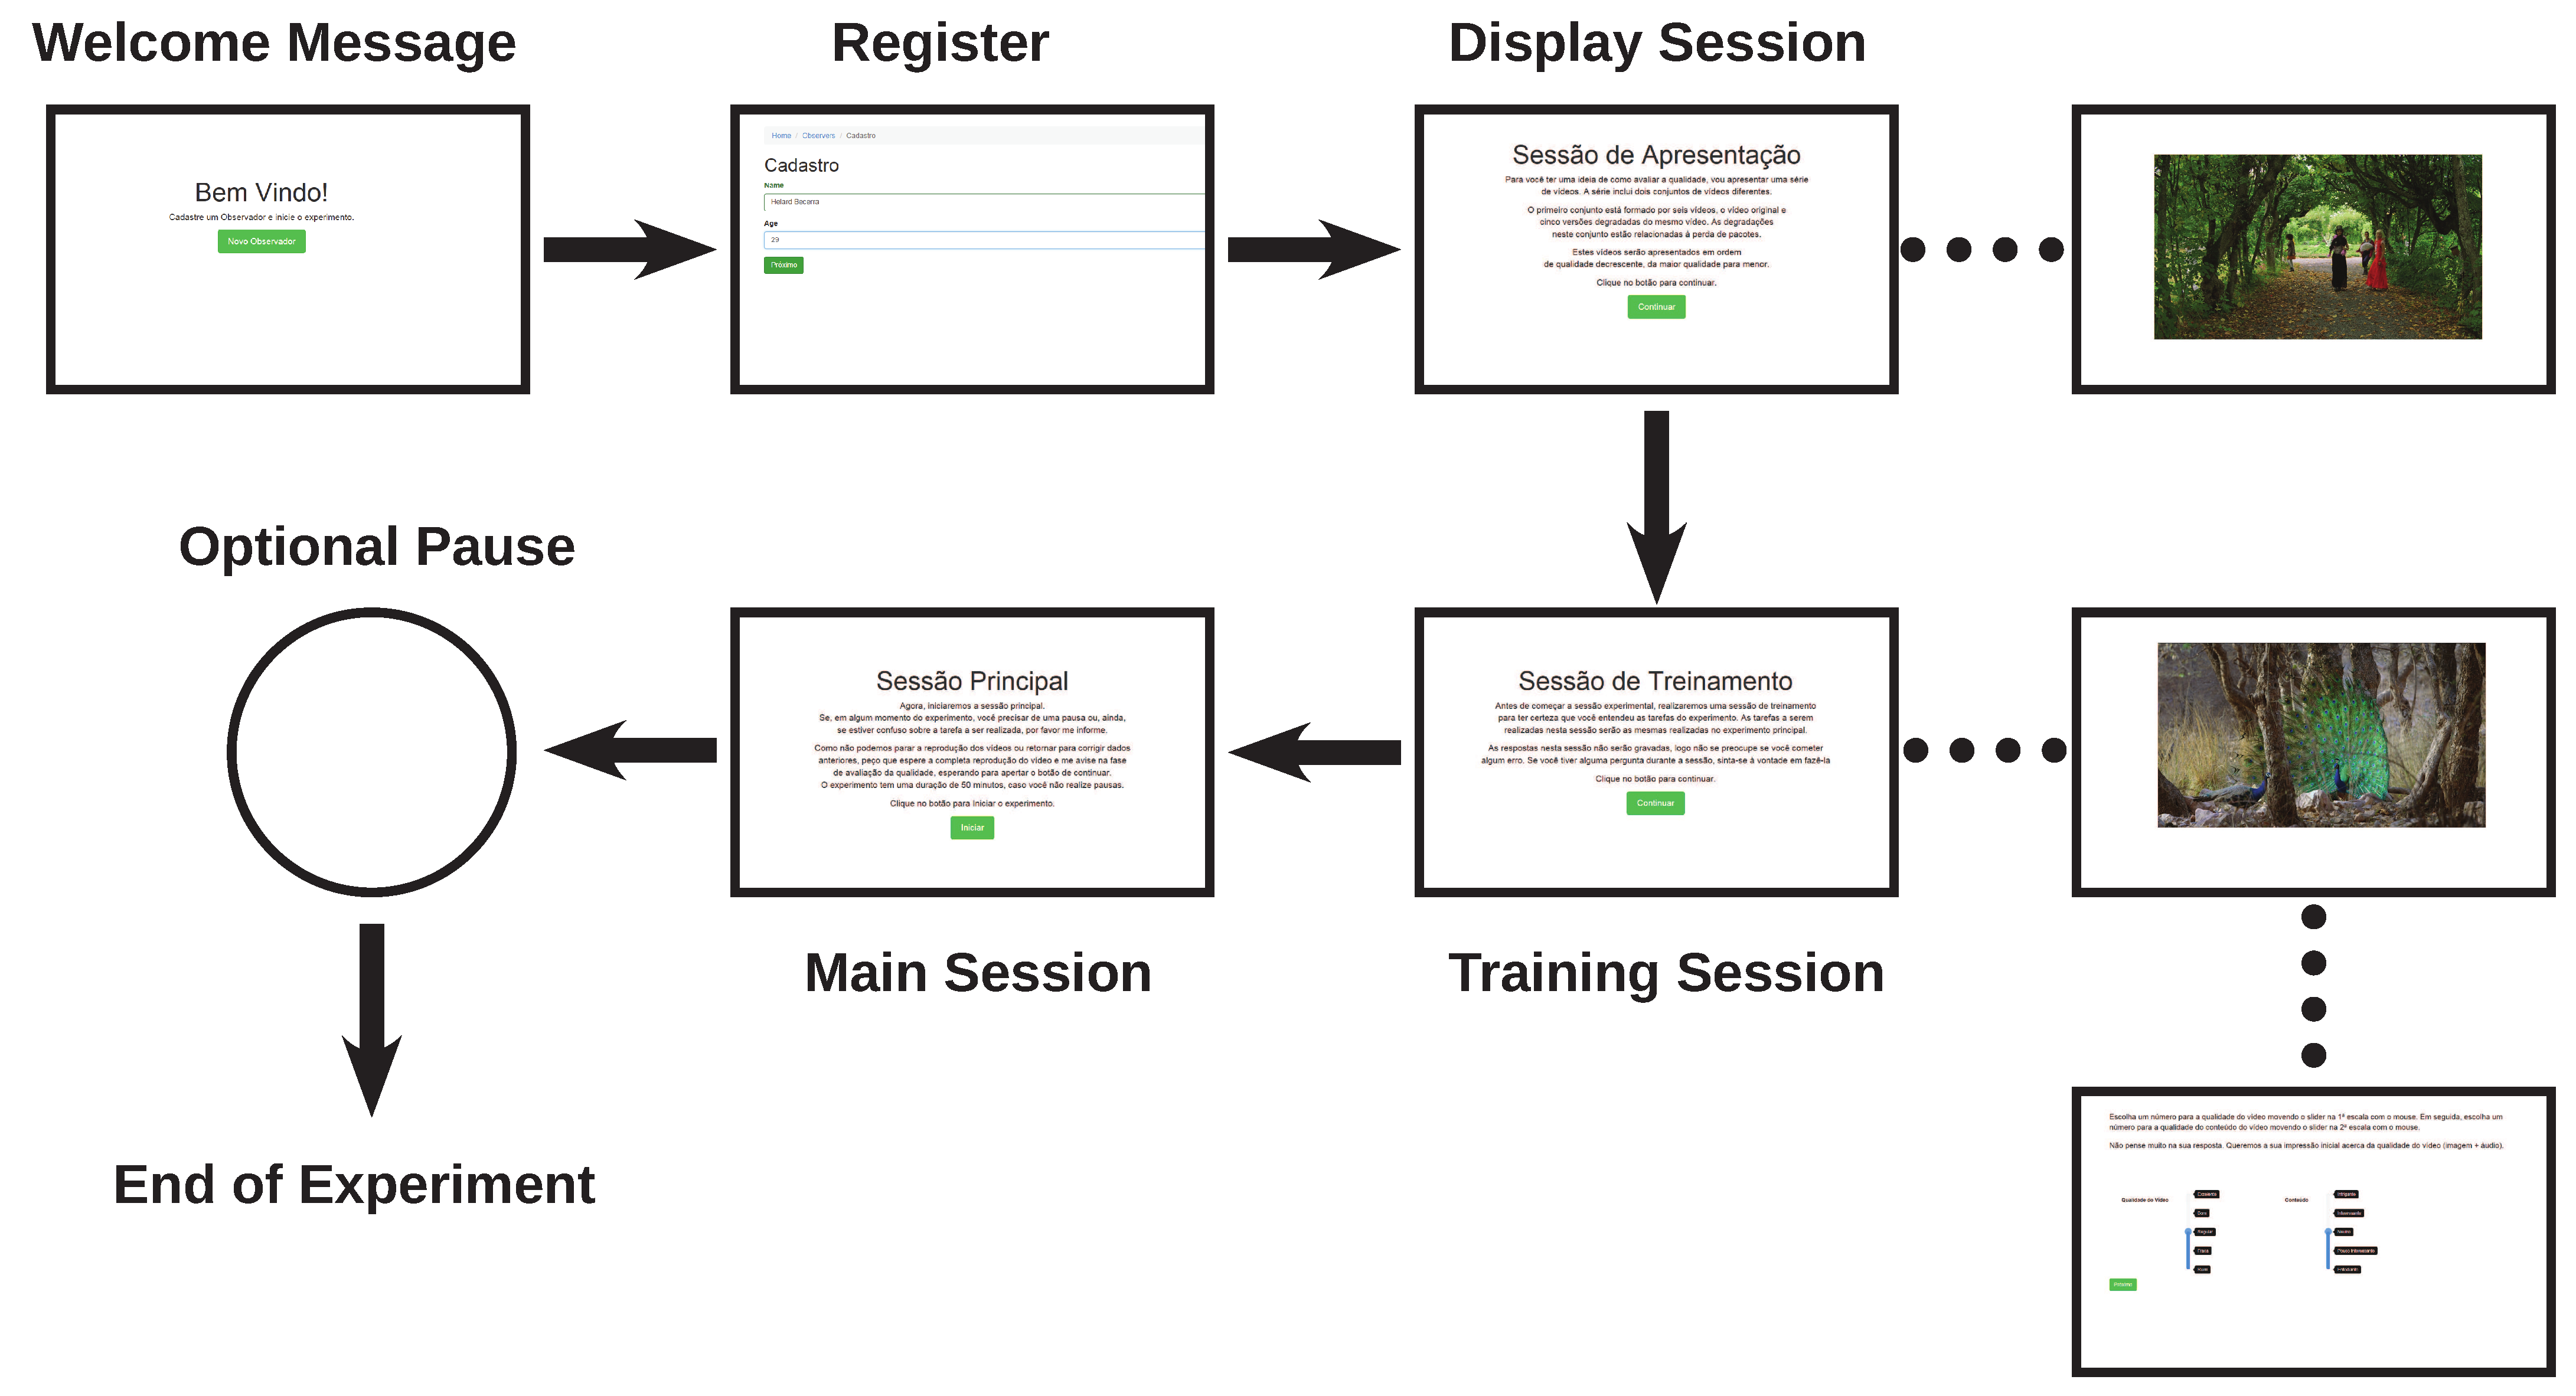
Overall, an entire experimental session was divided into three sub-sessions: Display Session, Training Session, and Main Session.
Figure 3 presents an illustration of the sub-sessions used during all three perceptual experiments, which are described next. The same procedure was used in all three experiments.
Display Session
In this session, participants observed a set of original video clips and their distorted versions (processed video sequences—PVS). The session had the objective of familiarizing the participants with the quality range of the sequences in the experimental session. In this session, an original source stimuli sequence and a corresponding PVS were presented to the participant. This procedure was repeated for each HRC of all experiments. Once the display session was over, the experimenter asked the participant if he/she have perceived the differences between the sequences.
Training Session
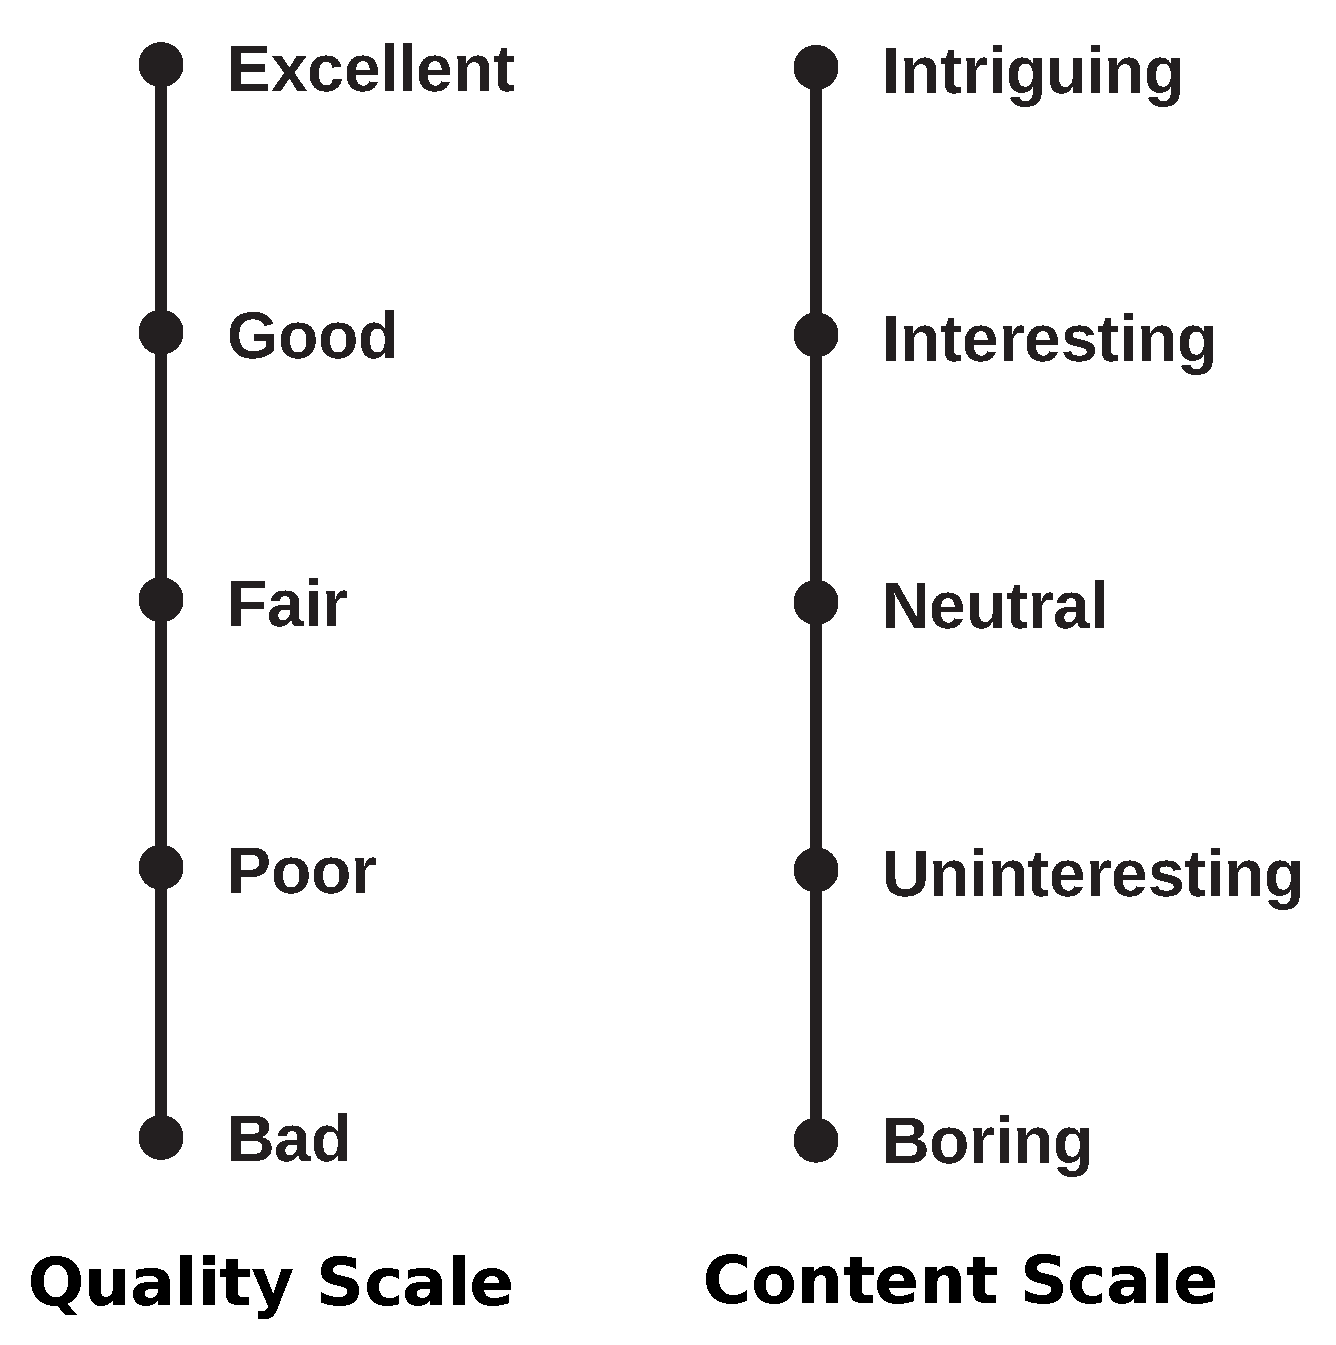
In the training session, the participant performed a demonstration run of the main session. For this session, the objective is to train subjects on how to insert their responses using the quality assessment interface. After each test stimuli was presented, participants were asked to rate the overall audio-visual quality using a five-point Absolute Category Rating (ACR) scale, ranging from 1 to 5. The quality scale was labelled (in Portuguese) as “Excellent”, “Good”, “Fair”, “Poor”, and “Bad” (
Figure 4). A second question is related to the personal opinion of the participant regarding the video clip content. A second five-point ACR scale is presented to the participant with the following labels: “Intriguing”, “Interesting”, “Neutral”, “Uninteresting”, and “Boring” (
Figure 4). The labels for the second scale were inspired by the speech experiment reported in [
16].
Main Session
In this session, the actual experimental task was executed. A number of video clips from the entire stimuli pool were presented to the participants in a randomised fashion. No repeated content was allowed; that is, no two videos had the same (source) content. In each session, participants assessed five PVSs corresponding to each HRC, with each PVS being rated by approximately five participants. To avoid fatigue, a break was introduced in the middle of the experiment. Overall, the entire experimental session lasted, on average, 50 min.
5.4. Statistical Analysis Methods
The scores given by human participants to any test stimuli are called perceptual scores. The perceptual scores from all participants are averaged for each PVS, resulting in a mean opinion score (MOS). For the three experiments, quality and content scores associated with each PVS were gathered. The scores were averaged according to the type of HRC.
The quality scores were processed to generate the Mean Quality Score (MQS) per-HRC, given by:
where
is the score given by the
ith subject for the
jth element of the set of
m HRCs and
n is the total number of subjects. In other words,
gives the average quality score for the
j-th HRC, measured across all subjects and content originals.
Similarly, the Mean Content Score (MCS) per-HRC is obtained by taking the average of the content scores given by all subjects:
where
is the content score given by the
i-th subject to the
j-th HRC test sequence, with
.
6. Perceptual Experiment 1 (Video-Only)
In this first experiment, volunteers were presented with a set of audio-visual video clips, and they were asked to rate them based on their perceived quality and content. Three types of distortions were added to these video clips: compression distortions generated by coding the videos at different bitrate levels (and codec algorithms), packet losses transmission distortions generated by deleting video bitstream packets, and frame-freezing transmission distortions generated by deleting and repeating frames. Distortions affected only the video component; meanwhile, the audio component remained untouched. The experiment focused on analysing the impact of visual distortions on the perceived audio-visual quality.
Sixty (60) source stimuli (out of the 140 stimuli pool described in
Section 5) were considered for the experiment. Their video components were processed, generating PVSs with different types of visual impairments. The PVSs were organized in a group of ten (10) different HRCs, as described in
Table 7, with no HRC having simultaneously packet-loss and frame-freezing distortions. For this reason, two test scenarios were considered for Experiment 1: a coding-packetloss scenario (HRC1 to HRC5) and a coding-freezing scenario (HRC6 to HRC10). In order to help participants recognize the range of quality in the experiment, two anchor (ANC) conditions were included. These ANCs corresponded to video clips compressed at extremely high bitrate levels, with no packet-loss or frame freezing distortions. These twelve (12) test conditions (10 HRCs plus 2 ANCs) were replicated for all sixty (60) source stimuli, resulting in seven hundred and twenty (720) test stimuli. As mentioned before, for each experimental session, participants saw the content corresponding to each original sequence only once. That is, each participant was presented with only 60 test stimuli, out of the 720 available, all corresponding to different source contents. These 720 sequences compound the first part of the UnB-AV dataset [
47]. The sub-set is labelled as UnB-AV-Experiment-1, and it is available for download along with the entire UnB-AV dataset.
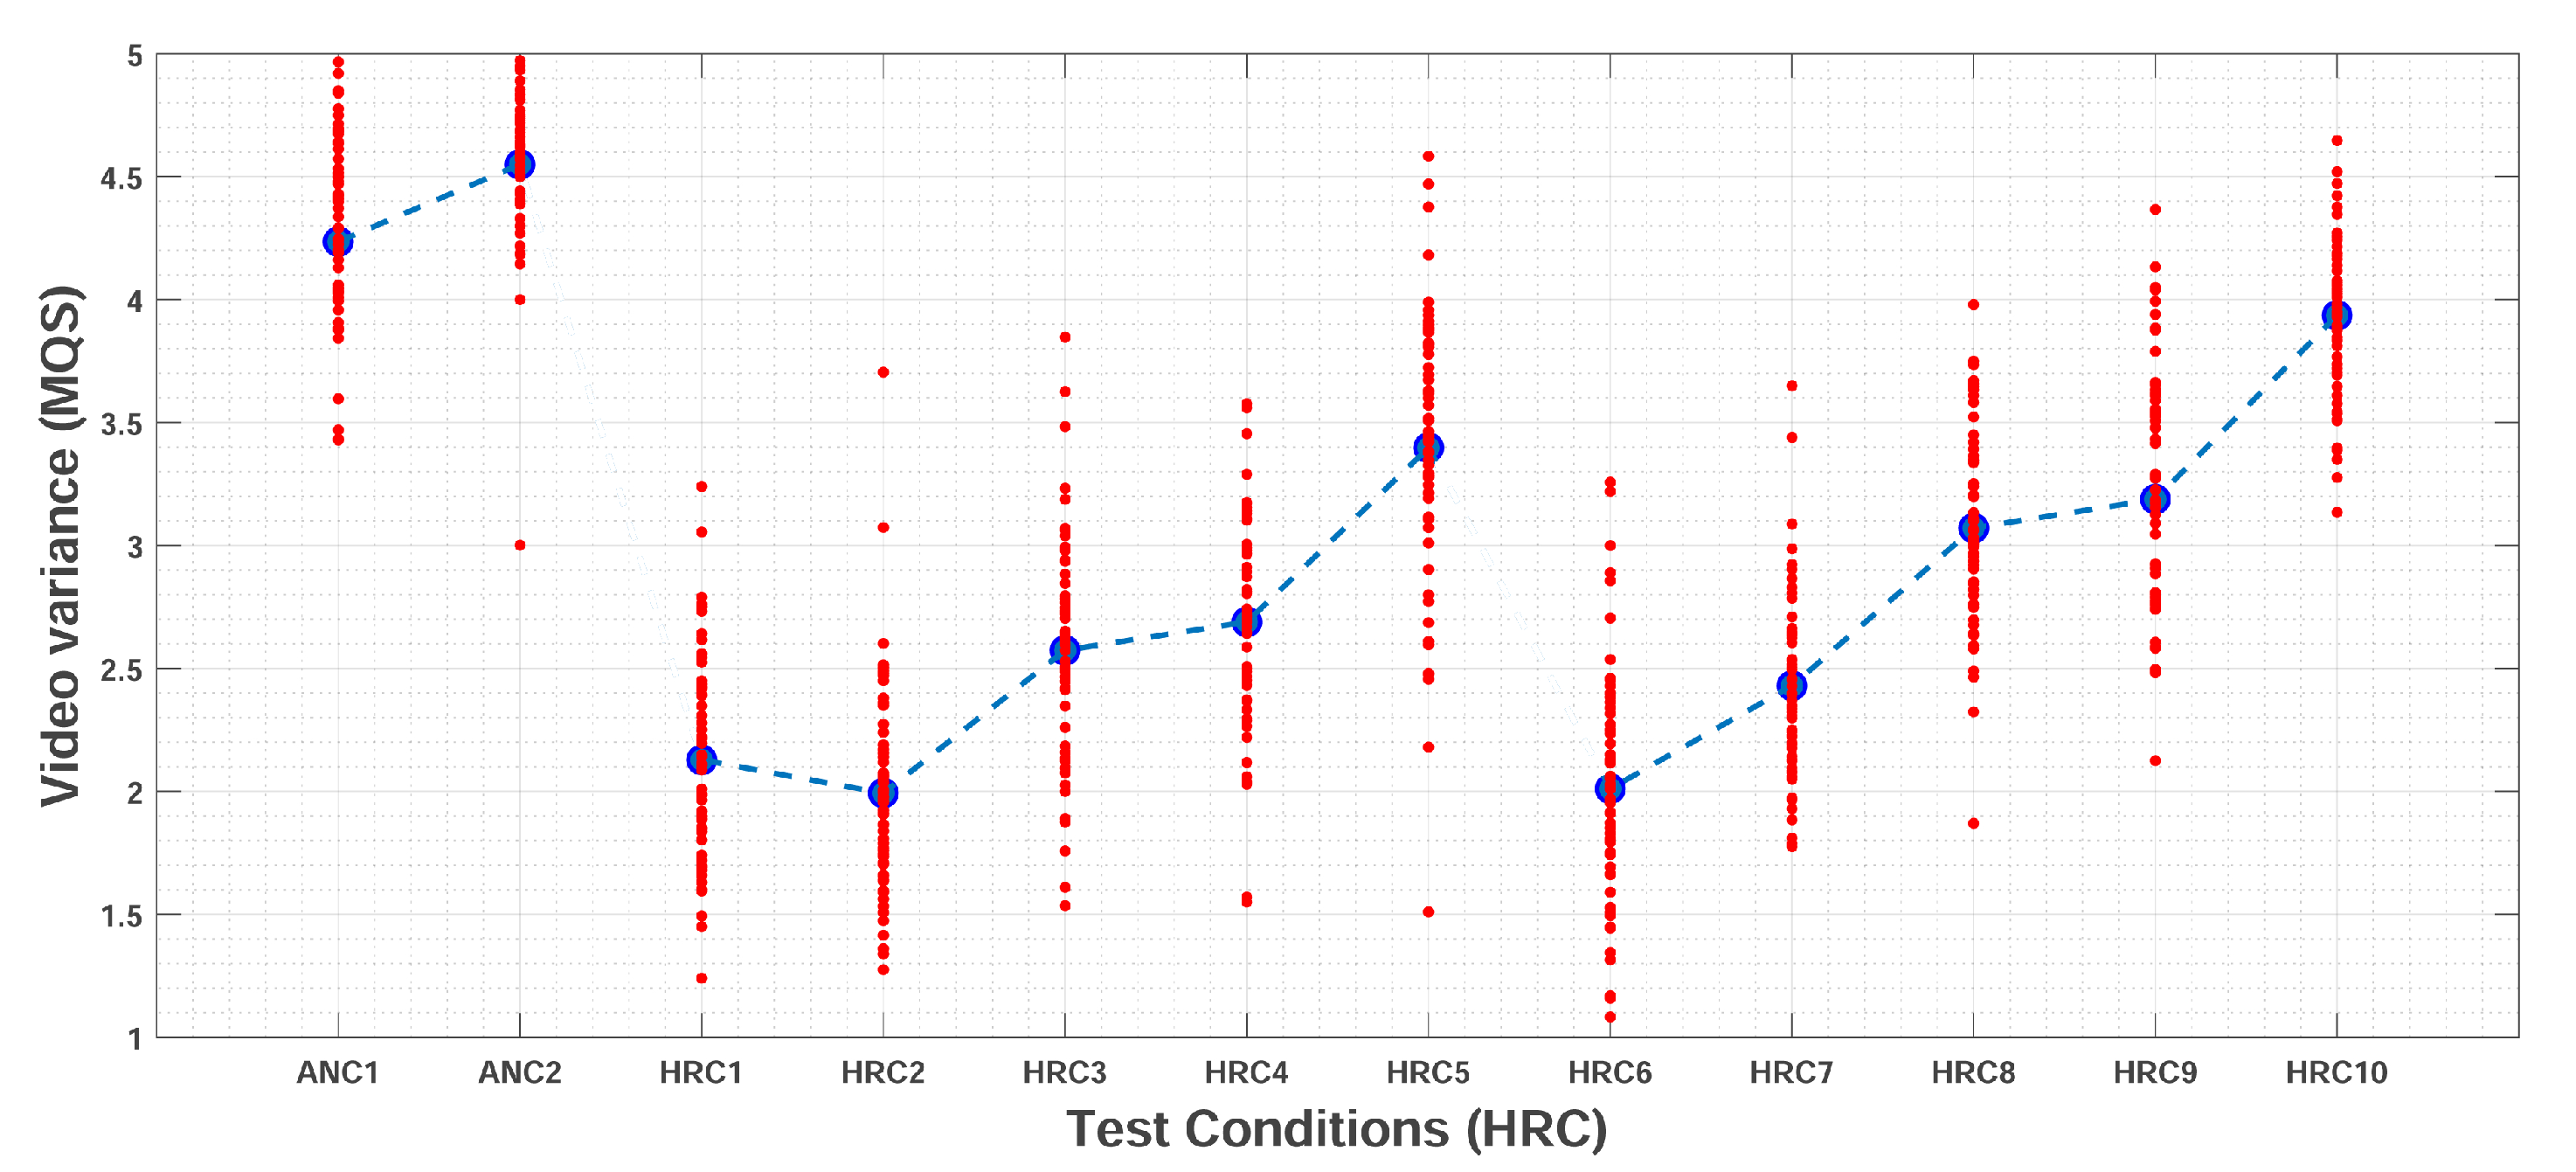
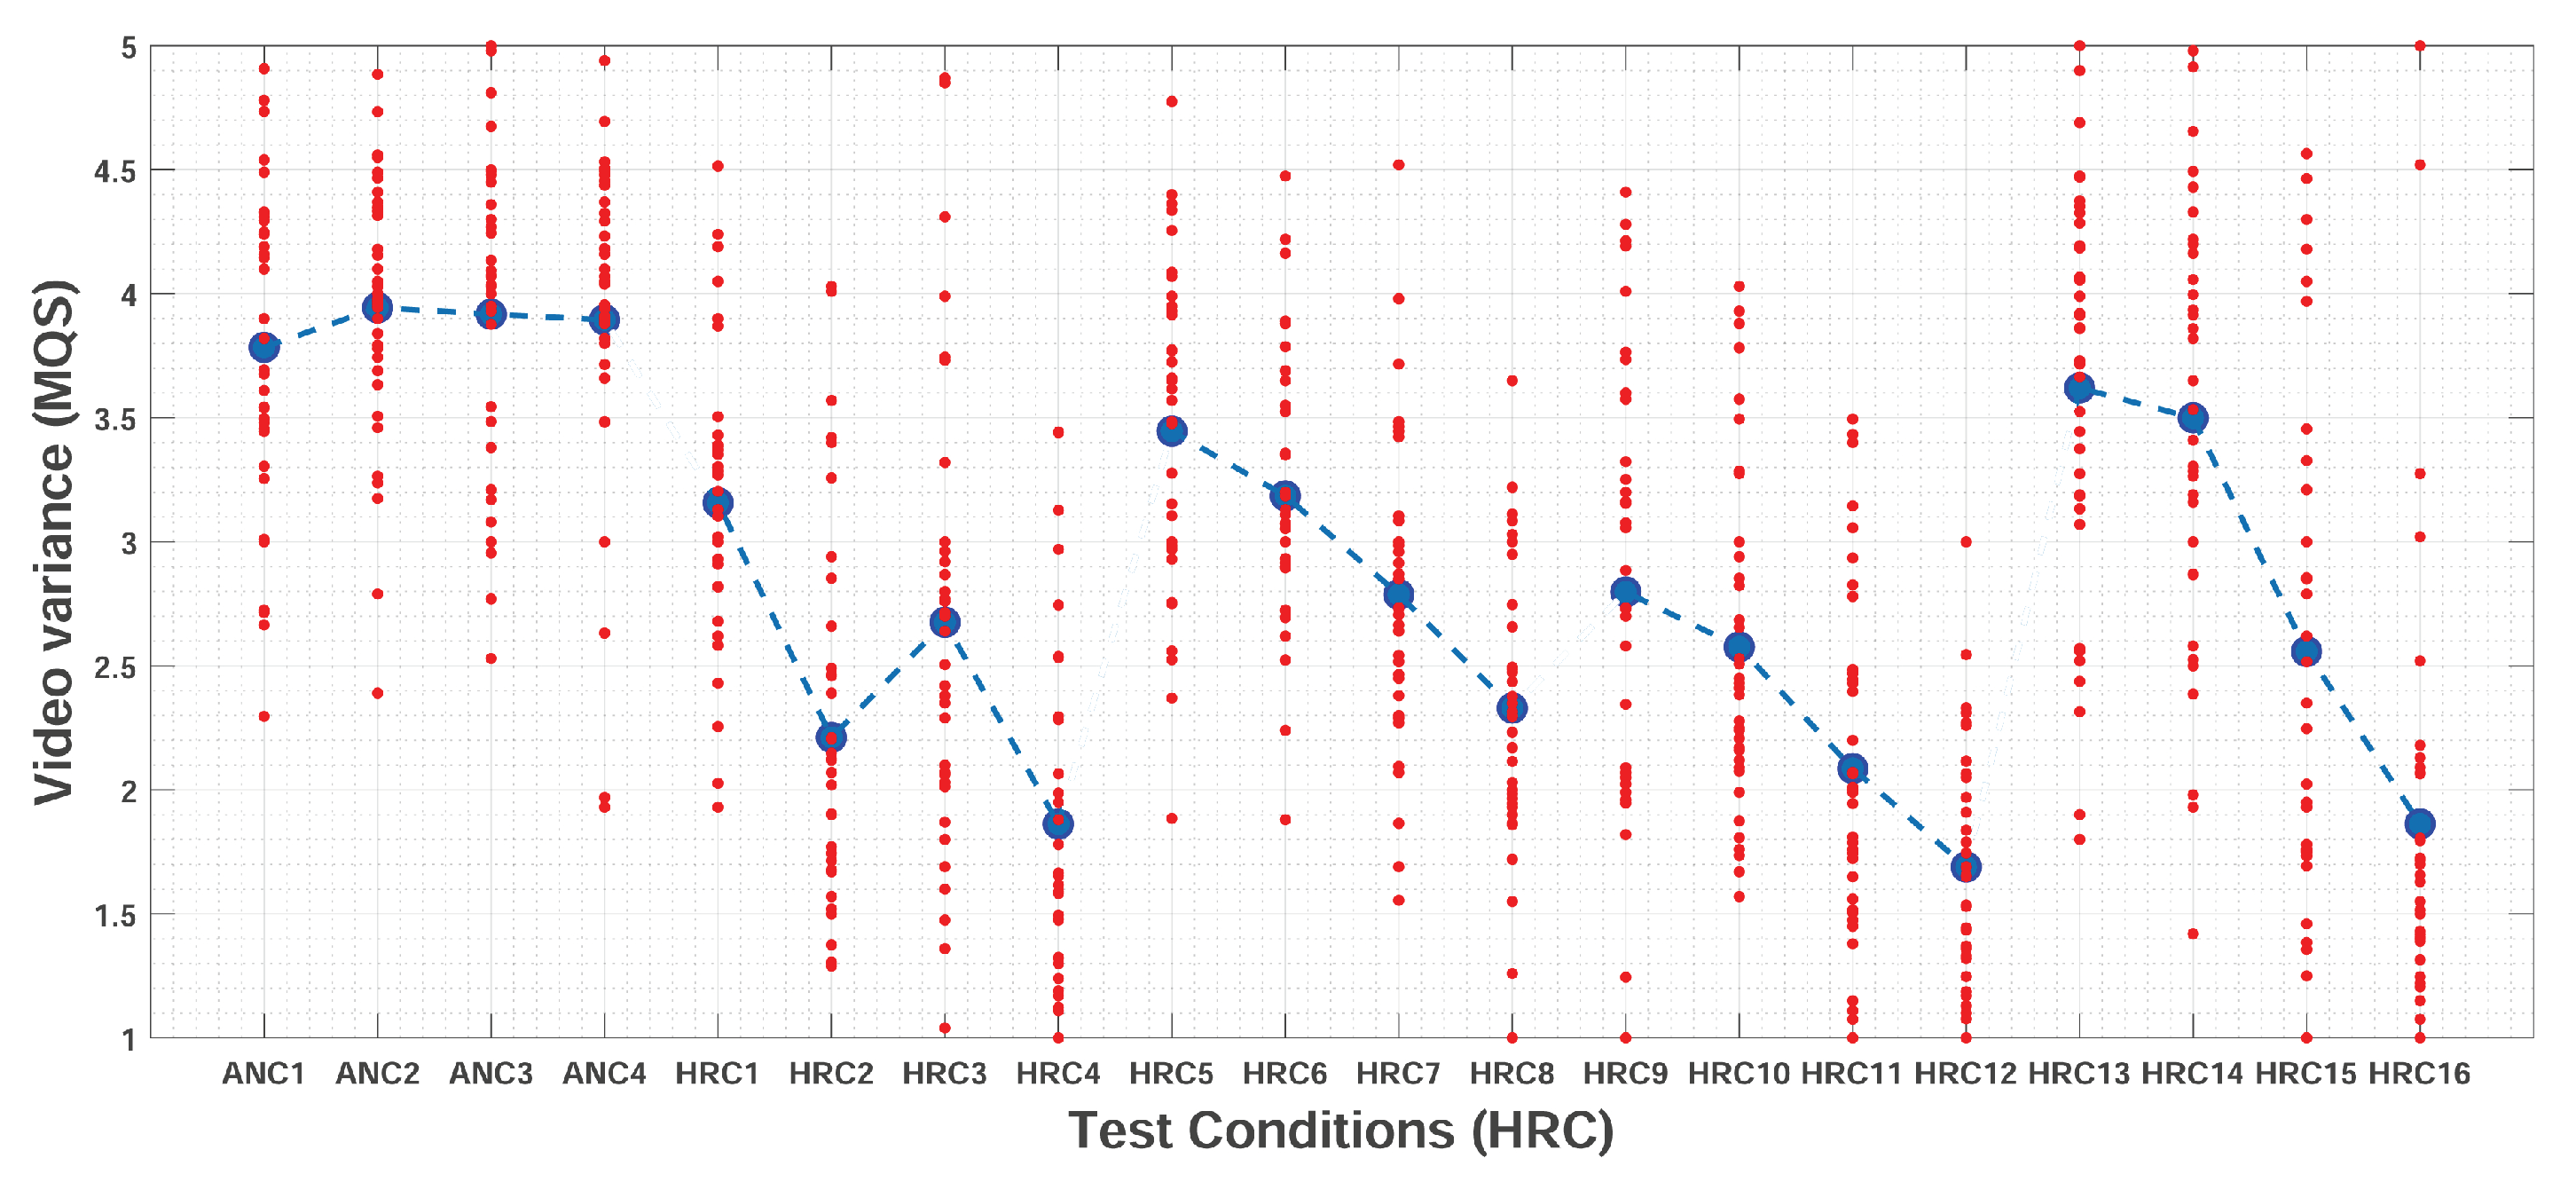
Figure 5 presents the quality scores given by participants for each of the HRCs. For each HRC, the
value is represented by the larger dot in the middle. It can be observed that for most test conditions, the responses are consistent, i.e., the spread of points is small. Moreover, test conditions with higher quality scores (e.g., ANC1, ANC2, and HRC10) presented a higher agreement among participants. In general, it can be observed that participants used the entire scale presented to them (1 to 5).
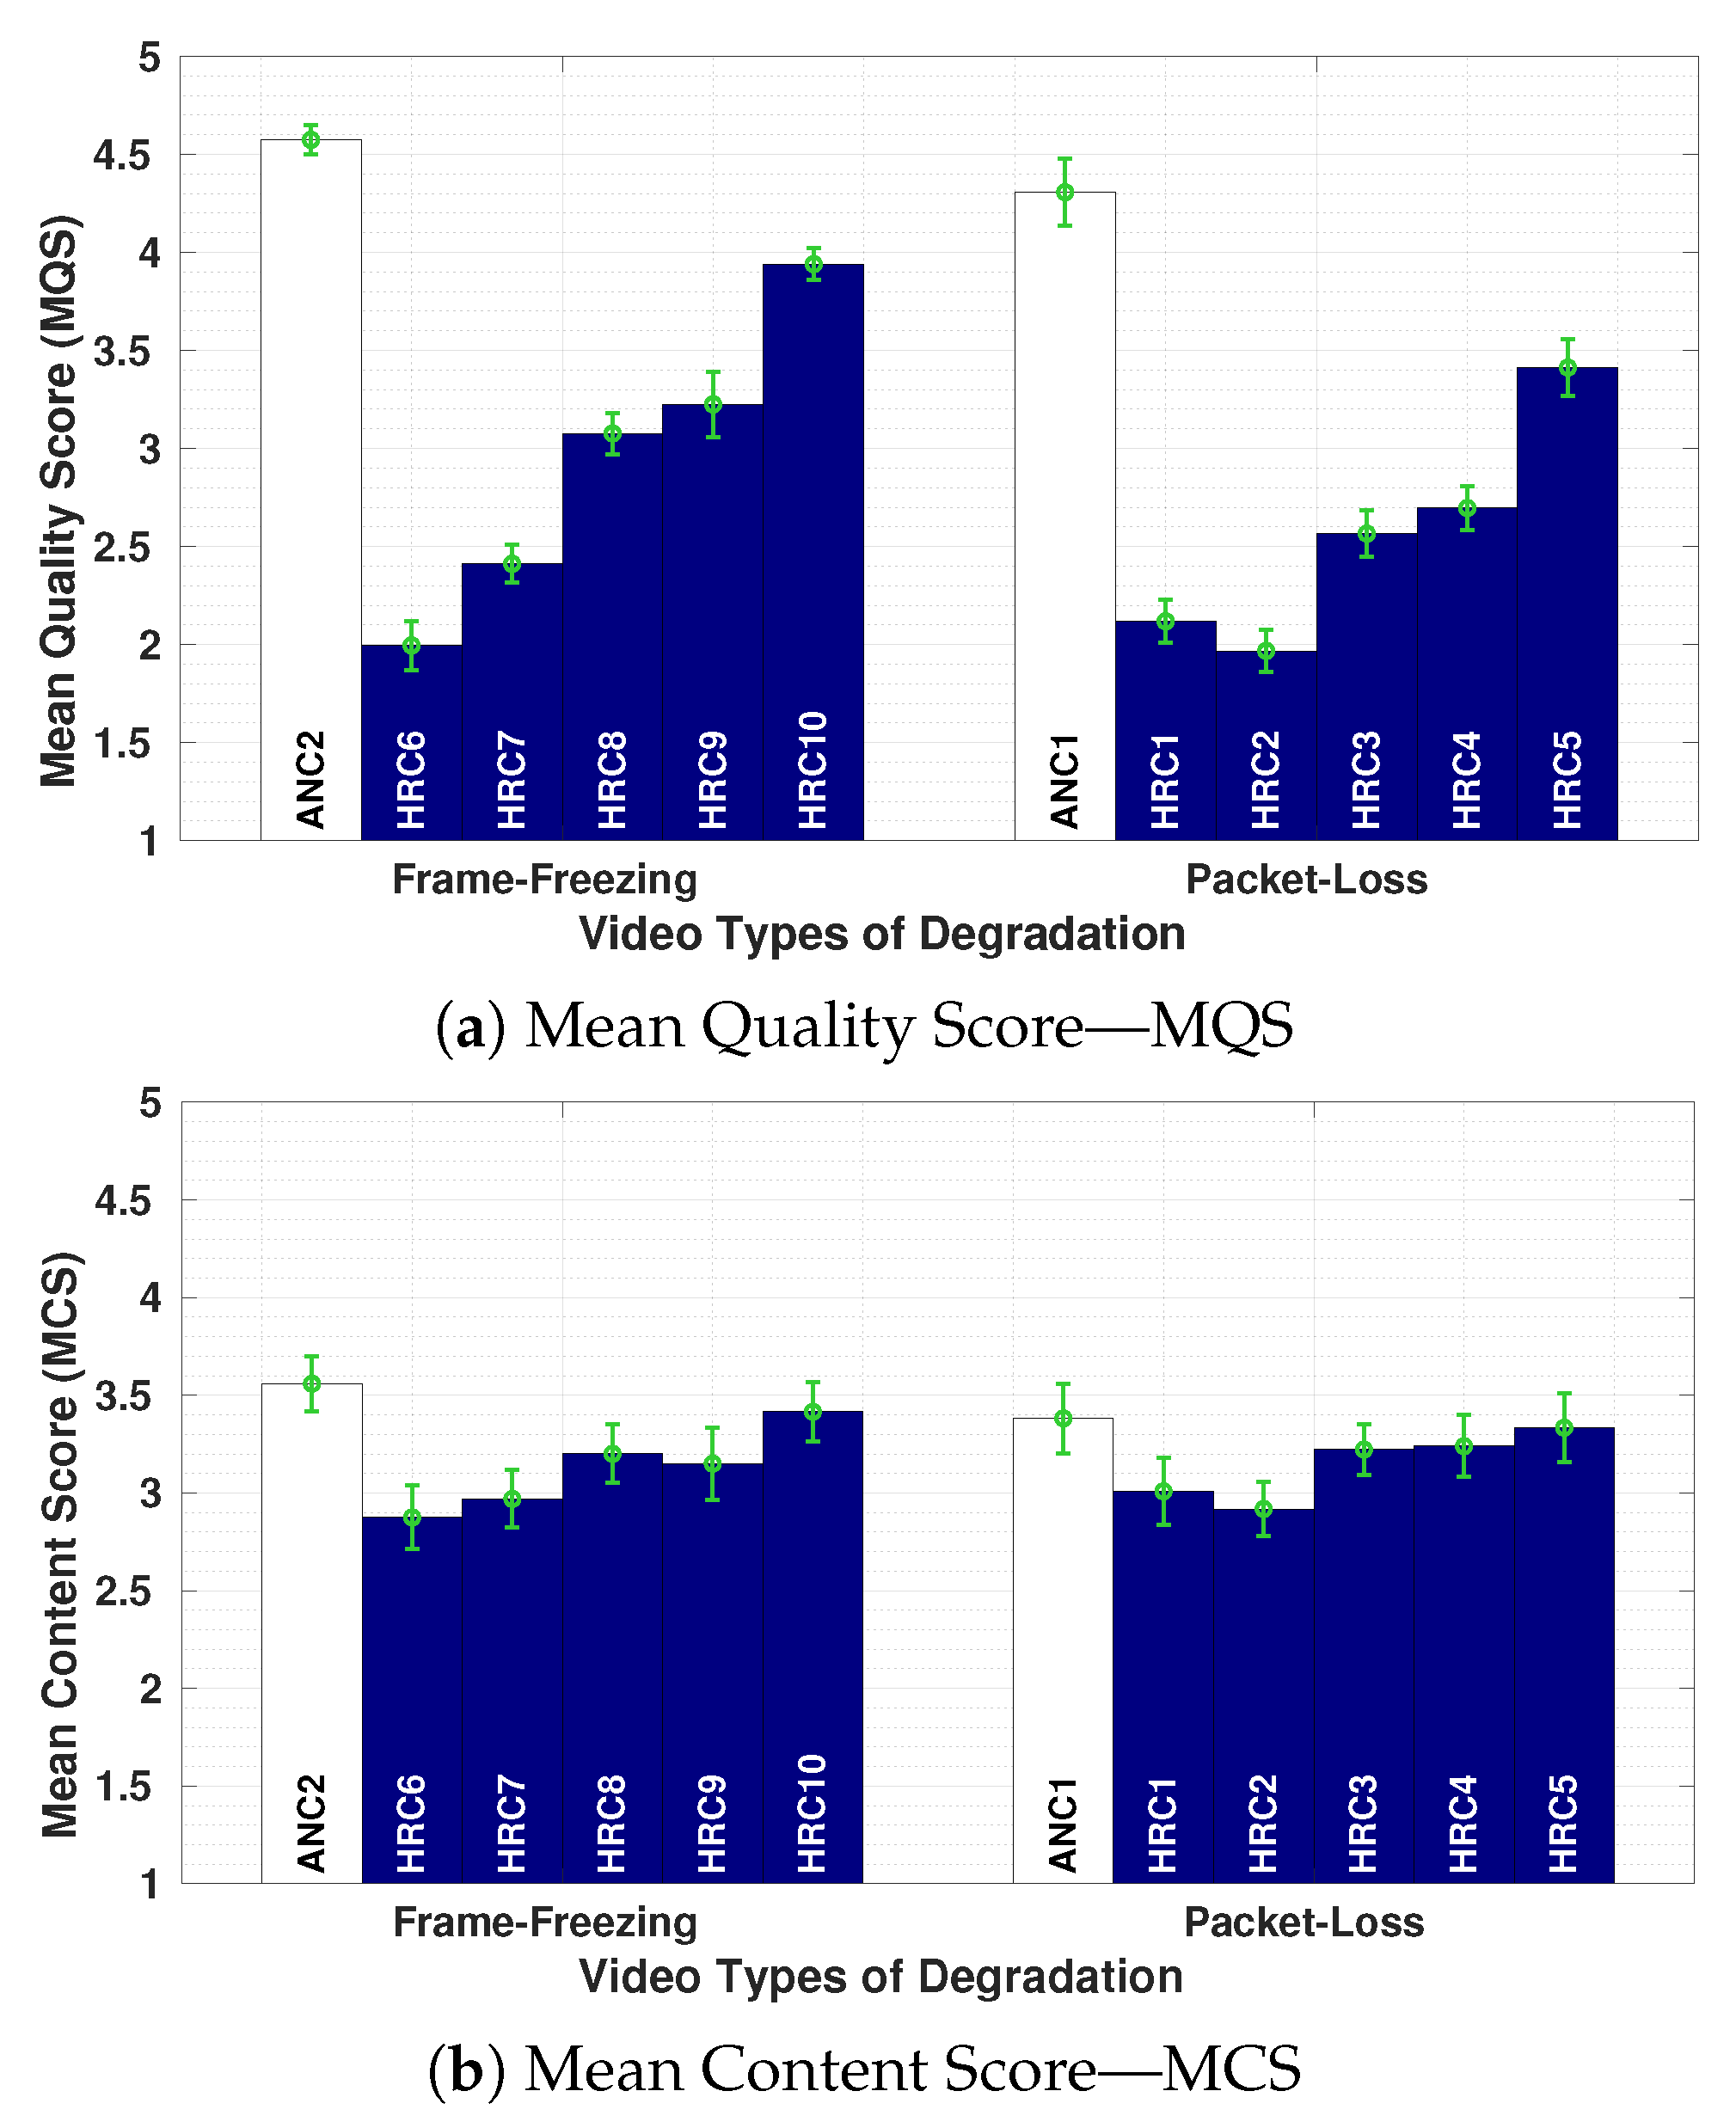
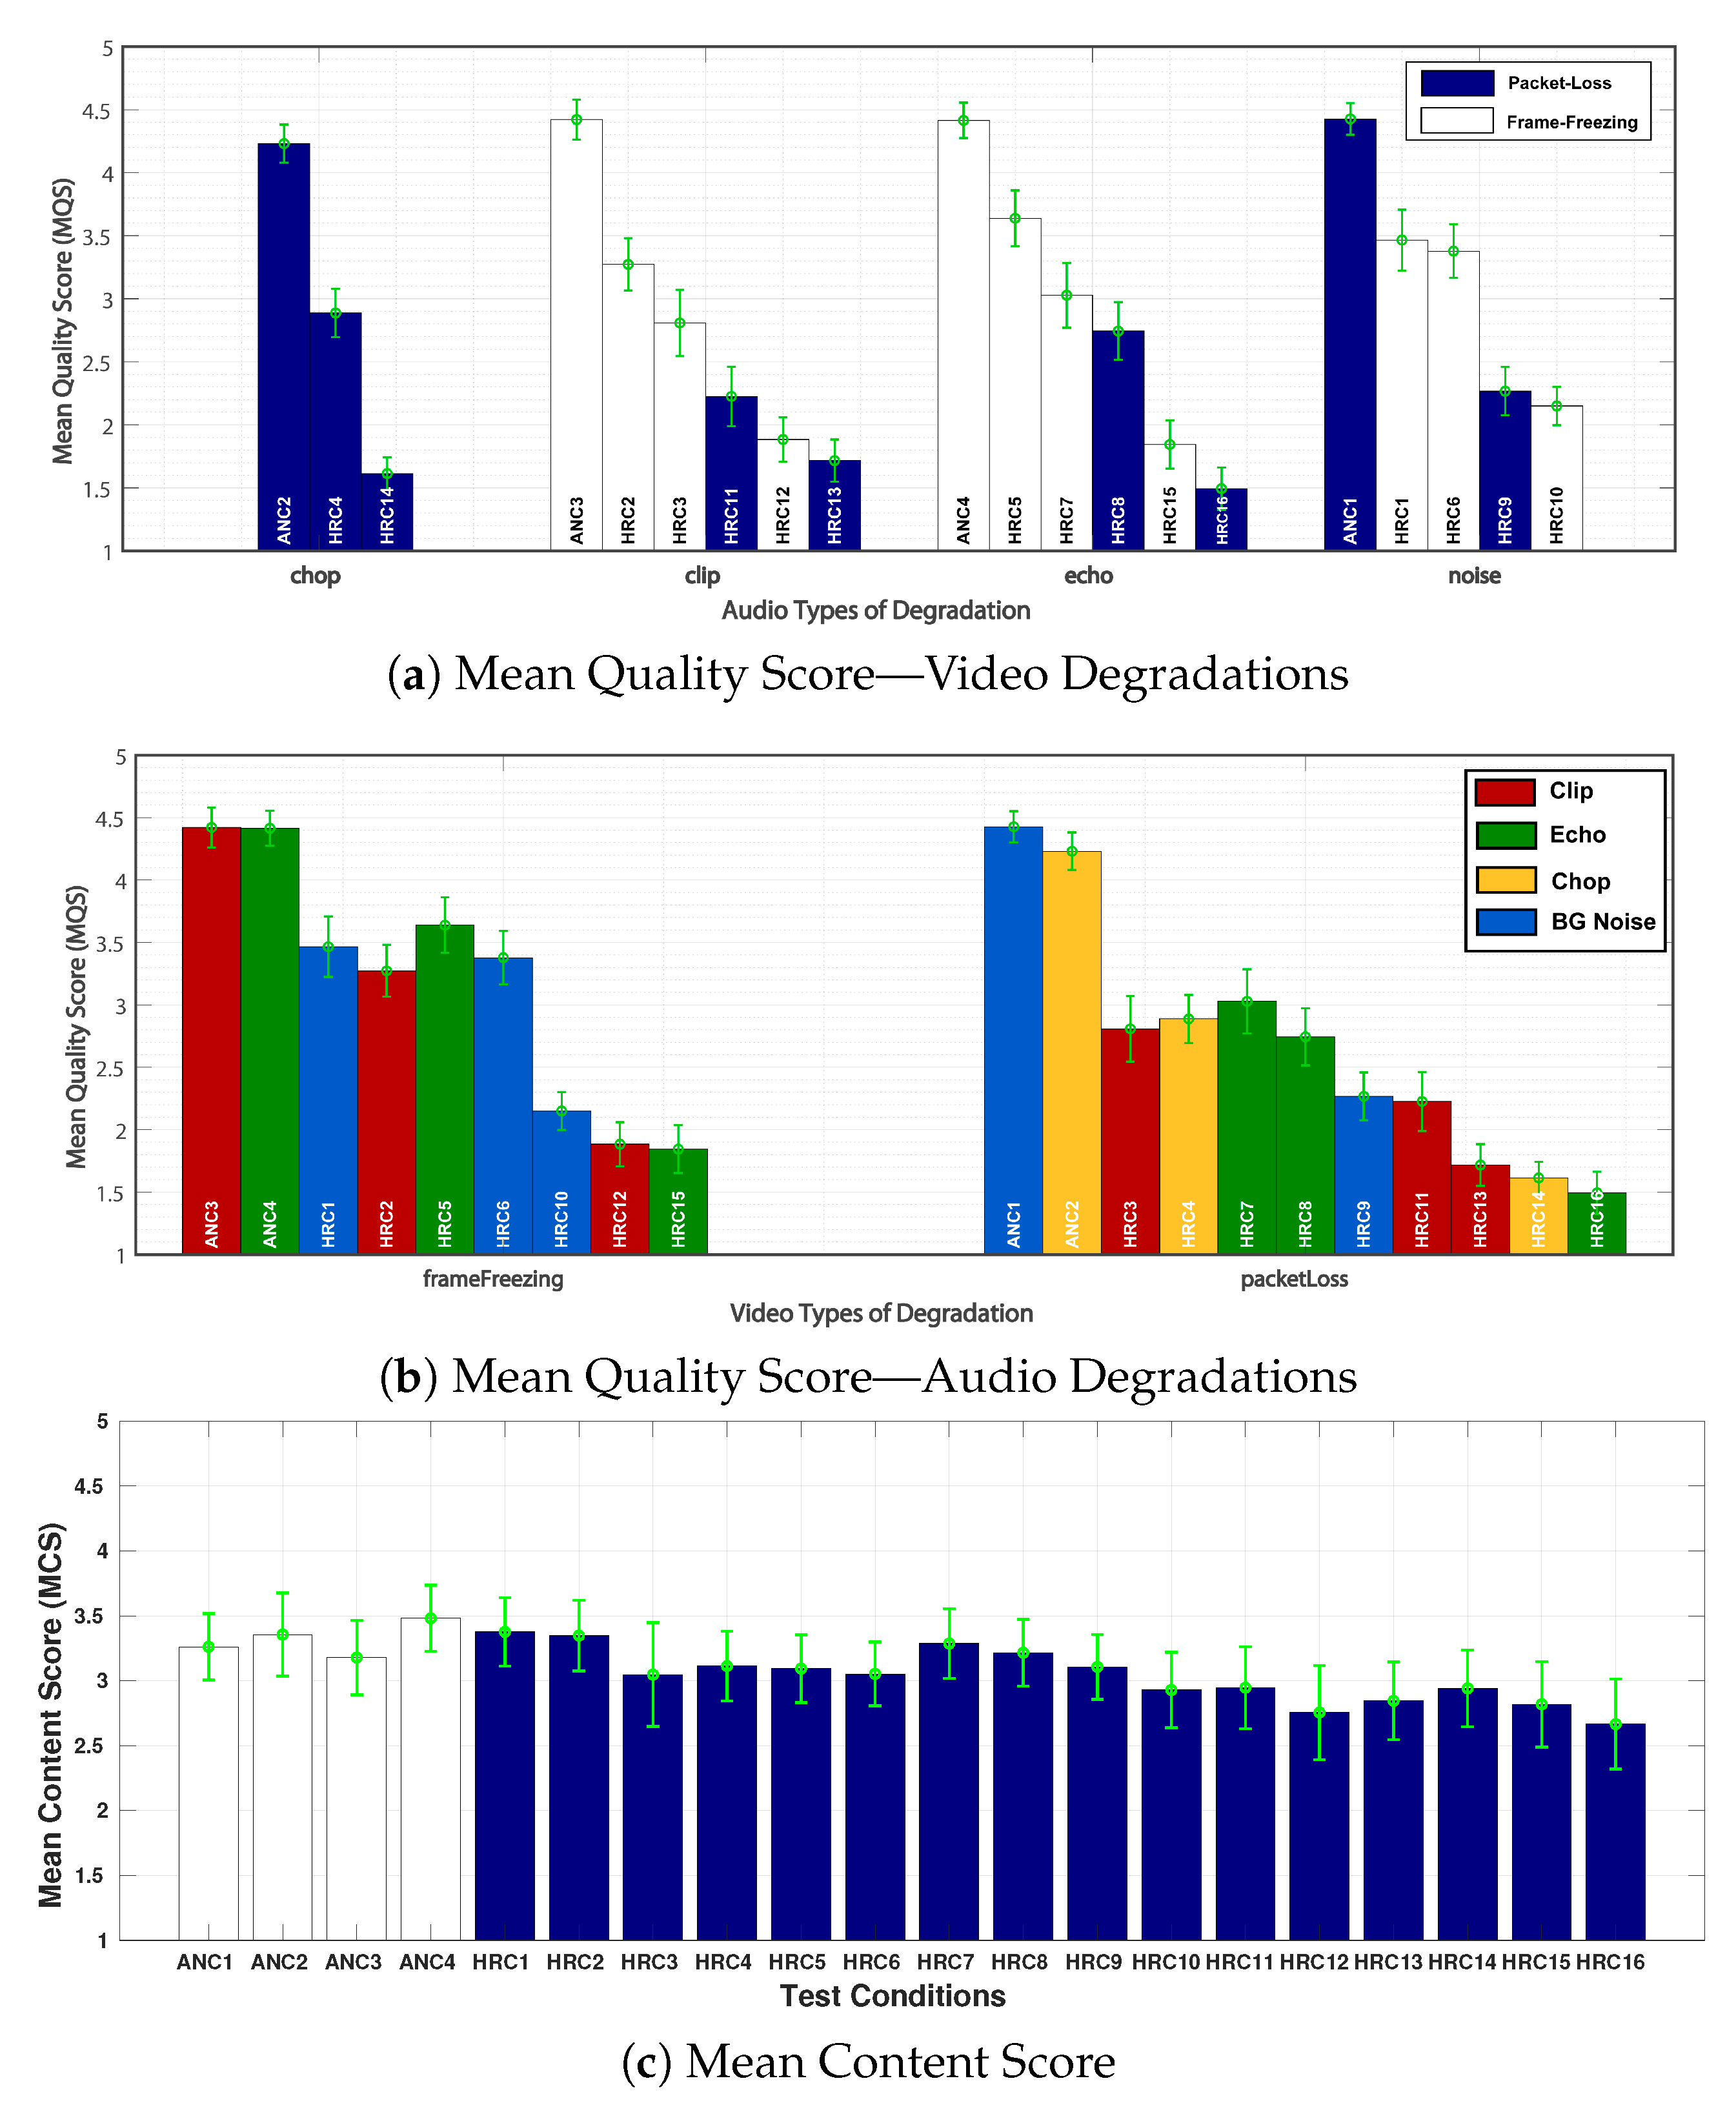
Figure 6a,b shows the Mean Quality Score (
) and Mean Content Score (
), respectively, for Experiment 1. For each HRC, a confidence interval of 95% is included, plus all HRCs are grouped according to Frame-Freezing and Packet-Loss degradations. A combination of a bitrate value (BR) plus a packet-loss ratio (PLR) or frame-freezing configuration (number, length and position) is assigned to each HRC (see
Table 7). The
values (presented in
Figure 6a) fell between 1.92 and 4.5, with no evidence of a scale saturation. As expected,
increases with the strength of the bitrate, packet-loss, and frame-freezing degradations. That is, participants were able to distinguish between different degradation levels inserted in the visual component.
By observing the Frame-Freezing HRC group in
Figure 6a, we notice that HRC8 and HRC9 presented similar results in terms of
. These values can be explained by revising the corresponding HRC parameters in
Table 7. In terms of bitrate, studies show that a video encoded with H.264 at a certain bitrate has approximately the same quality as a video encoded with H.265 using half bitrate [
53,
60]. Then, for the particular case of HRC8 (Codec = H.265 and BR = 1000 kbps) and HRC9 (Codec = H.264 and BR = 2000 kbps), a certain quality equivalence is expected. In terms of frame-freezing, both HRCs had the same number of pauses; then, it can be inferred that the small
difference between HRC8 and HRC9 is due to the position (P) and the length (L) of the pause events. For HRC8, the pauses were inserted at positions ‘2’ and ‘3’, both with a duration of 2 s. Meanwhile, HRC9 had pauses inserted at positions ‘1’ and ‘3’, with a duration of 1 and 3 s, respectively. The slightly better
obtained by HRC9 (in comparison to HRC8) can be explained with the results reported in [
61], which state that short pauses at the beginning of the video playout (initial loading) are less annoying than the pauses occurring in the middle of the playout (stalling).
With regard to the Packet-Loss group in
Figure 6a, HRC3 and HRC4 presented similar results in terms of
. As in the previous case, it can be inferred that the small
difference is due to the Packet-Loss ratio (PLR) since a certain equivalence is expected in terms of bitrate (HRC3: Codec = H.264 and BR = 2000 kbps; HRC4: Codec = H.265 and BR = 1000 kbps). Studies have shown that H.265 is more sensitive to packet-loses than H.264 [
62,
63]. For this case, HRC3 and HRC4 have different PLRs, 5% and 3%, respectively. Then, the
of a higher PLR (5% with H.264 for HRC3) is slightly smaller than the one of a lower PLR (3% with H.265 for HRC4).
A comparison across groups shows that the packet-loss has a stronger effect on the perceived quality than the frame-freezing. This can be verified by observing the values from HRC3 versus HRC9 and HRC4 versus HRC8. For these two cases, the coding parameters are exactly the same. The main difference in values is due to the packet-loss and frame-freezing parameters. Then, we conclude that pauses during the video playout were less annoying to the participants than severe visual distortions caused by packet losses.
Figure 6b presents the
values for each HRC, corresponding to both frame-freezing and packet-loss groups. It is clear that the range of
is much smaller than the range of
, which fluctuates around ‘3’ (“Neutral” Content). The small differences between the HRCs and ANCs (anchor sequences without distortions) show that participants did not perceive great differences, in terms of content, between degraded and original sequences. There are, however, small variations in the
values that somehow follow the
behaviour, at a smaller range. This suggests that there is a certain correspondence between quality and content, which is in agreement with the results obtained in previous studies [
64,
65].
7. Perceptual Experiment 2 (Audio-Only)
For this experiment, the perceived quality responses were collected for a set of audio-visual video clips degraded with audio distortions only. The experiment had the goal of recreating four common streaming audio degradations from the TCD-VoIP dataset [
30]: Background noise, Clipping, Chop, and Echo. These degradations were inserted into the audio components of a set of audio-visual sequences. The goal was to analyze the effect of such degradations on the perceived audio-visual quality.
Forty (40) source stimuli (out of the entire 140 stimuli pool) were considered to build an audio-visual dataset, replicating the sequence processing method used in the TCD-VoIP dataset that was taken as a reference for this experiment. For each degradation type, four (4) single test conditions were selected and presented as a particular HRC. The selection of these test conditions was empirical, aiming to cover the quality range of the TCD-VoIP dataset. This resulted in sixteen (16) HRCs organized according to the type of degradation, as described in
Table 8. Additionally, four test conditions without degradations were used as anchors (ANCs) to help participants establish the range of quality used in the experiment. All twenty (20) test conditions (16 HRCs plus 4 ANCs) were replicated for all forty (40) source stimuli, resulting in eight hundred (800) test stimuli. These 800 sequences compound the second part of the UnB-AV dataset [
47]. The sub-set is labelled as UnB-AV-Experiment-2, and it is available for download along with the entire UnB-AV dataset.
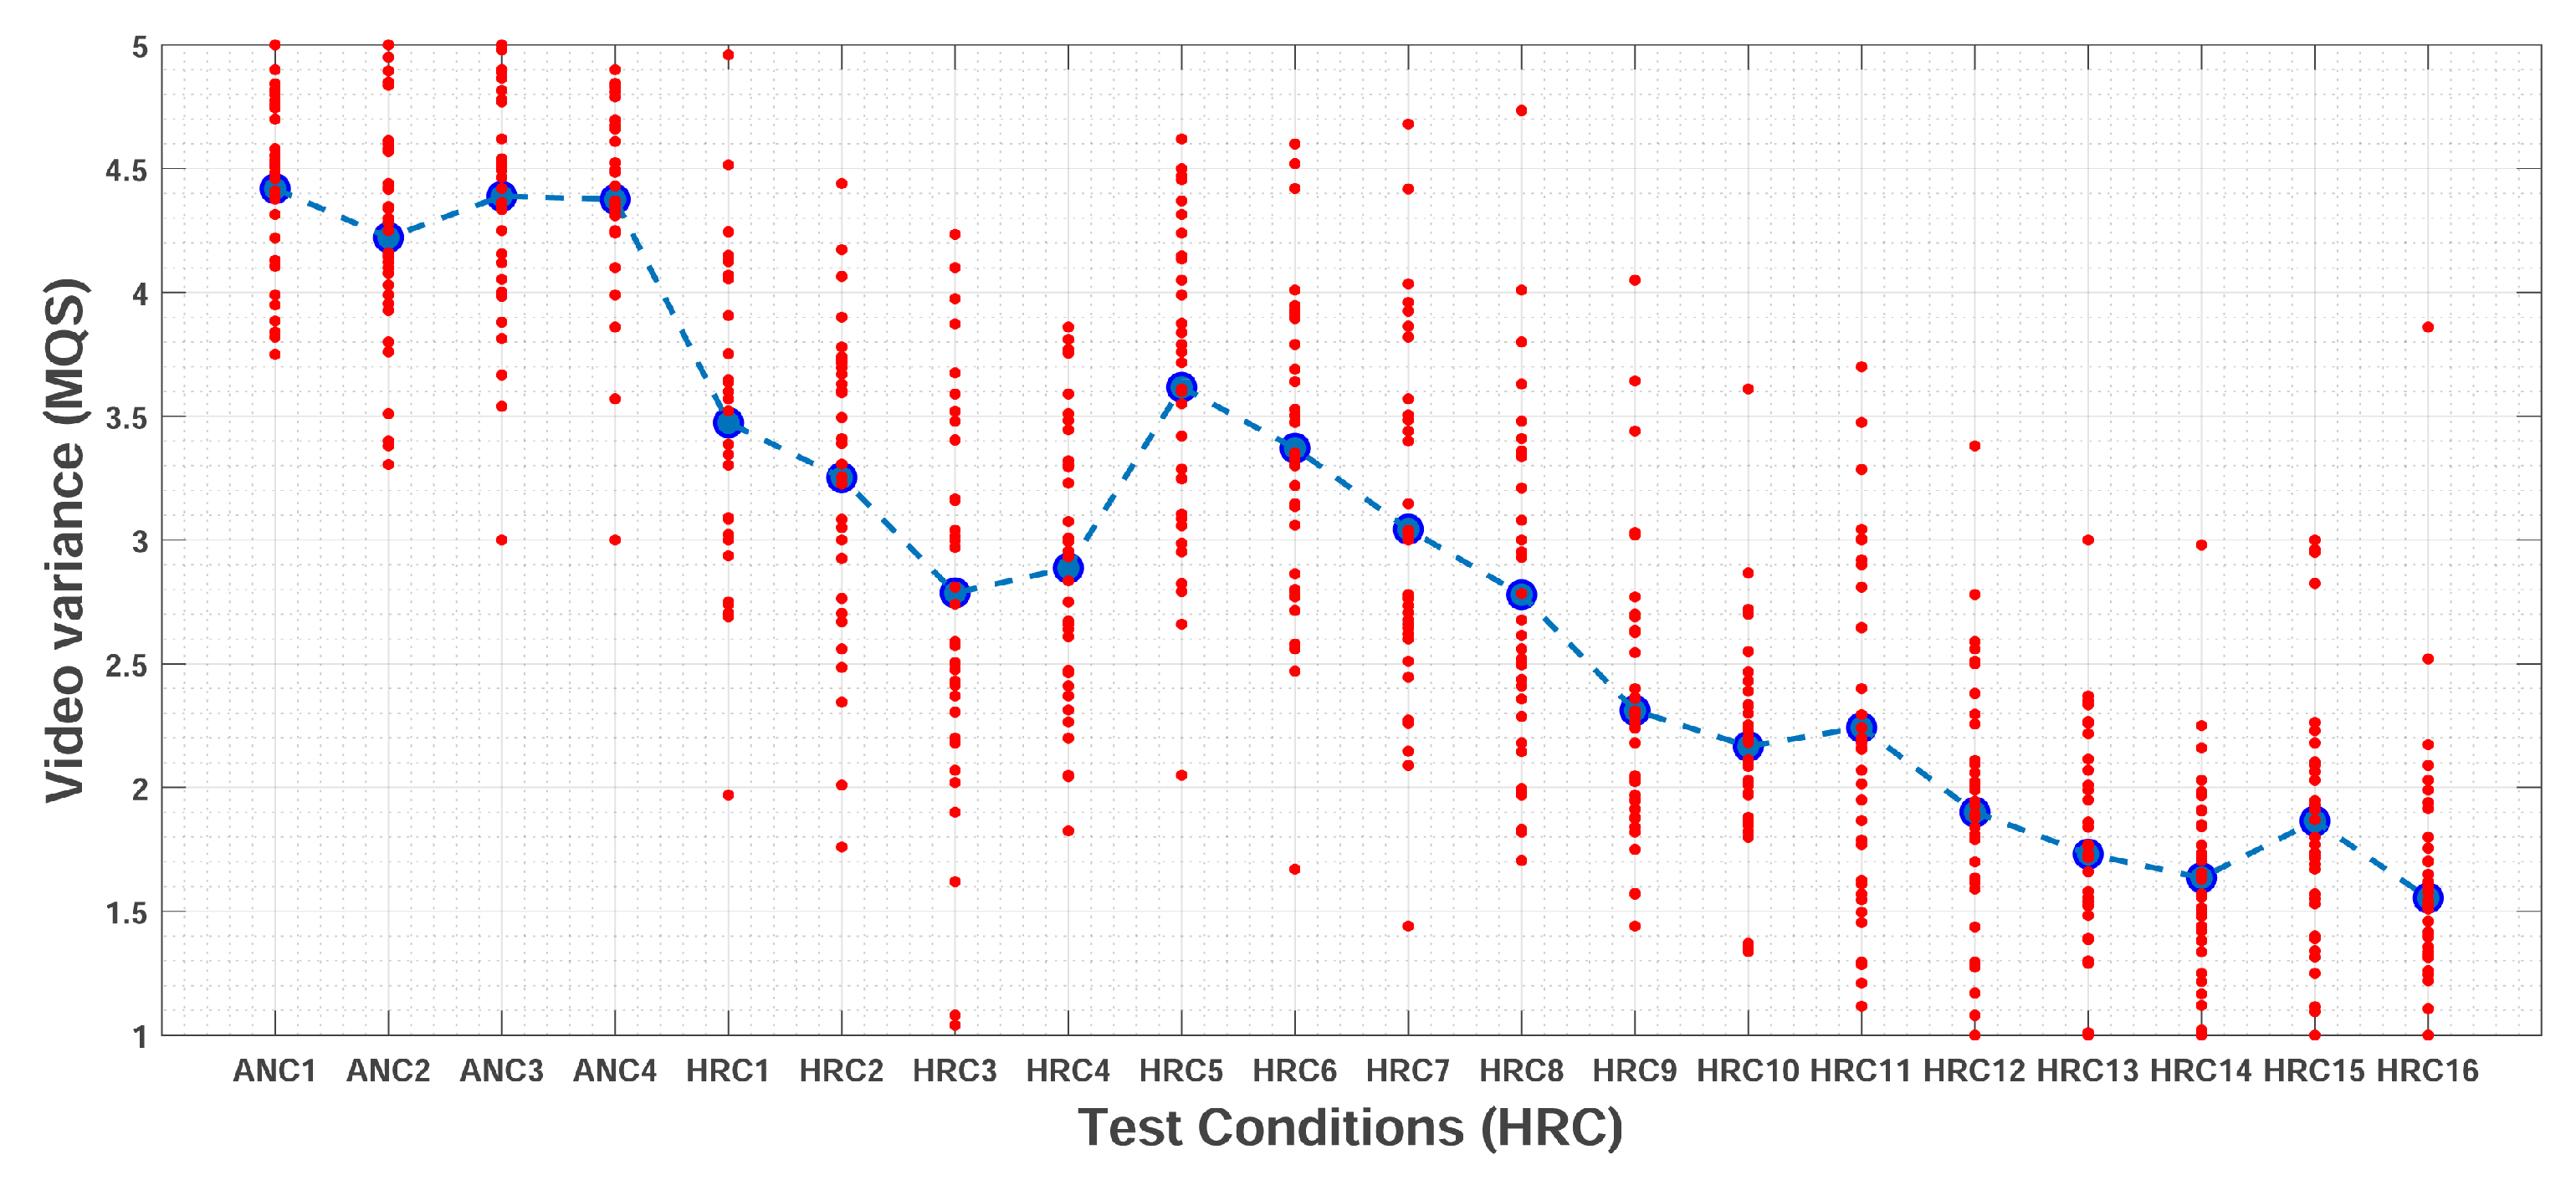
Figure 7 presents the average quality scores obtained for each HRC (i.e., the
), along with the individual scores given by each participant of Experiment 2. Results are organized according to the type of audio distortion. For each HRC, the
value is represented by the larger dot in the middle. It can be observed that, contrary to what was observed in Experiment 1, most of the responses gathered were disperse along the quality scale. Moreover, there is more agreement among participants for quality scores given to the anchors conditions (ANC1, ANC2, ANC3 and ANC4). This suggests that there was less agreement regarding the different audio distortions when compared to the agreement observed in Experiment 1 for the different visual distortions.
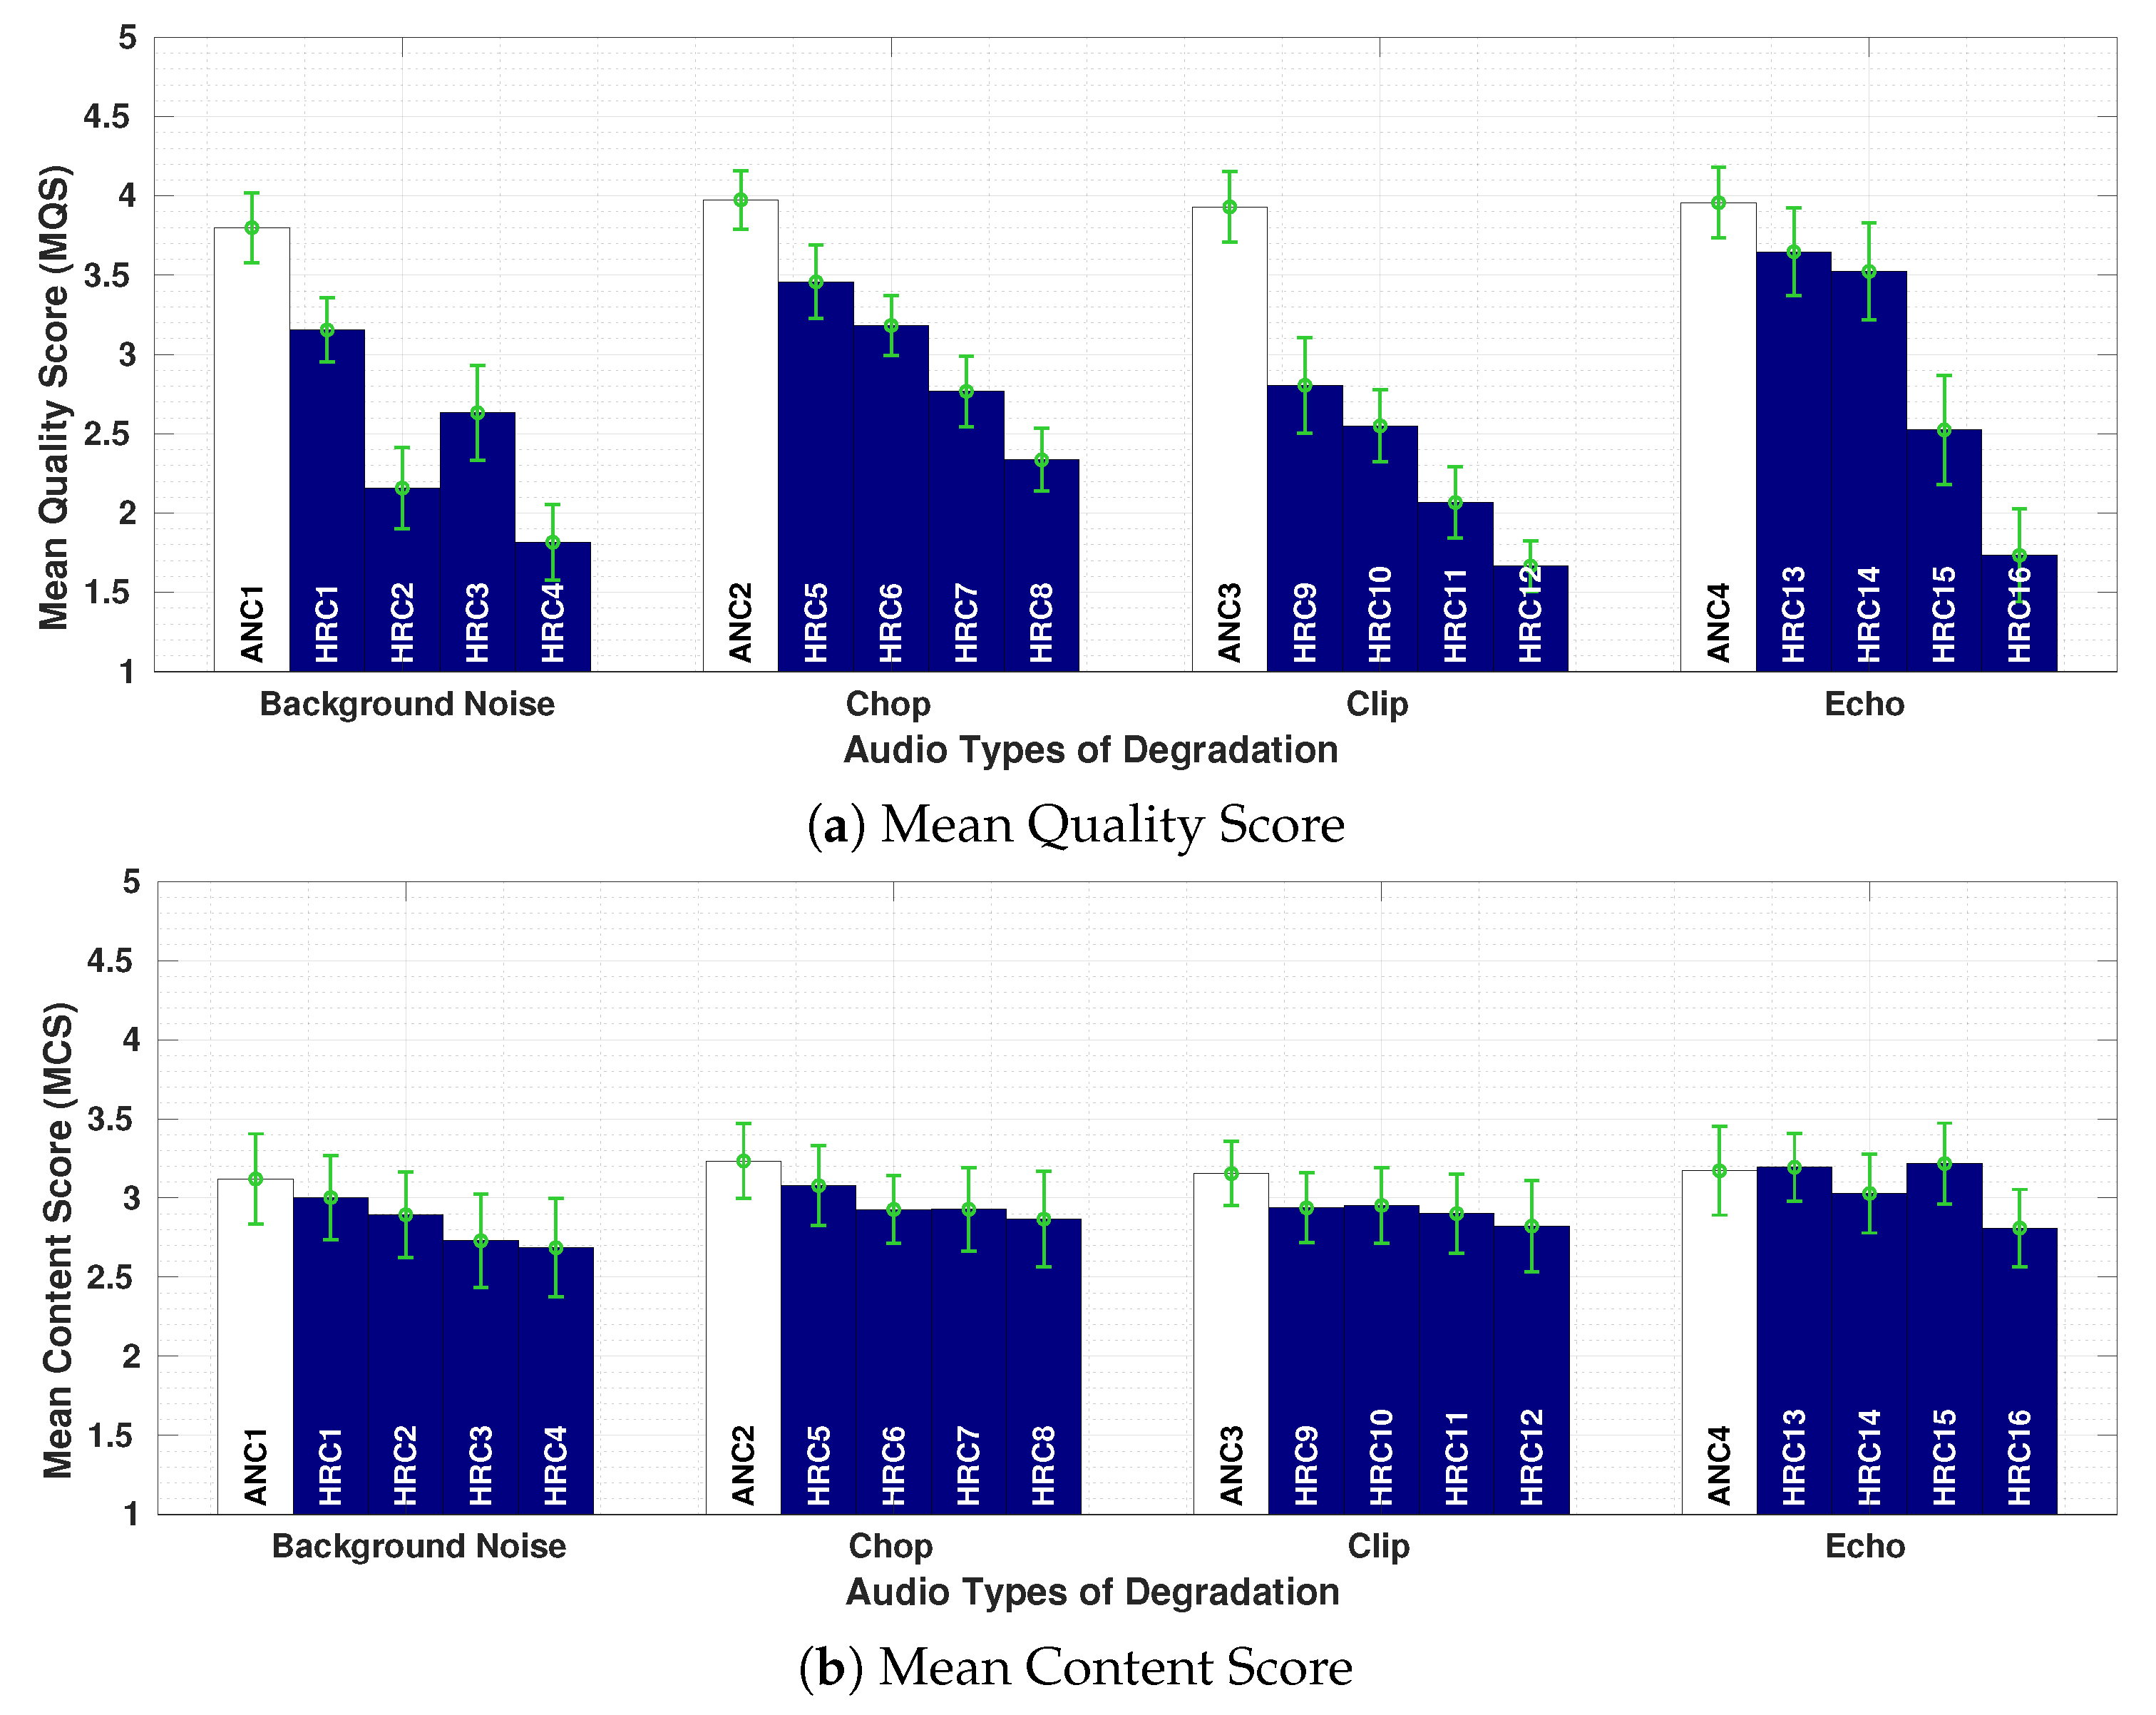
In
Figure 8a,b, the Mean Quality Score (
) and Mean Content Score (
) are presented. For each HRC, a confidence interval of 95% is included, plus all HRCs are grouped according to Background Noise, Chop, Clip, and Echo distortions. Each HRC is assigned with a combination of parameters according to the type of distortion (see
Table 8). The
values are between 1.5 and 3.9, depending on the types of distortions and their degradation levels. With the exception of Echo distortions, the
range occupied only about 30% of the scale. This means that participants had difficulties distinguishing the quality levels for different types of audio distortions. Naturally, this effect was different for different types of audio distortions.
For Background Noise, combining the type of noise and the SNR value associated with it resulted in four HRCs (
Table 8). By observing the results for HRC2 (noise = bable, SNR = 10 dB) and HRC3 (noise = office, SNR = 10 dB), we notice that the babble noise was perceived by participants as more annoying than the office noise. Similar results were observed in a previous study using only the audio component [
30]. For Chop, each HRC corresponds to the combination of three parameters: rate, period, and mode (
Table 8). The reported
values vary from 3.5 to 2.5, decreasing from HRC5 to HRC8. Notice that the
values decrease as the chop rate increases, independent of the period or the chop mode. For the particular case of HRC6 (rate = 2 chops/s, mode = zeros) and HRC7 (rate = 2 chops/s, mode = previous), repeating previous portions of samples (previous mode) was slightly more annoying than inserting silence portions (zeros mode).
For Clip, a multiplier factor was the only parameter assigned to each HRC. The reported
values varied from 3 to 1.5, decreasing from HRC9 to HRC12. Clip results presented the lower
values among all 4 types of audio distortions, which indicates that clipped distortions were perceived as the most annoying ones. Finally, for Echo, each HRC was associated with the combination of three parameters: alpha, delay, and feedback (
Table 8). The reported
values vary from 3.7 and 1.7, decreasing from HRC13 to HRC16 with an abrupt drop in the
between HRC14 and HRC15. This drop might be related to the inclusion of a feedback percentage, which affected the perceived quality in a similar way as observed in previous studies [
30].
Figure 6b presents the
values for each HRC, corresponding to the four audio distortions groups. As observed in the previous
results, the range where these values vary is very small, fluctuating around ‘3’ (“Neutral” Content). Almost no difference was observed between scores for distorted conditions (HRCs) and no-distorted conditions (ANCs). This indicates that, for this experiment, participants were not able to trace a correspondence between the perceived quality and the content of the sequence.
8. Perceptual Experiment 3 (Audio-Visual)
In the last experiment, the goal was to estimate the overall quality of audio-visual video clips containing combinations of audio and video distortions. The video distortions were Bitrate compression, Packet-Loss, and Frame-Freezing, replicating the distortions in Experiment 1. The audio distortions were Background noise, Chop, Clip, and Echo, replicated conditions of Experiment 2.
Forty (40) source stimuli were considered for this experiment. Both audio and video degradations were organized into sixteen (16) different HRCs. As with previous experiments, 4 anchors (ANCs) were included in the HRC set. Parameter details of both HRCs and ANCs are presented in
Table 9. Altogether, 40 source stimuli were processed at 20 different test conditions (16 HRCs plus 4 ANCs). This resulted in 800 PVSs, containing different audio and video distortions. In each experimental session, the participant watched (only) 40 test stimuli out of the 800 test sequences, as recommended by the immersive methodology. These 800 sequences compose the third part of the UnB-AV dataset [
47]. The sub-set is labelled as UnB-AV-Experiment-3 and is available for download along with the entire UnB-AV dataset.
Figure 9 presents the average quality scores obtained for each HRC (i.e., the
), along with the individual scores given by each participant of Experiment 3. For each HRC, the
value is represented by the larger dot in the middle of the cloud of values. Notice that there is a certain consistency among results for different test conditions. This characteristic is more evident for extreme test conditions, i.e., test conditions with the higher (ANC1, ANC2, ANC3, and ANC4) and lower (HRC13, HRC14, HRC15, HRC16) quality levels.
In
Figure 10a,b, the
values gathered for each HRC in Experiment 3 are presented. For better visualization,
results were presented in two figures (a) and (b) organized by audio and video types of distortions, respectively. For each HRC, a confidence interval of 95% is included. From a general view, it can be observed that most
values fell in the range of 4.4 and 1.5 in the MQS scale. By observing the
values for the different audio distortions in
Figure 10a, we notice that values vary along all different HRCs, which indicates that participants were able to perceive the variations among the different levels of quality when both audio and video degradations are present.
With respect to the Chop type of distortion, the significant difference between HRC4 and HRC14, both with packet-losses, was determined by the combination of a chop rate (HRC4: 2 chops/s, HRC14: 5 chops/s) plus the BR and PLR parameters (HRC4: 8000 kbps, 1%, HRC14: 400 kbps, 8%). This, in accordance with the effects observed by these parameters in Experiments 1 and 2. For the Clip type of distortion,
values decrease progressively from HRC2 to HRC13. For the case of HRC2 and HRC3, where the clip multiplier is fixed in 11, an equivalence is expected in terms of bitrate (HRC2: H.264, 16,000 kbps, HRC3: H.265, 8000 kbps). The difference in the quality score was defined by the stronger effect of packet-losses over frame-freezing pauses (HRC2: number = 1, length = 2 s, HRC3: PLR = 1%). This is also the case for HRC12 and HRC13 (see
Table 9). Equivalence in terms of bitrate and a certain predominance of packet-loss over frame-freezing is too observed for the Echo type of distortion. More specifically, for HRC5-HRC7 and HRC15-HRC16, both with fixed Echo parameters (see
Table 9). For the Background Noise type of distortion, results for HRC1 and HRC6 were almost equivalent. For this case, most of the audio and video parameters were the same (see
Table 9), the small difference (no statistical significance) between both test conditions was determined by the car noise type at 15 dB (HRC1) being less annoying than the office noise at 10 dB (HRC6). For the case of HRC9 and HRC10, with fixed parameters of audio (office noise with 10 dB), results were also equivalent, and the small difference was due to the coding parameters (HRC9: 2000 kbps, HRC10: 800 kbps) and the slightly stronger annoyance caused by the frame-freezing pauses over the packet losses (HRC9: PLR = 5%, HRC10: number = 3, length = 7 s). Finally, by observing the
values for the different video distortions in
Figure 10b, we notice that frame-freezing distortions were less annoying to participants than packet-losses. This is in agreement with the results from Experiment 1.
Figure 10c presents the
values for each HRC gathered in Experiment 3. As in Experiments 1 and 2,
values vary in a small range, fluctuating around the value ‘3’ (“Neutral” Content).
9. Discussion and Comparison among Experiments
In this Section, quality and content responses across all three perceptual experiments are compared. We explore the results for equivalent test conditions in Experiments 1, 2 and 3. To this end, only the quality scores of the equivalent test conditions from each experiment are compared. The objective is to study the responses of equivalent test conditions used in different experimental scenarios (video-only distortions, audio-only distortions, and Audio + Video distortions). This analysis helps us understand how and at what level a particular test condition is affected by its accompanying component (impaired or unimpaired).
For this particular analysis, labels assigned to the HRCs of Experiments 1, 2 and 3, were redefined. The goal was to compare equivalent HRCs across all three experiments. For this purpose, the term Video Test Condition (V-TC) was used to denote the test conditions for the video component (
Table 10). In the same way, the term Audio Test Condition (A-TC) was used to denote the audio test conditions for the audio component (
Table 11). These terms replaced the HRC labels used in previous sections. The analysis is divided into three parts: (1) the visual and (2) auditory component effects for equivalent test conditions, and (3) ranges of quality and content scores for the three experiments. This Section includes an additional analysis using external data from audio-visual studies available in the literature. This analysis estimates the internal consistency of all three experiments from this study and compares it with results from external audio-visual studies.
9.1. On the Visual Component Effect
This analysis explores the effect of the visual impairments for equivalent V-TCs in Experiments 1 and 3.
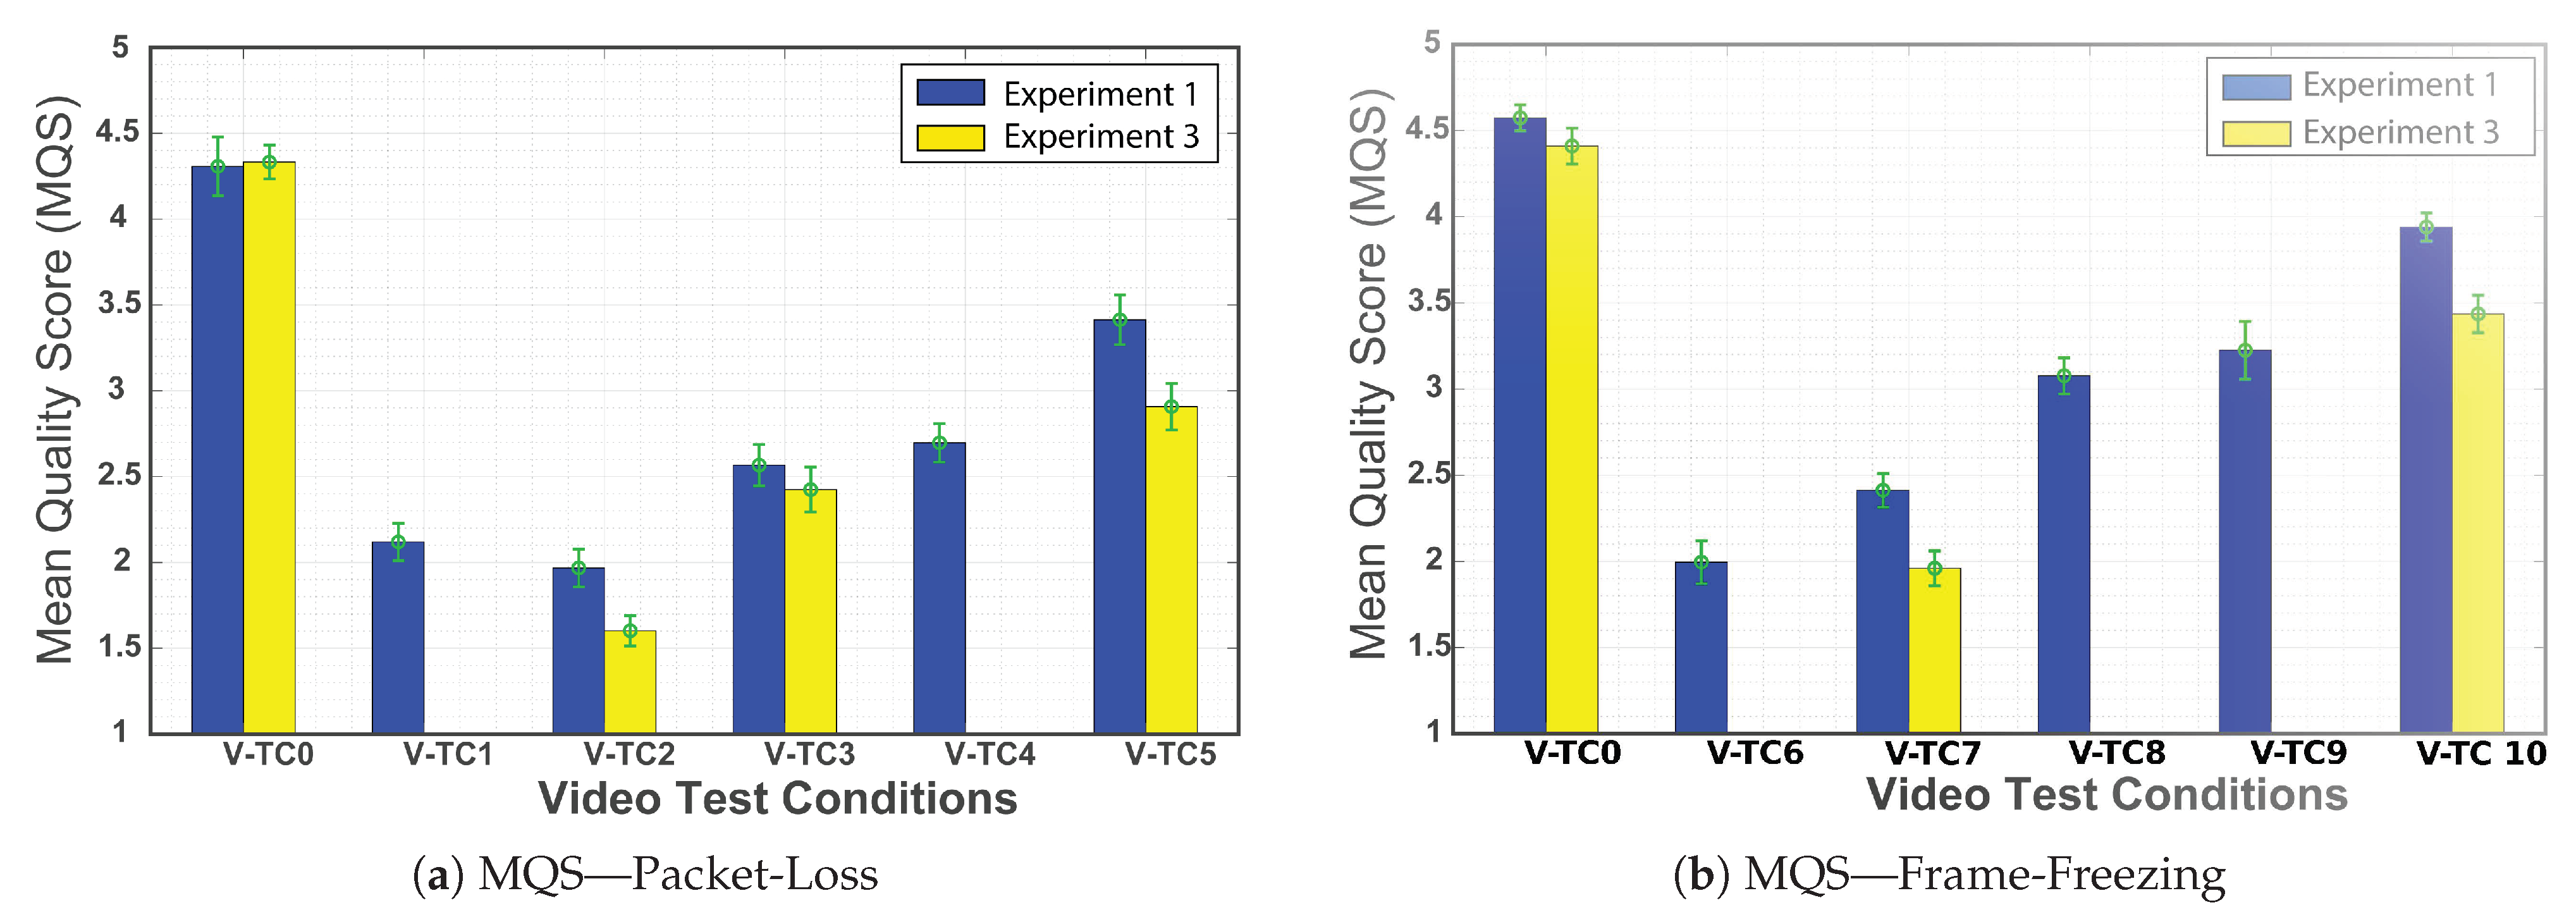
Figure 11 presents a comparison between the
values (MQS for different V-TCs) collected from these experiments. The
values were grouped according to distortion type: packet-loss and frame-freezing. To verify if the differences between the average
values for the equivalent test conditions in Experiment 1 and Experiment 3, a Two-sample
t-test analysis was made.
Table 12 reports this analysis and highlights the equivalent conditions where the difference between results in Experiment 1 and Experiment 3 are significantly different.
Figure 11a depicts the results for the packet-loss distortion. Notice that, considering the same V-TCs, the scores were lower when the audio component was impaired (Experiment 3). This effect is more noticeable for V-TC2 and V-TC5 (differences are statistically significant).
Figure 11b shows the same comparison for the frame-freezing distortion. More specifically, for V-TC7 and V-TC10 the scores for sequences with audio distortions are lower (differences are statistically significant). Audio distortions affected the audio-visual quality of sequences with packet-loss and frame-freezing distortions similarly. These results show that there is an impact of the audio quality on the perceived audio-visual quality. Moreover, given that the analysis is made per test condition, it looks like this impact did not depend on the content. However, a larger number of test conditions are necessary to analyze the effect of the media content.
Results of equivalent test conditions from Experiments 1, 2, and 3 are compared in
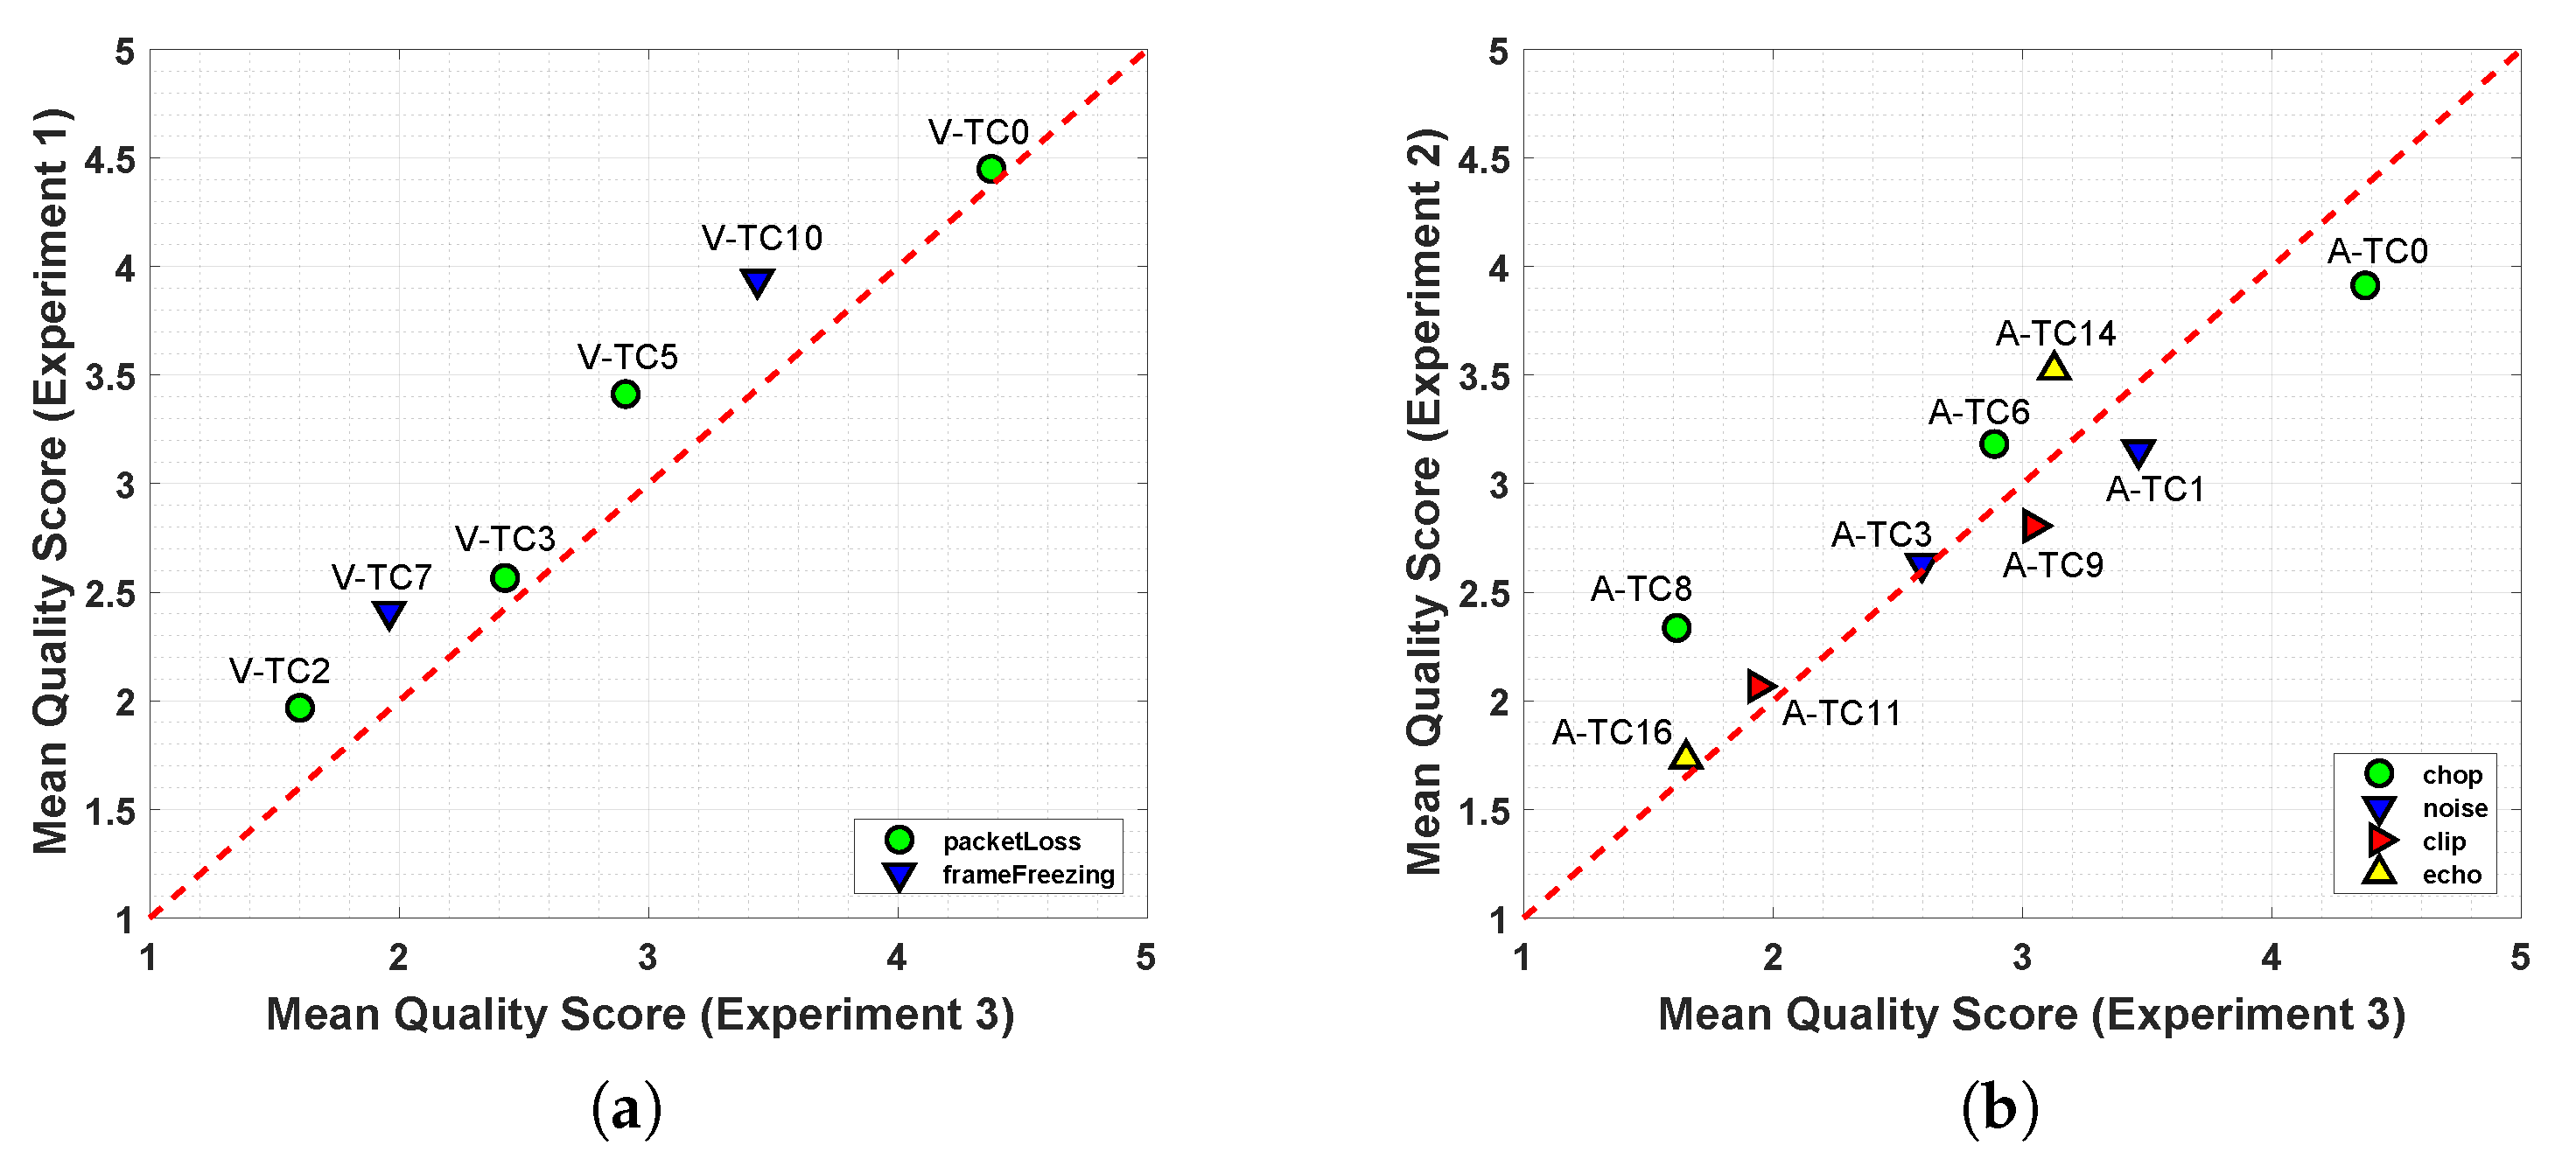
Figure 12. The scatter plot from
Figure 12a shows a positive correlation between results from Experiment 1 and 3, where video distortions are compared. The plot also shows that scores from Experiment 1, with video distortions only, occupied a larger range in comparison to results from Experiment 3 (audio and video distortions). All markers appear above the red line independent of the type of video distortion (packet-loss or frame-freezing).
9.2. On the Auditory Component Effect
This analysis investigates the effect of audio impairments for equivalent A-TCs in Experiments 2 and 3.
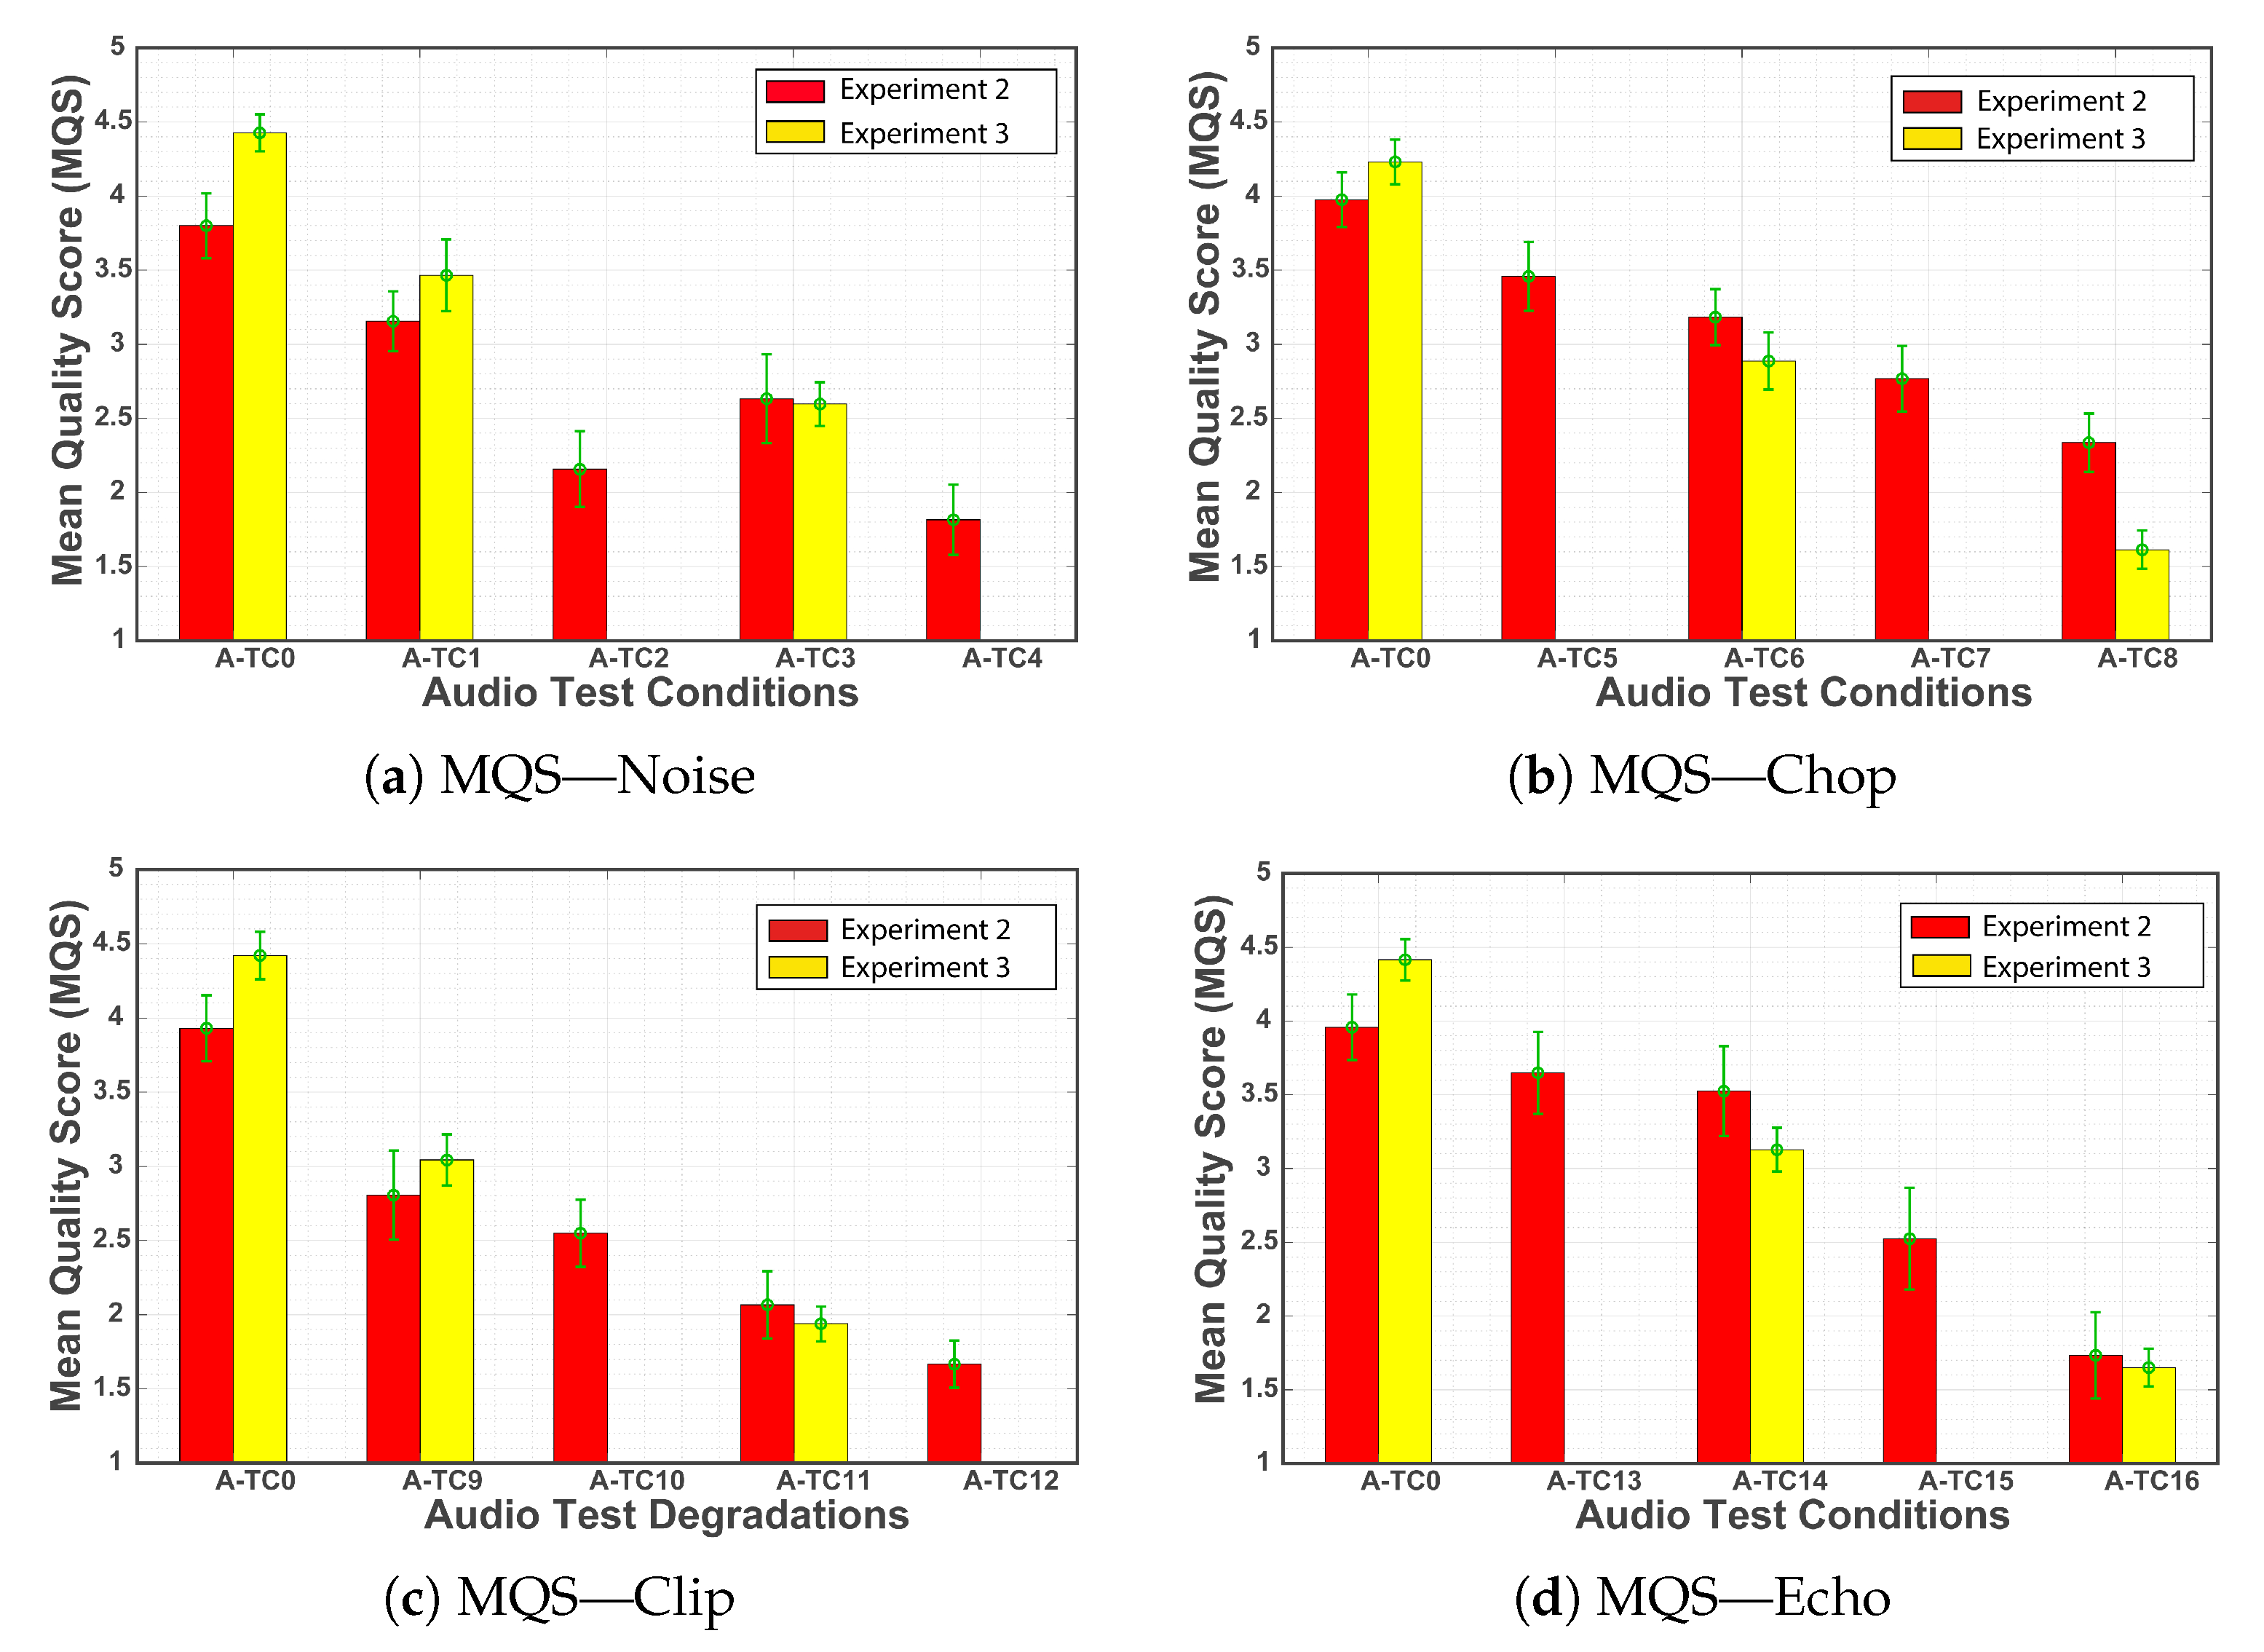
Figure 13 shows a comparison between the
values (MQS among different A-TCs) gathered from these experiments. Similarly to what was done in the previous analysis, we organized the results according to the audio distortion (background noise, chop, clip and echo). The differences between the average
values for the equivalent test conditions in Experiment 2 and Experiment 3 were verified using a Two-sample
t-test analysis.
Table 13 reports this analysis and highlights the equivalent conditions where the difference between results in Experiment 2 and Experiment 3 are significantly different.
Figure 13a shows the results obtained for the background noise distortion. For this scenario, the equivalent test conditions A-TC0 and A-TC1 reported statistically significant differences, as for the case of A-TC3, results were very similar for both experiments. Considering that Experiment 3 included visual distortions in addition to the audio distortions in Experiment 2, results in
Figure 13a suggest that the background noise (audio-only distortions) affected the overall audio-visual quality at a similar level than the background noise plus the visual distortion (audio + video distortions).
Similarly,
Figure 13b presents the quality scores sequences with chop distortions. Results for equivalent test conditions A-TC6 and A-TC8 reported a significant difference in the
t-test analysis. More particularly, results for A-TC8 shows that there is a difference between results with and without video distortions. This might suggest that chop type distortions by themselves do not have a strong impact on the overall quality.
Figure 13c presents the scores for clipping distortions. These results are very similar to the ones observed in the background noise scenario. These results suggest that the combination of clipping and visual distortions (Audio + Video distortions) affected the audio-visual quality at the same level that the clipping distortion on its own (audio-only distortion). None of the equivalent test conditions reported significant differences in the
t-test analysis.
Figure 13d presents the results for echo distortions. Test condition A-TC14, which reported a significant difference, suggests that video distortions had a higher impact on the perceived quality. As for test condition A-TC16, results seem to suggest that the audio distortion (echo) and the audio plus video distortion from Experiment 3 had an equivalent impact on the perceived quality. However, this test condition did not report a significant difference in the
t-test analysis.
One particular detail that is common to all four audio distortion scenarios is the differences between the equivalent V-TC0 test conditions.
Table 13 reports that such differences are statistically significant, plus, in all four cases, a relative higher
average was reported for Experiment 3. One possible interpretation of these results is that commonly, speech and audio perceptual tests tend to present a more narrow range of quality when compared to a video perceptual study [
7]. Indeed, Experiment 2 contains distortions only in the audio component; meanwhile, Experiment 3 combines both audio and video distortions. This is confirmed by results presented in
Figure 11b, where V-TC0 reported a significant difference, only this time it was Experiment 1 (video-only distortions) that had a higher
average when compared to Experiment 3.
As for the correlation of responses between Experiment 2 and Experiment 3,
Figure 12b shows that there is a small positive correlation between quality scores of Experiments 2 and 3. For most test conditions, markers appear above the red line, which indicated that responses for Experiment 2 were higher. Yet, some test conditions (A-TC 9 and A-TC1) of Experiment 2 presented lower quality scores than their equivalent test conditions in Experiment 3. All in all, results showed that some types of audio distortions have a greater impact on quality. More specifically, background noise and clipping distortions presented a similar impact on the overall audio-visual quality when compared to their equivalent test conditions with visual distortions.
9.3. On the Quality and Content Range of Assessment
This analysis is focused on comparing the quality and content responses of Experiments 1, 2, and 3. To this end, we gather the quality and content range from all three Experiments.
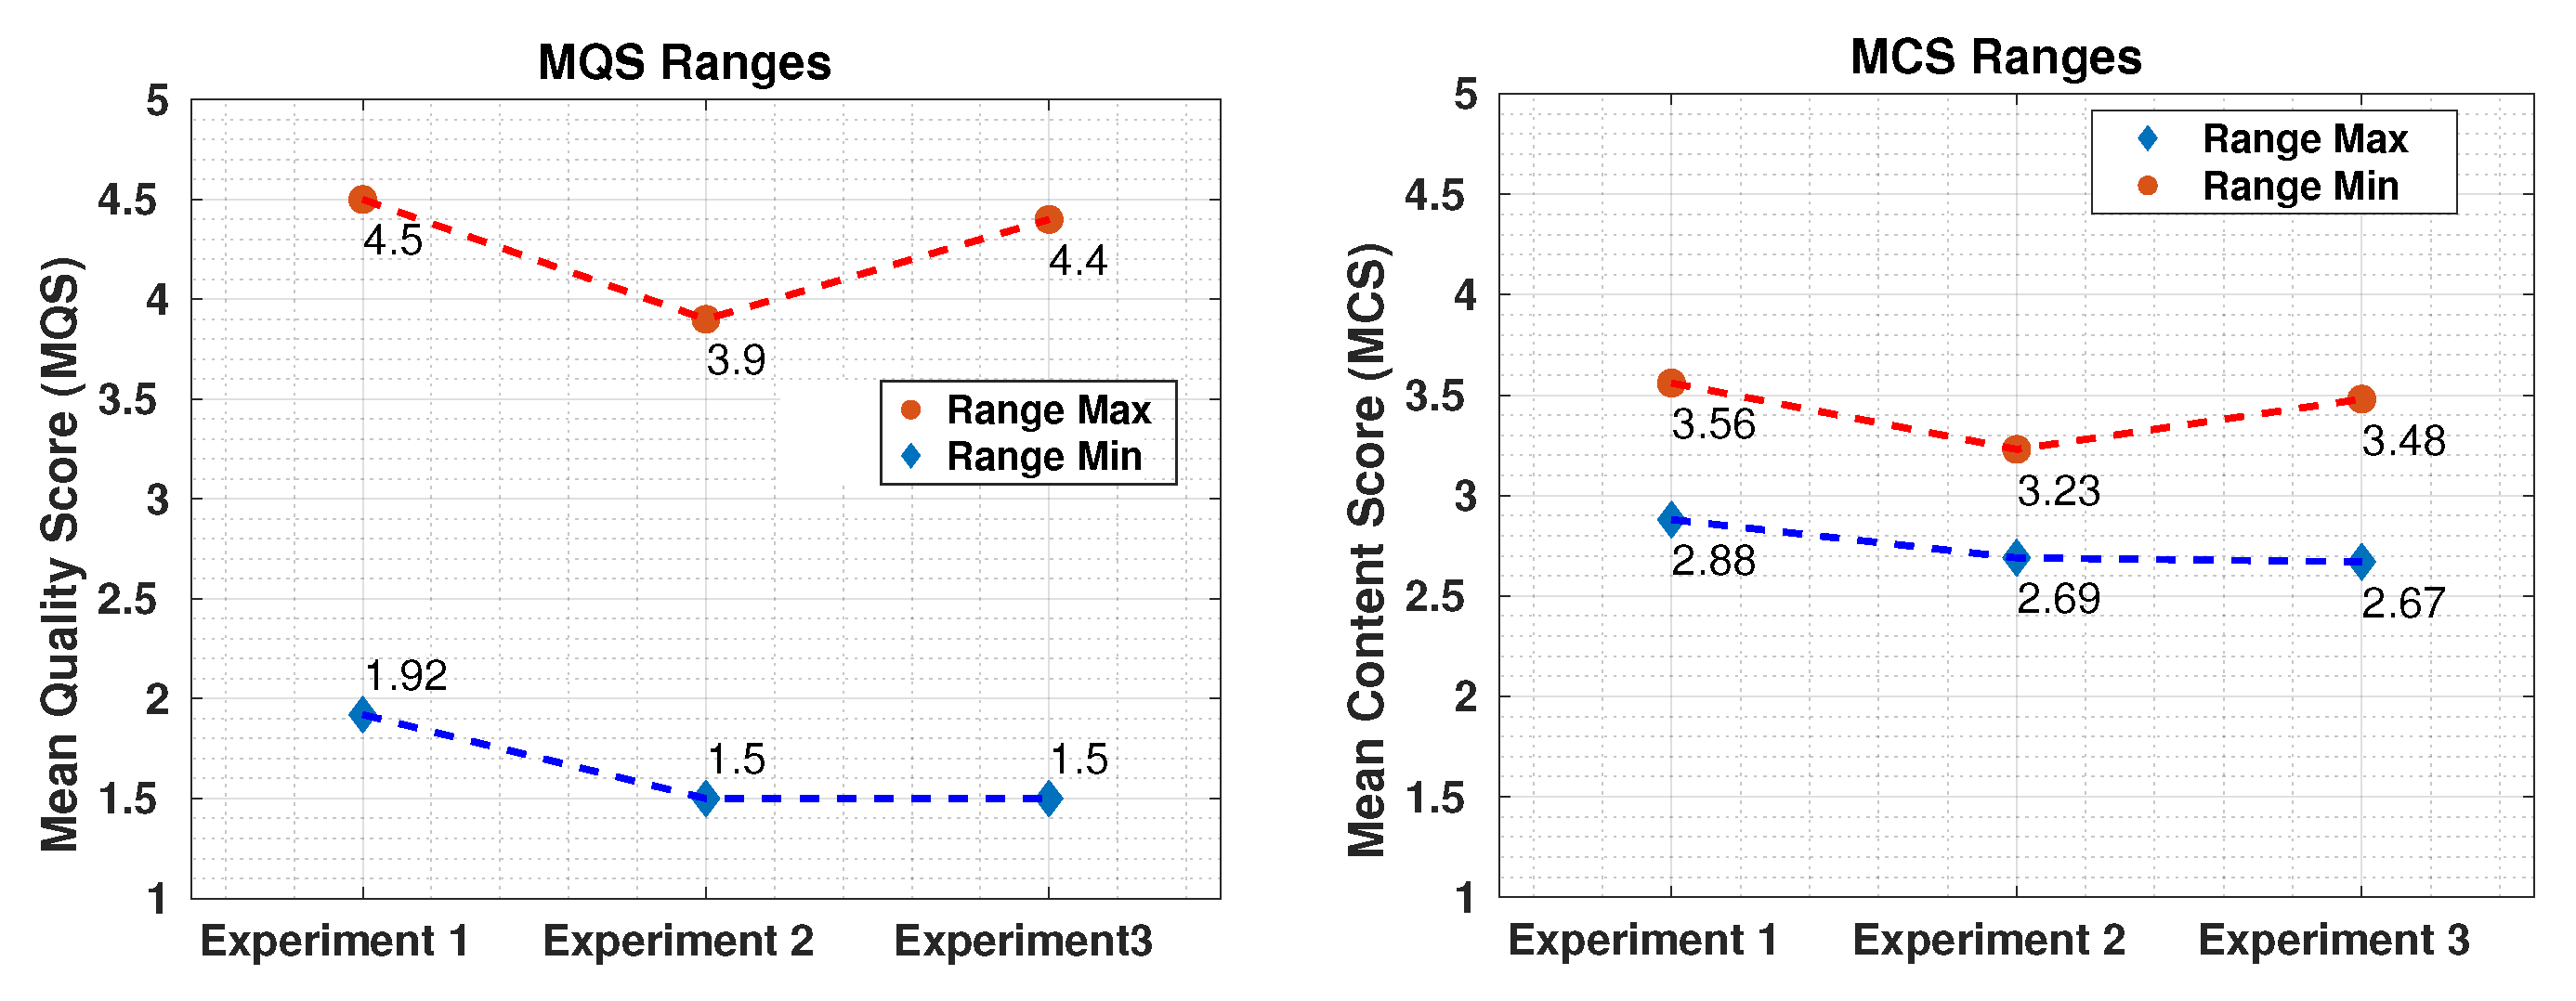
Figure 14 presents a comparison of the ranges of the MQSs gathered in Experiments 1, 2, and 3. It can be observed that the MQS ranges for Experiments 1 and 2 (2.58 and 2.4, respectively) are similar. However, there is a negative difference of 0.6 points (maximum range) and 0.42 points (minimum range) in the MQS scale from Experiment 1 to Experiment 2. More interestingly, by comparing the MQS ranges of Experiments 1–3, it can be observed that the range of Experiment 3 overlaps the ranges of Experiments 1 and 2. More specifically, the range of Experiment 3 varies from the minimum range limit of Experiment 2 (1.5) to almost the maximum range limit of Experiment 1 (4.4). This behaviour can also be observed for the MCS range in
Figure 14, but at a smaller intensity. As mentioned earlier, there is a correspondence between quality and content scores that needs to be further studied. Overall, this analysis shows that audio-visual quality and content (at a certain level) ranges encompass the audio and video ranges. As stated in the previous analysis, the smaller range of the perceived quality in Experiment 2 might be related to the inclusion of only audio distortions in the sequences.
9.4. On the Internal Consistency and External Comparison
In order to evaluate the reliability of the results of this study, the agreement among subjects on their quality perceptions responses is reported. To do so, the internal consistency of the perceptual responses from all three experiments was calculated using the Cronbach’s alpha coefficient [
66]. In addition, these results are compared with external perceptual responses gathered from the literature. To this end, perceptual data from VQEG-MM [
19], UnB-2013 [
25], INRS [
44], and LIVE-NFLX-II [
24] were considered for comparison.
The Cronbach’s alpha coefficients for these datasets are reported in
Table 14. The interpretation of the results can be made using these criteria: coefficients between 0.00 and 0.69 are associated with a poor internal consistency, a fair internal consistency is associated with coefficients between 0.70 and 0.79, good internal consistency ranges from 0.80 and 0.89, and an excellent internal consistency is associated with coefficients between 0.90 and 1 [
67,
68].
From the results presented in
Table 14, it can be observed that, in general, all studies presented results with a good level of internal consistency (coefficient
above 0.8). In addition, the experiments conducted using the datasets VQEG-MM, LIVE-NFLX-II, and UnB-2018 (Experiment 1) presented an excellent level of internal consistency (coefficient
above 0.90). This indicates that subjects agreed on the quality score when the quality levels, represented by the HRCs, were shifted. If we consider the number of different distortions included in each perceptual experiment, plus the number of test conditions they used (summary of audio-visual studies in
Table 2), the quality scores gathered using the UnB-2018 dataset gain more relevance. These results support the reliability of the scores collected in this study. In addition, they validate the application of an immersive approach and encourages the execution of more experiments using this type of methodology.
10. Conclusions
In this paper, we compile and analyze the results of three psychophysical experiments designed to measure the perceived overall audio-visual quality of sequences. In these experiments, impairments were inserted in the audio and/or the visual component of the sequence. An statistical analysis allowed us to understand how audio and video distortions affected the overall audio-visual quality individually and jointly.
A separate analysis of the distortions confirmed that visual degradations significantly impact the overall perceived audio-visual quality. Audio impairments seemed to have a weaker effect on the overall audio-visual quality, although certain degradations (Background noise and Clipping) showed a stronger effect. We can say that these effect is independent of the type of content since these experiments were conducted using a large amount of different content material. It was also observed that participants agree more in their responses when only visual distortions were present (Experiment 1). Whenever audio distortions were introduced (Experiments 2 and 3), participants had more trouble distinguishing the different levels of quality.
A joint analysis allowed us to compare the effects of equivalent test conditions in the presence (or absence) of audio and visual degradations. Audio distortions had a clear effect when responses from sequences with video-only and Audio + Video distortions (with equivalent visual distortions) were compared. Similarly, when comparing the results from sequences with audio-only and audio + video distortions, we noticed that Background noise and Clipping, by themselves, had an effect that was equivalent to the same audio degradation plus the visual distortion. Based on these results, we can assert that visual distortions are not always fully responsible for the overall perceived audio-visual quality. We observed that for certain audio degradations, the overall perceived quality was determined by the audio distortions. This aspect requires a deeper analysis that might include an analysis per-content to verify the real impact of such degradations. Finally, an internal consistency analysis of the quality scores showed a high level of reliability, despite the large number of distortions and test conditions considered for the study.
The following abbreviations are used in this manuscript:


