Article

A New Methodological Approach to Correlate Protective and Microscopic Properties by Soft X-ray Microscopy and Solid State NMR Spectroscopy: The Case of Cusa’s Stone

by
Veronica Ciaramitaro
1,
Alberto Spinella
2,*,
Francesco Armetta
1,*,
Roberto Scaffaro
3,
Emmanuel Fortunato Gulino
3,
George Kourousias
4,
Alessandra Gianoncelli
4,
Eugenio Caponetti
1,5 and
Maria Luisa Saladino
1
1
Department of Biological, Chemical, and Pharmaceutical Sciences and Technology (STEBICEF), University of Palermo, Viale delle Scienze Bld.17, I-90128 Palermo, Italy
2
Advanced Technologies Network (ATeN) Center, University of Palermo, Viale delle Scienze Bld.18, I-90128 Palermo, Italy
3
Department of Engineering, University of Palermo, Viale delle Scienze Bld. 6, I-90128 Palermo, Italy
4
Elettra—Sincrotrone Trieste, Strada Statale 14-km 163,5 in AREA Science Park, Basovizza, I-34149 Trieste, Italy
5
Labor Artis C.R. Diagnostica S.R.L., Via Celona, I-90145 Palermo, Italy
*
Authors to whom correspondence should be addressed.
Appl. Sci. 2021, 11(13), 5767; https://doi.org/10.3390/app11135767
Submission received: 27 May 2021 / Revised: 11 June 2021 / Accepted: 16 June 2021 / Published: 22 June 2021

Abstract

:
Hydrophobic treatment is one of the most important interventions usually carried out for the conservation of stone artefacts and monuments. The study here reported aims to answer a general question about how two polymers confer different protective performance. Two fluorinated-based polymer formulates applied on samples of Cusa’s stone confer a different level of water repellence and water vapour permeability. The observed protection action is here explained on the basis of chemico-physical interactions. The distribution of the polymer in the pore network was investigated using scanning electron microscopy and X-ray microscopy. The interactions between the stone substrate and the protective agents were investigated by means of solid state NMR spectroscopy. The ss-NMR findings reveal no significant changes in the chemical neighbourhood of the observed nuclei of each protective agent when applied onto the stone surface and provide information on the changes in the organization and dynamics of the studied systems, as well as on the mobility of polymer chains. This allowed us to explain the different macroscopic behaviours provided by each protective agent to the stone substrate.

1. Introduction

The protection of ancient stone monuments and objects is one of the topics of the recent research in the field of conservation of cultural heritage [1]. Stone materials are affected by degradation processes such as black crusts, efflorescents, decoesions, etc., caused by several chemical, physical, and biological factors. Among others, water is one of the main causes of degradation, playing an important role in many decay mechanisms [2]. It acts in a direct way through a solubilization action and in an indirect way through freeze/thaw cycles, pollutant transport, and soluble salt hydration. In addition, water may promote the growth of biological organisms which may cause material degradation.
It is well known that hydrophobic treatment is one of the most important interventions usually carried out in the conservation of stone artefacts and monuments, preserving them against the water [3,4]. The choice of hydrophobic products should be aimed at preventing liquid water penetration, to allow vapour leakage, delaying degradation processes, and to avoid chromatic alterations, leaving open at the same time the stone porosity for water vapour flow [5,6]. Nowadays, the use of hydrophobic polymers is generally accepted as being suitable due to their protective action, even if the direction of the research is also aimed at the development of innovative and inorganic materials [7]. The evaluation of protection actions is based on the regulations by the European Committee for Standardization (CEN TC 346) [8,9].
Calcarenites are used in the most important testimony of ancient and modern monuments of Sicilian history. The different lithotypes, possessing different porosity and mineralogical features [10], are present both in the east (Noto “white type” and Comiso) and in the west (Palermo, Mazara, Agrigento, Cusa).
Indeed, the performance of a polymeric protective can be different for different lithotypes, as demonstrated in our previous papers [11,12]. In most cases, the choice of the best protective is made based on a compromise between several factors, such as hydrophobicity and aesthetic appearance [13].
The reason for the different behaviour of different protectives concerning one specific lithotype could be seen in the different microscopic interactions that occur, which could also be connected with the macroscopic behaviour [14].
The interactions between the two materials (stone and polymer) can be responsible for the variations in the structural organization of the polymers when they are in contact with the stone surface, and these can depend not only on chemical factors but also on physical factors related to the porosity and dimensional distribution of pores [15].
For this reason, the goal of this work is to verify the connections between the macroscale properties and the microscale properties of protected stone material. The work is carried out on Cusa’s stone, a calcarenite coming from the ancient and renowned quarries of Cusa near the acropolis of Selinunte (TP), used for the construction of most of the temples in the archaeological park of Selinunte, the largest in Europe [16], in particular, Temple G, which is one of the most impressive temples of Magna Grecia.
In our previous paper, the effectiveness of the protective treatment of three formulations (the polysiloxane Wacker 290 and two fluorinated elastomers, Fluoline HY and Fluo AQ of CTS s.r.l.) was investigated using water absorption by capillarity, water vapour permeability and colorimetric tests [12]. The obtained results show that all three formulations conferred protective properties, but Fluo AQ is the protective agent giving the best performance. The Fluo AQ guarantees a permeability similar to that of natural stone and drastically reduces the water absorption, thus giving it high water repellence. Conversely, the Fluoline HY significantly reduces the water vapour permeability of the stone and shows little water repellence.
Here, the distribution of the polymer in the pore network was investigated by scanning electron microscopy and X-ray microscopy. Scanning electron microscopy studies provide relevant clues about the location of the products inside the porous matrix of stones [17,18]. However, in order to conduct a more in-depth investigation and obtain information concerning, for example, the adhesion of products to stone grains, the use of advanced techniques like X-ray microscopy allows us to improve the amount and quality of the acquired information in terms of the dimensional scale of investigation and identifiable chemical elements [19,
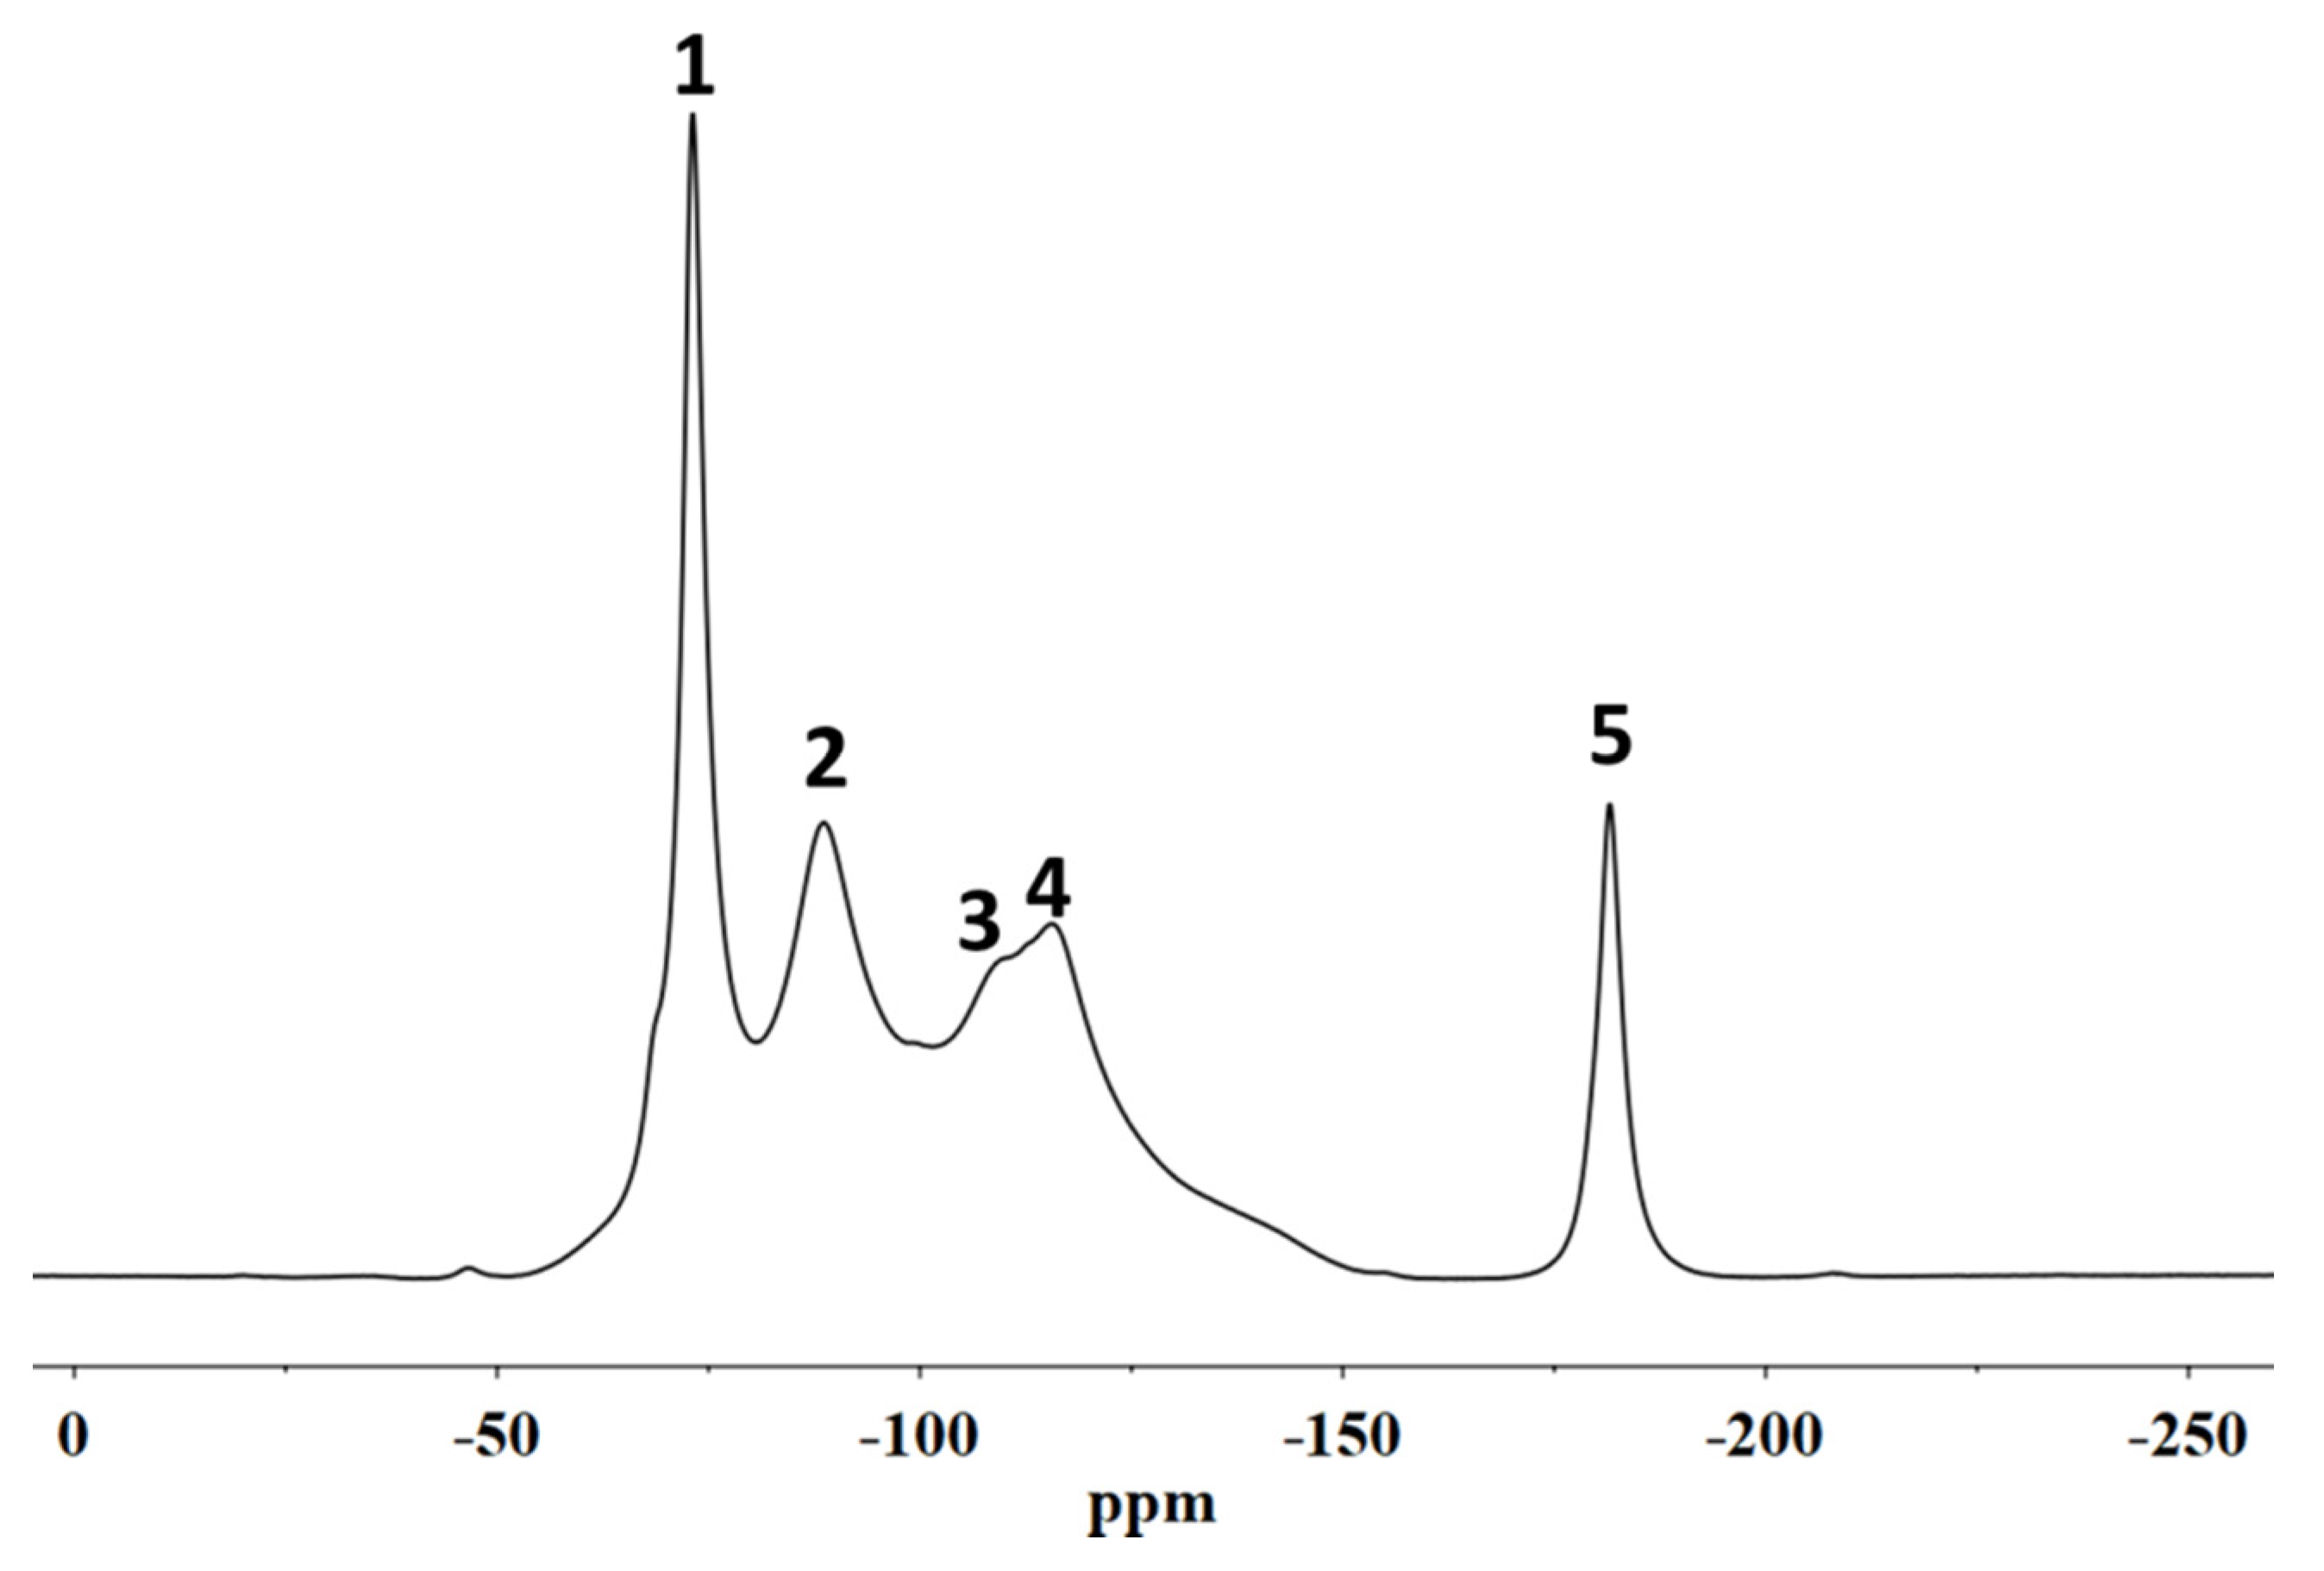
20]. The characterization of the fluorinated polymeric materials and their structural organization following the interactions with the stone substrate was performed using solid state NMR. In particular, 19F MAS NMR spectroscopies allowed us to analyse the molecular interactions involving the polymer directly on the coated stone surface. In addition, the spin–lattice relaxation times, T1, and the spin–spin relaxation times, T2, were evaluated in order to provide information on the variations of the mobility of both the backbone chains of the polymers and the side chains, respectively. In fact, the variation of the polymer chain mobility can act as evidence of their different structural organization when they are applied on the porous system [21], suggesting the formation or not of a homogeneous surface film that justifies the water repellence or an accumulation of the material inside the pores that it could cause a significant reduction in the water vapour permeability of the stone.

2. Materials and Methods

2.1. Polymer Formulations

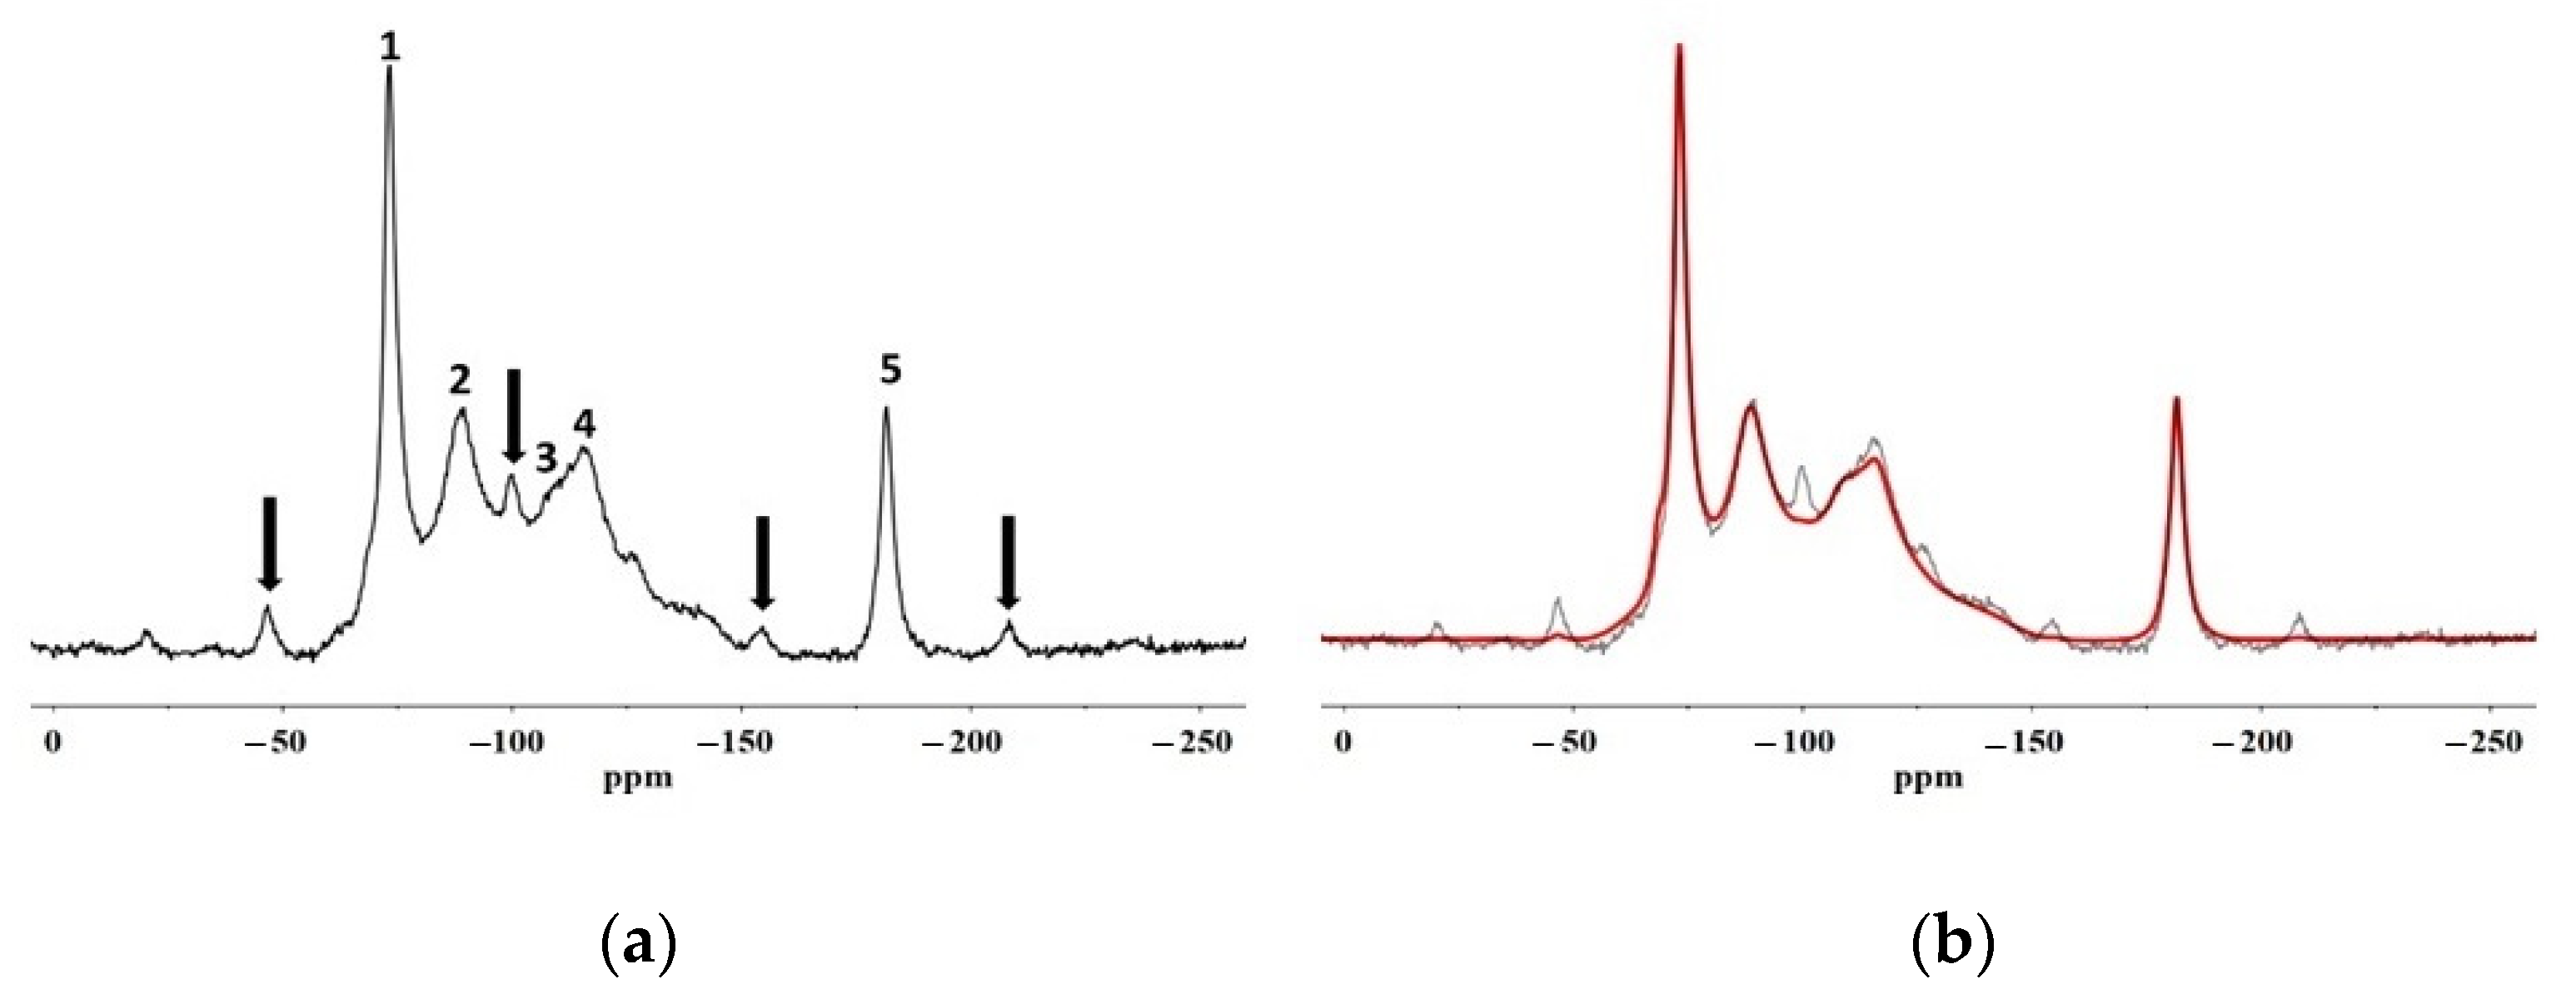
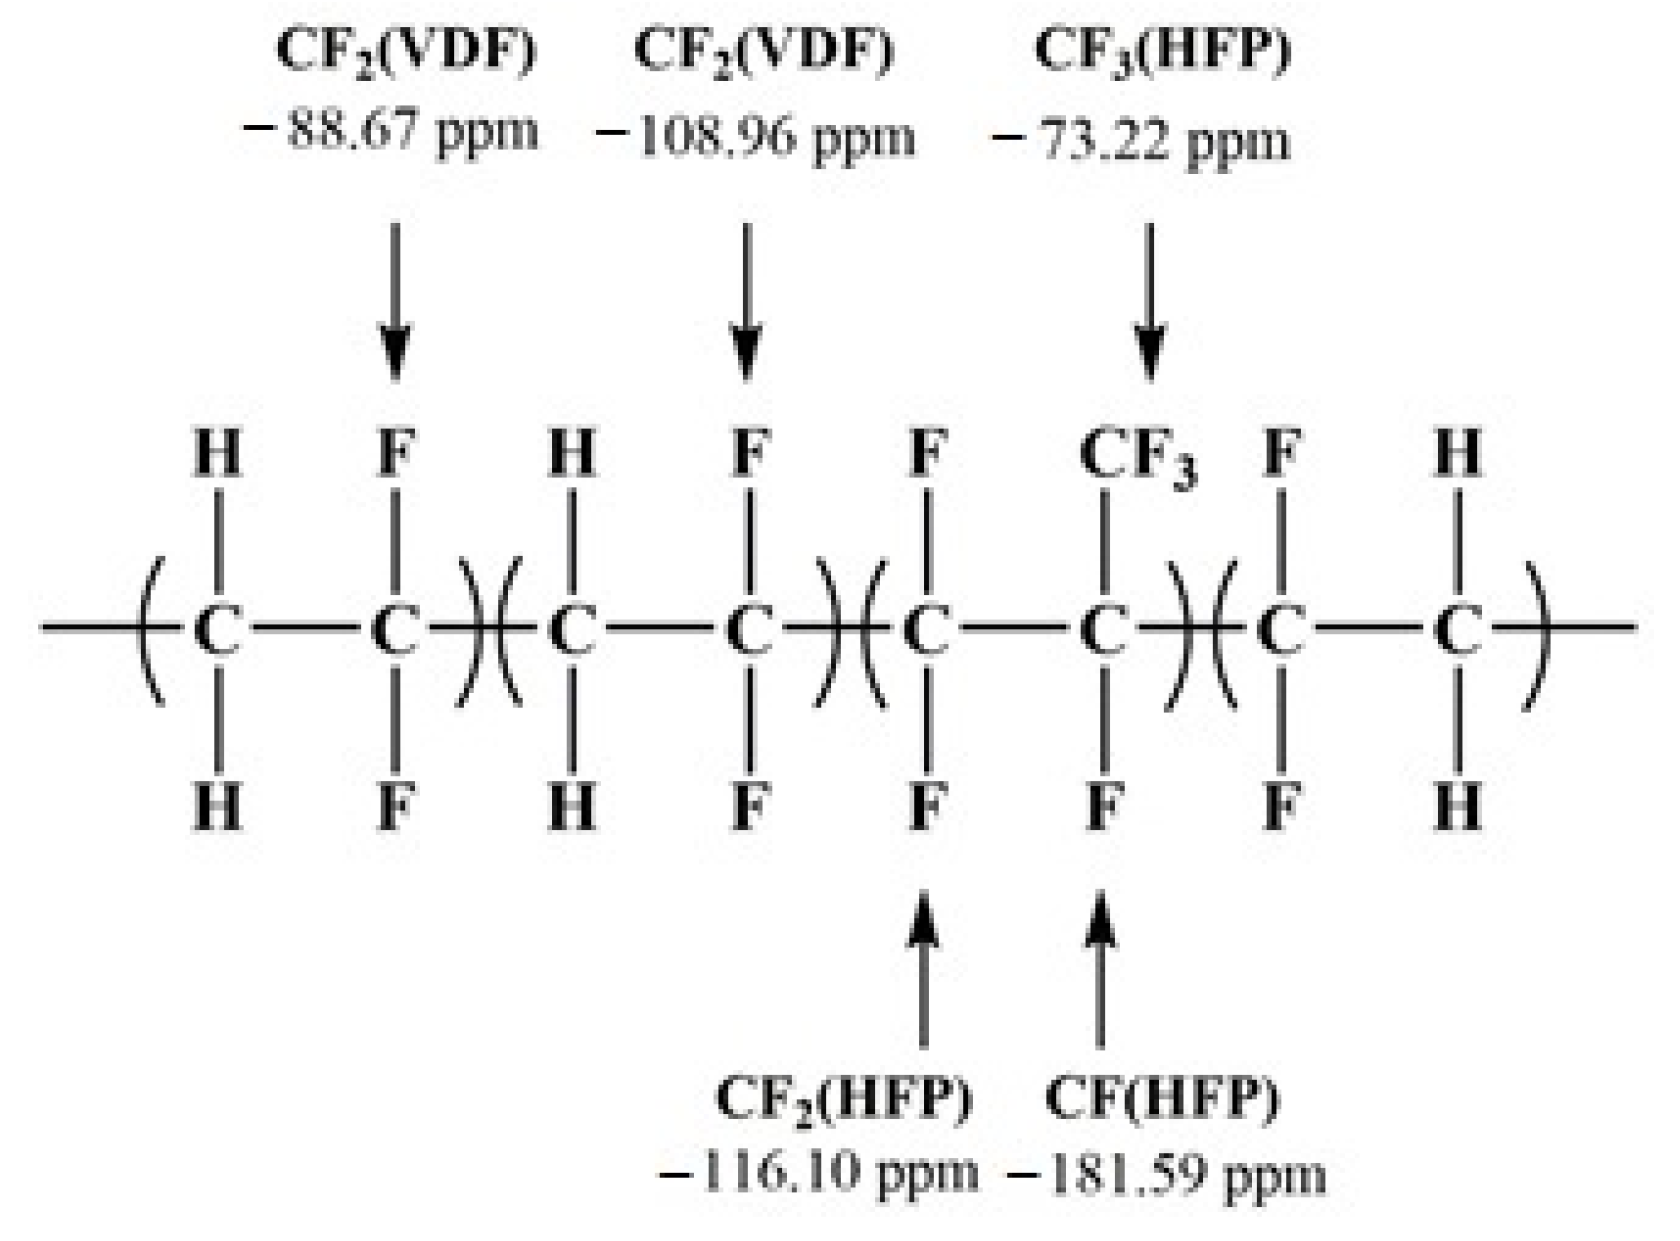
The two protective polymer formulations were provided by CTS s.r.l. The Fluoline HY® is a commercial protective agent based on a fluorinated elastomer consisting of vinylidene fluoride and hexafluoropropene copolymers at 3 wt.% in a 1:1 mixture (w/w) of acetone/butyl acetate. The Fluo AQ is a protective product under testing based on a fluorinated elastomer dispersed in water, with a concentration of the active content of about 5 wt.%.

2.2. Distribution of Polymers Inside the Porous Matrix of Stone

In order to investigate the distribution of the polymer inside the stone matrix by means of scanning electron microscopy and soft X-ray synchrotron microscopy, the specimens of the stone treated with fluorinated polymers were cut to obtain a 1 mm thick cross section cut perpendicularly to the treated surfaces, spanning to a depth of 5 mm, showing both external and internal parts of the stone. The dimensions were properly tailored to enable performing the correct placement in the sample stage of the equipment.

2.3. Scanning Electron Microscopy (SEM)

The cross sections were observed in scanning electron microscopy by using a Phenom Pro X, Phenom-World (Eindhoven, The Netherlands) with an optical magnification range of 20–135×, an electron magnification range of 80–130,000×, maximal digital zoom of 12×, acceleration voltages of 15 kV, a backscattered electron detector (BSD) and energy dispersive X-ray spectrometer (EDS) detectors, with a nominal resolution of 10 nm or less. The microscope was equipped with a temperature-controlled (25 °C) sample holder. The samples were positioned on an aluminium stub using adhesive carbon tape.

2.4. Soft X-ray Synchrotron Microscopy (Elettra)

The TwinMic microscope [22] was set up in reflection mode by using the method proposed by Raneri et al. [
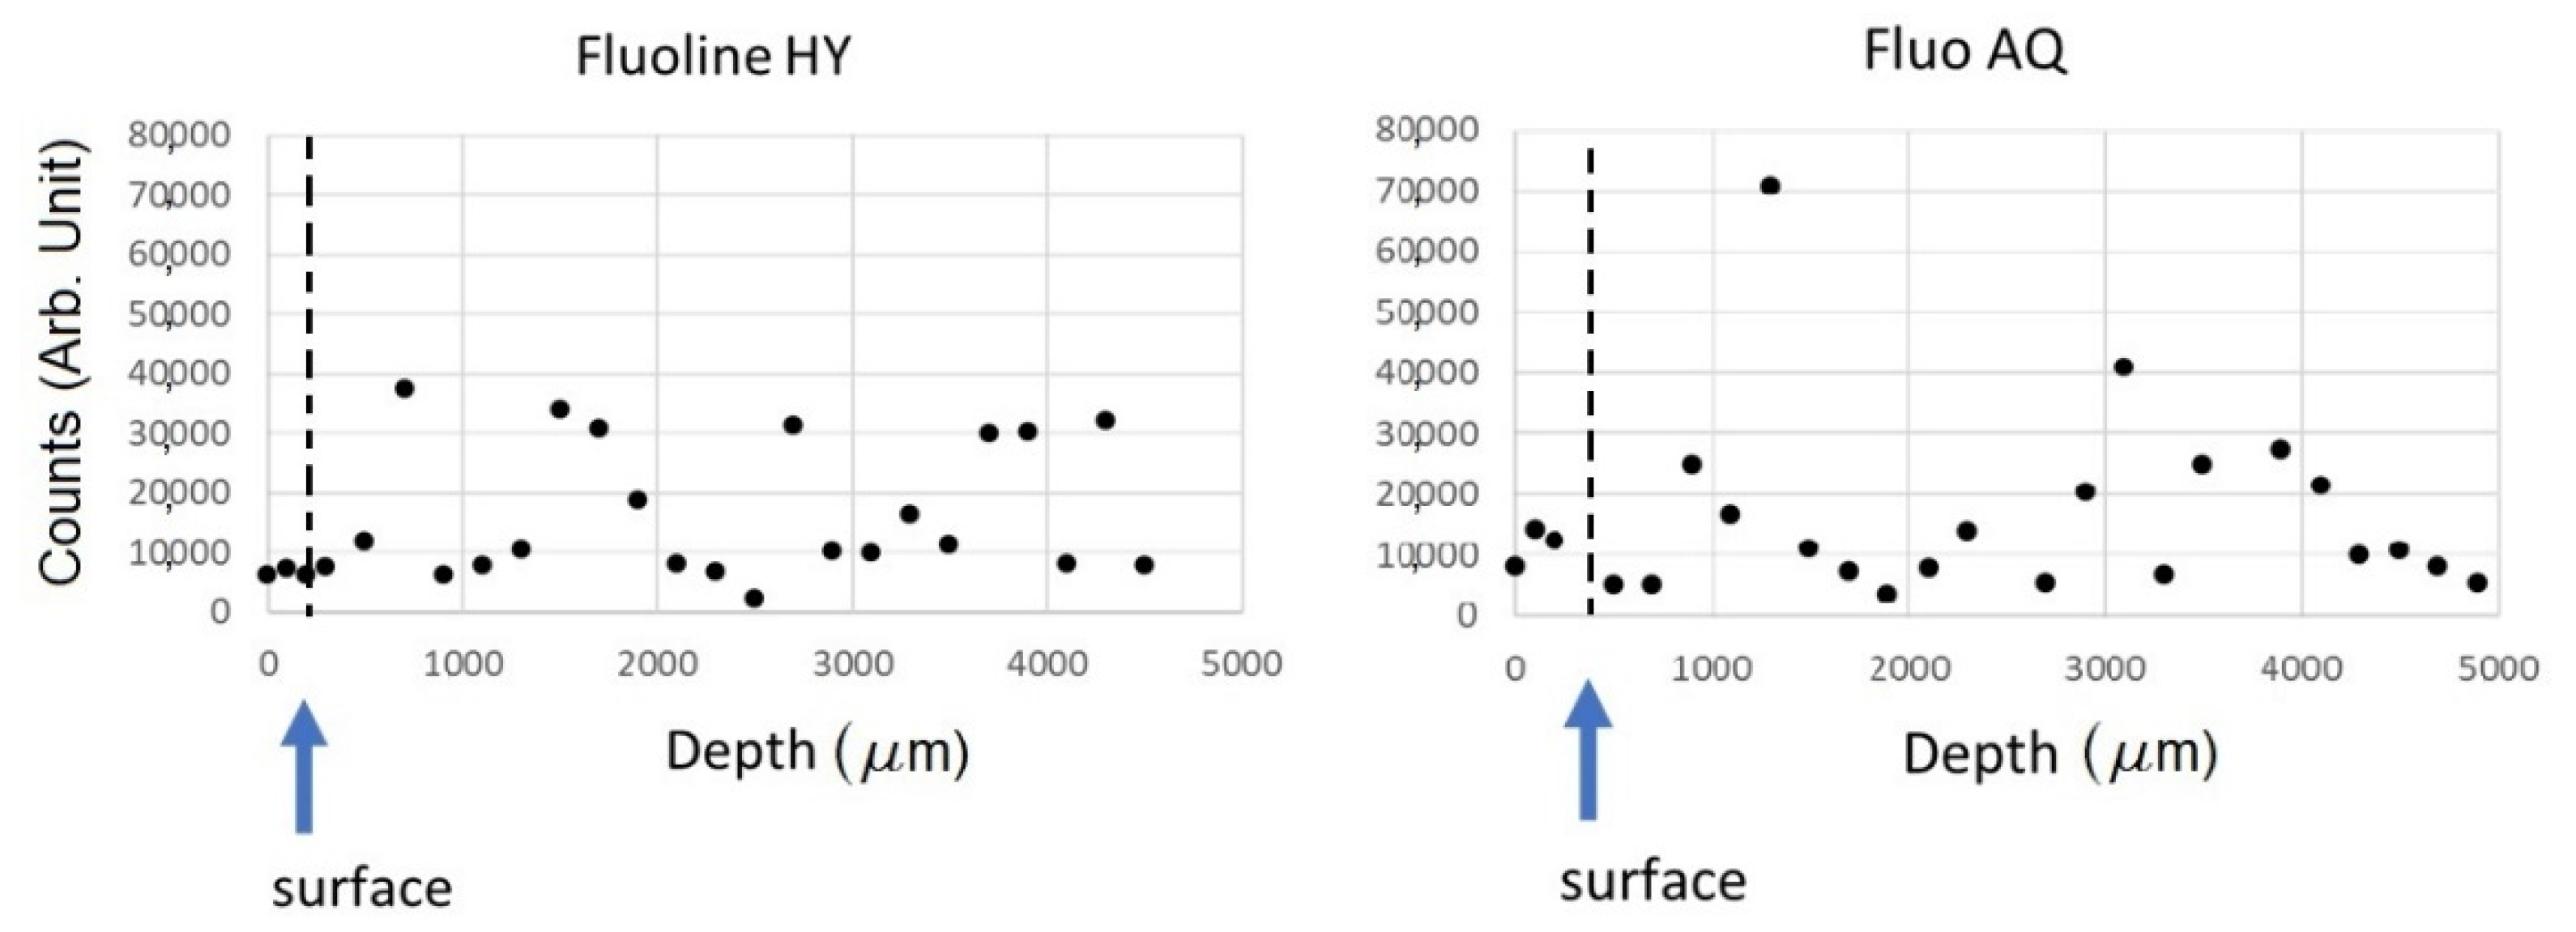
23]. The microscope operated in scanning mode. A zone plate with diffractive optics of 600 microns in diameter and a 50 nm outermost zone focused the incoming monochromatized X-ray photons on the sample plane, while the sample was raster scanned across the microprobe. Perpendicular profiles of the stone section were recorded at 1 keV energy X-ray source by collecting the X-ray fluorescence signal, where the highest sensitivity to fluorine was obtained. The X-ray fluorescence (XRF) spectra were acquired for areas at different depths from the surface. On one of the samples, XRF maps were acquired also at 2 keV on 18 adjacent zones, 80 × 80 µm2 each, and then were post-processed by merging and stitching all of them into a single image, covering a total area of 240 × 480 µm2. XRF maps were acquired in several zones, at different depth from the surface, at 1 and 2 keV with a spot size of 1.2 or 2 microns in diameter, respectively, and 4 s acquisition time per pixel. All XRF spectra were analysed by PyMCA software [24], determining the areas of the elements’ peaks after background subtraction.

2.5. Characterization of Polymer Formulations

The two polymer formulations were characterized in the form of polymeric films in order to simulate the coating on the surface of the substrate stone. The polymeric films were obtained by pouring 30 g of each formulation into a capsule of a 10 cm diameter Petri dish and evaporating the solvent under a ventilated hood at room temperature.

2.6. Study of Interactions

The interactions between the stone substrate and each protective agent were investigated using two samples obtained by cutting the surface layer of two specimens treated with Fluoline HY and Fluo AQ, respectively, using a Dremel mini drill.

2.7. Solid-State NMR Spectroscopy

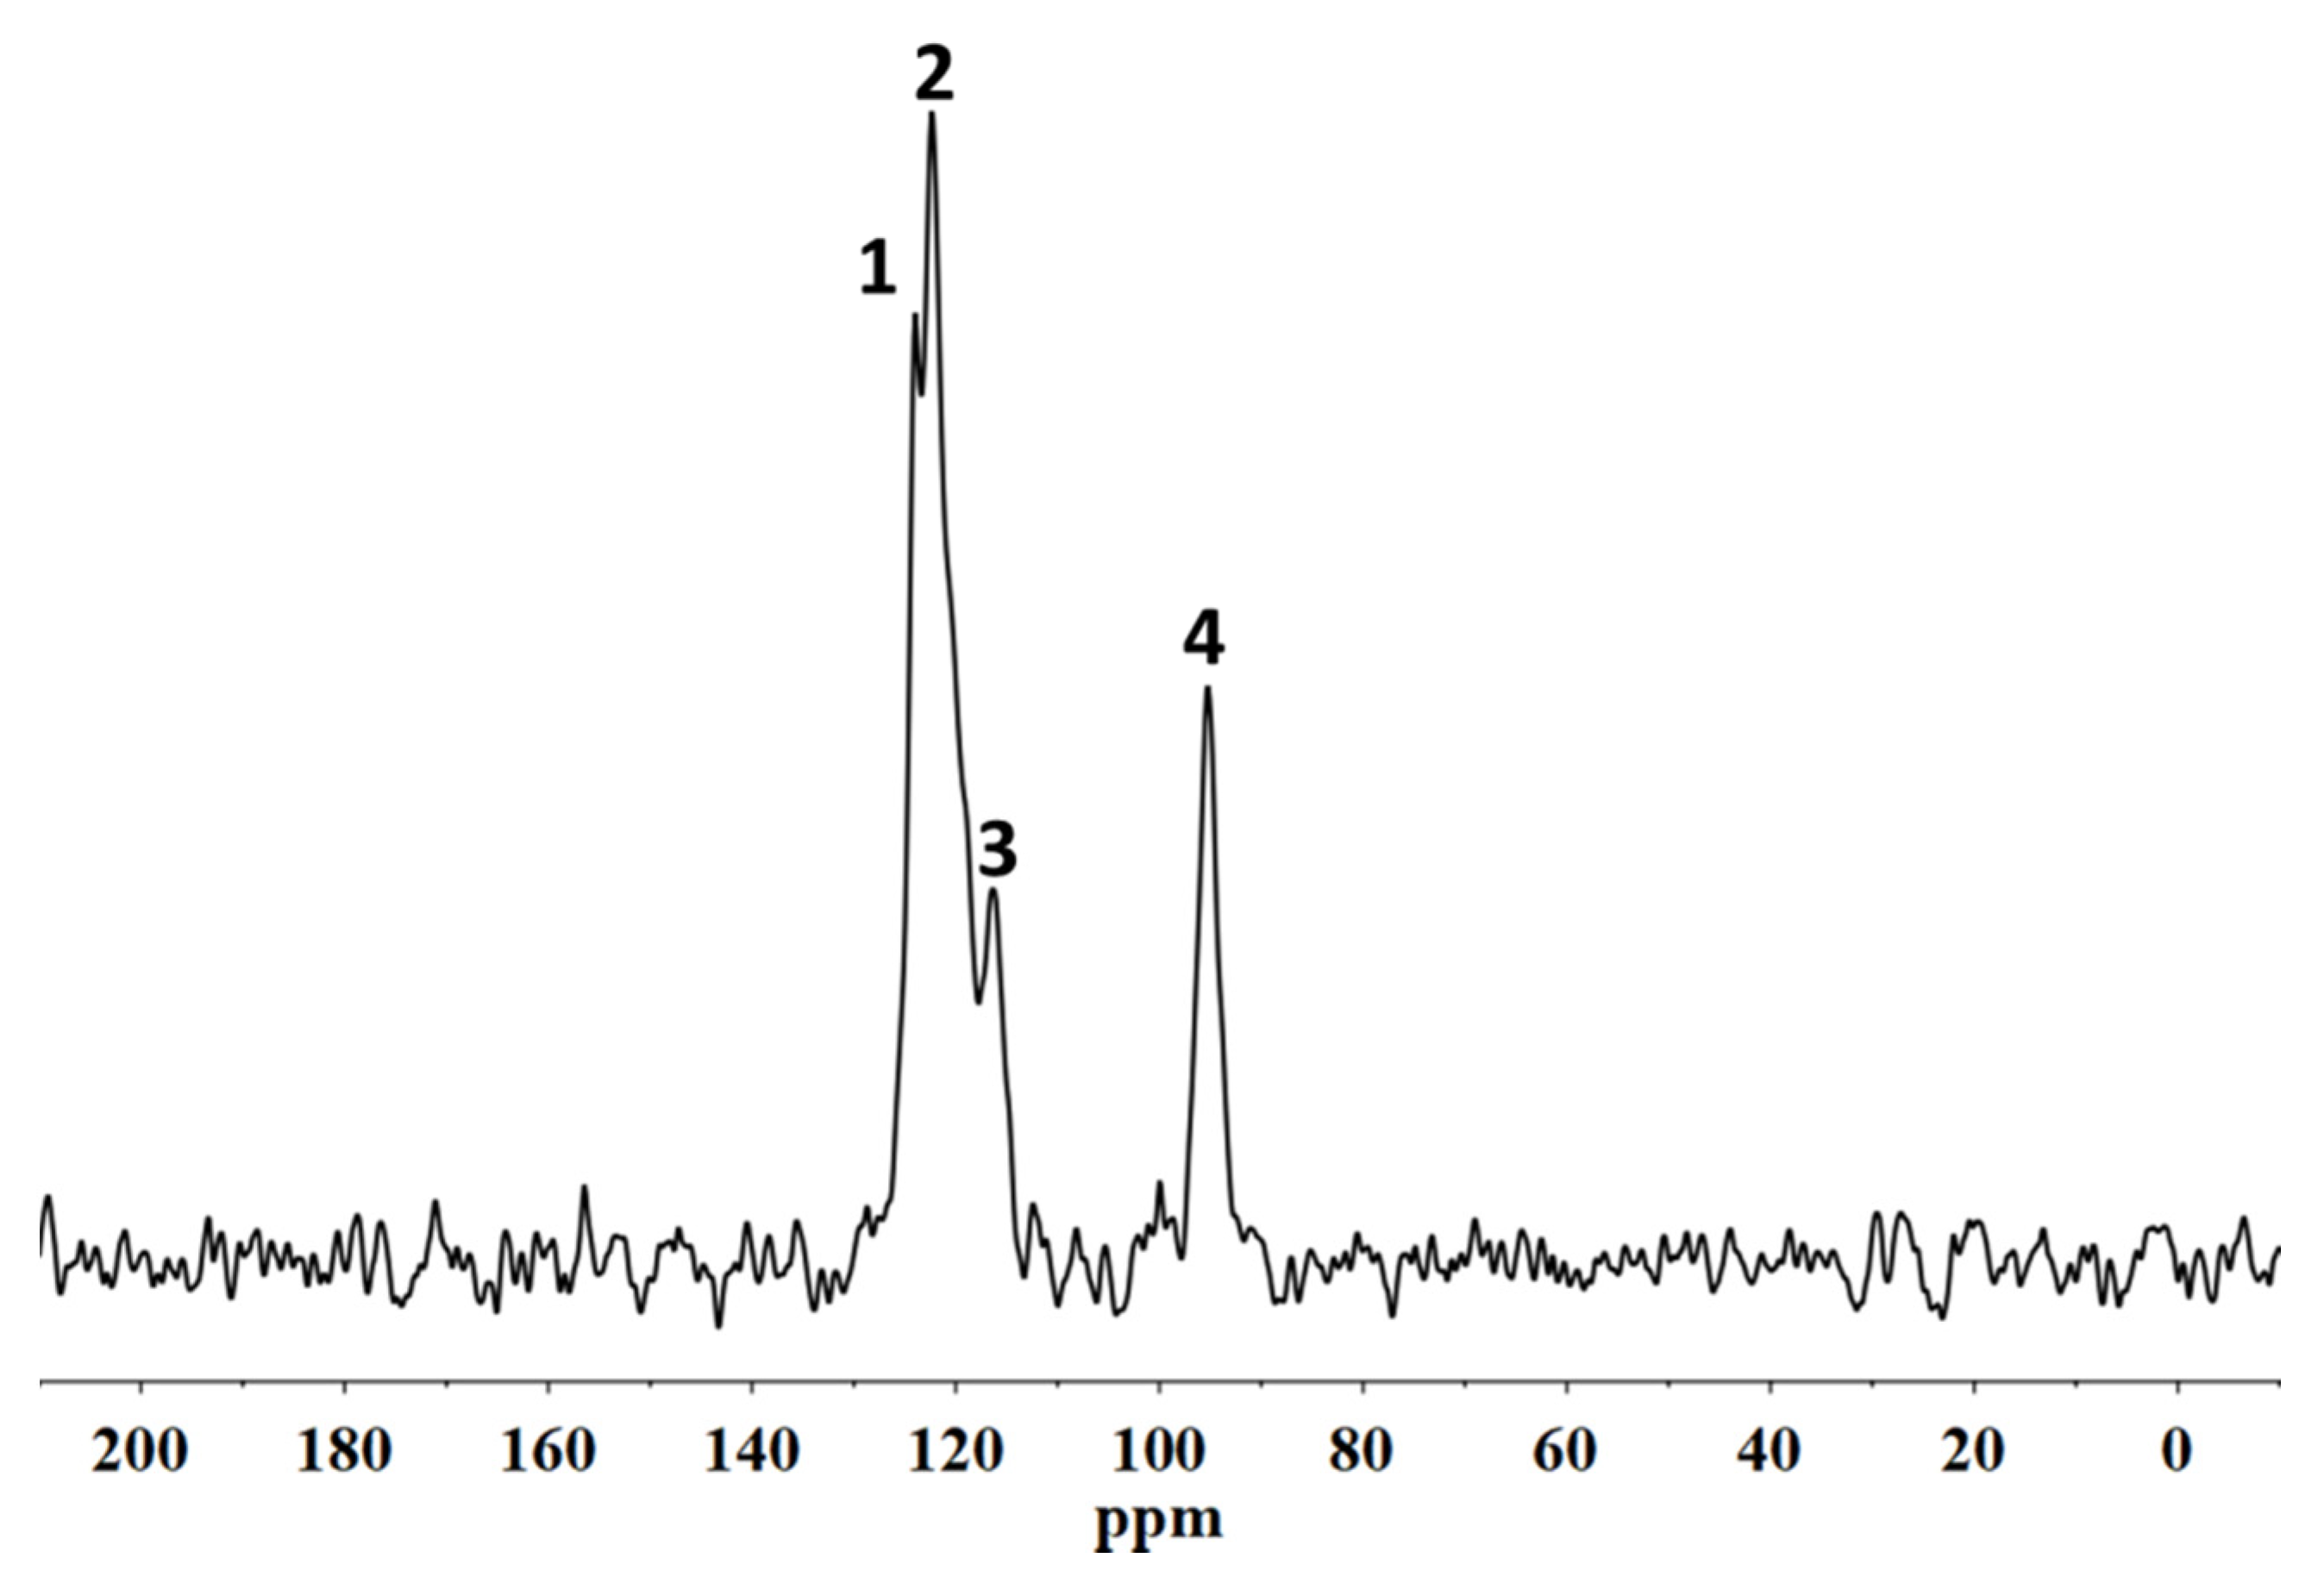
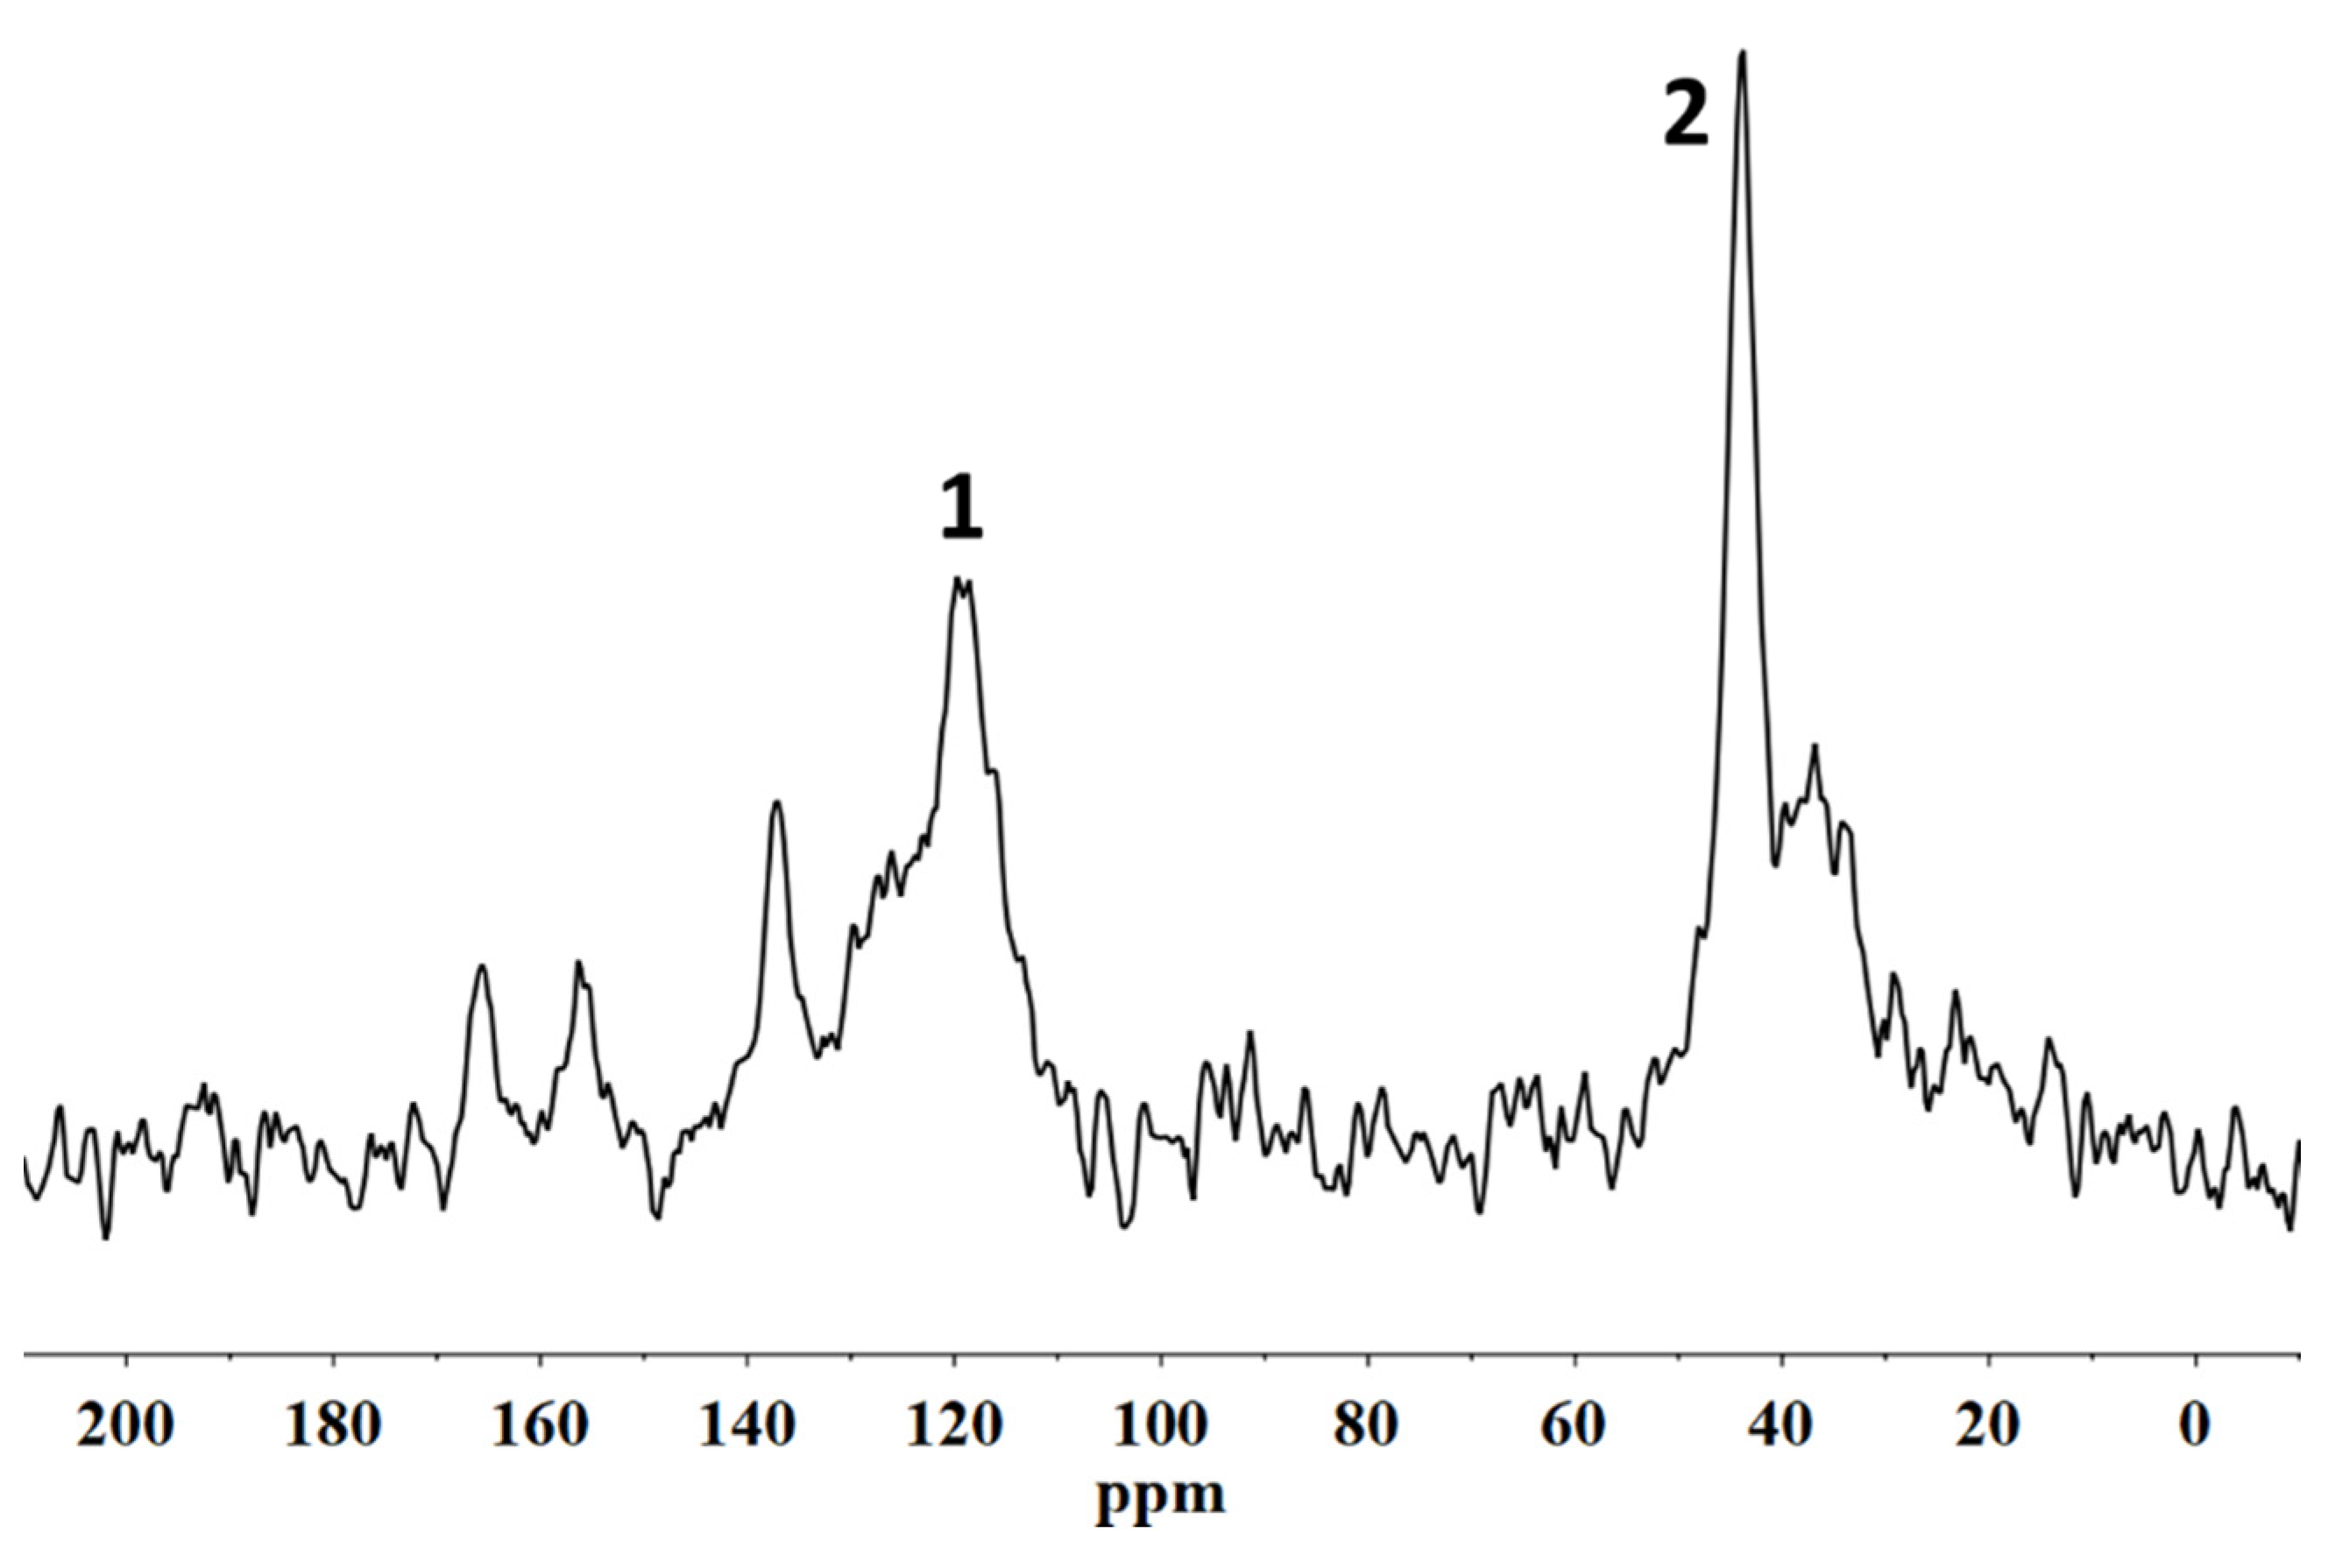
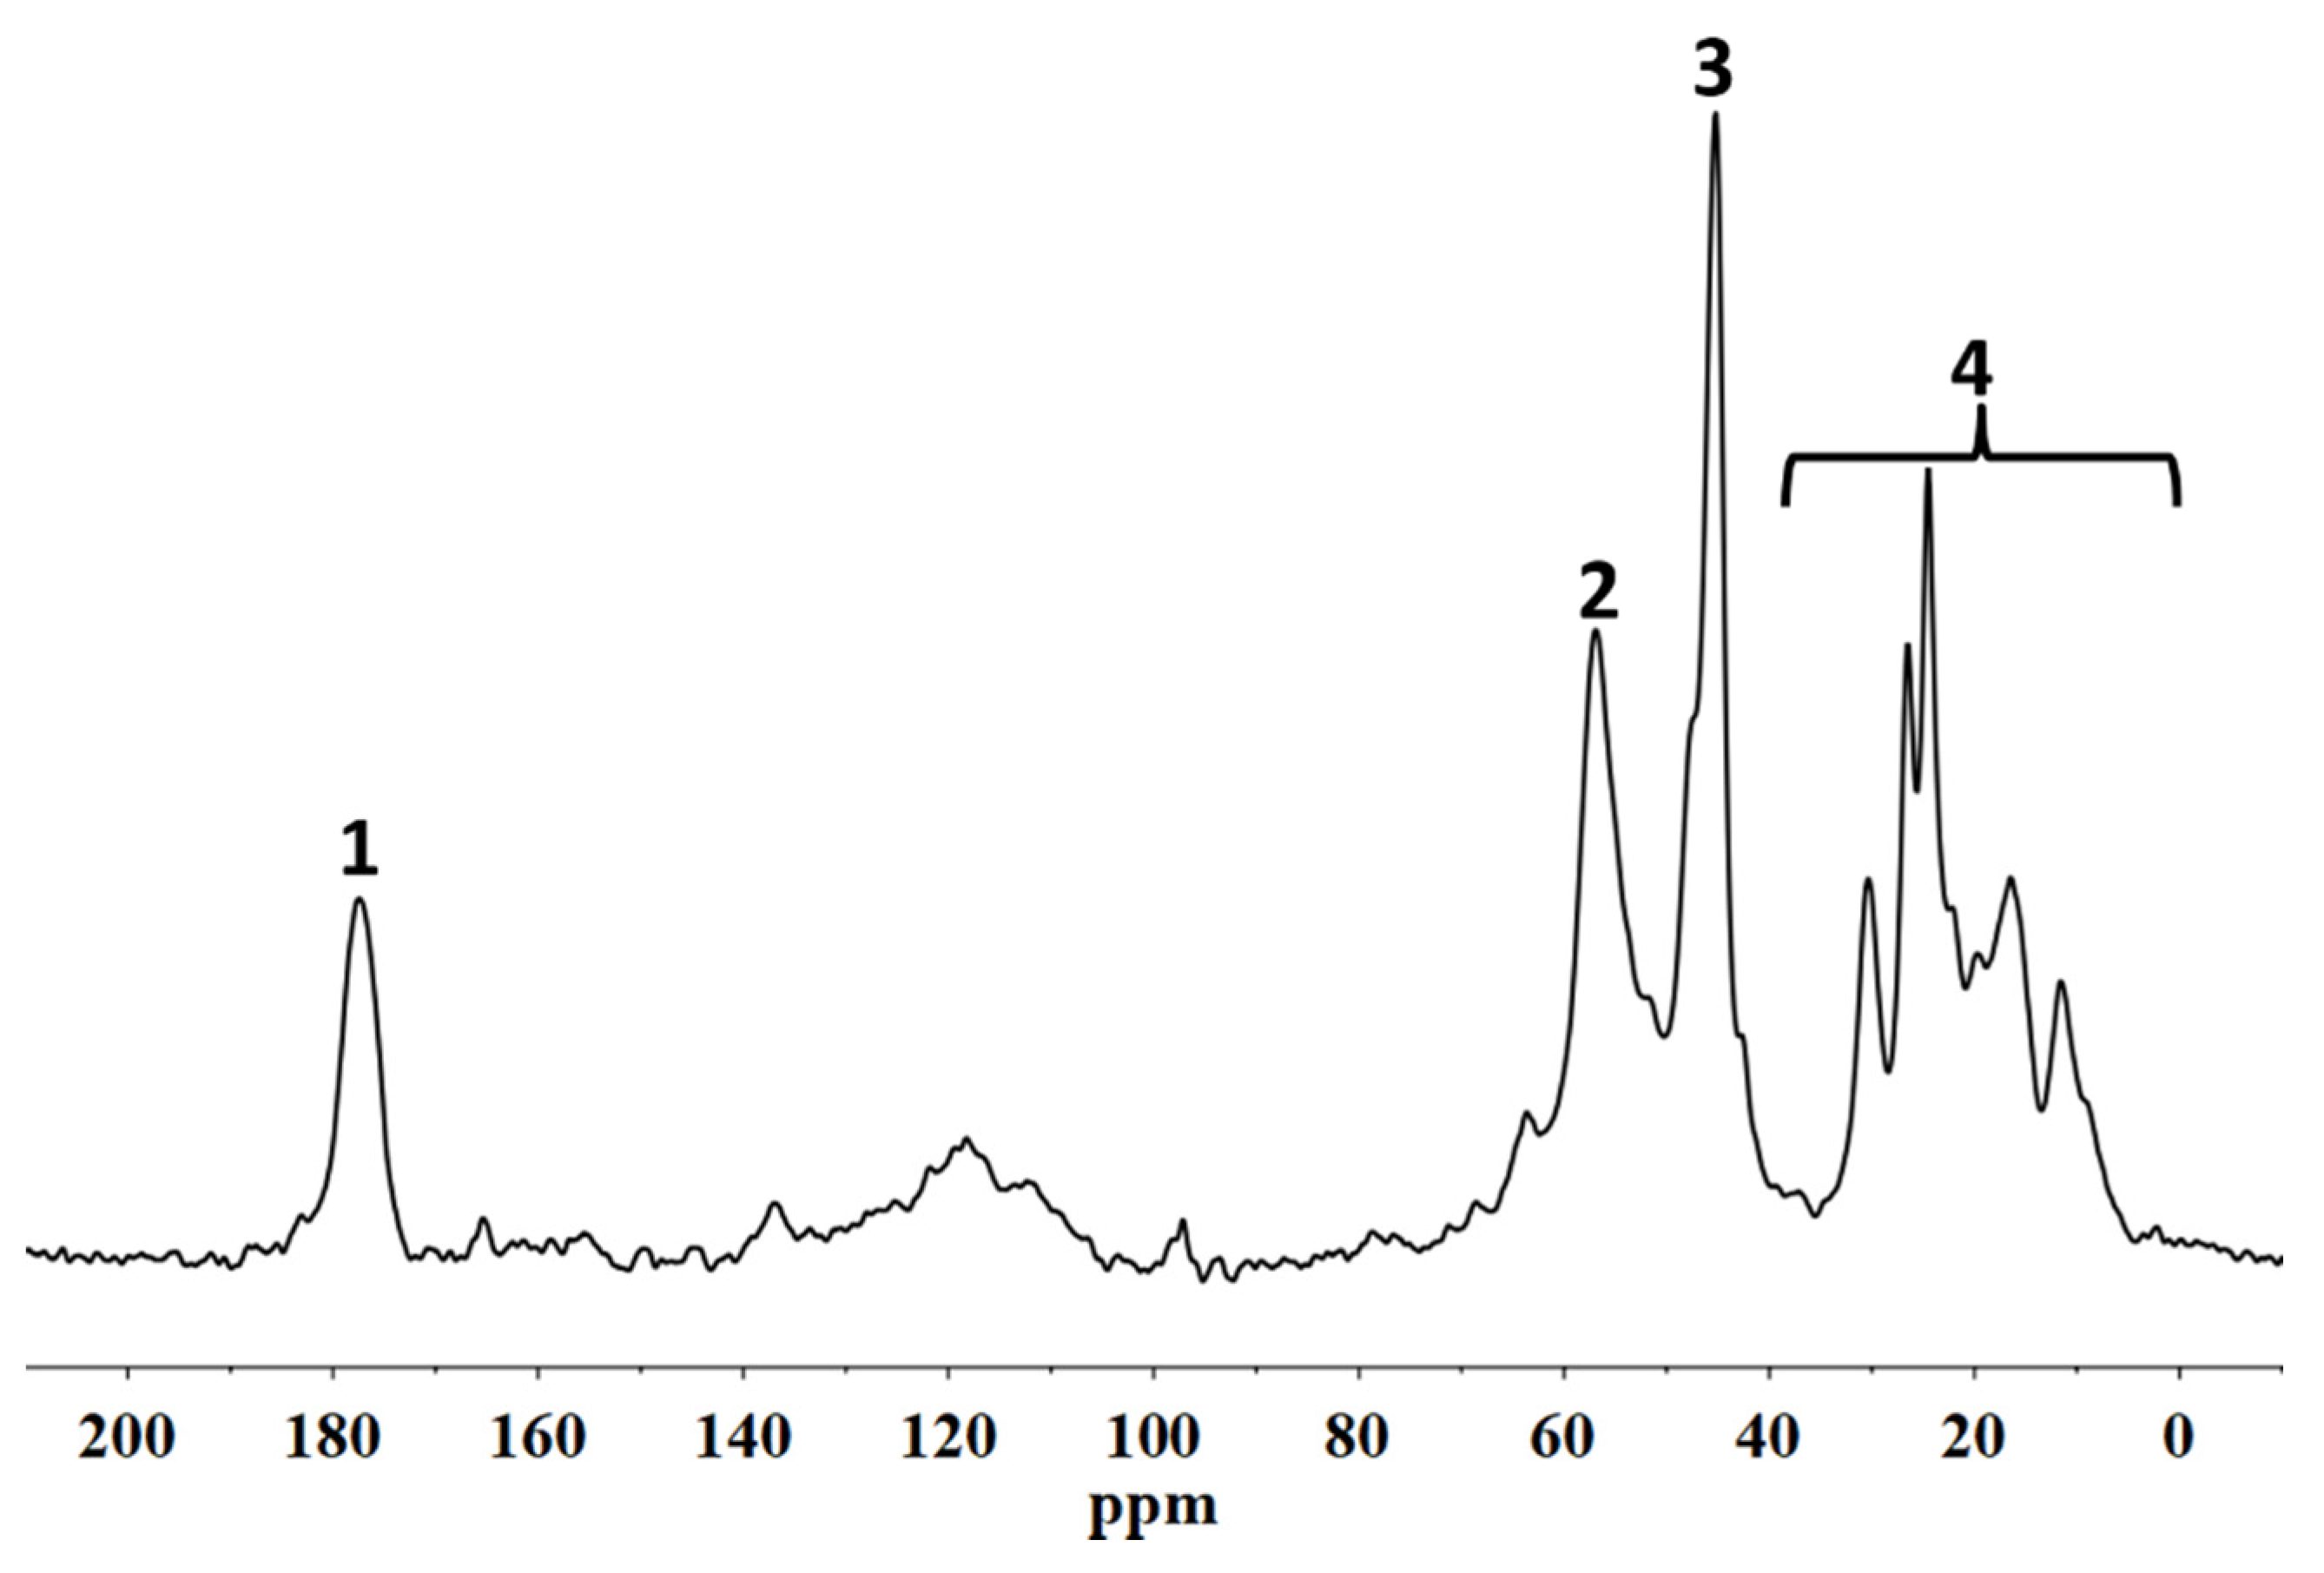
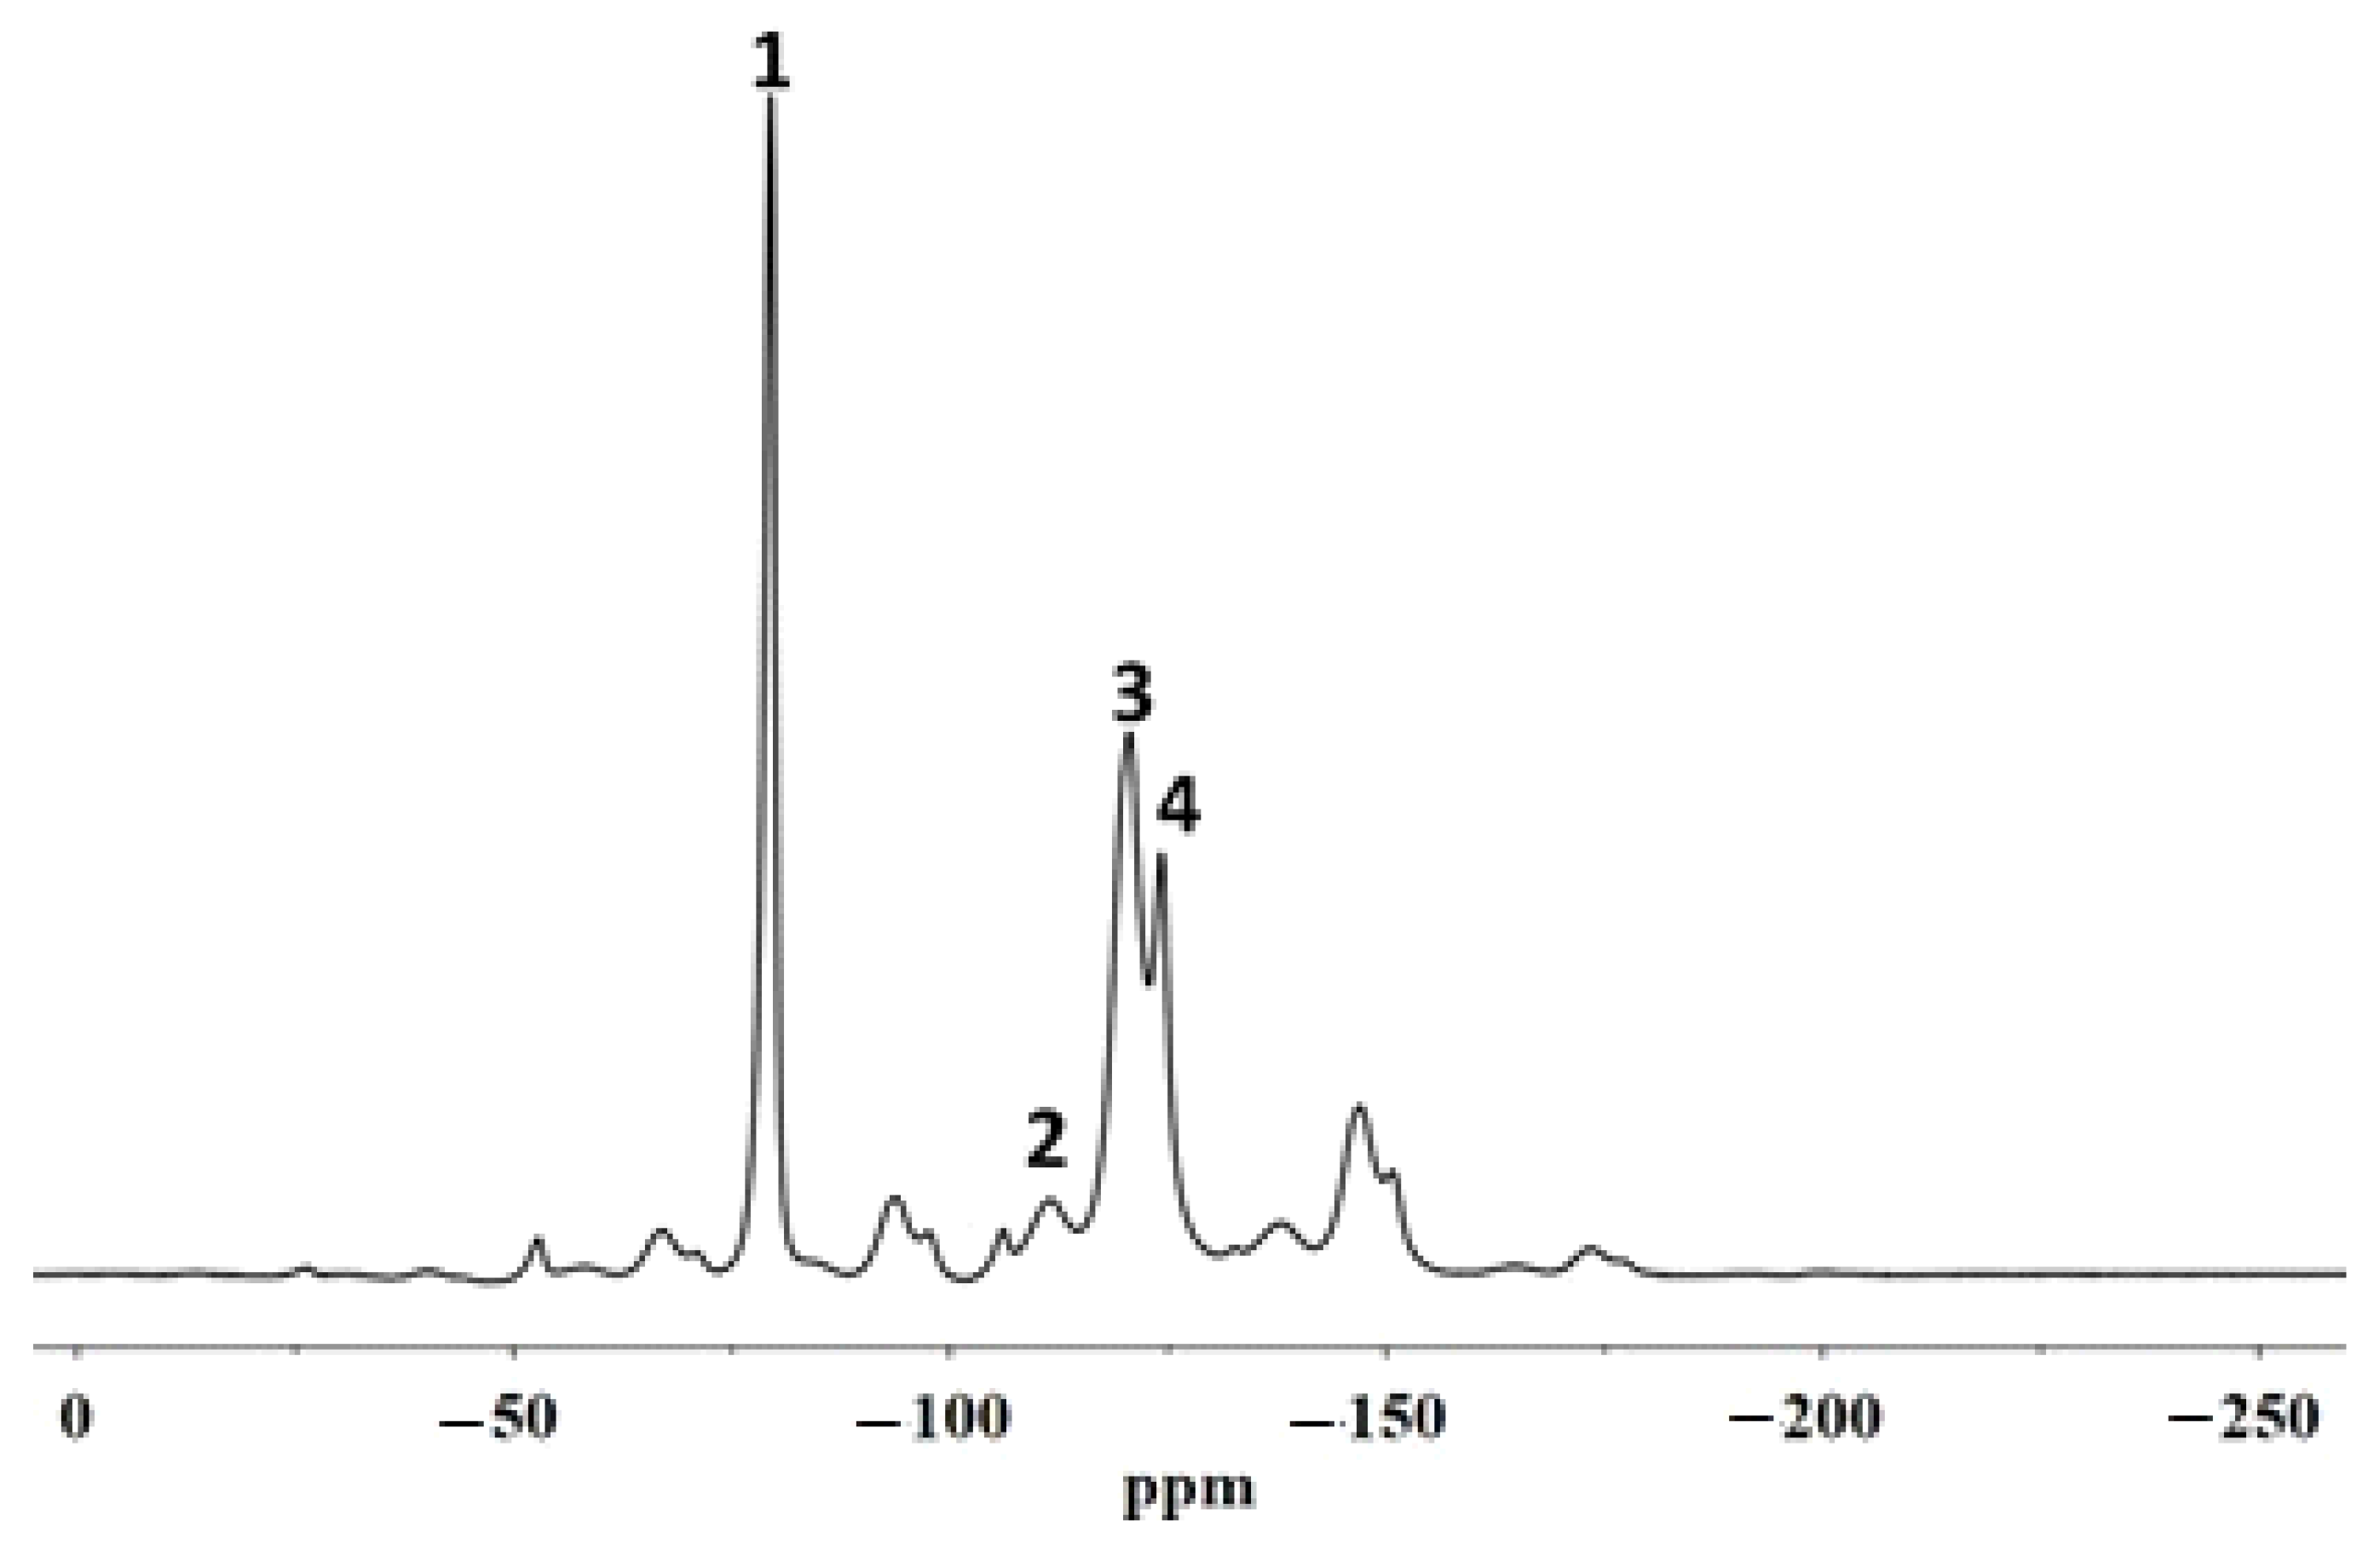
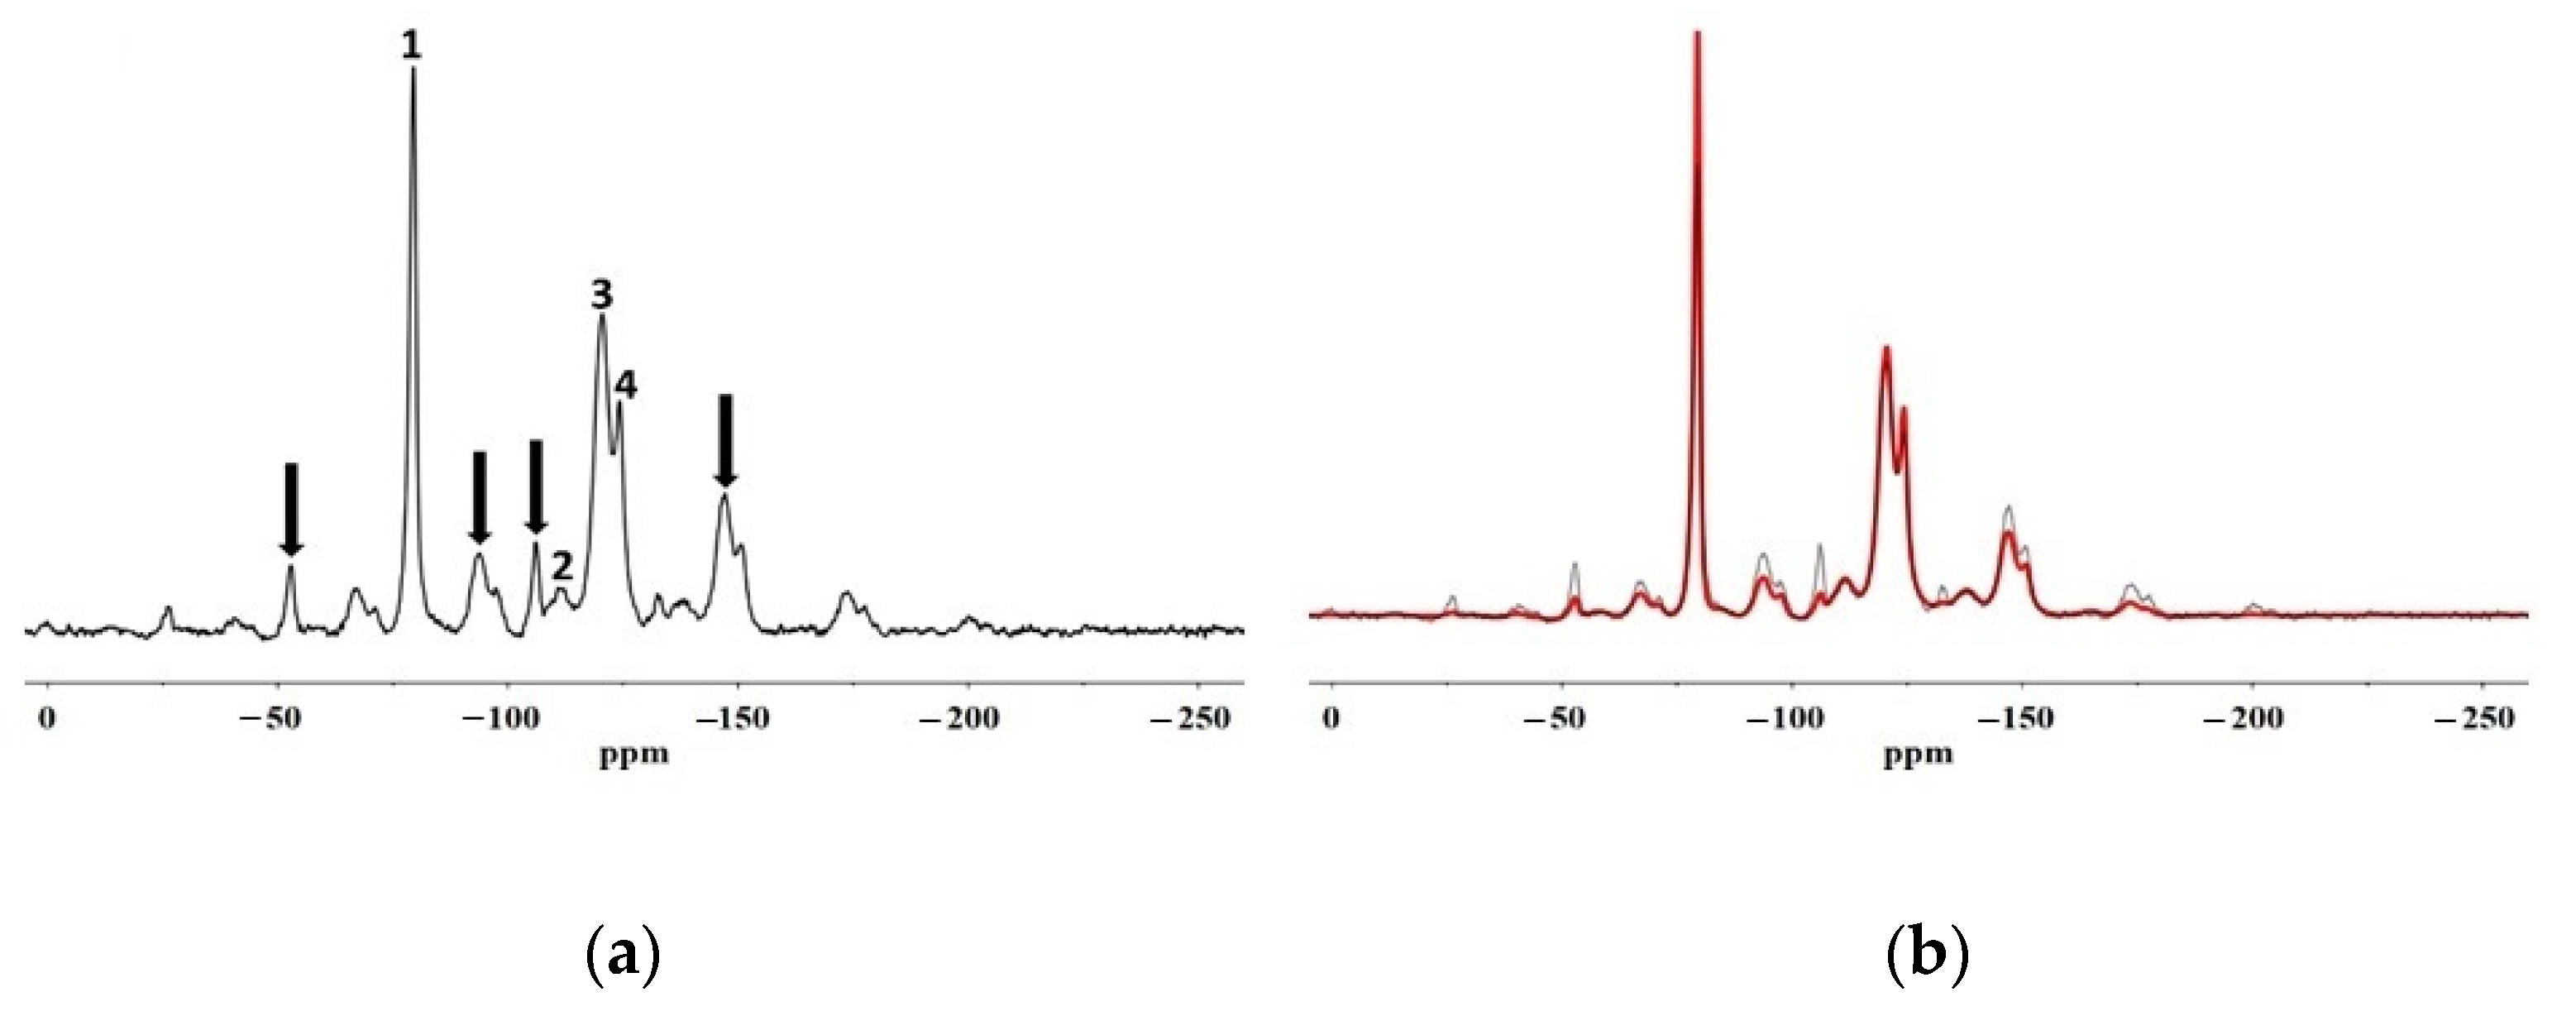
All spectra were acquired by using a Bruker Avance II 400 (9.4T) spectrometer operating at 400.15, 100.61 and 376.50 MHz for the 1H, 13C and 19F nuclides, respectively. Fifty milligrams of each sample were packed in 4 mm diameter zirconia rotors for the 13C and 29Si nuclide experiments and 2.5 mm for the 19F experiments. All rotors were sealed with KEL-F caps. 19F MAS NMR spectra were acquired at a rotation frequency of the magic angle of 10 kHz, a 90° pulse duration of 4 μs, 128 scans and a delay time between one scan and the next of 3 s. The external reference standard used was polytetrafluoroethylene (−123 ppm). 13C {19F} CP-MAS NMR spectra were acquired at a rotation frequency of the magic angle of 10 kHz, a pulse duration on 19F nuclei of 2.5 μs, contact time of 1 ms, a delay time of 3 s, with 7000 scans. The Hartmann–Hahn condition was optimized on a Teflon sample. 13C {1H} CP-MAS NMR spectra were acquired at a magic angle rotation frequency of 10 kHz, a pulse duration on 1H of 2.5 μs, contact time of 1.5 ms, a delay time of 3 s, with 5000 scans. The Hartman–Hahn condition was optimized on an adamantane sample which was also used as a chemical shift reference (29.5 and 38.6 ppm).
The spin–lattice relaxation times, T1F, were calculated by inversion recovery pulse sequence (180-τ-90), using a delay time in a range from 0 to 10 s; The spin–spin relaxation times, T2F, were calculated by pulse sequence Carr–Purcell–Meiboom–Gill (CPMG) (90-τ-180), using a delay time ranging from 0.1 to 10 ms.

3. Results and Discussion

3.1. Penetration Depth and Distribution of the Polymer in the Pore Network

Several SEM micrographs of each cross section were acquired and for each of them, two spots were analysed for the determination of the elemental composition. Two representative analyses are reported in Figure 1.
The SEM micrographs revealed morphological features of the stone’s porosity, which is mainly constituted by connected pores of hundreds of microns in size. The presence of protective agents is not visible, thus making it impossible to gain evidence about their distribution inside the pore network and their penetration depth. The EDS spectra of all stone spots show the signals of calcium, silicon, oxygen, carbon, potassium and chlorine, which can be attributed to calcite, quartz and feldspars [12], and the signal of fluorine, which is related to the presence of the protective agents, observed inside the pores.
Perpendicular profiles of the stone section were analysed by soft X-ray microscopy. The emitted X-rays were acquired from areas at different depths from the surface and the fluorine peak area was used to evaluate if the two fluorinated compounds penetrated the stone (Figure 2).
No particular trend is observed for both profiles, and the signal variation of the fluorine area seems to indicate that the protective agents penetrate into the inner part of the stone in a non-preferential way, due to the pore distribution, probably due to the partial accumulation of the polymers in inhomogeneous empty spaces. On the other hand, other similar protective agents were preferentially accumulated on the first 20 micrometres of the surface of marble [25] and 4 millimetres of the surface of calcarenite [26].
To deepen the spatial distribution of the protectives, some representative XRF maps containing the spots at high fluorine content were acquired. The spot size was chosen as 1 μm in diameter as a compromise between the features of interest and being compatible with the suitable XRF emitted signal. The obtained XRF maps are reported in Figure 3.
The signal of oxygen refers to the stone’s contribution (due to calcite and quartz), while the scattering accounts for the stone and the nano-micro-agglomerate’s contribution. The area where both F and O signals are low corresponds to empty cavities and/or holes. The map of Fluo AQ shows that fluorine is mostly distributed along the pore’s surface, while that of Fluoline HY evidences the formation of lumps with a poorly defined distribution inside the calcarenite porosity.
In order to better understand the distribution of the protective Fluoline HY inside the calcarenite matrix, a bigger map at the energy of 2 keV was acquired. With this approach, the number of visible elements was improved, allowing us to see some characteristic stone elements, such as Al and Si. Several maps were acquired in sequence in order to obtain an overview of a wide area. The result of the mapping is reported in Figure 4.
The high-energy maps emphasize the quartz grains through silicon signals, the feldspar correlated to aluminium and the oxygen signal in the other area can be attributed to the calcite grain. The fluorine distributes in small lumps inside the empty spaces between the grains.
These findings permit us to describe the distribution of the polymers inside the pore structure of Cusa’s stone, and in particular led to a deep understanding of the macroscopic properties observed after the application of the two fluorinated polymers. Generally, any protective coating must satisfy several requirements, such as good adhesion, water repellence and a natural water vapour permeability [27,28]. Consequently, it is known that one of the crucial aspects for good performance is that, after the application of a protective product, the stone surface must not be sealed and pores must not be completely blocked, to allow the release of moisture which is often trapped inside [29,30]. As can be seen from the chemical maps (see Figure 3), Fluo AQ and Fluoline HY are distributed in the porous system in a different way. In detail, Fluo AQ shows a continuous and homogeneous distribution along the surface of the pores which is ascribable to a good adhesion of the polymer to the stone support. Since a good anchoring of the polymer in the pore structure assures performance implementation especially in terms of hydrophobicity [25], this justifies the high water repellence conferred to the stone substrate and a vapour permeability similar to untreated stone. On the contrary, Fluoline HY clogs the pores due to the small accumulations of the polymer inside the porous system. The pore–clogging inhibits the vapour transport from inside to the external environment [5]. Furthermore, the non-adhesion of the polymer along the pore’s surface does not reduce the interaction with water, which is retained and/or absorbed, representing a drawback for the stone protection [23]. This justifies why Fluoline HY significantly reduces the water vapour permeability of the stone, while also conferring poor water repellence. The results obtained so far show how X-ray synchrotron microscopy coupled with X-ray fluorescence is a powerful tool to overcome some drawbacks of classical imaging and to carry out an in-depth investigation on the spatial distribution of polymers in the stone, allowing one to correlate micro and macro behaviour for the description of the protective action.

3.2. Characterisation of the Protective Polymer Formulations and Study of the Interactions

Fluoline HY. 19F MAS NMR, 13C {19F} CP-MAS NMR and 13C {1H} CP-MAS NMR spectra of Fluoline HY film together with the chemical shift assignment are reported in Figure 5, Figure 6, Figure 7 and Figure 8 and in Table 1, Table 2 and Table 3.
In the 13C {19F} CP-MAS spectrum, it is worth noting that the intensity of peak 3 due to CF2 groups is lower than the one of peak 4 due to CF. This is because the −CF2 group in (−CH2CF2−CH2−) units receives magnetization only from the two 19F nuclei directly bonded to it and the −CF group in (−CF−CF3) units receives magnetization both from the 19F atom directly bound to it and from the adjacent −CF3 group, as the cross-polarization mechanism involves dipolar interactions occurring through space. This finding and the analysis of the peaks confirmed that the sequence of repetitive units of the Fluoline HY is that shown in Figure 7.
In the 13C{1H} CP−MAS spectrum (Figure 8), the resonances of the −CH2 signal groups at 44.08 assigned to the VDF units for the head (CH2) to tail (CF2) additions (−CF2CH2−CF2−CH2−) and the resonances at 118.86 ppm that correspond to sp2 hybridized carbons or fluorinated hydrocarbons are present [32].
FLUO AQ. 19F MAS NMR, 13C {19F} CP−MAS NMR and 13C {1H} CP−MAS NMR spectra of the Fluo AQ film and the chemical shift assignment are reported in Figure 9, Figure 10 and Figure 11 and in Table 4, Table 5 and Table 6.
In the Fluo AQ 13C{1H} CP−MAS spectrum, signals due to fluorinated and non-fluorinated alkyl chains, absent in Fluoline HY, are present. From the peaks at 176.89 and 56.84 ppm attributed to the ester carbonyl and to the alkoxy group bound to it (Figure 11), it is possible to hypothesize that this is an acryl-alkyl-fluorinated polymer. The broad signal at ~121 ppm is assigned to the −CF2 group bonded to the –CH2 group (−CH2CF2−CF2−) [33]. The hypothetical possible structure of Fluo AQ is shown in Figure 12.

3.3. Study of the Interactions

In order to obtain information about the behaviour of each protective when applied on the stone surface and on possible interactions between the two materials, 19F MAS NMR spectra of the Fluoline HY and Fluo AQ were recorded, together with the T1F and T2F relaxation times before and after their application on the stone.
19F MAS NMR spectra of Fluoline HY and Fluo AQ after their application on the stone sample are shown in Figure 13 and Figure 14.
In the spectra of the Fluoline HY and of Fluo AQ on the stone, chemical shift values very similar to those of the pure polymers were observed. Nevertheless, by comparing these spectra with those of pure polymers, an intensity increase in the spinning side bands (↓) is observed (see Figure 13a and Figure 14a). This provided evidence that the polymer assumes preferential orientations inside the stone pores, thus resulting in a more organized and less mobile material.
This hypothesis was confirmed by the analysis of the spin–lattice relaxation times (T1F) and spin–spin relaxation times (T2F) shown in Table 7 and Table 8.
T1F values for the two polymers in contact with the stone are longer than the relaxation times of the pure materials. This T1F increase suggests that the local molecular motions in the order of MHz decrease after the application [34].
T2F values of Fluoline HY in contact with the stone are shorter than those of pure Fluoline HY in accordance with the fact that signals 1 and 2 of Fluoline HY in contact with the stone are broader than the homologous bands of pure polymer (see Figure 13b). This indicates that even the low-frequency motions involving the side chains are prevented within the pores of the stone.
T2F of the Fluo AQ does not change after the application on the stone. This provides evidence that the low-frequency motions of the side chains are not affected by the confinement effect of the polymer. This could indicate that the partially cross-linked structure of this polymer could prevent changes in the dynamic state of the side chains after its application on the stone material. All these findings can be correlated with the observed macroscopic properties. The crosslinking of the polymeric system could cause the formation of a more homogeneous surface film. This could be related to the greater water repellence imparted onto the stone substrate compared to Fluoline HY and to the unchanged breathability of the stone after treatment, in agreement with the results obtained from the investigation by X-ray microscopy.
The molecular structure and dynamics of the polymer chains are responsible for a different structural organization of the polymers in contact with the stone substrate. The different structural organization of the polymers provides indirect evidence of the different efficacy of hydrophobic treatments and justifies their observed different spatial distribution, confirming the correlation with the observed macroscopic properties. These results were already observed by some of our group for different polymer materials where the optical or the mechanical properties were correlated to the microscopic motions [35,36,37].

4. Conclusions

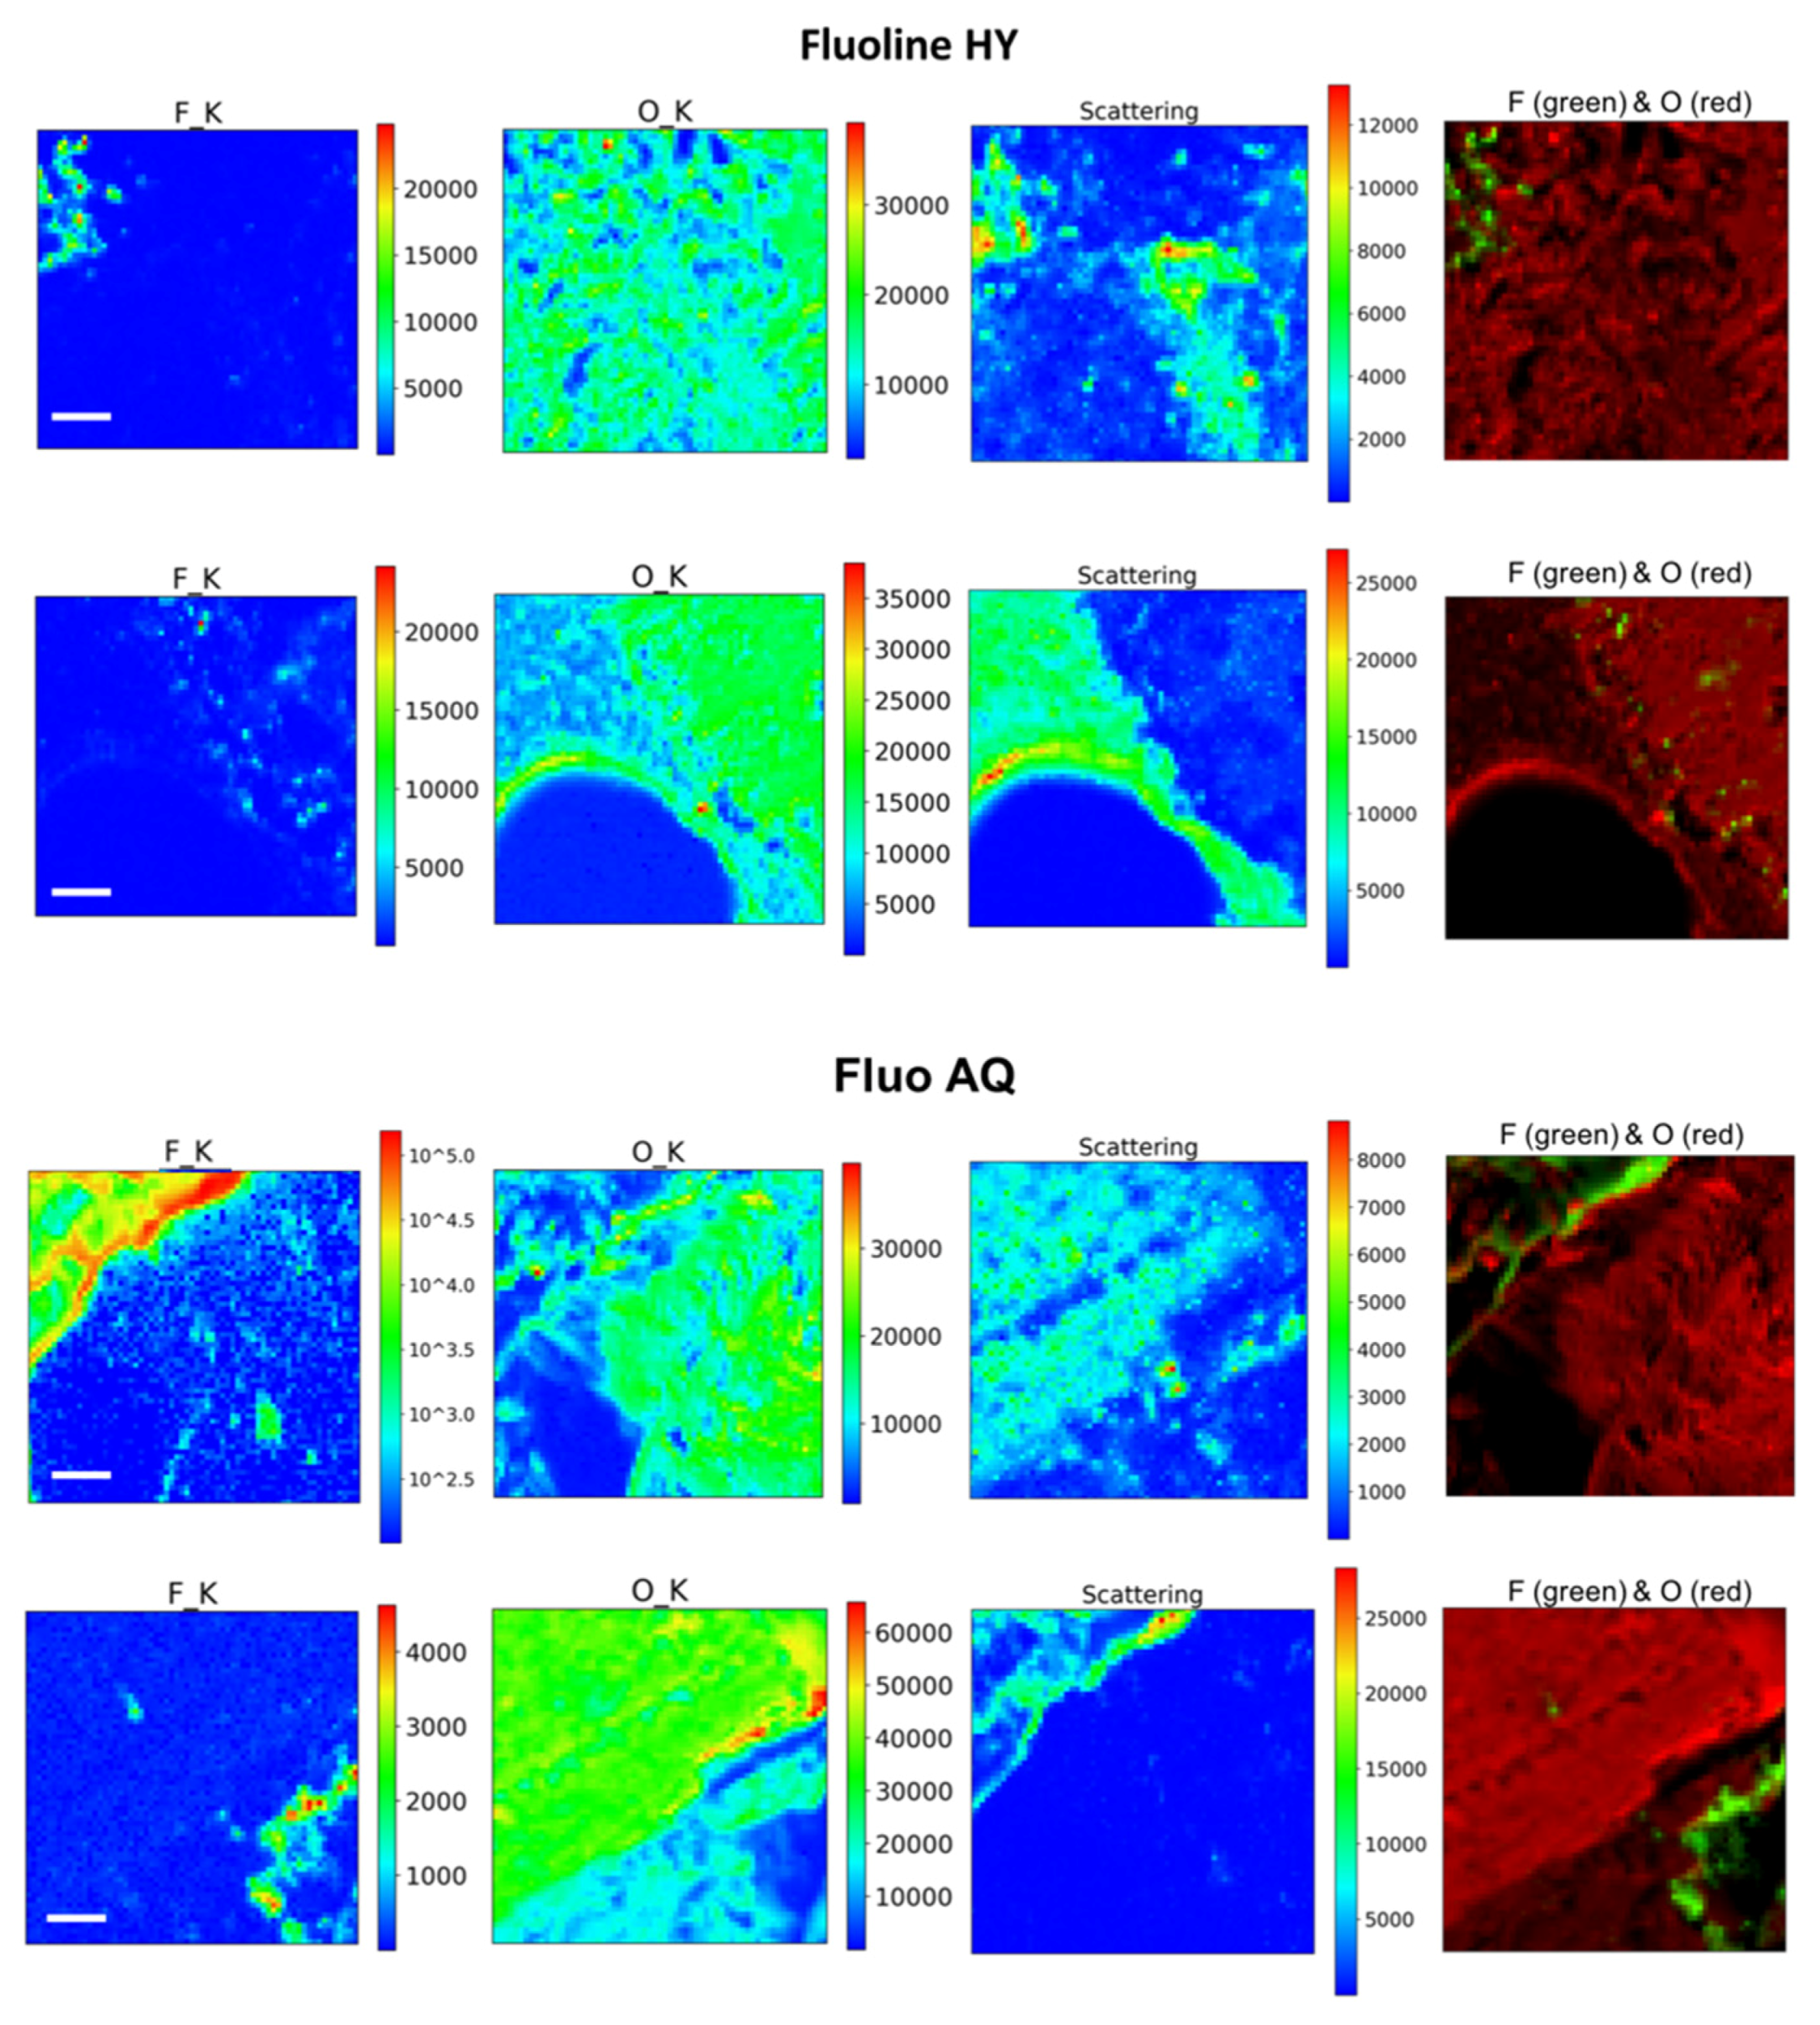
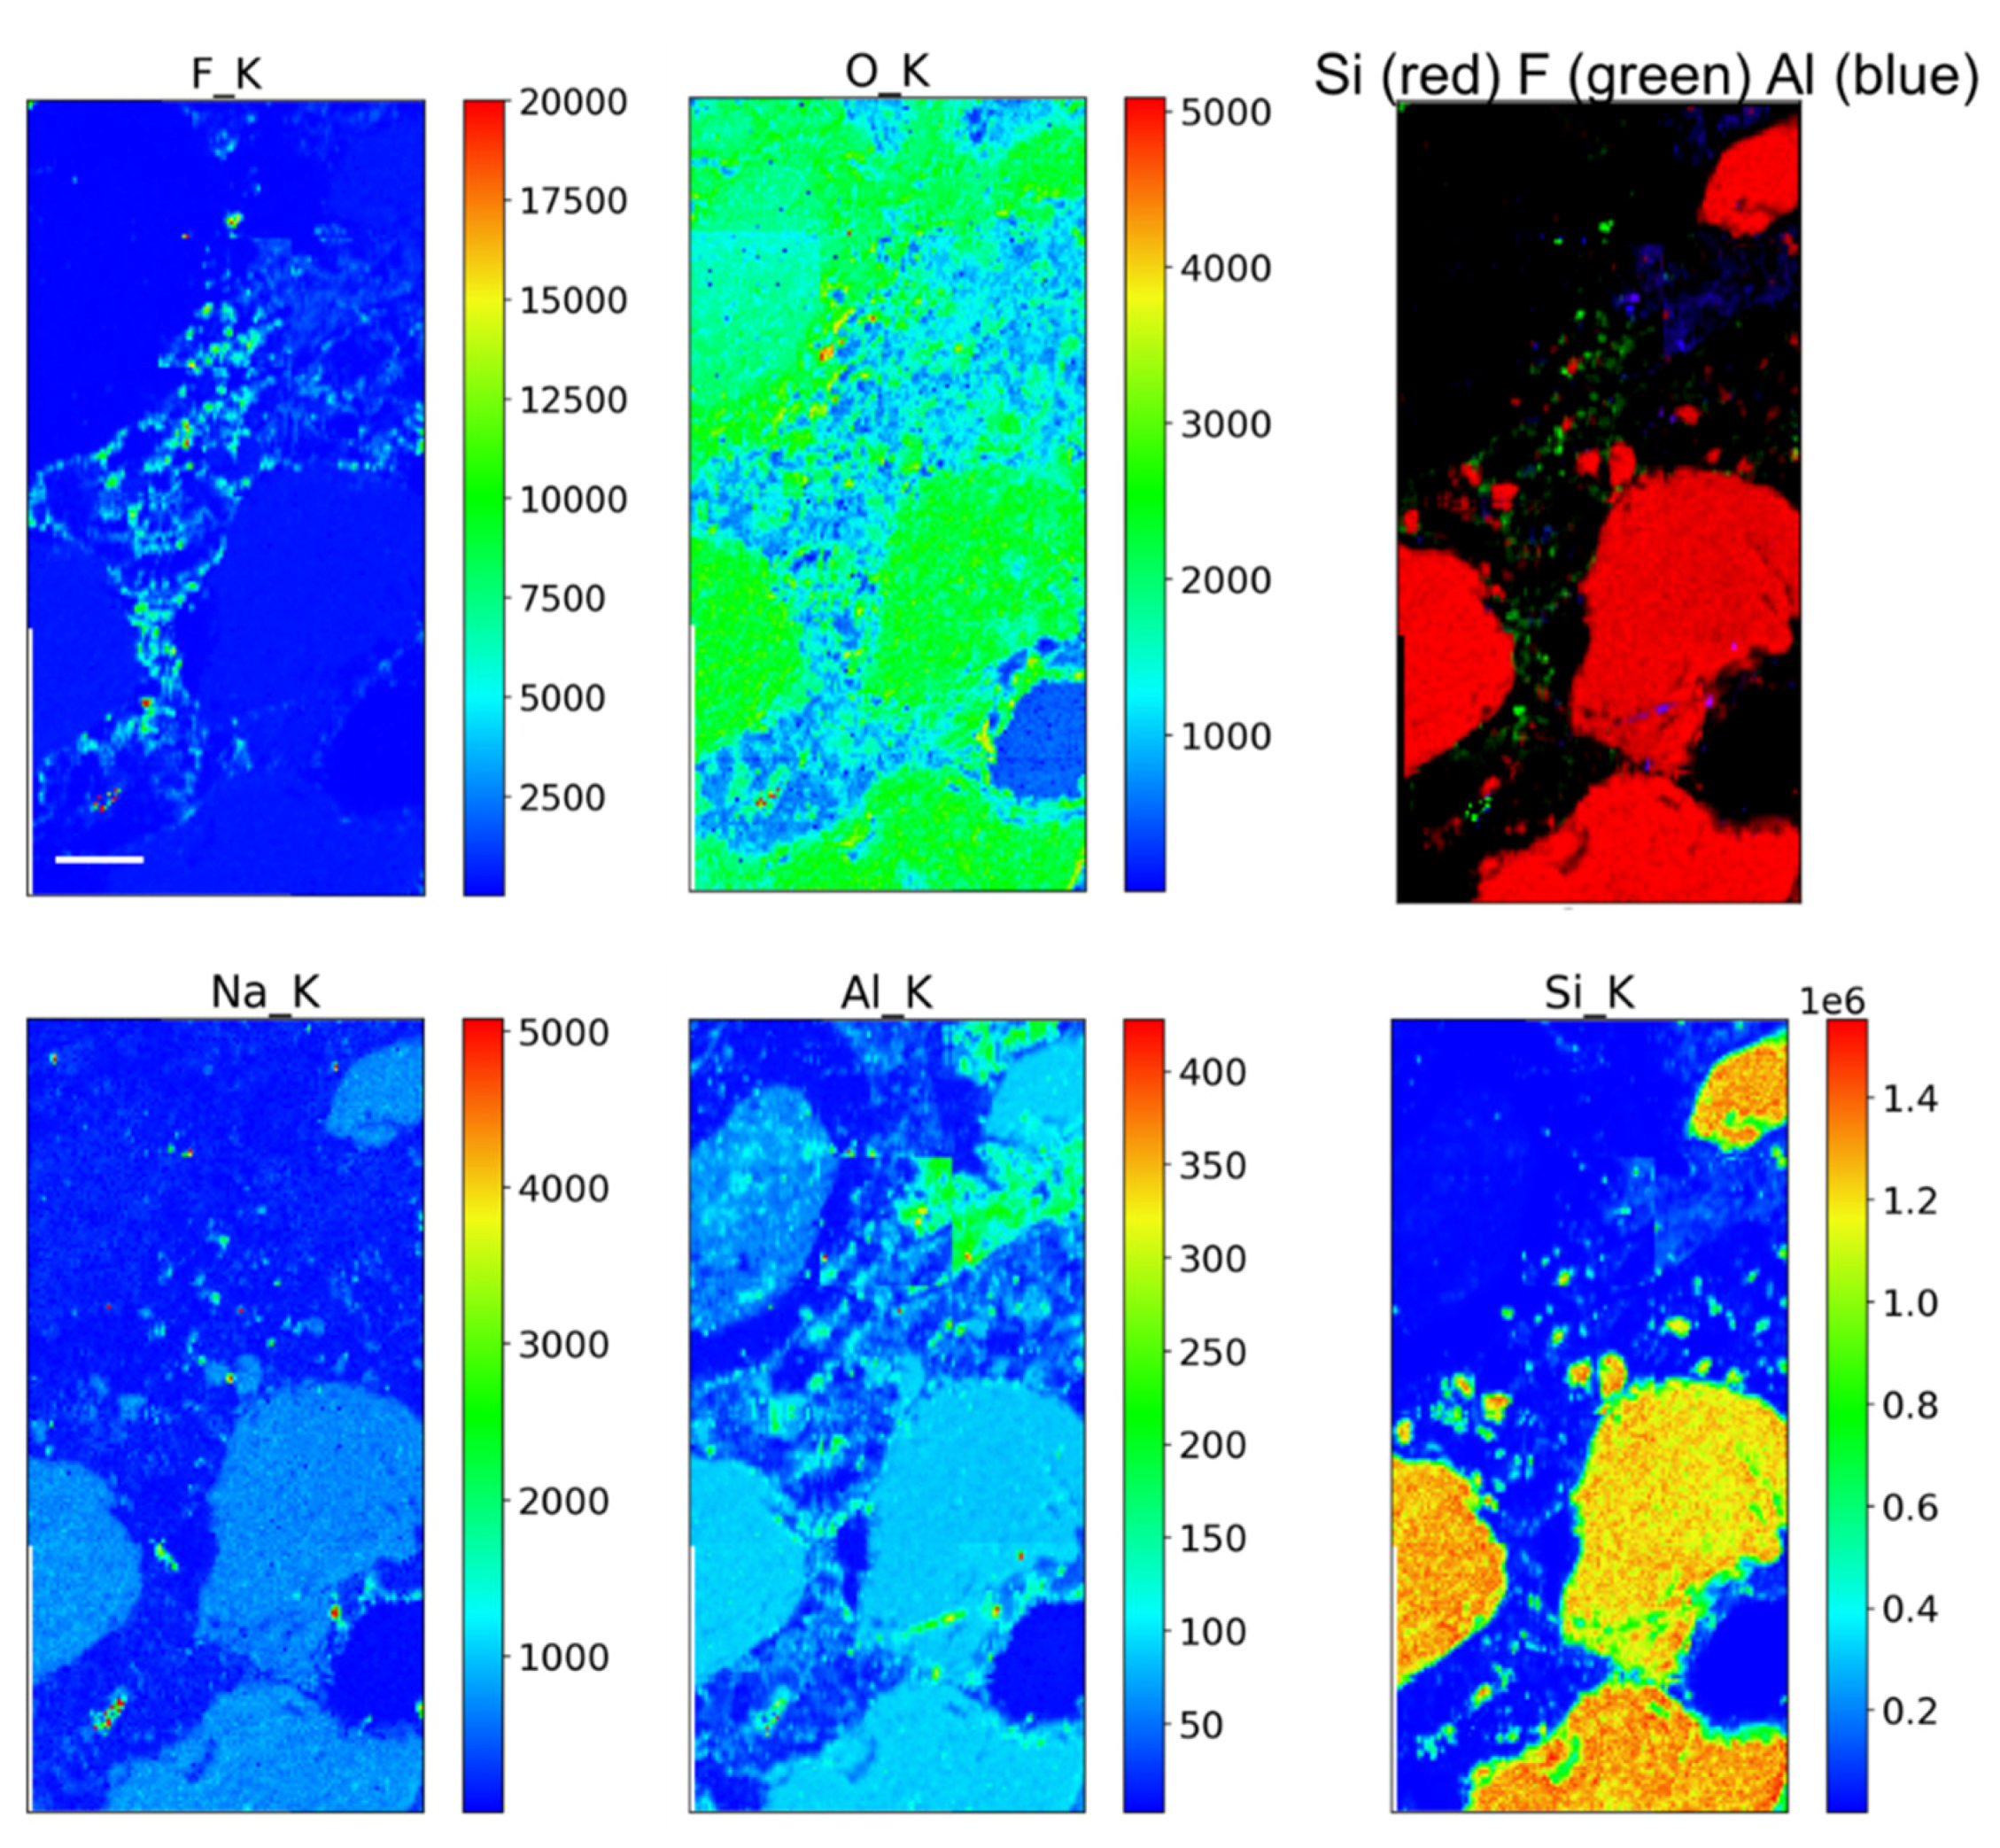
In this paper, SEM, X-ray microscopy and ss-NMR were used to correlate the microscopic properties with the protective efficacy of two polymeric formulations on Cusa’s stone. The results obtained by X-ray synchrotron microscopy coupled with X-ray fluorescence prove that the performance of both coatings is linked to their distribution within the stone, which are usually indicated only at the macroscopic level in terms of the permeability of the stone to water vapour and water repellence. In fact, the Fluo AQ shows greater affinity with the stone substrate and the formation of a continuous and homogeneous film adhering to the walls of the pores, without obstructing the empty spaces in which the water molecules can diffuse, and which confers an important hydrophobic character. On the contrary, the Fluoline HY clogs the pores, limiting the water vapour permeability. The interactions with the stone substrate were investigated by comparing the ss–NMR spectra of Fluoline HY and Fluo AQ in the form of a polymeric film with the corresponding spectra obtained from the stone samples treated with each protective agent. No changes in the chemical environment of the observed nuclei were found. The analysis of relaxation times highlighted the changes in the structural organization and in the dynamics of polymeric systems. The two protective agents in contact with the stone substrate are less mobile, probably due to a “confinement effect” also highlighted by the increase in the intensity of the side bands in the spectra obtained from the stone treated with the protective. The smaller mobility of the polymeric chains of Fluo AQ, together with its cross-linked organisation, can explain the greater water repellence imparted to the stone substrate compared to Fluoline HY, in agreement with the X-ray microscopy. The crosslinking of the polymeric system could cause the formation of a more homogeneous surface film. The study of the interactions between the protective materials used and the stone substrate is fundamental for obtaining indirect information on protective treatments and represents an alternative approach to the traditional methods used up to now. The obtained results show how X-ray synchrotron microscopy coupled with X-ray fluorescence is a powerful tool to overcome some drawbacks of classical imaging and to carry out an in-depth investigation on the spatial distribution of polymers in the stone and how ss-NMR spectroscopy is a powerful tool to interpret and predict the effectiveness of water repellence treatments for the protection of stone surfaces knowing the structural characteristics and physical properties of the polymer. Both techniques are useful for interpreting and correlating micro and macro behaviour for the description of the protective action. In the future, this approach needs to be made more thorough and could be applied to other case studies involving other kinds of protectives. The obtained results are of utmost importance for fundamental research, but also for manufacturing companies aiming to developing new commercial products, upgrading existing ones or orienting their end-user handling.

Author Contributions

F.A.; E.C. and M.L.S.: Conceptualization and methodology, V.C.: film preparation and application of polymer on stone surface, A.S.: ss-NMR investigation, R.S.; E.F.G.: SEM investigation, F.A.; G.K. and A.G.: X-ray Microscopy. V.C.; F.A. and M.L.S.: Writing—Review and editing. All authors contributed to the article and approved the submitted version. All authors have read and agreed to the published version of the manuscript.

Funding

F.A. thanks MIUR for the Project PON Ricerca e Innovazione 2014–2020—Avviso DD 407/2018 “AIM Attrazione e Mobilità Internazionale” (AIM1808223). This work is part of the project “Development and Application of Innovative Materials and processes for the diagnosis and restoration of Cultural Heritage—DELIAS”—PON03PE 00214 2 (Programma Operativo Nazionale Ricerca e Competitività 2007–2013).

Institutional Review Board Statement

Not applicable.

Informed Consent Statement

Not applicable.

Data Availability Statement

The datasets generated during and/or analysed during the current study are available from the corresponding author on reasonable request.

Acknowledgments

This work is dedicated to Sebastiano Tusa’s memory for suggesting the study about the Cusa’s stone, wishing that his dream of reconstruction for anastylosis of the Temple G does come true. The authors thank Leonardo Borgioli of C.T.S. s.r.l. for useful discussions and for providing the polymer formulations.

Conflicts of Interest

The authors declare no conflict of interest.

References

  1. Ruffolo, S.A.; La Russa, M.F. Nanostructured coatings for stone protection: An overview. Front. Mater. 2019, 6, 147. [Google Scholar] [CrossRef]
  2. Amoroso, G.G.; Fassina, V. Stone Decay and Conservation; Elsevier Science Ltd.: Lausanne, Switzerland, 1983. [Google Scholar]
  3. Matteini, M. Inorganic treatments for the consolidation and protection of stone artefacts. Conserv. Sci. Cult. Herit. 2008, 8, 13–27. [Google Scholar]
  4. Lazzarini, M.L. Laurenzi Tabasso; IL Restauro della Pietra: Cedam, Padova, 1986. [Google Scholar]
  5. Peruzzi, R.; Poli, T.; Toniolo, L. The experimental test for the evaluation of protective treatments: A critical survey of the “capillary absorption index. J. Cult. Herit. 2003, 4, 251–254. [Google Scholar] [CrossRef]
  6. Proietti, N.; Capitani, D.; Cozzolino, S.; Valentini, M.; Pedemonte, E.; Princi, E.; Vicini, S.; Segre, A.L. In situ and frontal polymerization for the consolidation of porous stones: A unilateral NMR and magnetic resonance imaging study. J. Phys. Chem. B 2006, 110, 23719–23728. [Google Scholar] [CrossRef] [PubMed]
  7. Sadat-Shojai, M.; Ershad-Langroudi, A. Polymeric coatings for protection of historic monuments: Opportunities and challenges. J. Appl. Polym. Sci. 2009, 112, 2535–2551. [Google Scholar] [CrossRef]
  8. CEN/TC 346—Conservation of Cultural Heritage. Available online: https://standards.cen.eu (accessed on 24 May 2021).
  9. Fassina, V. CEN TC 346 Conservation of Cultural Heritage-Update of the Activity after a Height Year Period. Eng. Geol. Soc. Territ. 2015, 8, 37–41. [Google Scholar]
  10. Anovitz, L.M.; Cole, D.R. Characterization and analysis of porosity and pore structures. Rev. Mineral. Geochem. 2015, 80, 61–164. [Google Scholar] [CrossRef] [Green Version]
  11. Renda, V.; De Buergo, M.A.; Saladino, M.L.; Caponetti, E. Assessment of protection treatments for carbonatic stone using nanocomposite coatings. Prog. Org. Coat. 2020, 141, 105515. [Google Scholar] [CrossRef]
  12. Caponetti, E.; Ciaramitaro, V.; Armetta, F.; Renda, V.; Ercoli, L.; Saladino, M.L. Effectiveness of some protective and self-cleaning treatment: A challenge for the conservation of the Temple G in Selinunte. Prog. Org. Coat. 2021, 151, 106020. [Google Scholar] [CrossRef]
  13. Artesani, A.; Di Turo, F.; Zucchelli, M.; Traviglia, A. Recent advances in protective coatings for cultural heritage—An overview. Coatings 2020, 10, 217. [Google Scholar] [CrossRef] [Green Version]
  14. Aglietto, M.; Passaglia, E.E.; Ciardelli, F.; Botteghi, C.; Matteoli, U.; Paganelli, S.; Arbizzanti, R.; Fassina, V. A new class of fluorinated acrylic polymers: Protective materials for stone. In Proceedings of the 10th Triennial Meeting, Lawrence, KS, USA, 22–27 August 1993; pp. 553–558. [Google Scholar]
  15. Andreotti, S.; Franzoni, E.; Degli Esposti, M.; Fabbri, P. Poly(hydroxyalkanoate)s-based hydrophobic coatings for the protection of stone in cultural heritage. Materials 2018, 11, 165. [Google Scholar] [CrossRef] [PubMed] [Green Version]
  16. Alaimo, R.; Azzaro, E.; Giarrusso, R.; Marescalchi, P.; Montana, G. Mapping and characterization of stone materials and their alteration/deterioration products in the historical center of Palermo (Italy). Period. Mineal. Spec. Iusse. Archaeom. Cult. Herit. 2002, 71, 1–16. [Google Scholar]
  17. De Buergo, M.A.; Fort, R.; Gomez-Heras, M. Contributions of scanning electron microscopy to the assessment of the effectiveness of stone conservation treatments. Scanning Microsc. 2004, 26, 41–47. [Google Scholar] [CrossRef]
  18. De Buergo Ballester, M.A.; González, R.F. Basic methodology for the assessment and selection of water-repellent treatments applied on carbonatic materials. Prog. Org. Coat. 2001, 43, 258–266. [Google Scholar] [CrossRef]
  19. Bertrand, L.; Robinet, L.; Thoury, M.; Janssens, K.; Cohen, S.X.; Schöder, S. Cultural heritage and archaeology materials studied by synchrotron spectroscopy and imaging. Appl. Phys. A 2012, 106, 377–396. [Google Scholar] [CrossRef]
  20. Kaznatcheev, K.V.; Karunakaran, C.; Lanke, U.D.; Urquhart, S.G.; Obst, M.; Hitchcock, A.P. Soft X-ray spectromicroscopy beamline at the CLS: Commissioning results. Nucl. Instrum. Methods Phys. Res. Sect. A Accel. Spectrometers Detect. Assoc. Equip. 2007, 582, 96–99. [Google Scholar] [CrossRef]
  21. Tortora, M.; Chiarini, M.; Spreti, N.; Casieri, C. 1H-NMR-relaxation and colorimetry for evaluating nanopolymeric dispersions as stone protective coatings. J. Cult. Herit. 2020, 44, 204–210. [Google Scholar] [CrossRef]
  22. Gianoncelli, A.; Kourousias, G.; Merolle, L.; Altissimo, M.; Bianco, A. Current status of the TwinMic beamline at Elettra: A soft X-ray transmission and emission microscopy station. J. Synchrotron Radiat. 2016, 23, 1526–1537. [Google Scholar] [CrossRef]
  23. Raneri, S.; Giannoncelli, A.; Mascha, E.; Toniolo, L.; Roveri, M.; Lazzeri, A.; Coltelli, M.B.; Panariello, L.; Lezzerini, M.; Weber, J. Inspecting adhesion and cohesion of protectives and consolidants in sandstones of architectural heritage by X-ray microscopy methods. Mater. Charact. 2019, 156, 109853. [Google Scholar] [CrossRef] [Green Version]
  24. Sole, V.A.; Papillon, E.; Cotte, M.; Walter, P.; Susini, J. A multiplatform code for the analysis of energy-dispersive X-ray fluorescence spectra. Spectrochim. Acta Part B 2007, 62, 63–68. [Google Scholar] [CrossRef]
  25. La Russa, M.F.; Rovella, N.; Alvarez de Buergo, M.; Belfiore, C.M.; Pezzino, A.; Crisci, G.M.; Ruffolo, S.A. Nano-TiO2 coatings for cultural heritage protection: The role of the binder on hydrophobic and self-cleaning efficacy. Prog. Org. Coat. 2016, 91, 1–8. [Google Scholar] [CrossRef]
  26. Casadio, F.; Toniolo, L. Polymer treatments for stone conservation: Methods for evaluating penetration depth. J. Am. Inst. Conserv. 2004, 43, 3–21. [Google Scholar] [CrossRef]
  27. Toniolo, L.; Poli, T.; Castelvetro, V.; Manariti, A.; Chiantore, O.; Lazzari, M. Tailoring new fluorinated acrylic copolymers as protective coatings for marble. J. Cult. Herit. 2002, 3, 309–316. [Google Scholar] [CrossRef]
  28. Hansen, C.M. Water transport and condensation in fluoropolymer films. Prog. Org. Coat. 2001, 42, 167–178. [Google Scholar] [CrossRef]
  29. Vacchiano, C.D.; Incarnato, L.; Scarfato, P.; Acierno, D. Conservation of tuff-stone with polymeric resins. Constr. Build. Mater. 2008, 22, 855–865. [Google Scholar] [CrossRef]
  30. La Russa, M.F.; Barone, G.; Belfiore, C.M.; Mazzoleni, P.; Pezzino, A. Application of protective products to “Noto” calcarenite (south-eastern Sicily): A case study for the conservation of stone materials. Environ. Earth Sci. 2011, 62, 1263–1272. [Google Scholar] [CrossRef]
  31. Ando, S.; Harris, R.K.; Monti, G.A.; Reinsberg, S.A. Analysis of cross-polarization dynamics between 1H and 19F in Viton fluoroelastomer using solid-state 19F magic angle spinning and 1H→ 19F cross-polarization magic angle spinning NMR. Magn. Reson. Chem. 1999, 37, 709–720. [Google Scholar] [CrossRef]
  32. Hestenes, J.C.; Ells, A.W.; Navarro Goldaraz, M.; Sergeyev, I.V.; Itin, B.; Marbella, L.E. Reversible deposition and stripping of the cathode electrolyte interphase on Li2RuO3. Front. Chem. 2020, 8, 681. [Google Scholar] [CrossRef]
  33. Montina, T.; Wormald, P.; Hazendonk, P. 13C Solid-State NMR of the Mobile Phase of Poly (vinylidene fluoride). Macromolecules 2012, 45, 6002–6007. [Google Scholar] [CrossRef]
  34. Tatsuno, H.; Aimi, K.; Ando, S. Solid-state 19F MAS NMR study on the conformation and molecular mobility of poly (chlorotrifluoroethylene). Magn. Reson. Chem. 2007, 45, 401–409. [Google Scholar] [CrossRef]
  35. Saladino, M.L.; Chillura Martino, D.; Floriano, M.A.; Hreniak, D.; Marciniak, Ł.; Stręk, W.; Caponetti, E. Ce:Y3Al5O12-polymethylmethacrylate composite for White Light Emitting Diode. J. Phys. Chem. 2014, 118, 9107–9113. [Google Scholar]
  36. Motaung, T.E.; Luyt, A.S.; Saladino, M.L.; Caponetti, E. Study of morphology, mechanical properties and thermal degradation of titania-polycarbonate nanocomposites as function of crystalline phase and amount. Polym. Compos. 2013, 34, 164–172. [Google Scholar] [CrossRef] [Green Version]
  37. Motaung, T.E.; Saladino, M.L.; Chillura Martino, D.; Luyt, A.S. Influence of the modification, induced by zirconia nanoparticles, on the structure and properties of polycarbonate. Eur. Polym. J. 2013, 49, 2022–2030. [Google Scholar] [CrossRef] [Green Version]
Figure 1. SEM micrographs with respective EDS spectra obtained for stone treated with Fluoline HY (top) and Fluo AQ (bottom). The coloured points indicate the spots where the EDS analysis was performed. The colour of the border for the EDS spectra and the atomic concentration results of spectra data analysis correspond to the spot colour.
Applsci 11 05767 g001
Figure 2. Fluorine peak area counts detected along the deepness profile of the two cross-sections.
Applsci 11 05767 g002
Figure 3. Elemental XRF maps (acquired at 1 keV with 1.2 μm diameter beam size, over an area of 80 × 80 μm2) obtained for Cusa’s stone treated with Fluoline HY (top) and Fluo AQ (down). The scale bar is 20 μm.
Applsci 11 05767 g003
Figure 4. High-energy elemental XRF maps (acquired at 2 keV with 2 μm diameter beam size, over an area of 240 × 480 μm2) of the sample treated with Fluoline HY. The third map shows RGB correlation images for 3 different chemical elements, highlighting their possible co-localization. The scale bar is 50 μm.
Applsci 11 05767 g004
Figure 5. 19F MAS NMR spectrum of Fluoline HY film.
Applsci 11 05767 g005
Figure 6. 13C{19F} CP−MAS NMR spectrum of Fluoline HY film.
Applsci 11 05767 g006
Figure 7. Sequence of repetitive units in Fluoline HY.
Applsci 11 05767 g007
Figure 8. 13C{1H} CP-MAS NMR spectrum of Fluoline HY film.
Applsci 11 05767 g008
Figure 9. 19F MAS NMR spectrum of Fluo AQ film.
Applsci 11 05767 g009
Figure 10. 13C{19F} CP−MAS NMR spectrum of Fluo AQ film.
Applsci 11 05767 g010
Figure 11. 13C{1H} CP−MAS NMR spectrum of Fluo AQ film.
Applsci 11 05767 g011
Figure 12. Sequence of repetitive units in Fluo AQ.
Applsci 11 05767 g012
Figure 13. 19F MAS NMR spectrum of (a) Fluoline HY on stone and (b) overlapping with the Fluoline HY film spectrum (red line). The symbol (↓) represents the spinning side bands.
Applsci 11 05767 g013
Figure 14. 19F MAS NMR spectra of (a) Fluo AQ on stone; (b) Fluo AQ on stone (black) and Fluo AQ film (red). The symbol (↓) represents the spinning side bands.
Applsci 11 05767 g014
Table 1. Chemical shift assignment of the of 19F MAS NMR spectrum.
PeakChemicals Shift (Ppm)AssignmentMonomeric Unit
1−73.22−(CF2)2−CF(CF3)−HFP
2−88.67−CH2−CF2−CH2VDF
3−108.96−CH2−CF2−CF2−CH2VDF
4−116.10−CH2−CF2−CF2−CF(CF3)−HFP
5−181.59−(CF2)2−CF(CF3)−HFP
The assignment of the resonances in the 19F MAS spectrum was performed according to the literature [31]. The signals at −73.22 ppm are due to the HFP units for the side −CF3 (−CF2−CF(CF3)−), and those at −116.10 ppm are due to the −CF2 group directly linked to the −CF2 of the VDF (−CF2CF2CF (CF3)−). The signal at −181.59 ppm is due to the −CF (−CF2CF(CF3)−) group. Finally, the signals at −88.67 and −108.86 ppm were assigned to the VDF units resulting from head-to-tail (−CH2CF2−CH2−) and head-to-head additions (−CH2−CF2−CF2−CH2−), respectively.
Table 2. Assignment of the chemical shift of 13C{19F} CP-MAS spectrum.
PeakChemicals Shift (Ppm)AssignmentMonomeric Unit
1124.17−CF−CF3HFP
2122.05−CH2CF2−CF−CF3VDF
3116.13−CH2CF2−CH2-HPF
495.33CF−CF3HFP
Table 3. Assignment of the chemical shift of 13C{1H} CP-MAS spectrum.
PeakChemicals Shift (Ppm)AssignmentMonomeric Unit
144.08CH2−CF2VDF
2118.86−CH2CF2VDF
Table 4. Assignment of the chemical shift 19F MAS NMR spectrum.
PeakChemicals Shift (Ppm)Assignment
1−79.37−CF2−CF2−CF3
2−111.02−CH2−CF2−CF2
3−120.62−CF2−CF2−CF2
4−123.96−CF2−CF2−CF3
Table 5. Assignment of the chemical shift of 13C{19F} CP-MAS.
PeakChemicals Shift (Ppm)Assignment
1120.68−CF2CF3
2114.13−CF2CF2−CF2
3111.77−CH2CF2−CF2
Table 6. Assignment of the chemical shift of 13C{1H} CP-MAS spectrum.
PeakChemicals Shift (Ppm)Assignment
1176.89RO−(C=O)−
256.84−O−CH3
345.37CH2−CF2
4(0–40)−CH2−CH2
Table 7. T1F and T2F spin-lattice relaxation times of fluorine nuclei of Fluoline HY.
T1F(S)T2F(Ms)
PeakChemicals Shift (Ppm) *Fluoline HYFluoline HY on StoneFluoline HYFluoline HY on Stone
1−73.220.500.570.800.72
2−88.670.510.600.400.35
3–4−108.96
−116.10
0.510.600.300.33
5−181.590.500.601.501.44
* The measurement error is less than 5%.
Table 8. T1F and T2F spin-lattice relaxation times of fluorine nuclei of Fluo AQ.
T1F(S)T2F(Ms)
PeakChemicals Shift (Ppm)Fluo AQFluo AQ on StoneFluo AQFluo AQ on Stone
1−79.490.510.560.660.67
2−111.340.51– *0.09
3−120.960.510.600.150.14
4−123.210.500.530.180.16
* T1F and T2F for peak 2 of the stone sample treated with Fluo AQ is not reported because the relative signal is not very intense and the measurement error is too high; The measurement error is less than 5%.
Publisher’s Note: MDPI stays neutral with regard to jurisdictional claims in published maps and institutional affiliations.

