1. Introduction
Stone monuments are important artifacts that provide artistic, cultural, political, or historical background to events during the time they were created [
1]. Due to the long exposure of these stones to wind, heat, rain, animal activities, and other factors in the environment where they are located, their surfaces degrade over time [
2,
3]. As a result, the contents (or information) which are sometimes in the form of ancient characters or drawings carved on the surfaces fade before archaeologists excavate them. One of the problems that archaeologists encounter after collecting these stones is how to accurately recover the information on the external surface of the monuments.
In the past, the stone rubbing method was commonly used to recover inscriptions on monuments. This method extracts important features from the surface of the stone by rubbing rendering materials over paper placed on top of the stone monuments [
4]. The quality of the relief extracted through this method depends on the professional experience of the epigrapher. If the technique is applied carelessly, the cultural monuments which have undergone abrasion can be further damaged or contaminated. To prevent damages and avoid labor costs for repairs, non-physical methods for extracting relief from monuments have received considerable attention lately in the field of computer graphics and computer vision [
5,
6,
7,
8,
9,
10]. The decorrelation stretch (DStretch), an image processing plug-in made by Defrasne [
5], was applied to enhance images of faint reliefs carved on rocks [
11]. DStretch involves the application of the Karhunen–Loeve transformation to a 2D colored image of the surface of a rock to obtain a 3 × 3 transformation matrix. The product of the obtained transformation matrix and the image that contains faint reliefs on rock produced a new image with enhanced reliefs. However, the performance of this functional software is not reliable in extracting reliefs when the surfaces of the monuments contain severely damaged regions. In another study, a feature extraction method, known as the Hough transform, was used for the representation of surface features by applying the feature curve approximation function to a family of curves [
9]. This transformation was demonstrated to be effective in the recognition of decorative patterns from the surface of defective or severely degraded archaeological objects. Recently, Romanengo et al. [
10] extended the application of Hough transform for surface representation by defining new set of rules and conditions for selecting suitable curve approximation that guarantees reliable recognition of decorative surface points. Furthermore, new curve models were analyzed and added to the existing family of curves to increase the accuracy of identifying the characteristic curves.
With the introduction of sophisticated 3D scanners, it is now realistic to extract reliefs from 3D scanned surfaces of stone monuments. The 3D scanned monument is represented as surface mesh with triangular faces. Several 3D data processing techniques can thereafter be applied to the 3D mesh to gain meaningful insights about the ancient monuments, such as changing the angle of views at various scales without optical illusions in the material pattern or discoloration [
6,
7,
12,
13,
14,
15]. Scanning defects in the form of outliers, noise, ghost geometry, and holes are usually introduced to the 3D mesh surface during the scanning process. A set of tools based on point modeling techniques was presented to address these problems [
16]. The point modeling techniques mainly involve data structures, i.e., the moving least square optimization and point relaxation functions. Another post-processing method based on normalized vector field was introduced and applied in operations such as surface smoothing, details enhancement, and artificial coloring of the 3D scanned surface [
6].
Considering a smooth base normal, a relief extraction technique that estimates the height distribution of reliefs and background by integrating relative heights between adjacent vertices was presented by Zatzarinni et al. [
8]. The normals of the base surface were first estimated to determine the height of the surface points and a Gaussian mixture model was applied to the height distribution to obtain a threshold that was used to decide if a surface point is a relief or background. Degraded regions were identified and removed using a filter that relies on the size and shape of the identified regions. This technique was demonstrated to be reliable in applications such as detail exaggeration and dampening, cut and paste of relief, and drawing of prominent curves. Recently, a digital 3D stone rubbing approach which also estimates the heights of mesh vertices using a weighted least square method was presented by Pan et al. [
15]. The estimated heights were transformed subsequently to grey values using a nonlinear transformation function. The transformed heights were segmented into black, white, or grey colors based on the relationship between the individual height and the mean and standard deviation of the heights of neighboring vertices. In this manner, a digital stone rubbing similar to the traditional rubbing was determined from the 3D mesh.
Following the successful application of the Frangi filter in the detection of blood vesselness [
17], a modified Frangi filter was developed to extract relief details from the surface of 3D mesh [
7,
18]. Considering the canal-like shape of the reliefs, curvatures are intuitive and effective measures for detecting reliefs. At a position corresponding to the relief, its minimum and maximum curvatures,
and
, would be close to zero and a large value, respectively. The earlier modification of the Frangi filter is based on the computation of curvature to obtain carvings. This is achieved by clustering the surface regions and using a measure of saliency to rank the detected carvings on weathered plasters [
7]. In addition, the authors presented a flexible and interactive tool with simple visualization for modifying reliefs. While this method is not suitable for extracting reliefs from the rough surfaces of stele because the presence of degraded regions disrupt the ranking of the saliency, another variants of the Frangi filter handles this problem by applying two vesselness values of different curvature sizes and selecting an acceptable threshold to effectively remove the irregular surface regions [
18].
A handful of machine learning techniques have been introduced lately to analyze prehistoric cultural heritage [
19,
20,
21]. The features extracted from these monuments can include the textural information of the soil samples of the monuments or the digital contents of the 2D/3D images that are captured by electronic cameras and scanners. Liu et al. [
22] presented a supervised machine learning method to refine bas-relief surfaces for reversed engineering. Initially, the surface of the bas-relief was segmented using a snake-based method and the background region was estimated using b-spline surface fitting curves. Although the results obtained are promising, the roughness nature of the surface of the stele affects the performance of this method. In addition, the method considered only the relief and background labels, and ignored the degraded surface region. The use of the two-class labels affects the performance of these models since the degraded surface region share geometrical features similar to the reliefs, and this interferes in the conditions set for extracting reliefs [
23].
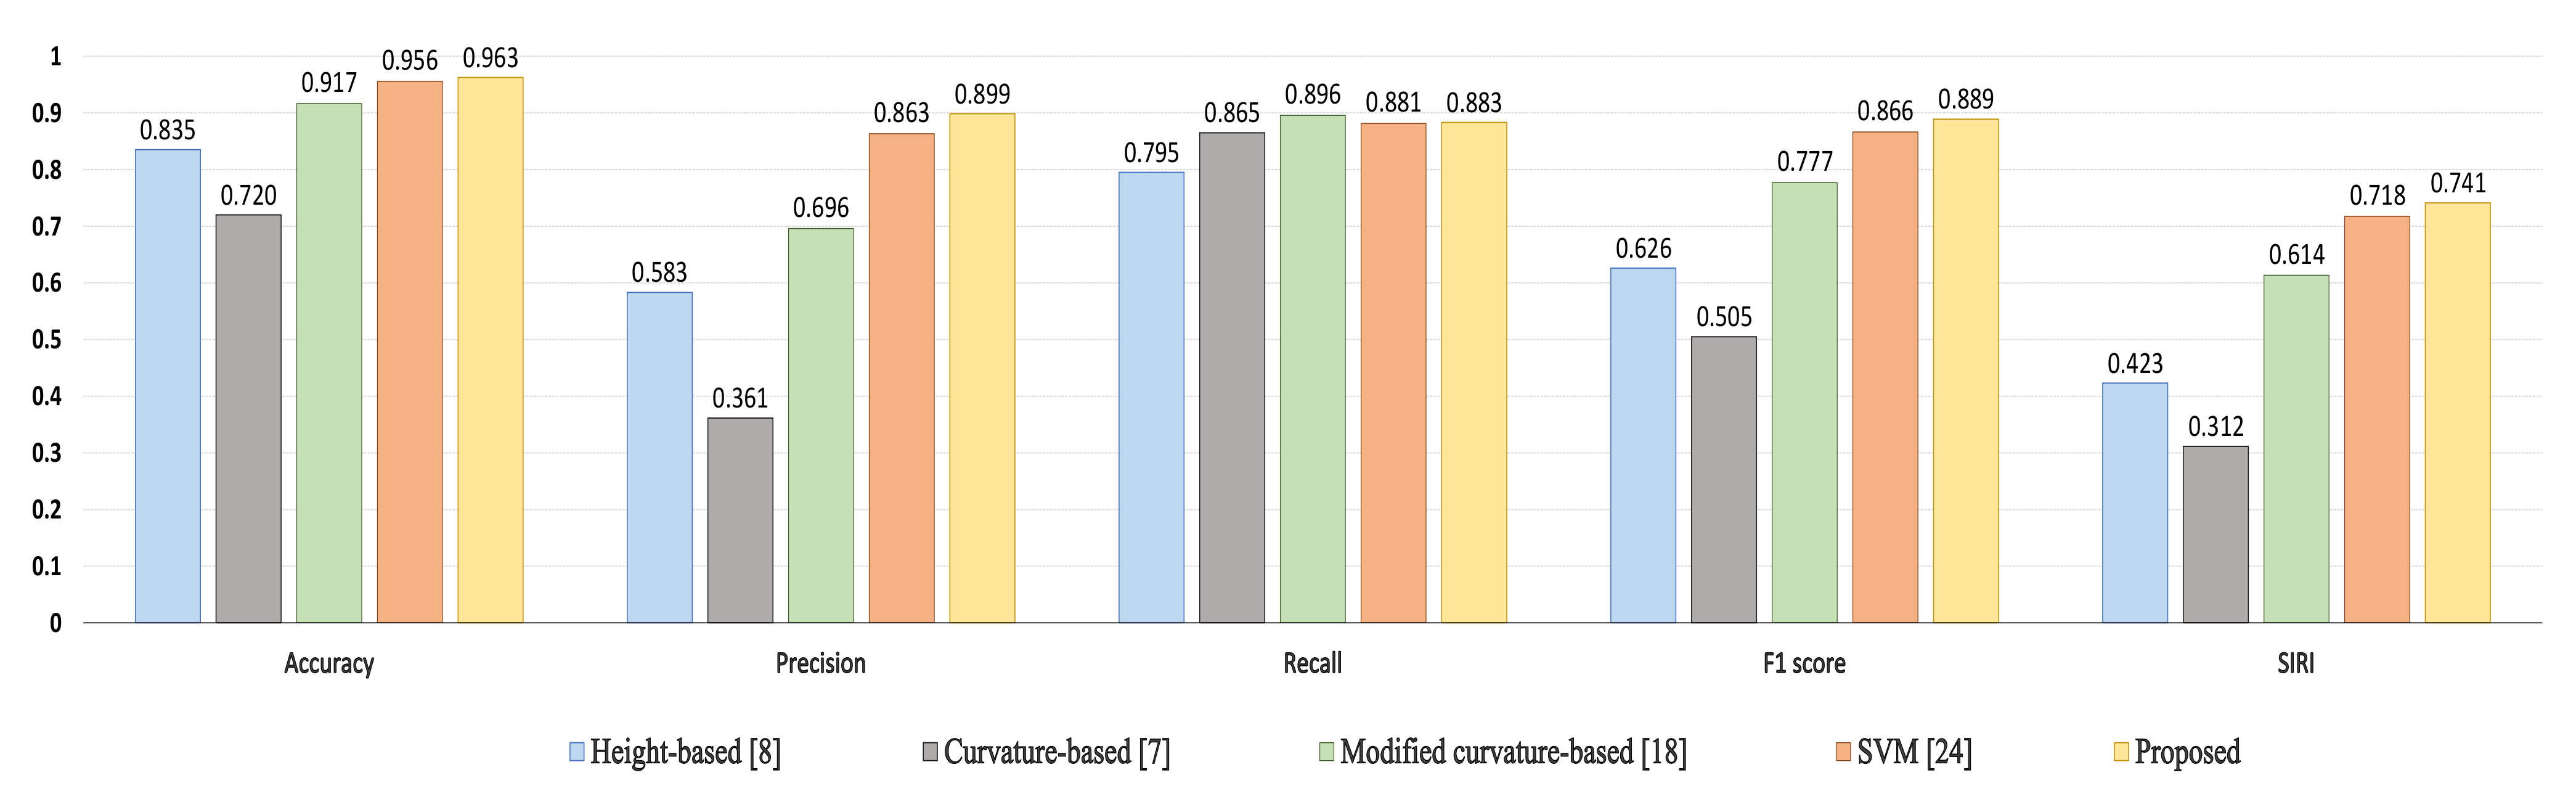
More recently, support vector machine (SVM) was applied to extract relief region from the surface of stone monument [
24]. The modified curvature-based method [
18] was initially used to identify relief candidate segments from mesh partitions. The relief candidates include actual reliefs and relief-like noise. From each candidate segment, 79-dimensional geometrical features were extracted, which consist of the appearance, quadratic approximation for cross section, and local extrema of the candidate segments. The geometrical information was learned by the SVM to determine whether the candidate is relief or not. While this machine learning method outperformed the height estimation [
8] and curvature-based methods [
7,
18], the superior performance of the SVM-based method [
24] is largely dependent on the local surface features that were identified on the 3D mesh and the conditions for the removal of degraded region.
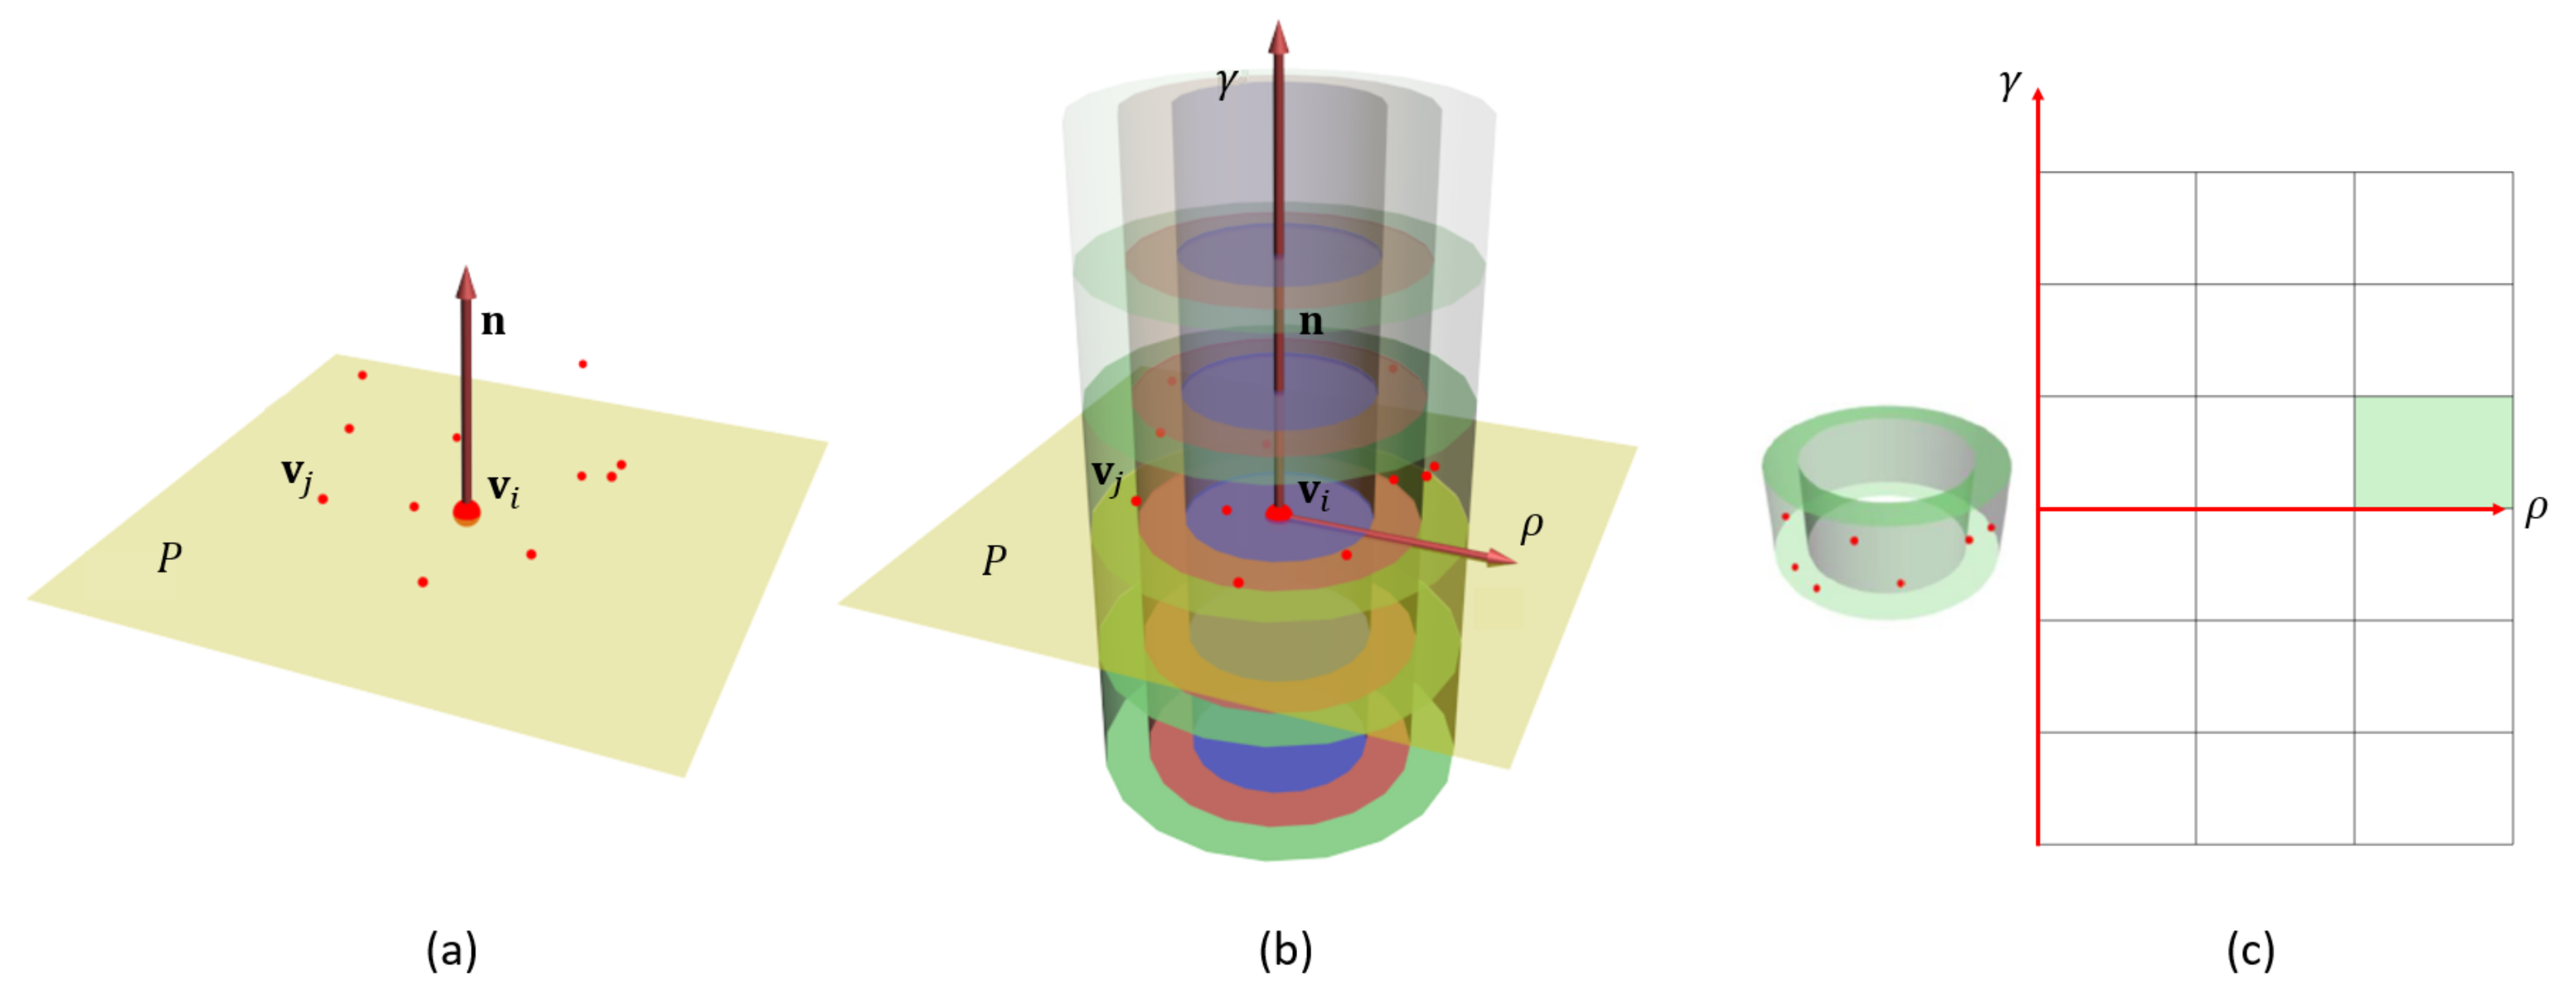
In this paper, we consider the spin image (SI) as features to describe the local surface of 3D mesh. SI is widely used in computer vision and computer-aided design because of its efficient shape representation of 3D objects which was posed as surface matching problem [
25]. The effectiveness of SI for describing the surface of steles had been promisingly demonstrated [
26]. The main contribution of this paper is the training of a machine learning classifier based on the SI descriptions that are extracted from the 3D mesh of very rough stele. In order to effectively distinguish the relief region from the background surface, we enhance the representation of the SI description by structurally configuring multiple SIs. Considering the canal-like shape of the reliefs, the minimal curvature direction,
follows the canal at a position within the relief, while the maximal curvature direction,
climbs up the canal along the cross section. As a result, the locations apart with a certain distance along
from the given relief position tend to belong to the identical relief, while the locations apart along
would be the background. Using the principal curvature directions at a particular vertex with reference, four relative surface points are identified on the 3D mesh. We refer to the aggregation of the SIs of these five points including the reference and its four relative points as cross spin image (CSI). In the proposed approach, the CSIs are extracted as features per vertex to train a three-class label random forest (RF) model. The class labels of the surface points include the relief, background, and the degraded region. The
k-nearest neighbors (
k-NN) algorithm is used to refine the classification results. The degraded region is identified and re-labeled to background region. As such, the proposed method classifies the surface points as relief or non-relief region. In contrast with the SVM-based method which classifies relief using candidate segment [
24], the classification of the proposed machine learning-based method is done per vertex.
The remaining sections of the paper are divided as follows: Studies relevant to the proposed method are discussed in
Section 2. We present the proposed approach in
Section 3. Various parameters used in the proposed method are determined and the performance of the proposed method is compared with existing techniques based on intuitive geometrical features in
Section 4. Finally, we conclude our findings in
Section 5.
3. Proposed Method
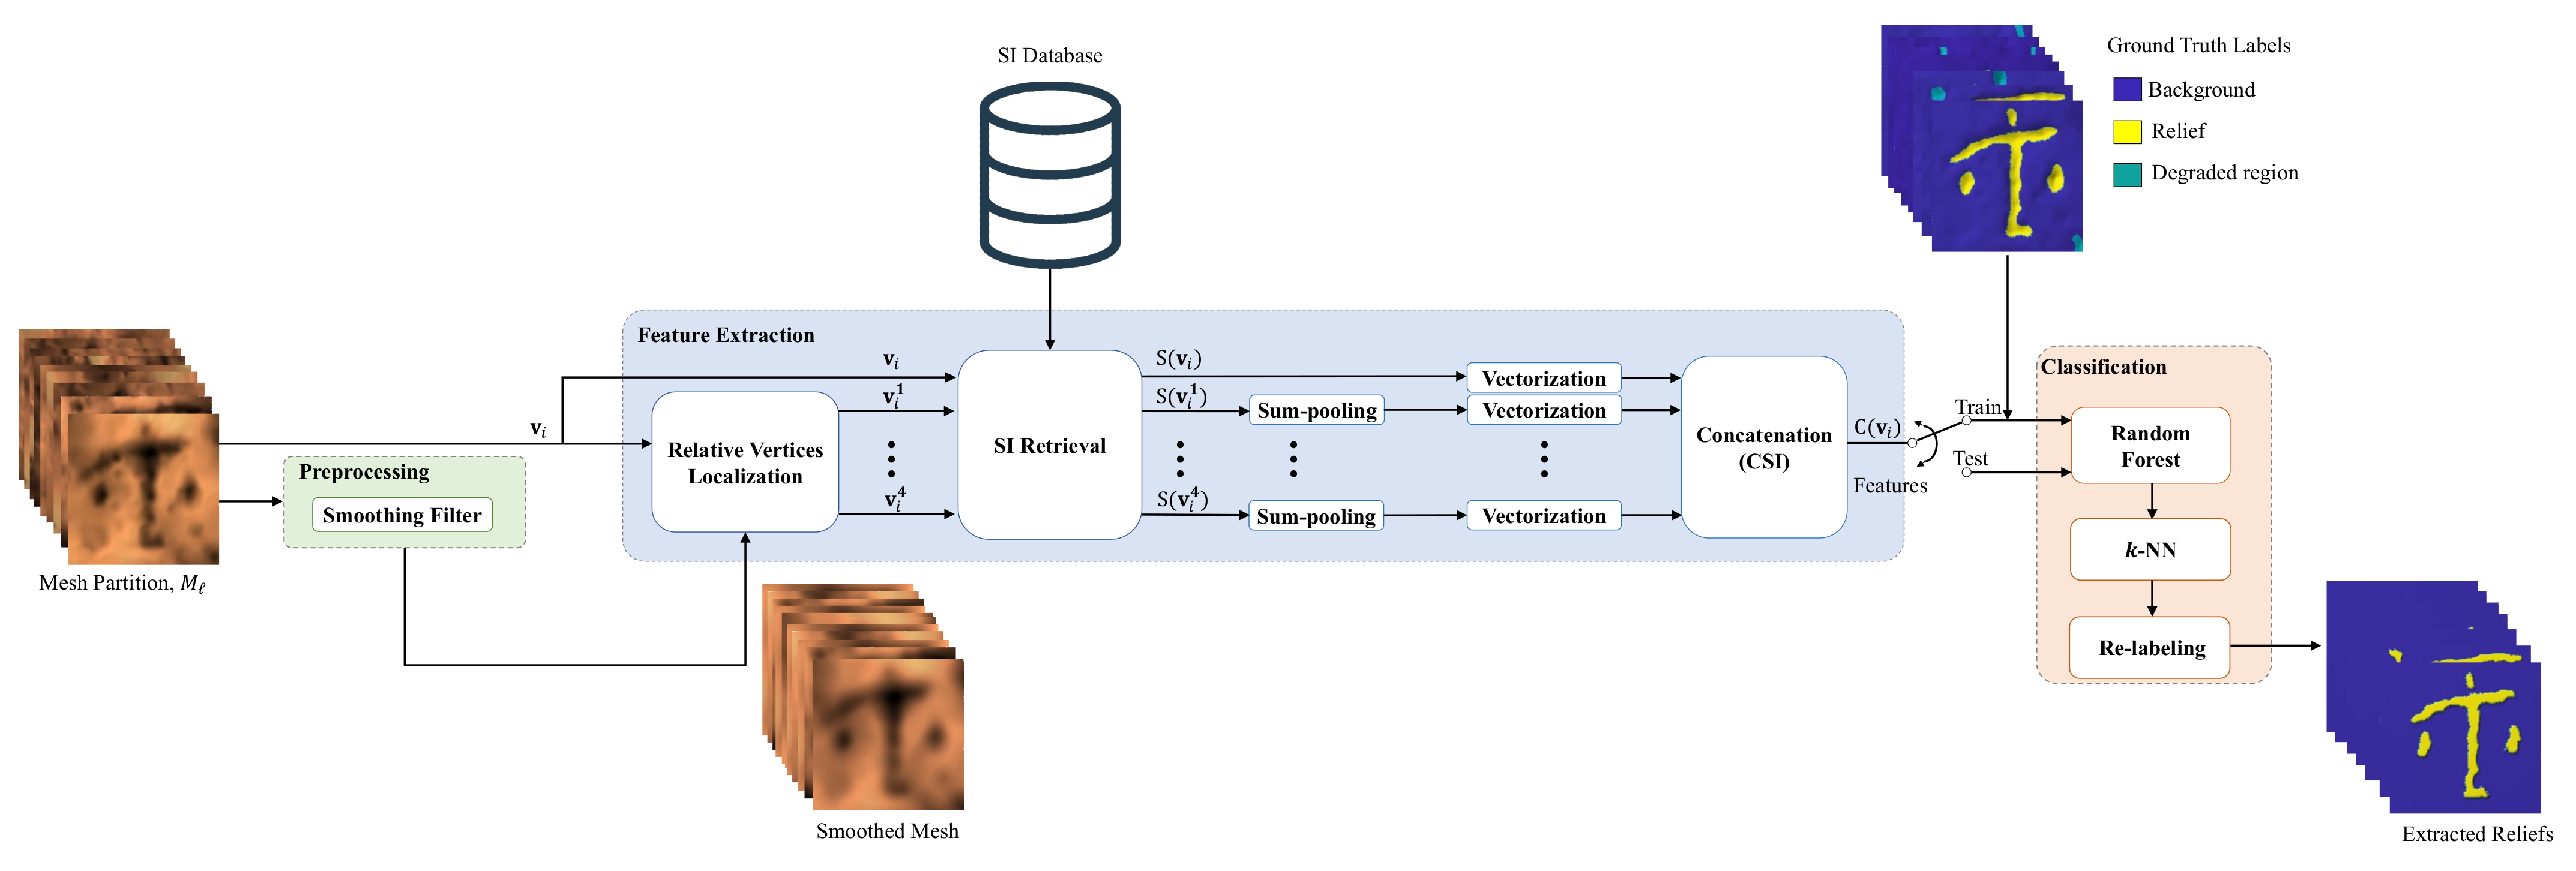
We present the proposed approach of extracting relief regions from the stone monuments in this section. A simple block diagram of the proposed relief extraction method is shown in
Figure 2. Mesh partitions that contain identifiable characters are cropped from the 3D mesh. For very uneven steles, the cropped mesh partition can be slanted. To correct this, principal components of vertices of the mesh partition are obtained using the principal component analysis. The mesh partition is transformed to make the eigenvector corresponding to the smallest eigenvalue point vertically upward. The transformed mesh partition is denoted by
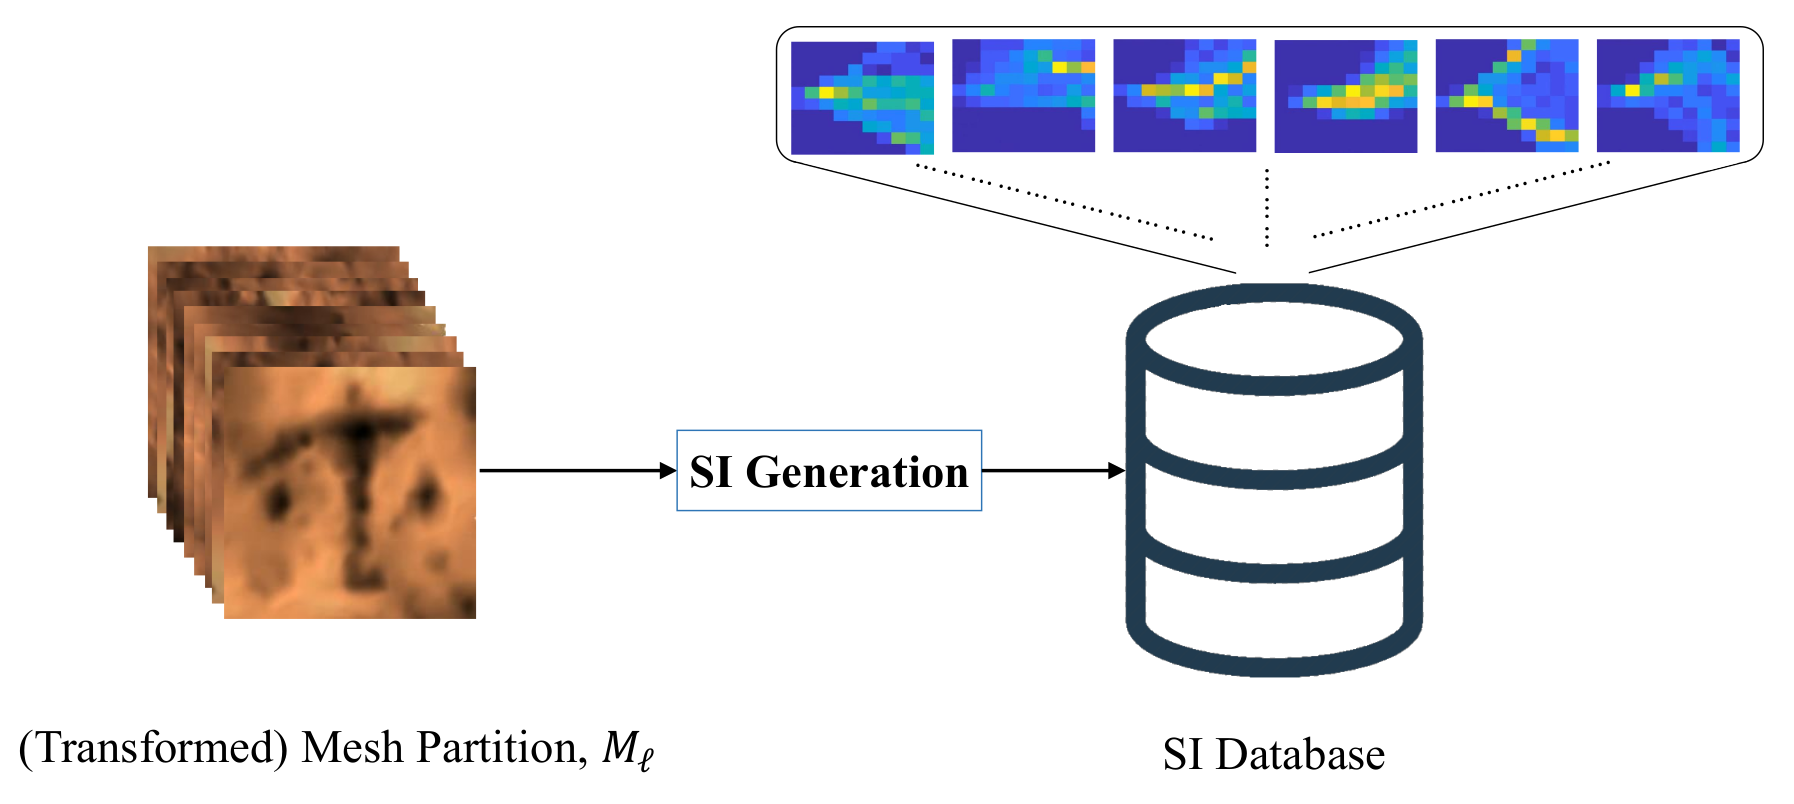
. The generation of SI involves the creation of SI for every vertex of all the 3D mesh partitions, and the information is stored offline in an SI database (
Figure 3). For a reference vertex
, four relative surface points,
,
,
, and
, are searched along the bi-directions of the two principal curvatures. The five SI representation,
,
,
,
, and
, are easily queried offline from the SI database.
The simple concatenation of the five SIs, however, causes the feature dimension to increase five times. In order to avoid overfitting and training time increase, the dimensions of the SIs of the four localized vertices are reduced effectively by the sum-pooling operation. The spin image information of the five vertices are merged to form a feature vector, which is referred to as the CSI of and is denoted by . The CSI is used for the training of a three-class label RF model.
Classification per vertex may cause isolated misclassified vertices. The k-NN algorithm is applied to correct such noisy misclassification, which improves the performance of the proposed method as well as enhances the visualization of the classification results.
3.1. Preprocessing
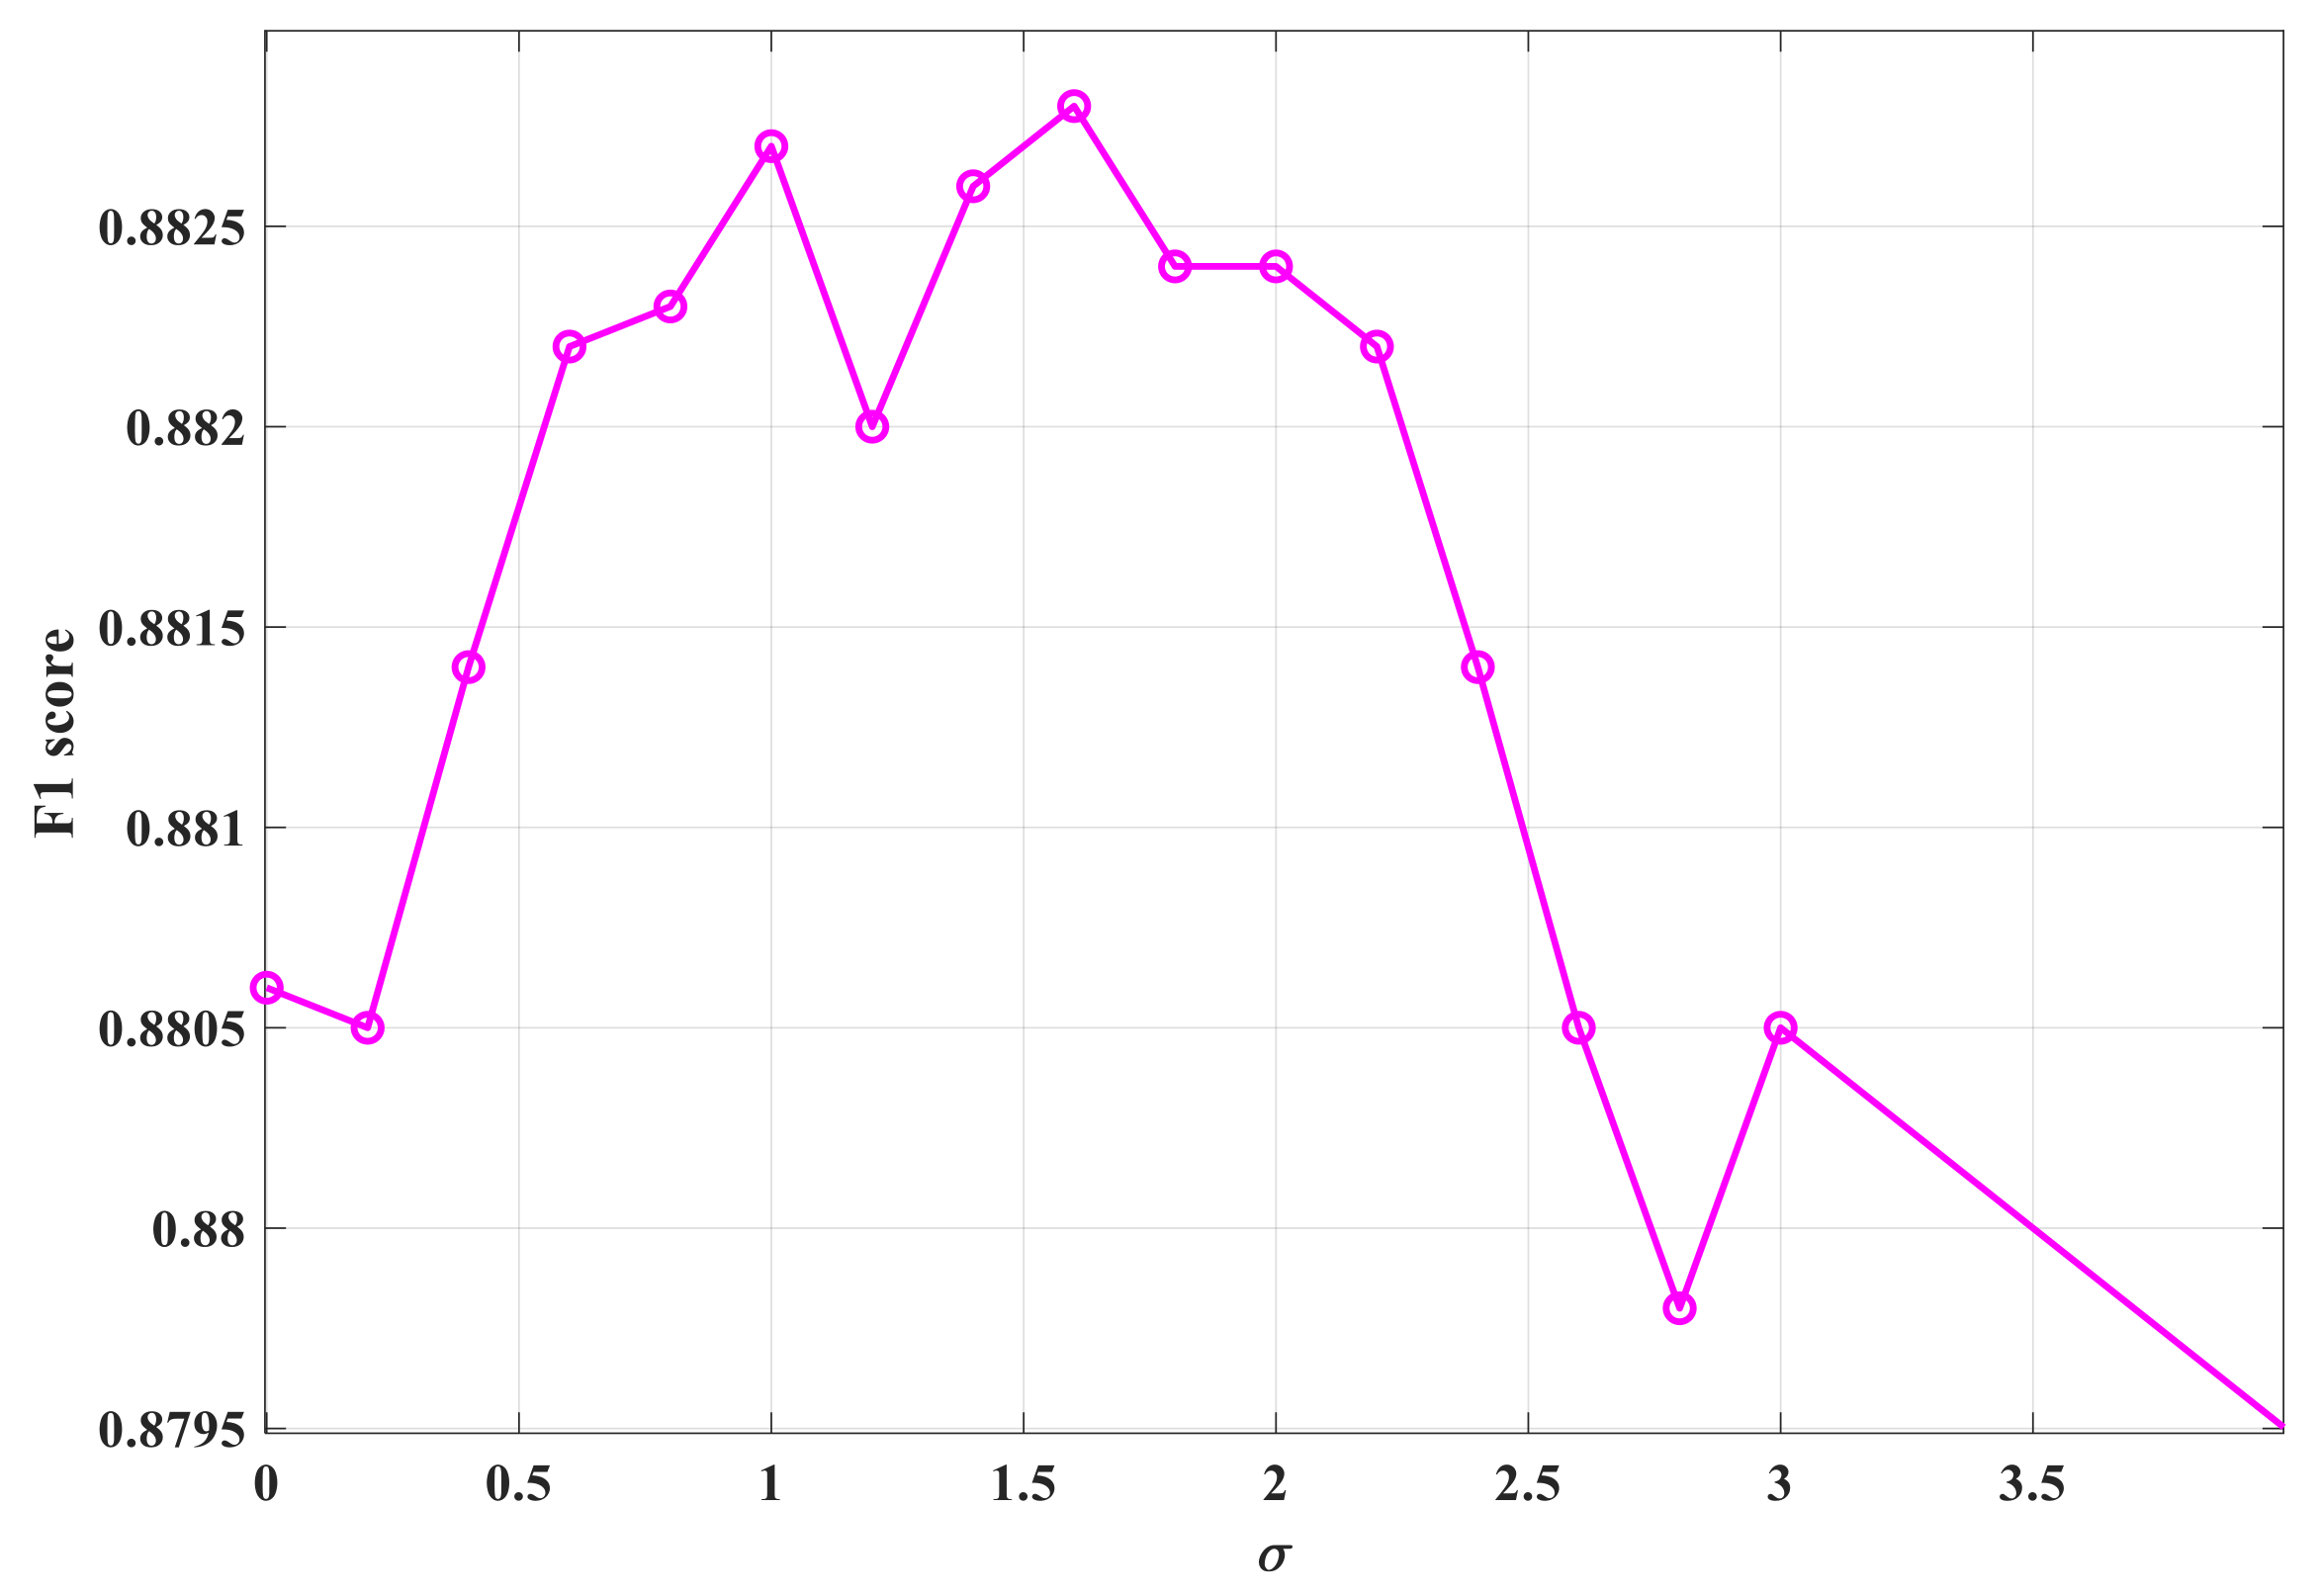
As mentioned above, the roughness nature of the surface of the ancient stele hinders the reliable estimation of surface curvatures. To address this problem, the input mesh is smoothed using the Gaussian filter with the standard deviation before estimating the curvatures. It is notable that the smoothed mesh is exploited only for curvature calculation. The SIs are generated using the original mesh without smoothing.
3.2. CSI Feature Extraction
The modules involved in the feature extraction process are explained as follows:
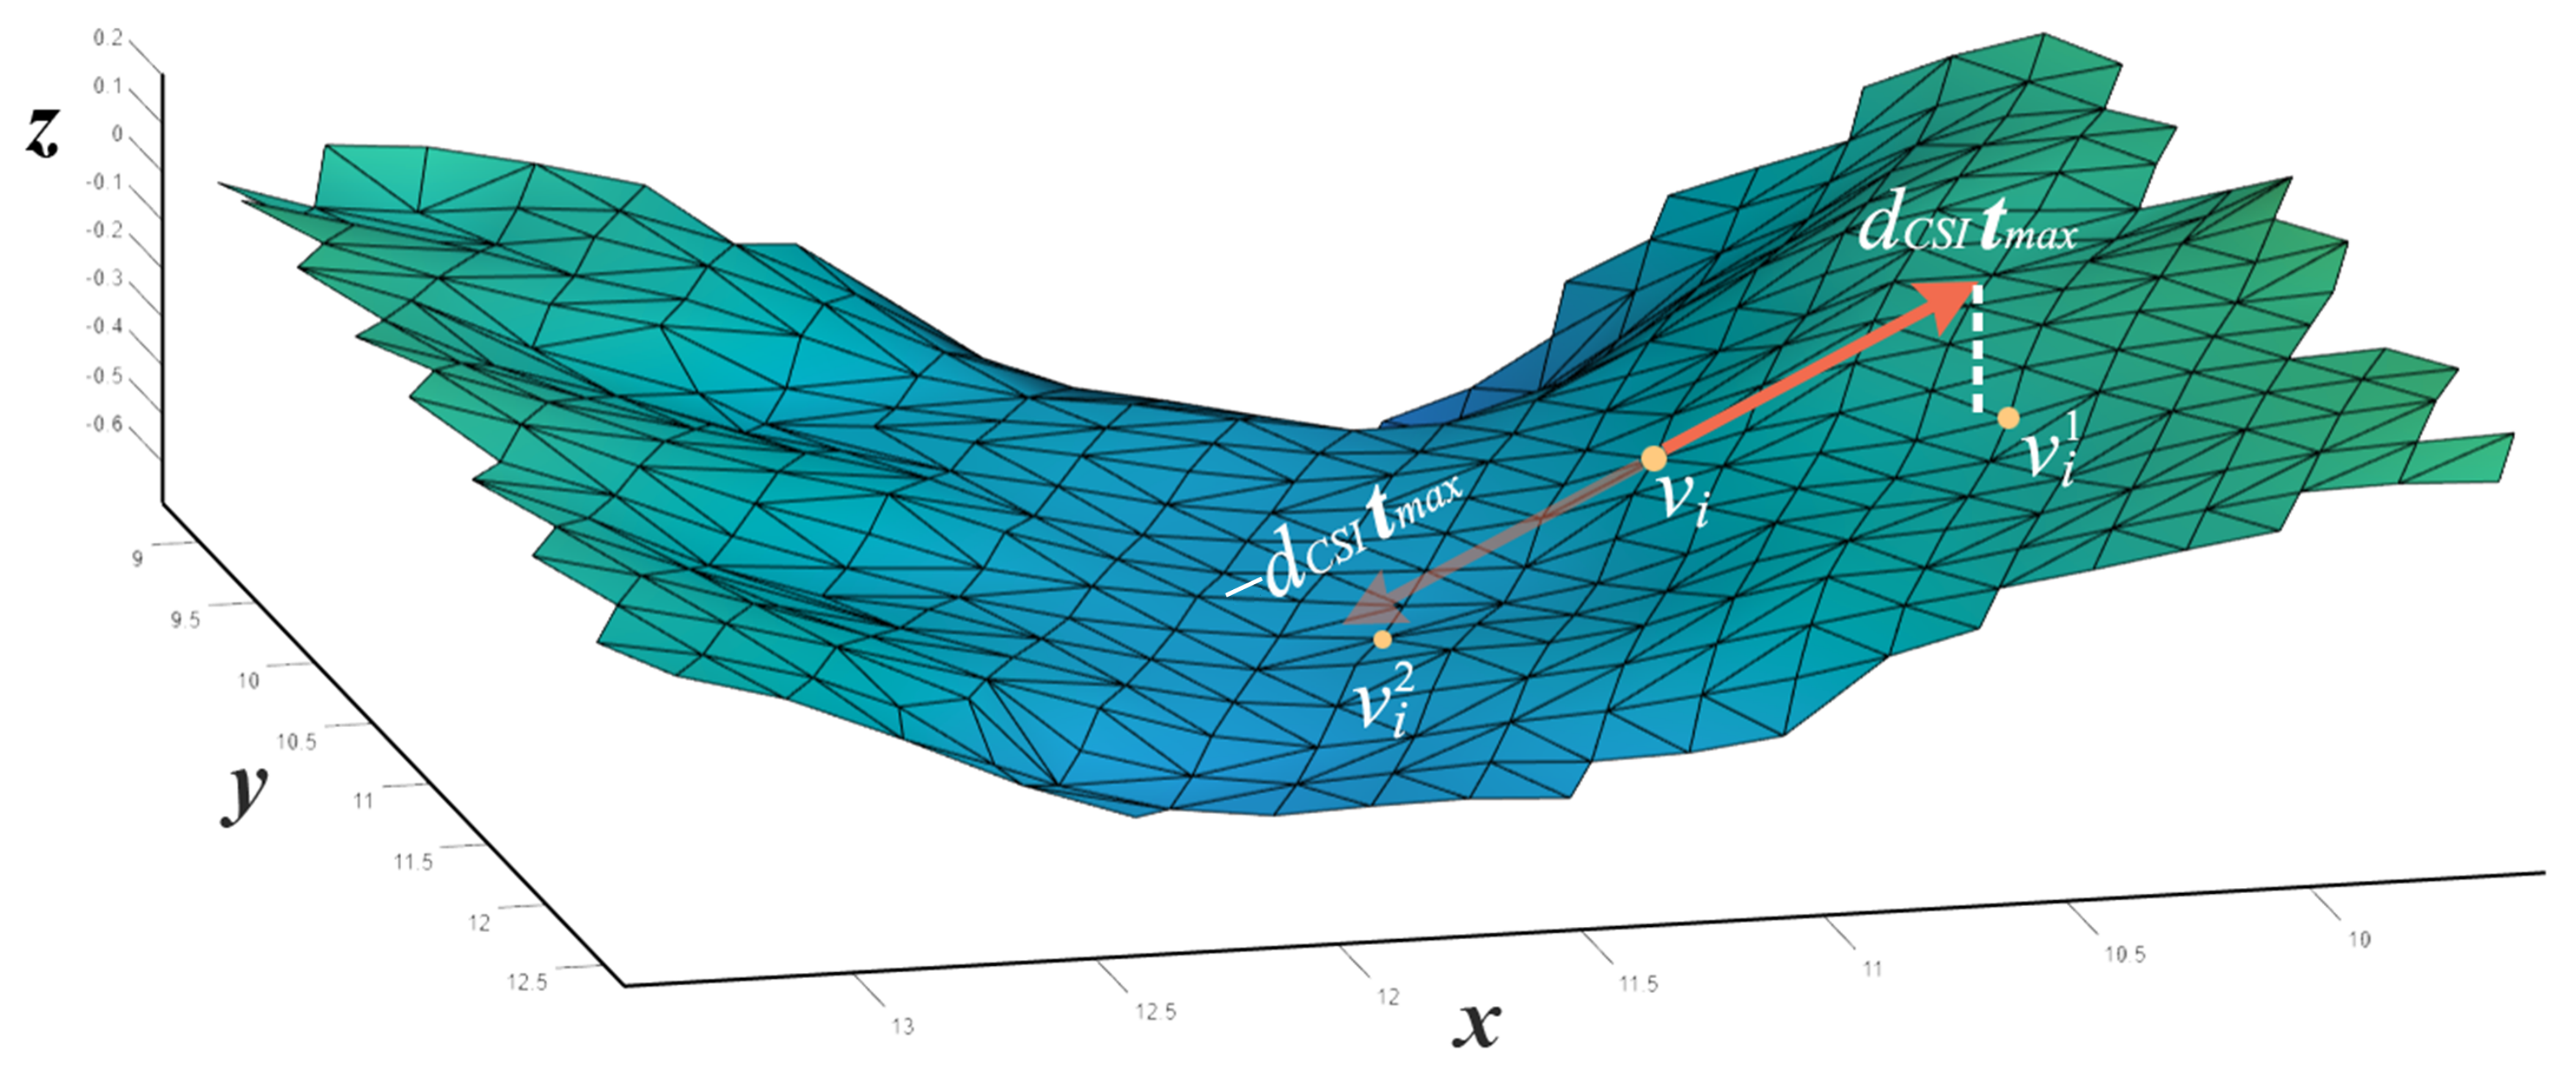
Relative vertices localization: As mentioned above, to enhance the classification performance at each vertex, the representation of a single SI is augmented with the SIs of its neighboring vertices. To estimate the position of the vertices along the principal curvatures of
, the curvature tensors and the curvature derivatives are initially determined, and then the principal curvatures whose directions are denoted by
and
are obtained [
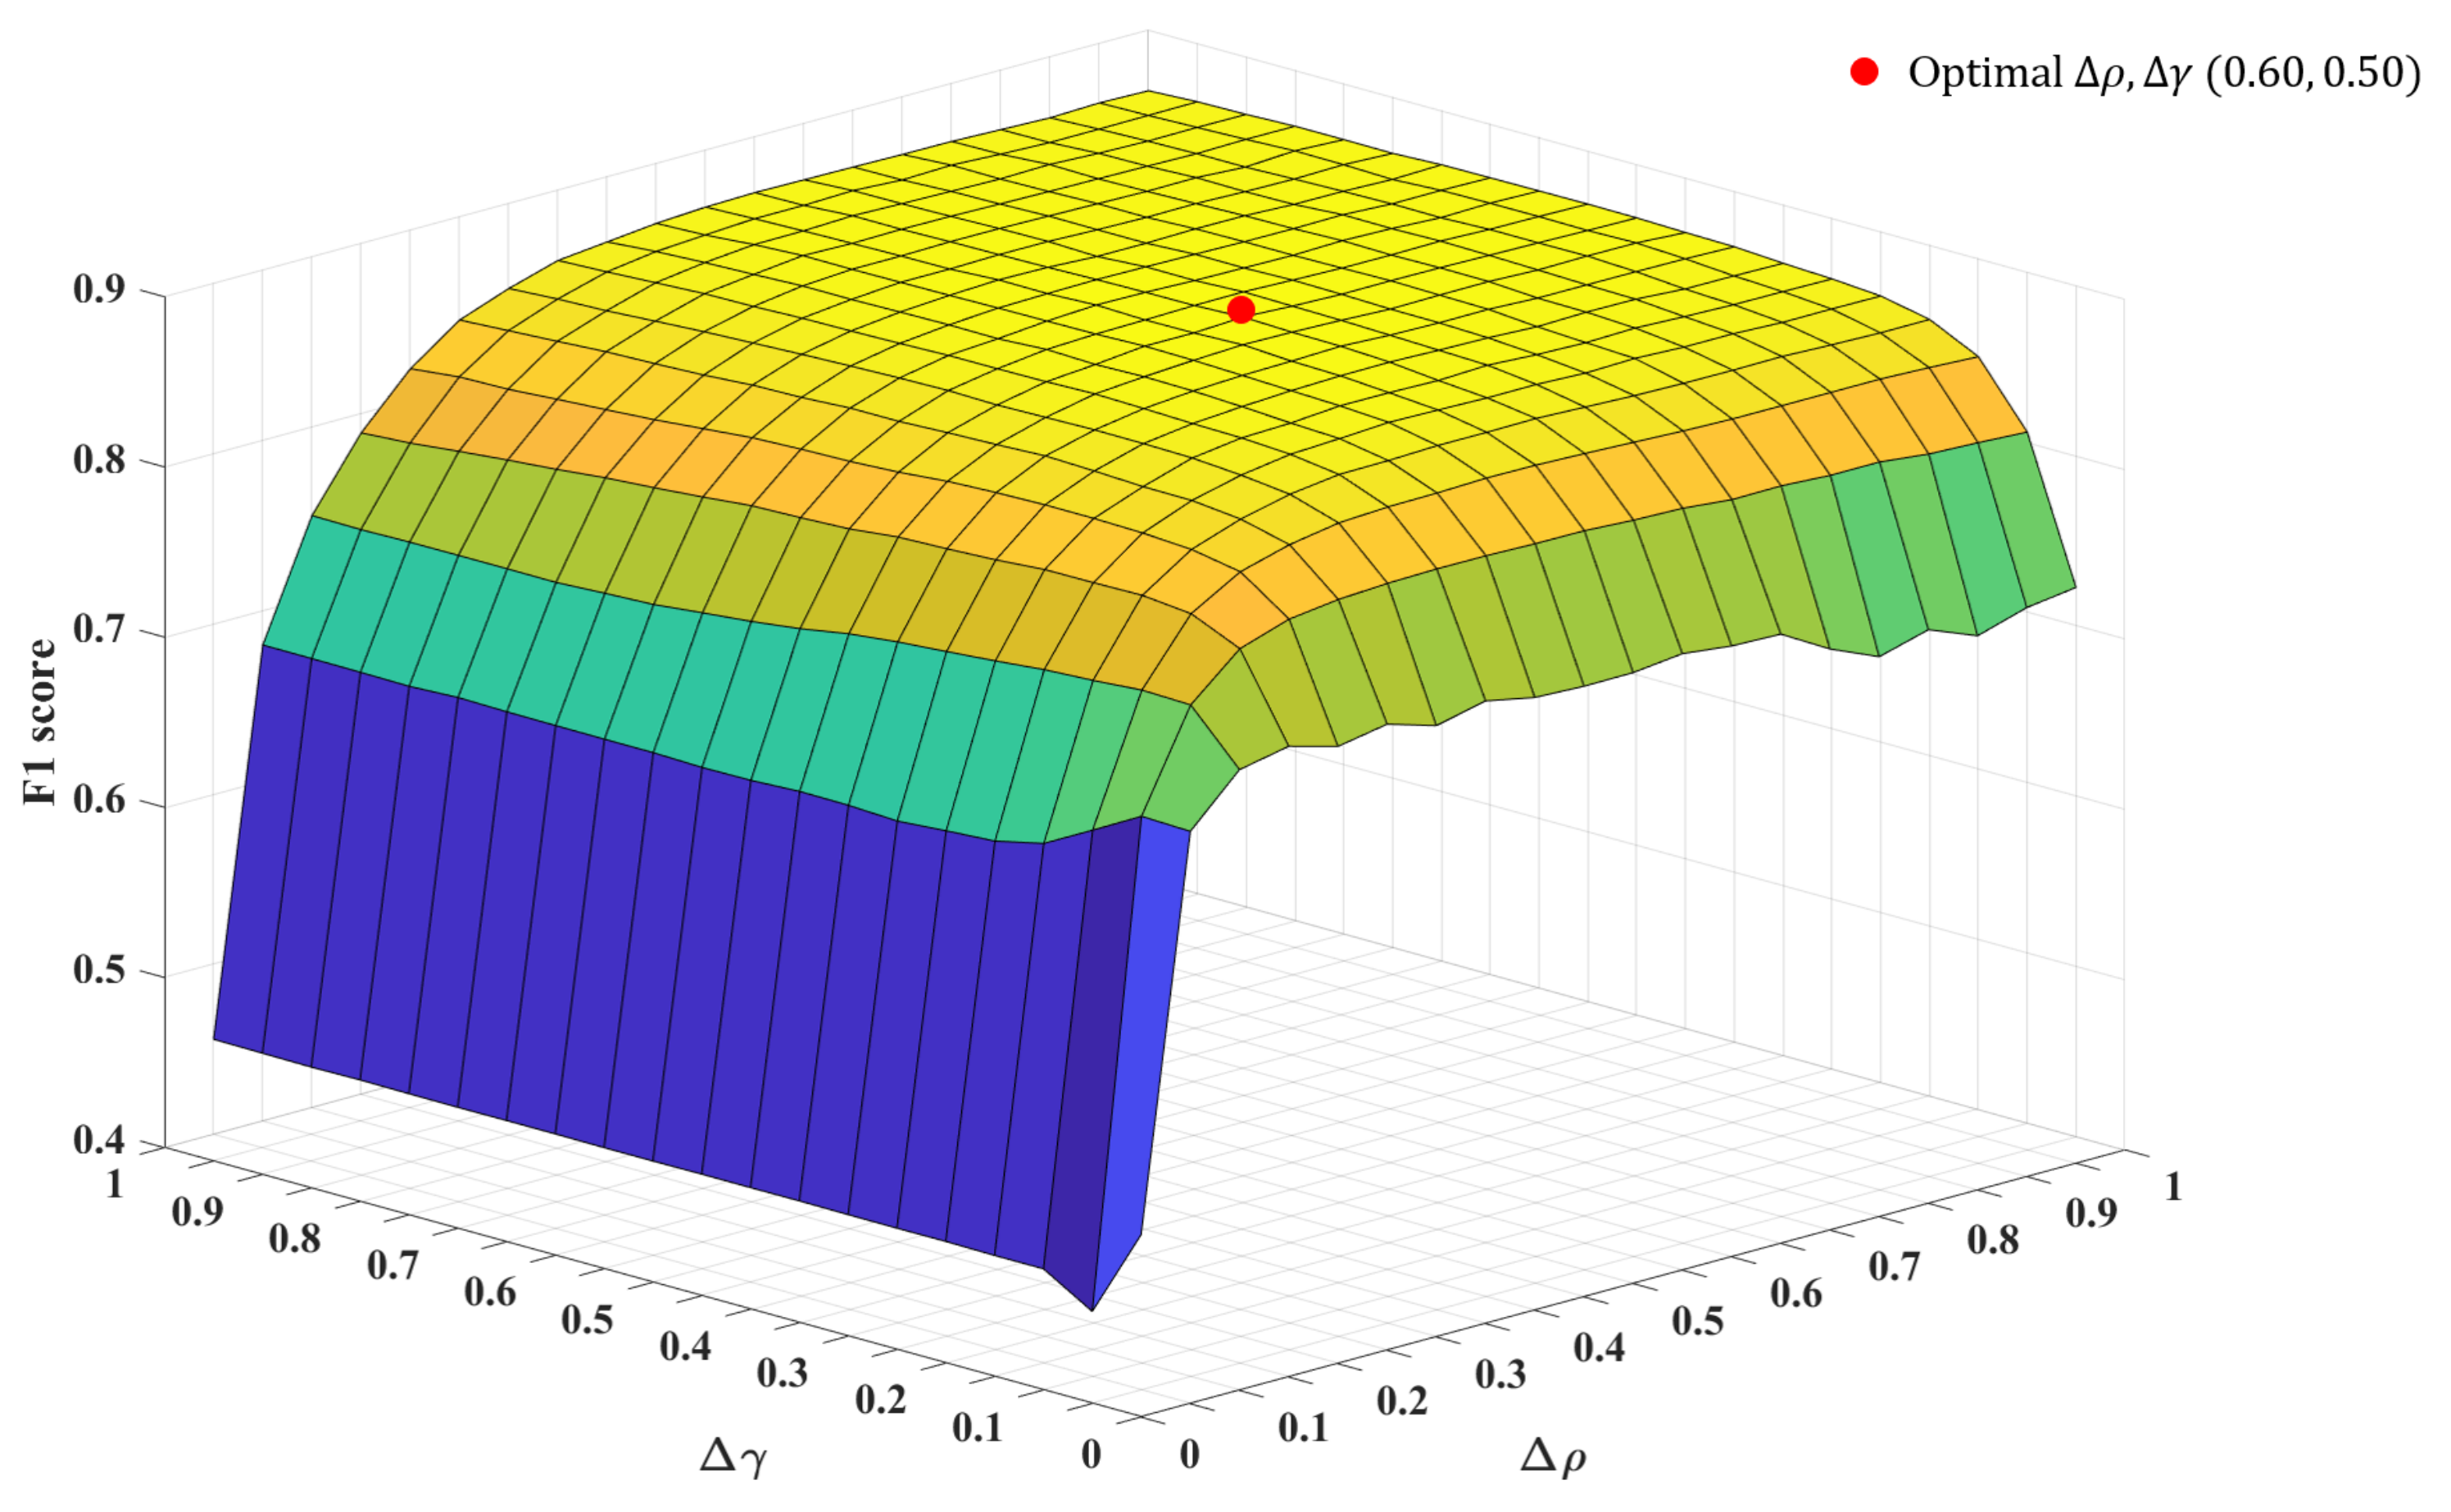
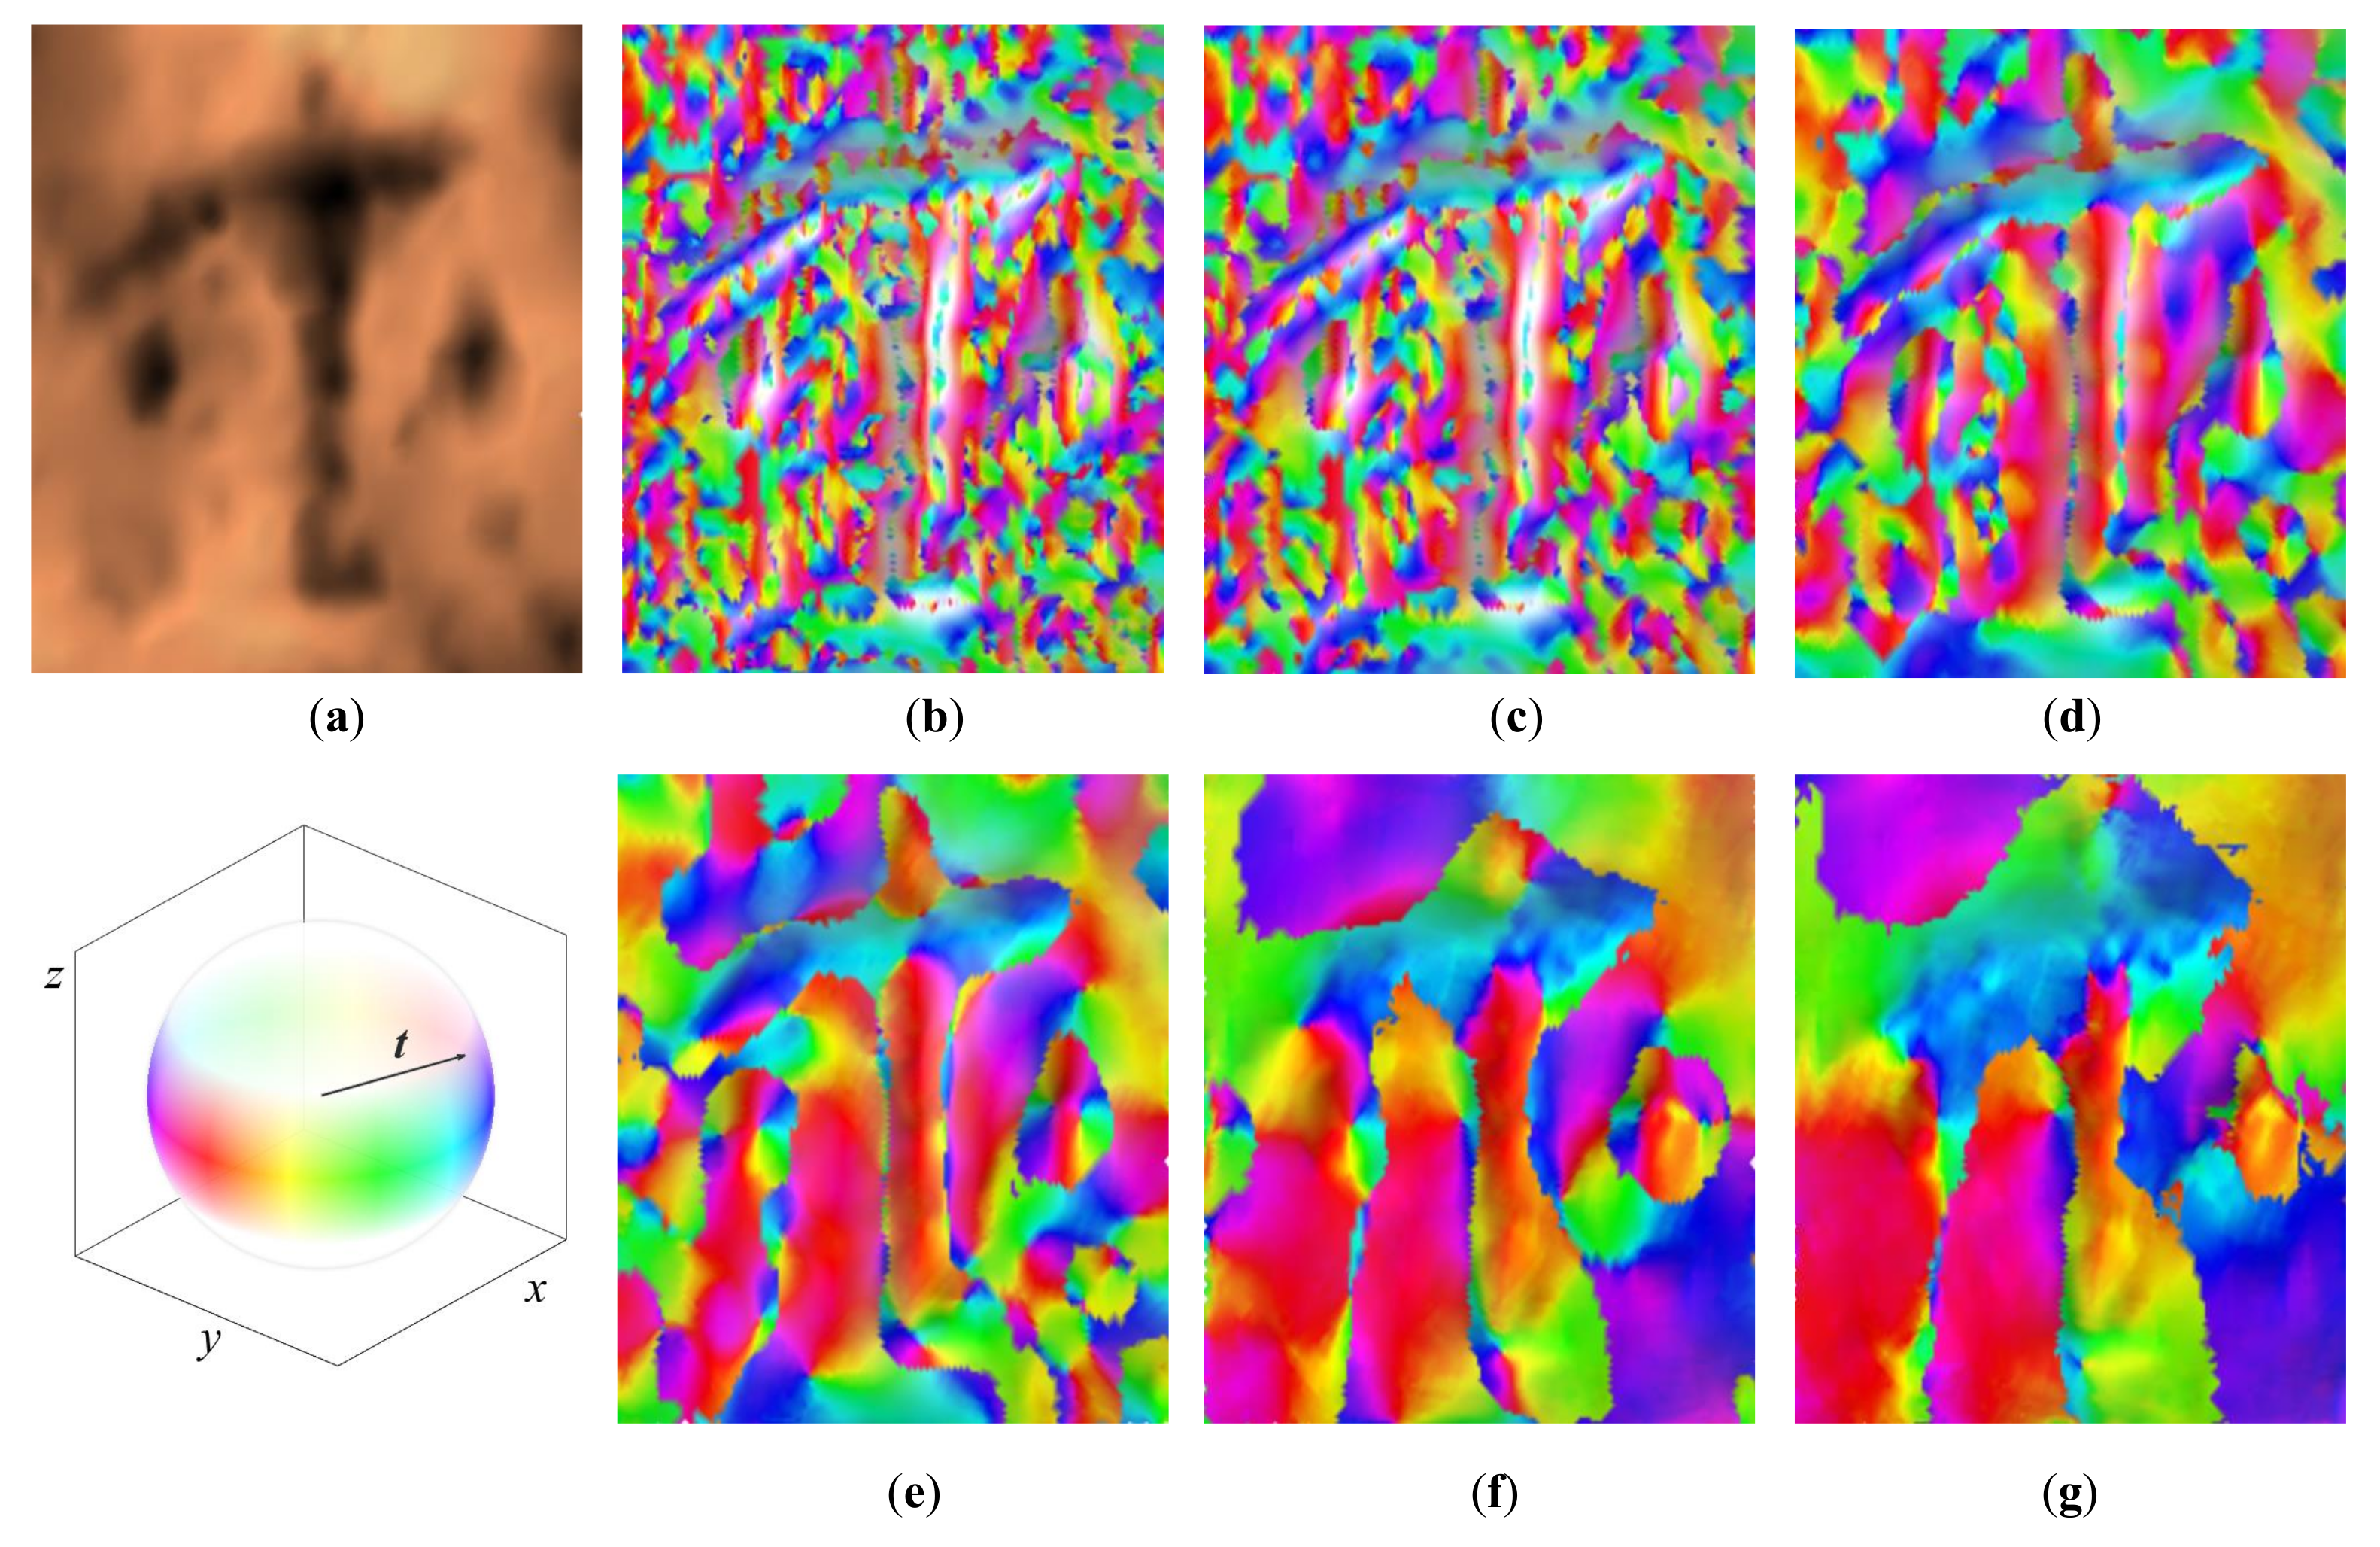
33]. 3D points at a distance of
from
along
,
,
, and
are identified. Since the points are probably not on the mesh surface, we project the 3D points on the mesh and find the vertices closest to the projections. For clarity, we illustrate in
Figure 4 how
and
are searched along the maximal principal direction; the same procedures are repeated in the minimal principal direction to search for
and
. Once
,
,
, and
are determined, the SI information of these surface points and
are retrieved from the SI database.
Sum-pooling: To reduce the dimension of
, each SI is subsampled by using a sum-pooling operation with
filters and stride
s. That is, adjacent
bins of the SI are summed up to yield a single bin of the subsampled SI. Therefore, the dimensions of each SI reduces from
to
. The purpose of this operation is to reduce the size of the SIs while preserving important information before they are vectorized. The sum-pooling operation is inspired by the multi-resolution SI, which applies the concept of pyramid structure of an image to compress a high resolution SI [
27]. It is notable that the sum-pooling operation is actually identical to generating SI by partitioning the same 3D space into smaller number of larger subvolumes. In our experiments,
s was set to 2.
Vectorization: This operation converts the original SI information to vector of length for easy merging with the four subsampled SIs. The operation is also repeated for the four subsampled SIs before they are merged. For each of the subsampled SI, the length of the vector is .
Concatenation: All five vectors obtained from the output of the vectorization stages are concatenated to a single feature vector of length . The concatenated array forms the CSI and it is denoted as .
3.3. Classification
Random forest has been widely and successfully used for various classification problems. We trained a three-class label RF classifier and searched for the optimal set of hyperparameters by varying the number of trees and maximum depth during training. The search for the optimal set of parameters guarantees that the RF model with the best performance is used for the extraction of reliefs from the surface of the stele. The k-NN search algorithm is applied to refine the classification results of the trained RF. The idea of this complementary application is to re-label the surface points by considering the dominant label class of the nearest k neighbors of each vertex. Although the application of k-NN algorithm does not significantly improve the performance of the RF model, it gives a better visualization of the relief, background, and the degraded region. The final result with two classes of the relief and the background is obtained by re-labeling the degraded region class to the background class.


