Article

Seismic Performance of Deposit Slopes with Underlying Bedrock before and after Reinforcement by Stabilizing Piles

1
State Key Laboratory of Geomechanics and Geotechnical Engineering, Institute of Rock and Soil Mechanics, Chinese Academy of Sciences, Wuhan 430071, China
2
University of Chinese Academy of Sciences, Beijing 100049, China
*
Author to whom correspondence should be addressed.
Appl. Sci. 2021, 11(12), 5664; https://doi.org/10.3390/app11125664
Submission received: 12 May 2021 / Revised: 28 May 2021 / Accepted: 8 June 2021 / Published: 18 June 2021
(This article belongs to the Section Earth Sciences)

Abstract

:
The seismic performance of stabilizing piles used to reinforce underlying bedrock in a deposit slope is a complex soil–structure interaction problem. Two centrifuge shaking table model testswere conducted to ascertain the dynamic responses of the underlying bedrock deposit slopes without and with the use of stabilizing piles during an earthquake. Multi-stage seismic waves with various peak accelerations were applied from the bottom of each model. The differencesin the response accelerations between the deposit and bedrock increase significantly with the increase in amplitude of the input seismic waves. The presence of the rock-socketed stabilizing piles can bridge the uncoordinated movement of the bedrock and the overlying deposit to some extent. The resultant force arising from a distributed load increment on the piles caused by an earthquake is mainly concentrated in the upper part. With increases in the peak ground acceleration of the input motion, the resistance of the bedrock in front of the stabilizing piles increases and the peak resistance under the bedrock surface of the stabilizing piles gradually moves downwards.This finding indicates that the strong seismic motion significantly changes the embedded working state of the stabilizing pile.

1. Introduction

Mixed rock and soil deposits mainly stem from landslide accumulation, residual accumulation, alluvial accumulation, etc., and are distributed widely as large-scale slopes in Sichuan Province, China [1,2]. Deposit collapse and landslides account for a significant proportion of the disasters caused by the Wenchuan earthquake [3,4,5]. Theoretical analysis and research have shown that the surface amplification effect of a seismic slope is closely related to the impedance difference and wave velocity difference of near-surface geo-materials [6,7,8], such as the overlaying deposit (filling layer, colluvium layer, alluvium layer, etc.) on the bedrock, and the strong weathering layer covering the weak weathering layer, etc. [9,10,11]. Deposit slopes with underlying bedrock are prone to secondary disasters, such as dammed lakes and mudslides. In recent years, the construction of large-scale water conservancy projects, hydropower projects, and transportation hubs in south-western China has been undertaken, and the risk of huge loss of life and property caused by earthquakes is increasing.
Stabilizing piles are one of the most widely used engineering structures in landslide management because of their small disturbance of the surrounding geological environment, good support effect, and ease of construction [12,13,14,15]. On the other hand, the disaster investigation teams deployed after the Wenchuan earthquake found that stabilizing piles generally had a good anti-seismic effect, but there are also a large number of stabilizing piles that had overturned and even cracked and been broken [16]. This suggests that the current understanding of the anti-seismic mechanism of stabilizing piles is not yet clear: design and theory lack practical application and remain to be explored.
To understand the seismic strengthening mechanism of slope-stabilizing piles, it is necessary to clarify the dynamic responses of slopes under seismic action, the distribution of the stabilizing pile bending moment, and the distribution of earth pressures thereon. At present, the research methods deployed include on-site monitoring [17,18,19,20] and model testing [21,22,23,24,25,26]. In recent years, more numerical simulation data have been made available from studies of slopes reinforced by stabilizing piles. The software FLAC is used by Ellis et al. [27] to perform the analyses of the effective working conditions of the soil arching effect between the stabilizing piles and the influence of stabilizing piles on the safety factor of the slope. Sharafi and Shams Maleki [28] adopt the three-dimensional finite difference numerical simulation method to study the influence of multiple excitation directions of seismic waves on the lateral displacements of a sand slope reinforced by a row of floating piles. The simulation results show that, compared with the unreinforced sandy slope, the insertion of a row of stabilizing piles (at a pile spacing some 2.5 times the pile diameter) reduces the slope lateral displacement by more than 50%. Won et al. [29] conducted a slope stability analysis of a slope–pile system by numerical simulations. The results show that the coupling analysis method can better reflect the pile–soil interaction, which is more consistent with reality. The boundary conditions of the pile head and the bending stiffness of the pile exert a considerable influence on the stability safety factor of the slope. Using a numerical simulation analysis, Erfani Joorabchi et al. [30] proposed a method for determining the yield acceleration of a slope reinforced with a row of drilled shafts under seismic load. Kanagasabai et al. [31,32] studied the response characteristics of an embedded single pile used to reinforce an unstable mass through a 3D finite difference numerical analysis. The numerical results show that the strength parameters of the slip interface have a significant influence on the behavior of the pile. However, most of these studies are focused on the behavior of homogeneous slopes reinforced by stabilizing piles.
The dynamic centrifuge model test can be used to simulate the prototype self-weight stress and replicate in situ stress conditions. The test results can be used to verify the reliability of a numerical simulation; because of its operability and repeatability, it is an important technique in research into the effects of seismicity on slopes. From the perspective of the interaction between homogeneous sand and a pile, the former studies mainly focus on the seismic response characteristics of a slope reinforced by stabilizing piles [21,22,23], the seismic response characteristics of inclined pile foundations [33], and the influence of liquefaction on pile foundations through centrifugal shaking table model tests [34,35,36], inter alia. From the perspective of the interaction between homogeneous clay and a pile, Wang and Zhang [24] conducted centrifuge model tests to study the seismic strengthening mechanism of stabilizing piles by assessing the deformation profiles of slopes reinforced by stabilizing piles under seismic load. Garala and Madabhushi [37] studied the interaction between friction piles and soft clay under seismic load in centrifuge model tests. The aforementioned dynamic model tests of slope stabilizing piles, and their mechanism of action, are mainly based on the dynamic response characteristics of sand, clay, and other homogeneous slopes; however, there are few studies on the dynamic response of a deposit slope with underlying bedrock and the working mechanism of the coarse-grained rock and soil mixture deposits, thus making it difficult to meet the needs of engineering practice.
Therefore, in this research, two sets of centrifuge shaking table model tests were conducted to study the seismic response of a deposit slope with underlying bedrock and with stabilizing pile reinforcement and a similar unreinforced slope. The distributions of bending moments and lateral pile–soil load under continuous multi-level seismic loading were further explored. In the present work, the results are presented in terms of prototype-scale.

2. Centrifuge Testing Program

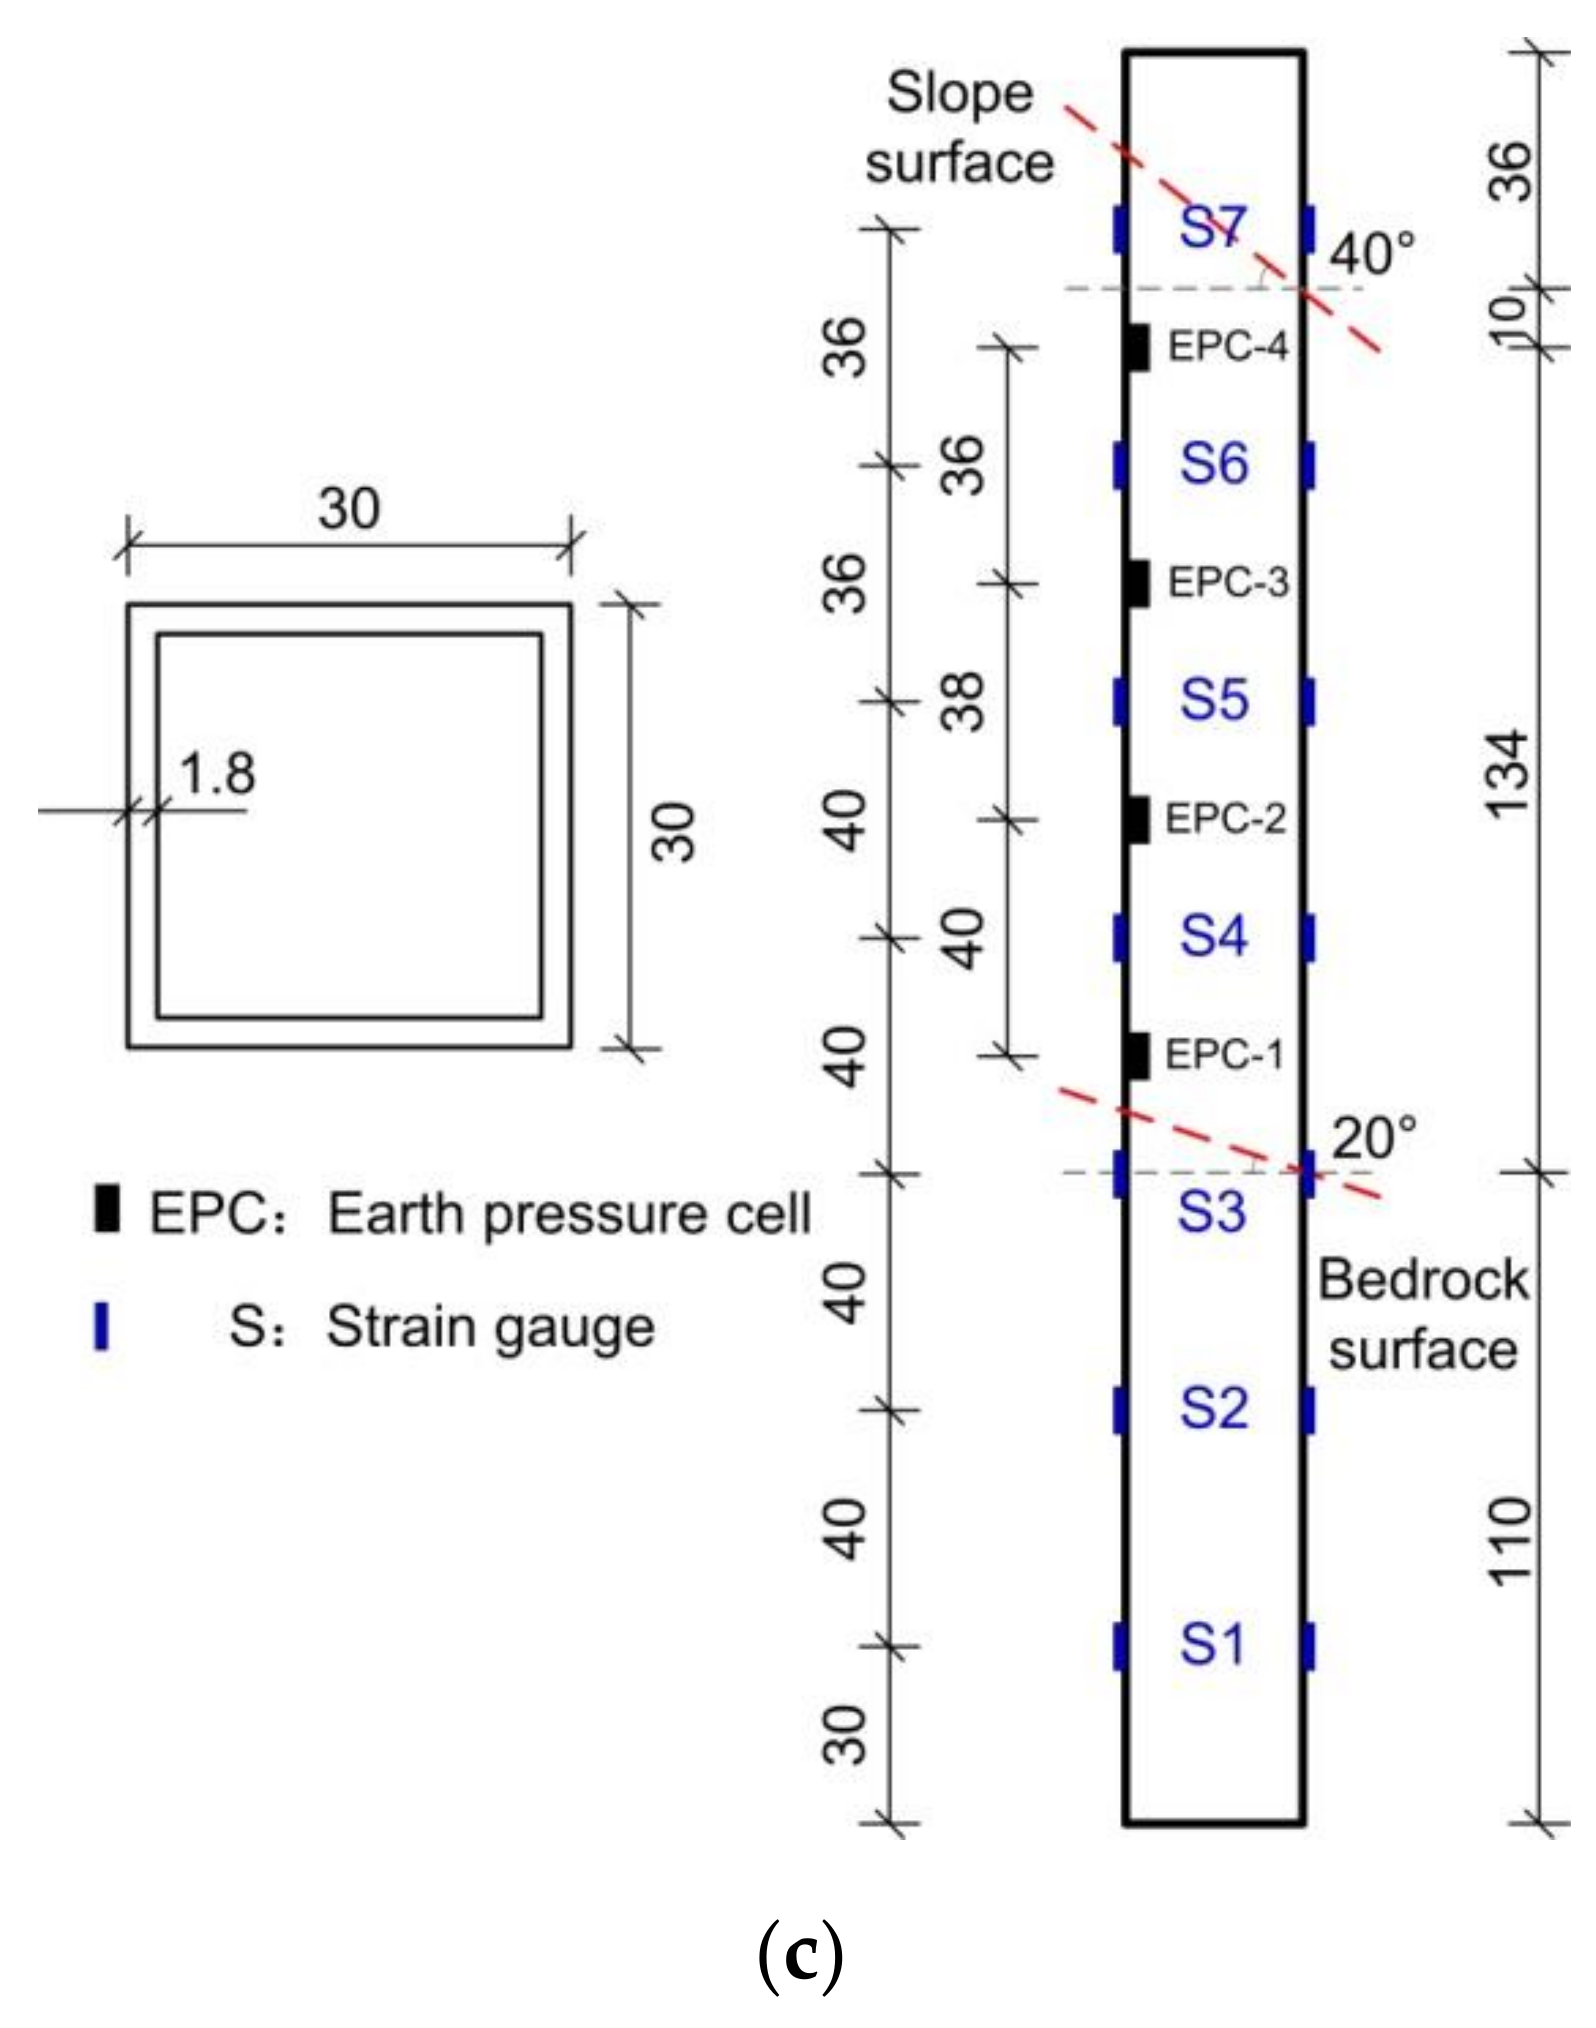
2.1. Test Instrumentation

The testing facilities included a ZJU-400 centrifuge and an electro-hydraulic servo-controlled shaking table developed by staff at Zhejiang University, China. It has an effective radius of 4.50 m and a capacity of 400 g-tons. The size of the shaking table used in the tests is 800 mm in length and 600 mm in width. Its loading capacity is 0.5 ton. The seismic waves were applied to the model in the horizontal direction through the shaking table, which had a maximum acceleration capacity of 40 g [38,39]. The advantage of the centrifuge is that it allows the use of reduced-scale models to realize full-scale stress conditions. A rectangular rigid model box with internal dimensions of 770 mm × 400 mm × 530 mm (length × width × height) was used. A layer of soft plasticine plate with a thickness of 25 mm was sandwiched between the deposit and each end-wall. This set-up was used to absorb energy and reduce the intensity of reflected waves at the boundaries in the shaking direction [40].

2.2. Similarity Relationship and Slope Model Design

The similarity scale of the slope model is 50 (prototype size/model size = 50), and the similar relationship of the centrifuge model is summarized in Table 1. In the present work, the model is somewhat idealized. The model is intended for use as a generic study of the seismic response mechanism rather than to represent a specific prototype. Figure 1 shows the schematic views of the unreinforced slope model (1# model), the pile-reinforced slope model (2# model), and the model piles used for the primary test. The geometry of the unreinforced slope is identical to that of the pile-reinforced model.
The stabilizing piles in the 2# model were made of aluminium alloy hollow square tubes, with a side length of 30 mm and a thickness of 1.8 mm. The pile spacing was 4b, that is, S = 120 mm. The parameters pertaining to the prototype stabilizing pile are listed in Table 2. According to Kourkoulis et al. [32,41], the pile embedment depth Le ≥ 0.7Hu (Le is the pile embedment length and Hu is the depth of the unstable soil layer) can guarantee working stability when the pile is embedded in a stronger substratum. In the 2# model in Figure 1b, Le/Hu is nearly 0.61.

2.3. Soil Properties

Deposit samples were collected from the Mianmao Highway line, Sichuan Province. The sampled material has a small fine content, a mean grain size d50 of 3.3 mm, a uniformity coefficient Cu of 9.95, and a curvature coefficient Cc of 1.70. The particle size distribution characteristics of the tested deposit are listed in Table 3. The minimum and maximum void ratios (emin and emax) are 1.466 and 2.102, respectively. The internal friction angle of the tested deposit is 41° and its apparent cohesion is 4.8 kPa at a relative density of 0.628, and an initial dry density of 1.81 g/cm3.

2.4. Model Preparation and Test Procedure

The cemented material was used at a compacted density of 1.92 g/cm3 when used to represent the bedrock. The mass percentage composition of the cemented material was a silica sand:fines fraction of deposit:cement:water = 0.383:0.383:0.131:0.103, and rapid strengthening agents were added to 2% mass of the cement. Then, the constructed bedrock model was cured for six days and the dynamic centrifuge tests were performed on day 7. The friction angle was 44° and cohesion was 201 kPa for the cemented material after a 7-day curing period, as evinced by direct shear test data. The interface between the bedrock and deposit was generalized as two inclined planes and a horizontal plane, with inclined plane angles of 45° and 20°, respectively (Figure 1a,b).
Pile bending moments were measured by seven pairs of strain gauges in a full bridge configuration mounted on the tube surface (Figure 1c); lateral pile–soil pressures were measured by four miniature transducers embedded in the pile. The pile strain gauges and miniature earth pressure transducers were calibrated before installation. After calibration and verification that all sensors were working, the model piles were embedded in the bedrock.
When preparing the upper layer of the slope models, the deposit materials were compacted after placement in the model box using the controlled-volume method [42] to a dry density of 1.81 g/cm3. After the placement of each layer, the deposit surface was smoothed with a soft brush and instruments were placed in their specific positions. Silicone oil was smeared over the sides of the rigid box to provide a lower friction coefficient at the interface with the walls.
The dynamic input was provided by the shaking table in the centrifuge. Multiple shaking events (El Centro motion) covering a wide range of peak ground accelerations(PGA) were applied to both the 1# and 2# models while in flight. The shaking was applied parallel to the long sides of the model container and orthogonal to the pile row. The peak values of the horizontal input acceleration in the shaking events were adjusted to nearly 0.05 g, 0.10 g, 0.20 g, 0.40 g, and 0.20 g at the prototype scale (corresponding to 2.5 g, 5.0 g, 1.0 g, 2.0 g, and 1.0 g at the model scale), which corresponded to seismic intensities of 6°, 7°, 8°, 9°, and 8° based on the “Code for Seismic Design of Buildings” in China (GB 50011-2010) [43]. The time histories of input motions in instrument BA-0 are shown in Figure 2.

3. Acceleration Response and Crest Settlement of Slope

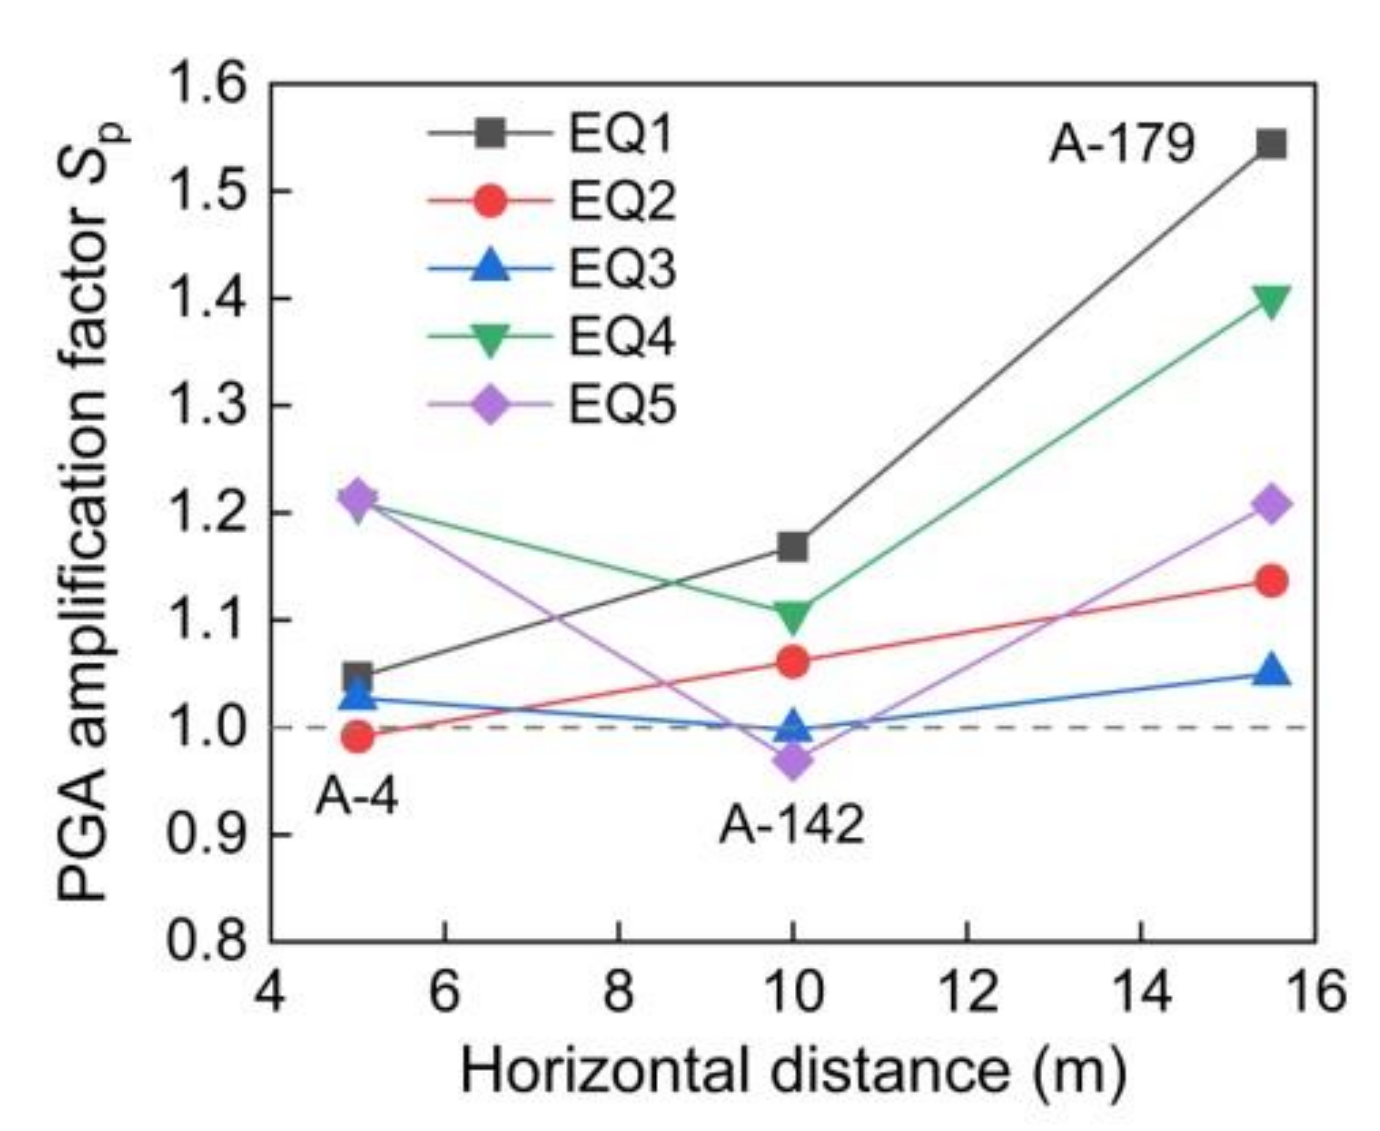
3.1. Horizontal Response Acceleration

The PGA amplification factor Sp is defined as the peak acceleration at a given depth normalized to the peak acceleration of the input motion in the centrifuge tests as a function of normalized elevation (h/H).
  • Unreinforced slope
Figure 3 shows that, before reinforcement using stabilizing piles, the PGA amplification factor of the slope increases substantially along the elevation direction and reaches the maximum at the crest of the slope. Under the continuous application of five levels of seismic load, the PGA amplification factor at the crest of the slope (A-3) has a mean average value of about 1.97, thus exacerbating the elevation amplification effect.
Moreover, at the same elevation on the slope, the PGA amplification factor of the deposit surface is greater than that of the bedrock surface, as shown in Figure 3a (BA-0,A-144 and A-179), and in Figure 3b (BA-0,A-2,A-6 and A-4). For example, at the height of 15.8 m (A-4, A-142 and A-179), the horizontal acceleration amplification factor distribution from the inside of the slope to the surface of the slope is illustrated in Figure 4. The mean average acceleration amplification factors from within to the surface are 1.10, 1.06, and 1.27, respectively. The difference in the PGA amplification factors between deposit surface and bedrock surface suggests typical surface amplification.
The strength difference of the bedrock and deposit also affects the seismic amplification effect. The shear strength of the deposit is lower than that of the bedrock, and the PGA amplification factors in that deposit are greater than those in bedrock. Acceleration sensors A-2, A-6, and A-4 are placed in the bedrock, as shown in Figure 3b, and the measured amplification factors are close to 1.0.
Figure 5 shows the transfer coefficient from A-0 to A-3; the components at frequencies of about 5 to 7 Hz are amplified when the seismic wave propagates from the bottom to the crest of the slope in the 1#model.
  • Slope reinforced by a discretely spaced pile row
Figure 6 shows the distribution of response accelerations along the slope elevation when reinforced by stabilizing piles. It also shows increased amplification and surface amplification, as compared in Figure 6a,b. As shown in Figure 6a, the average PGA amplification factor obtained from the crest measuring point (A-1) under the continuous application of five levels of load is about 1.42, which is less than that obtained from A-3 (1.97) in Figure 4a when the slope is not reinforced by stabilizing piles.
It is worth noting that the difference in PGA amplification factors between A-3 and A-144 is significant in the 2#model, as shown in Figure 6a. The accelerations measured at A-144 and A-139, located below the stabilizing piles, were significantly suppressed, while the acceleration measured at A-3 and A-7, located above the stabilizing piles, increased slightly. A possible reason for this is that the stabilizing piles lead to a greater superposition of wave reflections in the passive zone under such seismic excitation, which generally shows that the amplification effect of horizontal response accelerations increases in front of the stabilizing piles and decreases below them.
The horizontal acceleration amplification factor distribution from the interior of the slope to its surface at a height of 15.8 m in the 2# model during centrifuge testing is as shown in Figure 7. The mean average acceleration amplification factors under each of the five levels of seismic load from the inside to the surface are 1.05 (A-4), 1.14 (A-179), and 1.29 (A-7), respectively, which shows the significant surface amplification effect.
Figure 8 shows the amplitude ratios of the transfer function of the acceleration measured at A-1(slope crest) and A-0 (bottom of the model box) in the 2#model during centrifuge testing. In addition to the frequency components at 5 to 7 Hz, the frequency components at 15 to 17 Hz are also significantly amplified as the seismic wave propagates from the bottom to the crest, and the amplification is even greater than that of components at 5 to 7 Hz.
  • Comparison between unreinforced and reinforced slopes
Comparing Figure 5 and Figure 8, the spectrum amplification effect of the input seismic wave is changed significantly after the landslide is reinforced by stabilizing piles. This shows that the resonance frequency of the slope system is shifted from 5–7 Hz to 15–17 Hz after the stabilizing piles have been installed.
To facilitate the analysis of the trend in the acceleration amplification effect inside the slope, the mean average value of the PGA amplification factors under multiple sequential ground motions was adopted at each measuring point, as shown in Figure 9.
From Figure 9a, the mean average acceleration amplification factor in the upper part of the slope (A-179) is 1.326, which is greater than the magnification (A-4) at the same elevation within the slope (only slightly greater than 1); therefore, the different behaviors of the exterior and the interior of the slope will induce non-uniform movement. Qualitatively, the seismic waves transmitted from the bottom to the top create superimposed reflection and interference effects on the superficial layer, resulting in an acceleration amplification effect in the slope surface. Comparing Figure 9a with Figure 9b, it can be found that after the stabilizing piles are installed, the acceleration amplification factor near the slope surface is reduced compared with that beforehand. Stabilizing piles bridge the difference of acceleration response between the bedrock and deposit. The reason for the surface amplification effect can be explained as follows: part of the seismic energy is dissipated by damping during the propagation of seismic waves in the rock and soil mass, while the remaining energy is manifest as the seismic response of the rock and soil mass. The bedrock of the slope is harder than the upper part, so more energy is dissipated therein, and the dynamic response is smaller, while the surface soil mass of the slope is loose, and the dynamic response is greater [1,6]. The inconsistency in the acceleration (velocity or displacement) will lead to an inconsistency in the movement between the deposit layer and the bedrock layer. The uncoordinated movement between the shallow soil and the rock in the slope produces stripping tensile stress, and finally leads to the formation of a shallow surface landslide.
Figure 10 shows that the amplitude of the slope crest acceleration response spectrum (ARS) is decreased significantly after installing a single row of stabilizing piles as reinforcement (S/b = 4) in the underlying bedrock deposit slope. In the shaking event EQ4, the response spectrum values in the frequency range shown in Figure 10 are significantly reduced after the stabilizing piles are installed, and the amplitude of the ARS decreases by 37%. Overall, the larger the PGA of the input motion, the more significant the effect of the stabilizing piles on the ARS peak reduction.

3.2. Crest Settlements

The permanent crest settlements in each shaking event were monitored by laser displacement transducers LDS-1 and LDS-2 (Figure 1). The time-history curves of the slope crest settlements of each shaking event in the 1# and 2# models are shown in Figure 11.
The permanent displacement of the slope crest occurs only when the acceleration amplitude of the input ground motion reaches a threshold, and Newmark [44] defined this as the critical acceleration. As shown in Figure 11, the crest settlements increased with the increasing input amplitude of ground motions. In the shaking events EQ1 and EQ2, no obvious settlement occurred in the two models. When the input amplitude exceeded 0.2 g in shaking event EQ3, significant plastic deformation occurred in the slope crest as measured at LDS-2 in both models. In the shaking event EQ4 in the 1# model, Δd1 = 17.1 mm and Δd2 = 178.2 mm after stabilizing piles were installed; Δd1 = 12.4 mm and Δd2 = 121.1 mm in the 2# model, and the crest settlements were reduced by approximately 27% and 32%, respectively. The piles would be expected to increase Newmark’s yield acceleration, as described by Al-Defae and Knappett [45].
The distance Δ L between LDS-1 and LDS-2 is 3 m in the prototype, and the angular rotation of the slope crest during the test is defined as follows: tan Δ θ = LDS 2 LDS 1 / Δ L , where LDS2 and LDS1 refer to the values measured by using laser displacement transducers LDS-2 and LDS-1. The time–history curve of crest angular rotation is also shown in Figure 11. The final cumulative angular deformation in the 1# model is 0.06 rad (3.4°), and that in the2# model is 0.0425 rad (2.4°). The change in angular rotation at the crest is almost the same as that in the crest settlement, which indicates that the crest settlement and the angular rotation will occur at the same time.

4. Response Characteristics of Stabilizing Piles under Seismic Load

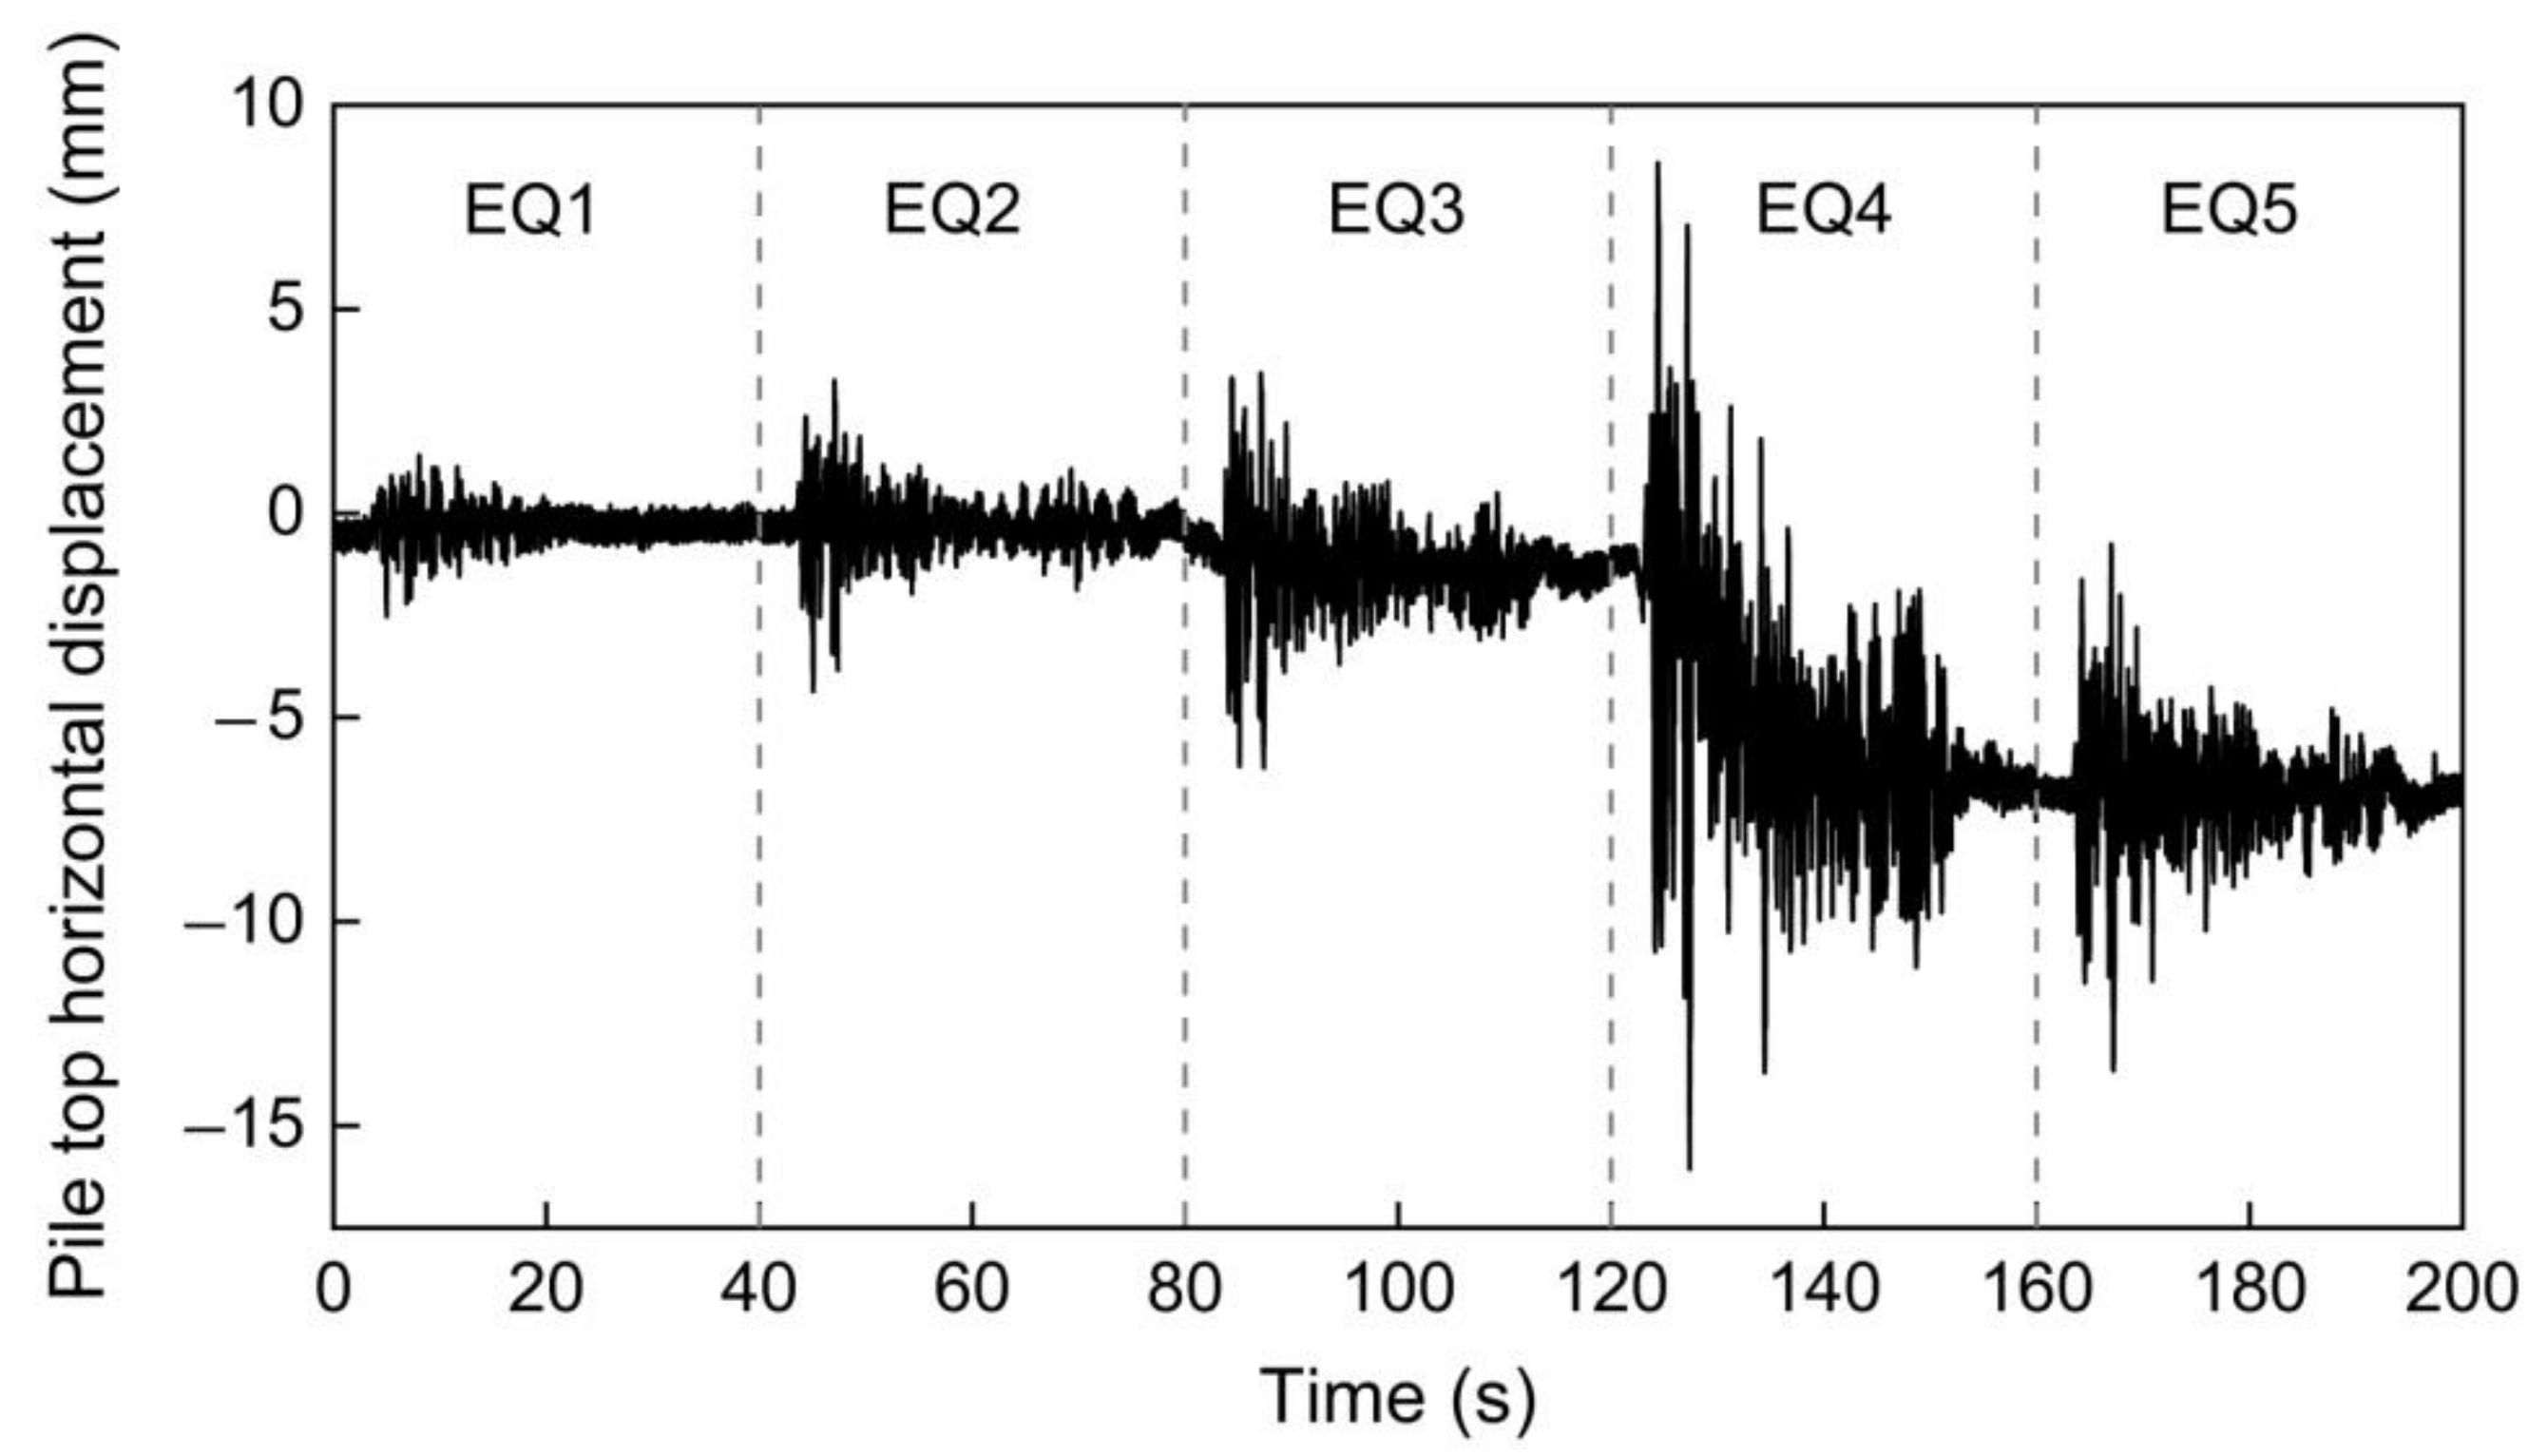
4.1. Horizontal Displacement
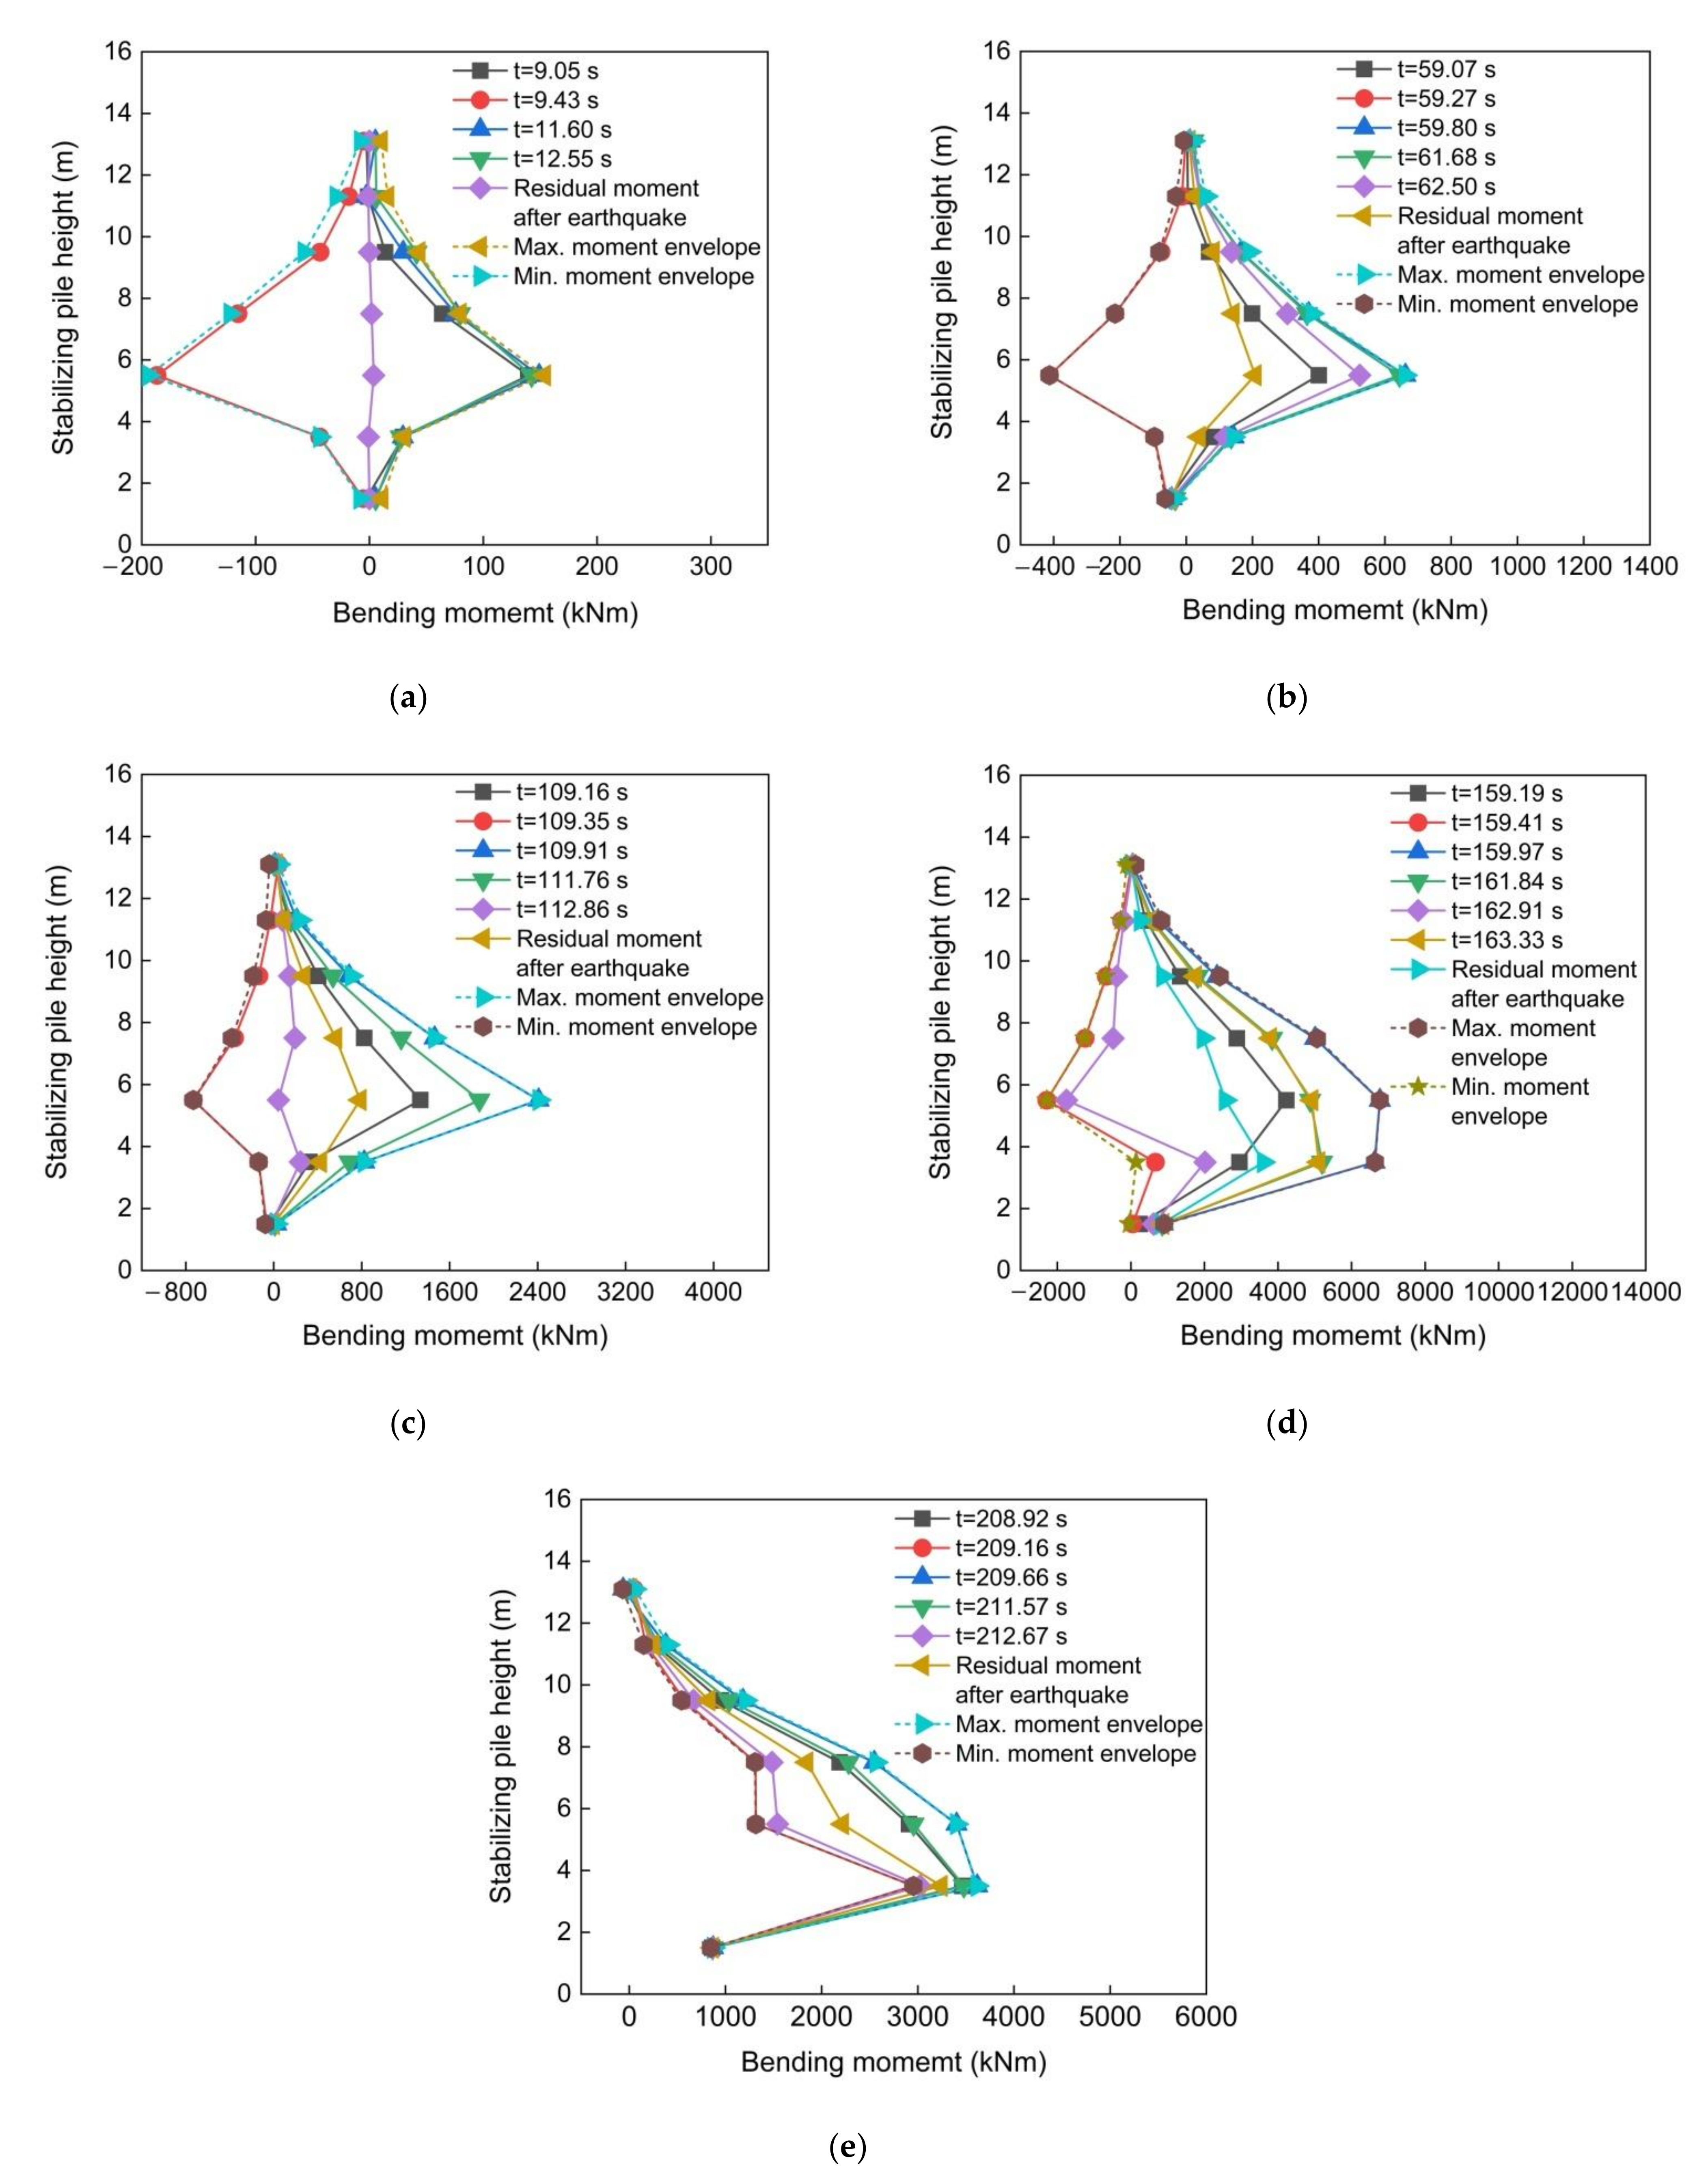
Figure 12 shows the time–history curve of the pile top horizontal displacement measured by laser displacement transducer LDS-3 in the centrifuge shaking table model test. The trend in pile top horizontal displacements in Figure 12 is akin to that in Figure 11: under a small input ground motion (EQ1, EQ2), there is almost no residual horizontal displacement at the pile top. In shaking event EQ3 (PGA = 0.236 g), the residual horizontal displacement of the pile top begins to occur, indicating that the stabilizing piles begin to be pushed, so that the pile top starts to undergo horizontal residual deformation. Under the excitation of a strong earthquake (EQ4, PGA = 0.421 g), the pile top undergoes a significant horizontal displacement, in which the maximum instantaneous horizontal displacement reaches 15.8 mm and the residual horizontal displacement of the pile top is 6.7 mm. This shows that the overlying deposits have a sliding, downwards trend, and the stabilizing piles have begun to bend significantly. From EQ4 to EQ5, the incremental residual horizontal displacement of the pile top is minimal, suggesting that the previous vibration has enhanced the seismic resistance of the slope to some extent when the slope is subjected to a strong excitation first and then excited by a smaller earthquake.
Figure 13 shows the amplitude ratios of the transfer function of the acceleration measured at A-1079 (pile top) and A-0 (bottom of the model box) in the 2# model during centrifuge testing. Its distribution is similar to that in Figure 8. The difference is that the amplification factor of frequency components from 5 to 7 Hz at the top of the stabilizing piles is greater than that at the crest of the slope in the 2# model.

4.2. Bending Moment

The typical response time–history curve of bending moments in the centrifuge model test (EQ4, S3) is shown in Figure 14. The residual bending moment increment ΔMr in each shaking event is defined as the difference between the beginning and the end of the response time-history curve of the bending moment. During the seismic loading process, the maximum dynamic bending moment Mmax and the minimum dynamic bending moment Mmin in each shaking event are taken as the difference between the beginning and the peak and trough, respectively, of the time–history curve of the bending moment.
Figure 15 shows the time–history curves of bending moments measured by strain gauges on a stabilizing pile under five continuous earthquake excitations (only 6 s of the time–history are taken in each case to show the variation in the bending moment). It can be seen from Figure 15 that the bending moment measured at different points on the stabilizing piles does not reach the maximum value at the same time. Taking EQ3 as an example (Figure 15c), the times corresponding to the peak signal amplitude are 109.91 s, 109.91 s, 109.91 s, 109.92 s, 109.93 s, 109.95 s, and 110.03 s (S1–S7), and the corresponding times to the wave trough are 109.35 s, 109.35 s, 109.36 s, 109.37 s, 109.38 s, 109.37 s, and 109.48 s (S1–S7) at each strain gauge. It can be seen that the bending moment on the stabilizing piles embedded in the bedrock (S1, S2, and S3) exhibits no phase difference, while there is a phase difference in the bending moment on the pile above the bedrock (S4, S5, S6, and S7), especially near the top of the pile (S7) where the time difference is about 0.1 s. This is mainly due to the interaction between the stabilizing piles and the deposit, and the onset of the effect of viscous damping, which will be beneficial to the dissipation of earthquake energy.
The bending moment corresponding to the characteristic time shown in Figure 15 is extracted. Meanwhile, the maximum and minimum bending moments generated during the earthquake (due to the phase difference, the bending moment at each measurement point on the stabilizing pile cannot reach a maximum or minimum at the same time, which is called the maximum or minimum bending moment envelope) and the residual bending moment after the earthquake areextracted. After deducting the initial static bending moment generated by centripetal acceleration before the earthquake, the bending moment diagram along the pile’s height is plotted in Figure 16.
It can be seen from Figure 16 that the dynamic bending moment corresponding to each characteristic time changes within the envelopes of the maximum and minimum dynamic bending moments. Therefore, the envelopes of maximum and minimum dynamic moments can be used as a basis to determine the load in the seismic design of a stabilizing pile. When the input seismic load is relatively small (EQ1, PGA = 0.055 g; EQ2, PGA = 0.125), the positive and negative dynamic bending moments of the pile are quasi-symmetrically distributed, and the residual bending moment after the earthquake is small (and even negligible in EQ1) (Figure 16a).
After each shaking event, the distribution of the residual bending moment along the instrumented pile gradually increases from the slope surface to the bedrock surface, then decreases from the bedrock surface to the pile bottom, showing an outward convex shape (Figure 16a–c). The position of the maximum residual bending moment is near the bedrock surface, which is related to the earth pressure acting on the stabilizing piles. After seismic loading at PGA = 0.125 g, the residual bending moment along the instrumented pile begins to increase, indicating that the overlying deposit begins to slide under the influence of the ground motion, which is consistent with the phenomenon whereby the aforementioned slope crest settlement starts to occur in shaking event EQ2 (Figure 11b).
In the first three shaking events (EQ1, PGA = 0.055 g; EQ2, PGA = 0.125 g; EQ3, PGA = 0.236 g), the peak value of dynamic bending moment appears at measurement point S3 (H = 5.5 m), that is to say, it reaches its peak value near the bedrock–deposit interface: however, in EQ4 (PGA = 0.421 g), the positive maximum dynamic bending moment is still located at S3 at t = 159.19 s, and the bending moment measured at S2 rapidly approaches that at S3 at t = 159.97 s. At t = 161.84 s, the positive bending moment at S2 has exceeded that at S3, that is, the positive maximum dynamic bending moment is located at S2 (H = 3.5 m). The residual bending moment after earthquake EQ4 and the maximum positive dynamic bending in EQ5 are finally located at S2 (H = 3.5 m) (Figure 16d,e). This shows that, under strong earthquake excitations, the part of the bedrock surface behind the stabilizing piles begins to yield, and the bearing layer of the bedrock socketed section moves down, as depicted in Figure 17, indicating that the strong seismic loading has significantly changed the stress state in the embedded section of the pile. It can be foreseen that, when the seismic load is further increased and the overturning moment generated by the landslide body exceeds the stabilizing moment provided by the bearing capacity of the bedrock, the stabilizing piles will undergo tilting–overturning failure.
It can be seen from Figure 16d,e that, if the slope model has experienced strong ground motion (e.g., EQ4, PGA = 0.421 g) beforehand, when the slope experiences a smaller earthquake motion (e.g., EQ5, PGA = 0.236 g) thereafter, the residual bending moment on the stabilizing piles is almost unchanged. When continuous five-level excitation is applied, the maximum residual bending moment approaches 3250 kN·m. That is, the seismic load causes the overlying deposit to slide, and the permanent thrust generated on the stabilizing piles increases the maximum bending moment by 3250 kN·m.

4.3. Lateral Pile-Soil Load

In the dynamic centripetal modeling tests, four earth pressure cells were placed on the stabilizing pile above the bedrock surface. In addition, according to the differential relationship between moment M, shear force Q, and distributed load q on the stabilizing pile ( d M / d x = Q , d Q / d x = q ), the distributed load q on the stabilizing pile after each shaking event can be roughly obtained ( Δ M / Δ h = Q ¯ , Δ Q ¯ / Δ h = q ¯ , where Δ h is the distance between two adjacent moment gauges) from the residual moment diagram in Figure 16. The comparison of distributed load increment obtained by moment strain gauge and earth pressure cell (from pressure integral to distributed load) on a stabilizing pile after each shaking event is shown in Figure 18 (the increment of distributed load in EQ1 is almost zero, so is not shown in Figure 18 for clarity). It should be pointed out that the centrifuge model test gave values of pile–soil pressure on only one side surface of the pile, while the distributed load calculated from the bending moment is the pressure transmitted by the soil to the whole pile (four surfaces). There are differences between the two: Figure 18 shows that the distributions of the two are similar, but the values differ significantly when increasing the input PGA.
To verify the rationality of the aforementioned differential method, Figure 19 shows the simplified distributed load increment above the slip surface after each shaking event according to Figure 18: the shape of the distributed load increment is the same, but the magnitude increases gradually with the increase inthe input PGA.
The increment indistributed load in EQ1 is almost zero, and in EQ5 it is equal to that in EQ4. It is noted that the distributed load increment generated by the seismic excitation in Figure 19 is negative near the slip surface, which indicates that the earth pressure in front of the pile is large. The sliding force generated by the seismic excitation is mainly concentrated in the part above 3.5 m up the slip surface. It can be calculated that the point of action of the resultant force is 7.46 m above the slip surface. The point of action of the resultant force is 1.54 m below the slope surface, which indicates that the earthquake mainly causes shallow sliding of the deposit, resulting in the distribution of the load increment in the upper part of the pile.
Taking the simplified distributed load in Figure 19 as the external load, the Mohr—Coulomb model was adopted for the bedrock (with the Young’s modulus of bedrock set to 5.42 Gpa, and the Poisson’s ratio to 0.30). The stabilizing pile (Table 2) was simulated as a Mindlin beam [46] with the help of PLAXIS 2D software [47]. Then, the horizontal displacement, shear force, and bending moment on a stabilizing pile after an earthquake can be obtained (Figure 20). In Figure 20a, the horizontal displacements of the pile in each shaking event are obtained by invoking Mindlin beam theory. The horizontal displacements of the pile top from EQ2 to EQ5 are 0.601 mm, 2.08 mm, 8.88 mm, and 8.88 mm, respectively. The pile top horizontal displacements measured by laser displacement transducer LDS-3 are 0.31 mm, 1.48 mm, 6.85 mm, and 6.85 mm, respectively. It can be found that the horizontal displacement of the pile tip obtained by use of Mindlin beam theory is slightly greater than that measured by laser displacement transducer, but the trend of the two is consistent. It can be seen from Figure 20b,c that, when the input PGA is small (EQ2), the pile shear force and bending moment obtained from Mindlin beam theory are in good agreement with the results obtained from the actual conversion of experimental bending moment data. With the increase inPGA of the input seismic wave, the shear force and bending moment on the pile in the bedrock obtained by Mindlin beam theory are greater than those obtained experimentally. Taking the EQ3 shaking event as an example, the moment on the pile (h = 5.5 m) obtained by Mindlin beam theory is 3201 kN·m, nearly 25% larger than those obtained by the test (2570 kN·m); this is because the attenuation of the strength of the bedrock in front of the rock-socketed pile is not considered in the theoretical calculations. It is confirmed again that the resistance of the bedrock in front of the pile is redistributed under strong earthquake excitation (Figure 17). At the same time, it is verified that the distribution of pile–soil load estimated via the differential method is reasonable (Figure 19) in this case.

5. Conclusions

Under seismic excitation, the horizontal response accelerations in the two slopes show typical effects of elevation amplifications, surface amplification, and lithology. The arrangement of stabilizing piles suppressed the downward trend in the motion of the overlying deposit. This results in a decrease in the difference between internal accelerations and external accelerations of the bedrock at the same elevation within the slope. A more obvious wave reflection superposition effect in the passive zone caused by the piles under ground shaking leads to the slope surface PGA amplification factor increasing in front of the piles and decreasing below the piles. In addition, through the transfer function between the slope bottom and slope crest accelerations, it can be found that the installation of stabilizing piles significantly amplified the 15 to 17 Hz frequency component.
The permanent settlements and angular rotation of the stabilizing pile-reinforced slope crest are reduced by about 30% compared with the unreinforced slope after five-stage seismic excitation is applied in the centrifuge tests. The installed piles will increase the Newmark yield acceleration of the underlying bedrock deposit slope. The horizontal displacement at the top of the stabilizing pile is closely related to the slope crest settlement and angular deformation.
The bending moments at each point on the pile do not reach their maximum simultaneously. There is a significant phase difference in the bending moment time–history curve pertaining to each measurement point, and the bending moment at the pile top lags behind that at the pile bottom. The short-term response amplitude of the dynamic bending moment is significantly larger than the corresponding post-earthquake permanent residual bending moment. The lateral pressure between pile and deposit gradually increases as the input acceleration increases. The point of action of the distributed load (when expressed as a single resultant force) is 7.46 m above the sliding surface, indicating that the earthquake mainly causes shallow sliding of the deposit to produce a residual sliding force. Under strong seismic excitation, the main bearing stratum of the pile-socketed bedrock section moves downwards, indicating that the stress state in that section of the pile embedded in the bedrock changes. In seismic design terms, each stabilizing pile should have sufficient rock-socketed depth to ensure stability.

Author Contributions

Conceptualization, Z.S. and L.K.; methodology, Z.S.; validation, W.B. and Y.W.; data curation, Z.S.; writing—original draft preparation, Z.S.; writing—review and editing, Z.S.; visualization, Y.W.; supervision, L.K.; project administration, L.K. All authors have read and agreed to the published version of the manuscript.

Funding

This research was funded by the National Key R&D Program of China, grant number 2018YFC1505304; the National Natural Science Foundation of China, grant numbers 41702348 and 51979269; and the Hubei Provincial Natural Science Foundation of China, grant number 2017CFB373.

Institutional Review Board Statement

Not applicable.

Informed Consent Statement

Not applicable.

Data Availability Statement

Not applicable.

Conflicts of Interest

The authors declare no conflict of interest.

References

  1. Huang, R.Q.; Li, W.L. Analysis of the geo-hazards triggered by the 12 May 2008 Wenchuan Earthquake, China. Bull. Eng. Geol. Environ. 2009, 68, 363–371. [Google Scholar] [CrossRef]
  2. Ding, Y.; Dang, C.; Yuan, G.X.; Wang, Q.C. Characteristics and remediation of a landslide complex triggered by the 2008 Wenchuan, China earthquake—Case from Yingxiu near the earthquake epicenter. Environ. Earth. Sci. 2012, 67, 161–173. [Google Scholar] [CrossRef]
  3. Chigira, M.; Wu, X.Y.; Inokuchi, T.; Wang, G.H. Landslides induced by the 2008 Wenchuan earthquake, Sichuan, China. Geomorphology 2010, 118, 225–238. [Google Scholar] [CrossRef]
  4. Cao, Z.Z.; Youd, T.L.; Yuan, X.M. Gravelly soils that liquefied during 2008 Wenchuan, China earthquake, Ms=8.0. Soil Dyn. Earthq. Eng. 2011, 31, 1132–1143. [Google Scholar] [CrossRef]
  5. Yin, Y.P.; Wang, F.W.; Sun, P. Landslide hazards triggered by the 2008 Wenchuan earthquake, Sichuan, China. Landslides 2009, 6, 139–152. [Google Scholar] [CrossRef]
  6. Massey, C.; Della, P.F.; Holden, C.; Kaiser, A.; Richards, L.; Wartman, J.; McSaveney, M.J.; Archibald, G.; Yetton, M.; Janku, L. Rock slope response to strong earthquake shaking. Landslides 2017, 14, 249–268. [Google Scholar] [CrossRef]
  7. Bourdeau, C.; Havenith, H.B. Site effects modelling applied to the slope affected by the Suusamyr earthquake (Kyrgyzstan, 1992). Eng. Geol. 2008, 97, 126–145. [Google Scholar] [CrossRef]
  8. Del Gaudio, V.; Wasowski, J. Advances and problems in understanding the seismic response of potentially unstable slopes. Eng. Geol. 2011, 122, 73–83. [Google Scholar] [CrossRef]
  9. Strenk, P.M.; Wartman, J. Uncertainty in seismic slope deformation model predictions. Eng. Geol. 2011, 122, 61–72. [Google Scholar] [CrossRef]
  10. Moore, J.R.; Gischig, V.S.; Burjanek, J.; Loew, S.; Fah, D. Site effects in unstable rock slopes: Dynamic behavior of the Randa instability (Switzerland). Bull. Seismol. Soc. Am. 2011, 101, 3110–3116. [Google Scholar] [CrossRef]
  11. Gischig, V.S.; Eberhardt, E.; Moore, J.R.; Hungr, O. On the seismic response of deep seated rock slope instabilities—Insights from numerical modeling. Eng. Geol. 2015, 193, 1–18. [Google Scholar] [CrossRef]
  12. Carder, D.R.; Temporal, J. A Review of the Use of Spaced Piles to Stabilise Embankment and Cutting Slopes (TRL Report 466); Transportation Research Laboratory: Berkshire, UK, 2000. [Google Scholar]
  13. Li, X.; Pei, X.; Gutierrez, M.; He, S.M. Optimal location of piles in slope stabilization by limit analysis. Acta Geotech. 2012, 7, 253–259. [Google Scholar] [CrossRef]
  14. Li, Z.; Escoffier, S.; Kotronis, P. Centrifuge modeling of batter pile foundations under sinusoidal dynamic excitation. Bull. Earthq. Eng. 2016, 14, 673–697. [Google Scholar] [CrossRef] [Green Version]
  15. Lirer, S. Landslide stabilizing piles: Experimental evidences and numerical interpretation. Eng. Geol. 2012, 149–150, 70–77. [Google Scholar] [CrossRef]
  16. Wu, Y.; He, S.M.; Li, X.P. Failure mechanism of anti-slide pile under seismic wave. J. Sichuan Univ. Eng. Sci. 2009, 41, 284–288. [Google Scholar]
  17. Smethurst, J.A.; Powrie, W. Monitoring and analysis of the bending behaviour of discrete piles used to stabilise a railway embankment. Géotechnique 2007, 57, 663–677. [Google Scholar] [CrossRef] [Green Version]
  18. Spence, R. The full-scale laboratory: The practice of post-earthquake reconnaissance missions and their contribution to earthquake engineering. Bull. Earthq. Eng. 2015, 13, 1581–1585. [Google Scholar] [CrossRef]
  19. Bonilia, L.F. Borehole response studies at the Garner Valley Downhole Array, Southern California. Bull. Seismol. Soc. Am. 2002, 92, 3165–3179. [Google Scholar] [CrossRef]
  20. Ou, J.F.; Luo, Y.H.; Wang, Y.S.; Zhu, X.M.; Zhang, Y.Y. Analysis of response characteristics of slope ground motion based on environmental noise and seismic data: A case study of Lushan Renjia slope. J. Mt. Sci. 2019, 37, 382–391. [Google Scholar]
  21. Yu, Y.; Deng, L.; Sun, X.; Lü, H. Centrifuge modeling of dynamic behavior of pile-reinforced slopes during earthquakes. J. Cent. South Univ. Tech. 2010, 17, 1070–1078. [Google Scholar] [CrossRef]
  22. Al-Defae, A.H.; Knappett, J.A. Centrifuge modeling of the seismic performance of pile-reinforced slopes. J. Geotech. Geoenviron. Eng. 2014, 140, 04014014. [Google Scholar] [CrossRef]
  23. Al-Defae, A.H.; Knappett, J.A. Newmark sliding block model for pile-reinforced slopes under earthquake loading. Soil Dyn. Earthq. Eng. 2015, 75, 265–278. [Google Scholar] [CrossRef] [Green Version]
  24. Wang, L.P.; Zhang, G. Centrifuge model test study on pile reinforcement behavior of cohesive soil slopes under earthquake conditions. Landslides 2014, 11, 213–223. [Google Scholar] [CrossRef]
  25. Ma, N.; Wu, H.G.; Ma, H.M.; Wu, X.Y.; Wang, G.H. Examining dynamic soil pressures and the effectiveness of different pile structures inside reinforced slopes using shaking table tests. Soil Dyn. Earthq. Eng. 2019, 116, 293–303. [Google Scholar] [CrossRef]
  26. Huang, Y.; Xu, X.; Liu, J.J.; Mao, W. Centrifuge modeling of seismic response and failure mode of a slope reinforced by a pile-anchor structure. Soil Dyn. Earthq. Eng. 2020, 131, 1–11. [Google Scholar] [CrossRef]
  27. Ellis, E.A.; Durrani, I.K.; Reddish, D.J. Numerical modelling of discrete pile rows for slope stability and generic guidance for design. Géotechnique 2010, 60, 185–195. [Google Scholar] [CrossRef]
  28. Sharafi, H.; Shams Maleki, Y. Evaluation of the lateral displacements of a sandy slope reinforced by a row of floating piles: A numerical-experimental approach. Soil Dyn. Earthq. Eng. 2019, 122, 148–170. [Google Scholar] [CrossRef]
  29. Won, J.; You, K.; Jeong, S.; Kim, S. Coupled effects in stability analysis of pile-slope systems. Comput. Geotech. 2005, 32, 304–315. [Google Scholar] [CrossRef]
  30. Erfani, J.A.; Liang, R.Y.; Li, L.; Liu, H.L. Yield acceleration and permanent displacement of a slope reinforced with a row of drilled shafts. Soil Dyn. Earthq. Eng. 2014, 57, 68–77. [Google Scholar] [CrossRef]
  31. Kanagasabai, S.; Smethurst, J.A.; Powrie, W. Three-dimensional numerical modelling of discrete piles used to stabilize landslides. Can. Geotech. J. 2011, 48, 1393–1411. [Google Scholar] [CrossRef]
  32. Kourkoulis, R.; Gelagoti, F.; Anastasopoulos, I.; Gazetas, G. Slope stabilizing piles and pile-groups: Parametric study and design insights. J. Geotech. Geoenviron. Eng. 2011, 137, 663–677. [Google Scholar] [CrossRef] [Green Version]
  33. Li, C.D.; Wu, J.; Tang, H.M.; Hu, X.L.; Liu, X.W.; Wang, C.Q.; Liu, T.; Zhang, Y.Q. Model testing of the response of stabilizing piles in landslides with upper hard and lower weak bedrock. Eng. Geol. 2016, 204, 65–76. [Google Scholar] [CrossRef]
  34. Abdoun, T.; Dobry, R.; O’Rourke, T.; Goh, S.H. Pile response to lateral spreads: Centrifuge modeling. J. Geotech. Geoenviron. Eng. 2003, 129, 869–878. [Google Scholar] [CrossRef]
  35. Brandenberg, S.J.; Boulanger, R.W.; Kutter, B.L.; Chang, D. Behavior of pile foundations in laterally spreading ground during centrifuge tests. J. Geotech. Geoenviron. Eng. 2005, 131, 1378–1391. [Google Scholar] [CrossRef] [Green Version]
  36. Knappett, J.A.; Madabhushi, S.P.G. Influence of axial load on lateral pile response in liquefiable soils. Part I: Physical modelling. Géotechnique 2009, 59, 571–581. [Google Scholar] [CrossRef]
  37. Garala, K.T.; Madabhushi, S.P.G. Seismic behaviour of soft clay and its influence on the response of friction pile foundations. Bull. Earthq. Eng. 2019, 17, 1919–1939. [Google Scholar] [CrossRef] [Green Version]
  38. Chen, Y.M.; Li, J.C.; Yang, C.B.; Zhu, B.; Zhan, L.T. Centrifuge modeling of municipal solid waste landfill failures induced by rising water levels. Can. Geotech. J. 2017, 54, 1739–1751. [Google Scholar] [CrossRef] [Green Version]
  39. Zhou, Y.G.; Sun, Z.B.; Chen, Y.M. Zhejiang University benchmark centrifuge test for LEAP-GWU-2015 and liquefaction responses of a sloping ground. Soil Dyn. Earthq. Eng. 2018, 113, 698–713. [Google Scholar] [CrossRef]
  40. Sun, Z.L.; Kong, L.W.; Guo, A.G.; Xu, G.F.; Bai, W. Experimental and numerical investigations of the seismic response of a rock–soil mixture deposit slope. Environ. Earth. Sci. 2019, 78, 716. [Google Scholar] [CrossRef]
  41. Kourkoulis, R.; Gelagoti, F.; Anastasopoulos, I.; Gazetas, G. Hybrid method for analysis and design of slope stabilizing piles. J. Geotech. Geoenviron. Eng. 2012, 138, 1–14. [Google Scholar] [CrossRef] [Green Version]
  42. Wang, K.L.; Lin, M.L. Initiation and displacement of landslide induced by earthquake–A study of shaking table model slope test. Eng. Geol. 2011, 122, 106–114. [Google Scholar] [CrossRef]
  43. GB (2010) Code for Seismic Design of Buildings, 50011-2010.; China Building Industry Press: Beijing, China.
  44. Newmark, N.M. Effects of earthquakes on dams and embankments. Géotechnique 1965, 15, 139–160. [Google Scholar] [CrossRef] [Green Version]
  45. Al-Defae, A.H.; Caucis, K.; Knappett, J.A. Aftershocks and the whole-life seismic performance of granular slopes. Géotechnique 2013, 63, 1230–1244. [Google Scholar] [CrossRef]
  46. Bathe, K.J. Finite Element Analysis in Engineering Analysis; Prentice-Hall: Hoboken, NJ, USA, 1982; pp. 76–102. [Google Scholar]
  47. PLAXIS 2D. Reference Manual; Last Version 2015.2.19890.4979; Delft University of Technology: Delft, The Netherlands, 2015. [Google Scholar]
Figure 1. Layout of model slope and instrumentation at model-scale: (a) 1# model; (b) 2# model; (c) layout of earth pressure cells and strain gauges on a model pile (unit: mm).
Applsci 11 05664 g001aApplsci 11 05664 g001b
Figure 2. Time histories of input motions forinstrument BA-0.
Applsci 11 05664 g002
Figure 3. Maximum acceleration distributions along the normalized slope elevation in the 1# model in centrifuge tests: (a) deposit surface; (b) bedrock surface.
Applsci 11 05664 g003
Figure 4. The horizontal acceleration amplification factor distribution from the inside of the slope to its surface at a height of 15.8 m in the 1# model in centrifuge tests.
Applsci 11 05664 g004
Figure 5. The amplitude ratios of the transfer function of the acceleration measured at A-3 (slope crest) and A-0 (bottom of the model box) in the 1#model during centrifuge testing.
Applsci 11 05664 g005
Figure 6. Maximum acceleration distributions along the normalized slope elevation in the 2# model in centrifuge tests: (a) deposit surface; (b) bedrock surface.
Applsci 11 05664 g006
Figure 7. The horizontal acceleration amplification factor distribution from the inside of the slope to the surface of the slope at a height of 15.8 m in the 2# model in centrifuge tests.
Applsci 11 05664 g007
Figure 8. The amplitude ratios of the transfer function of the acceleration measured at A-1 (slope crest) and A-0 (bottom of the model box) in the 2# model during centrifuge testing.
Applsci 11 05664 g008
Figure 9. Average horizontal PGA amplification factor distribution in the underlying bedrock deposit slope in centrifuge tests: (a)1#model; (b) 2# model.
Applsci 11 05664 g009
Figure 10. Response spectral accelerations of the slope crest (5% damping ratio).
Applsci 11 05664 g010
Figure 11. Crest settlements and crest rotation angle under seismic excitation: (a) 1# model; (b) 2# model.
Applsci 11 05664 g011
Figure 12. Pile top horizontal displacement under seismic excitations in the 2# model.
Applsci 11 05664 g012
Figure 13. The amplitude ratios of the transfer function of the acceleration measured at A-1079 (pile top) and A-0 (bottom of the model box) in the 2# model during centrifuge testing.
Applsci 11 05664 g013
Figure 14. Typical response time–history curves of bending moments in the centrifuge test (EQ4, S3).
Applsci 11 05664 g014
Figure 15. Time–history curves of bending moments in centrifuge tests: (a) EQ1; (b) EQ2; (c) EQ3; (d) EQ4; (e) EQ5.
Applsci 11 05664 g015aApplsci 11 05664 g015b
Figure 16. Maximum and minimum bending moment envelopes, residual bending moment after an earthquake, and the dynamic bending moment on a stabilizing pile: (a) EQ1; (b) EQ2; (c) EQ3; (d) EQ4; (e) EQ5.
Applsci 11 05664 g016
Figure 17. Schematic representation of the resistance exerted by a stabilizing pile in the bedrock.
Applsci 11 05664 g017
Figure 18. Comparison of distributed load increment obtained by moment strain gauge and earth pressure cell on a stabilizing pile after each shaking event.
Applsci 11 05664 g018
Figure 19. Simplified distributed load increment above the slip surface after each shaking event (unit: kN/m).
Applsci 11 05664 g019
Figure 20. Comparison of the calculated results after test–measurement conversion and the calculated results based on Mindlin beam theory for a stabilizing pile after each shaking event: (a) horizontal displacement; (b) shear force; (c) bending moment.
Applsci 11 05664 g020
Table 1. Selected centrifuge scaling laws.
ParameterDimensionModel Scale under Acceleration Ng
(Model:Prototype)
Length/displacementL1:N
MassM1:N3
ForceMLT−21:N2
Bending momentML2T−21:N3
VelocityLT−11:1
AccelerationLT−21:N
FrequencyT−11:N
Time (dynamic)TN:1
ModulusML−1T−21:1
Damping ratio11:1
Table 2. Parameters of prototype stabilizing pile.
ParameterStabilizing Pile
Unit weight γ(kN/m3)24
Young’s modulus E (kPa)3e7
Axial stiffness EA (kN)6.75 e 7
Flexural rigidityEI (kNm2)1.265 e 7
Poisson’s ratio ν0.2
Table 3. Particle size distribution characteristics of the tested deposit.
Gradation of Model Materials/%d50/mmCuCc
10–5 mm5–2 mm2–1 mm1–0.5 mm0.5–0.25 mm<0.25 mm
34.433.513.19.03.07.03.39.951.70
Publisher’s Note: MDPI stays neutral with regard to jurisdictional claims in published maps and institutional affiliations.

