Abstract
In Taiwan, activity centers such as school auditoriums and gymnasiums are common multi-functional spaces that are often used for performances, singing, and speeches. However, most cases are designed using only Sabine’s equation for architectural acoustics. Although that estimation formula is simple and fast, the calculation process ignores many details. Furthermore, while more accurate analysis can be obtained through acoustics simulation software, it is more complicated and time-consuming and thus is rarely used in practical design. The purpose of this study is to use machine learning to propose a predictive model of acoustic indicators as a simple evaluation tool for the architectural design and interior decoration of multi-functional activity centers. We generated 800 spaces using parametric design, adopting Odeon to obtain acoustic indicators. The machine learning model was trained with basic information of the space. We found that through GBDT and ANN algorithms, almost all acoustic indicators could be predicted within JND ± 2, and the JND of C50, C80, STI, and the distribution of SPL could reach within ±1. Through machine learning methods, we established a convenient, fast, and accurate prediction model and were able to obtain various acoustic indicators of the space without 3D-modeling or simulation software.
1. Introduction
Architectural acoustics is the science of studying acoustic environments in architecture. In the past, subjects of architectural acoustic research were usually concert halls, opera houses, and theaters. However, good indoor acoustic environments are not limited to professional performance spaces. In recent years, architectural acoustics in non-musical professional use spaces has begun to receive attention, in spaces such as offices, libraries, multi-purpose spaces, etc. [1,2,3,4,5].
The concept of multi-functional space has grown more and more popular, especially in schools. Combining the auditorium and indoor physical activity space is a well-established design method that can maximize the use of school space and budget. However, each activity in a multi-functional space has its own requirements, and acoustic design can be difficult for this kind of space [6].
For ordinary spaces, the importance of acoustics is relatively low, but for such large-scale performance spaces as concert halls and theaters, the importance of acoustics is considerable, and simulation software such as Odeon, Ease, etc. is usually adopted for simulation and design. Compared with the above two venues, the small and medium-sized multi-functional activity centers referred to in this research have certain requirements for acoustics, but they are not as strict as those of a special performance space. In practice, such spaces do not use software for simulation. However, if simulation software cannot be introduced in the design stage, then knowing the various acoustic indicators, such as clarity (C50, C80), speech transmission index (STI), etc., is difficult.
In Taiwan, small and medium-sized activity centers like school auditoriums and gymnasiums are common multi-functional spaces that are often used for performances, singing, and speeches. Different usage scenarios should be matched with different architectural acoustic design standards. However, most architectural cases are designed using only traditional estimation formulas for confirming the reverberation time [7,8,9]. Although the estimation formula is quick and simple, many details are ignored in the calculation process. Schroeder & Gerlach [10] mentioned that the reverberation time obtained by the Sabin or Eyring formula depends only on the volume of the room and the total absorption area. These formulas assume that the probability of a wall being hit by a sound ray is proportional to its size and is not related to the previous history of the ray. In addition, the shape of the space and the placement of sound-absorbing materials also affect the reverberation time. For rooms with non-uniform distribution of sound absorption (especially rectangular rooms), the Sabine and Erying formulas tend to underestimate the real RT [11]. A study by Beranek [12] stated that when calculating the RT in a concert hall, if heavily upholstered or non-rectangular space was used, the Sabine formula needs to be corrected by adding the room volume.
Machine learning (ML) is a branch of artificial intelligence (AI) primarily focused on making computers learn automatically, finding rules or patterns by analyzing large amounts of data, and making predictions on unknown data. ML can be roughly divided into four categories based on the learning method used: supervised learning, unsupervised learning, semi-supervised learning, and reinforcement learning [13,14].
ML has been widely used in many fields, including disease diagnosis [15], stock trend prediction [16], image and speech recognition [17,18], information extraction [19], etc. In the ML approach, a prediction model can be trained with input data to achieve a goal without solving theoretic equations.
For architectural acoustics, Nannariello & Fricke [20] used 71 spaces, including concert halls, auditoriums, and cultural centers, to predict the reverberation time using neural networks. Comparing the reverberation time obtained by the neural network, Sabine formula, and ODEON 2.6D has allowed researchers to evaluate the prediction ability of the trained model. Falcon Perez [21] studied the acoustic indicators of a single space and constructed a ML predictive model based on different indoor characteristics (furniture size, placement, etc.).
The purpose of this study is to use ML to propose a predictive model of acoustic indicators as a simple evaluation tool for the architectural design and interior decoration of small and medium-sized activity centers.
First, we confirmed the compatibility of the field measurements and simulations, then used the parametric design to generate samples as the object of analysis, and finally obtained accurate solutions of the acoustic indicators using the acoustic simulation software Odeon. After the data was generated, ML was adopted, and the parameters of the space, such as the basic geometric information, material properties, and placement positions, were used to obtain a predictive model. The resulting model provided a compromise method regarding acoustic performance evaluation, which had a certain degree of accuracy and was quick and simple for practical use. The workflow is shown in Figure 1.
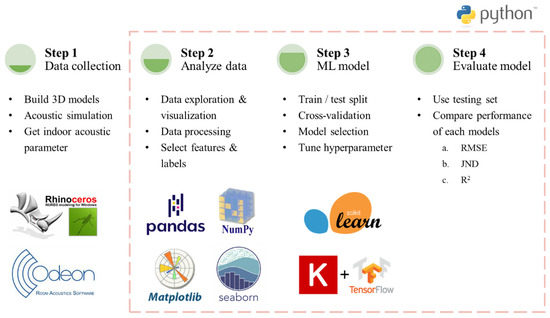
Figure 1.
Workflow of this study.
2. Data Collection
The research was aimed at existing small and medium-sized multi-functional activity centers in Taiwan. In order to collect data, a large amount of data was generated through parametric modeling and acoustic simulation software. Therefore, a compatibility test of field measurements and simulations had to be performed first. Then data was collected through simulation, and a machine learning model was constructed based on the dataset.
2.1. Research Objects and Target Acoustic Indicators
The research objects were primarily rectangular spaces with a stage at the front. The usage scenarios were mostly speeches, small performances, ceremonies, parties, and sports activities. According to statistics from a total of 212 school multi-functional activity centers in Taiwan, the floor area distribution was mainly from 120 to 2500 m2, with just a few more than 2500 m2 (Figure 2).
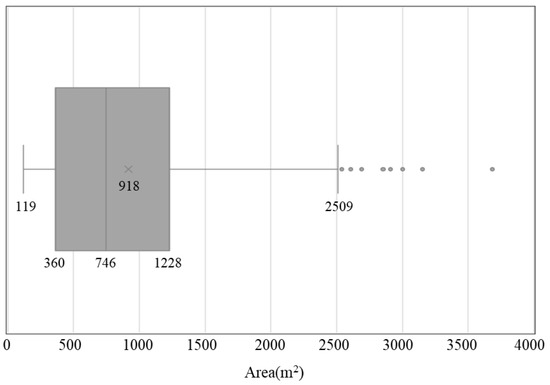
Figure 2.
Boxplot of floor area of multi-functional activity centers.
In accordance with ISO 3382-1 2009 [22], the room acoustic indicators are shown in Table 1. The just noticeable difference (JND) is the minimum amount by which stimulus intensity must be changed in order to produce a noticeable variation in sensory experience. This value provides a good suggestion of the accuracy required for prediction. Less than 1 JND indicates no obvious difference, but obtaining results with this accuracy is difficult in most cases, so slightly higher than 1 JND is still an acceptable range. In addition, the difference between the predicted value of each acoustic indicator and the measured value should not exceed 2 JND [23].

Table 1.
Target indoor acoustic indicators.
2.2. Compatibility of the Field Measurement and Simulations
The field measurement was carried out in a classroom (approximately 136 m2) at National Cheng Kung University (Figure 3). The purpose of doing so was to confirm the compatibility of the field measurement and building acoustics simulation software in the different impacts of replacing indoor sound-absorbing materials and changing the placement of sound-absorbing materials in the same space on indoor acoustic indicators. After confirming compatibility, subsequent research and analysis were mainly carried out with the simulation software. In addition to observing the error rate of the overall data, we also compared the trend of the difference between the measured and simulated values from each receiving point individually.
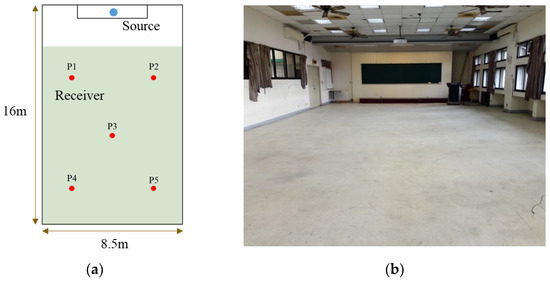
Figure 3.
Space description of field measurement: (a) Space size; (b) Space photo.
The measurement was based on ISO 3382-1. A dodecahedron speaker was used as an omnidirectional sound source. The measured parameters were sound pressure level (SPL), background noise, reverberation time (T20), C50, C80, and STI. The receiving point was erected at a height of 1.5 m, and a tripod was used to move the point.
Currently, many kinds of architectural acoustics simulation software are available, such as Odeon, EASE, CATT, etc. This study adopted Odeon (version 14) for acoustic simulation. Odeon is a piece of software developed by the Technical University of Denmark (Dept. of Acoustic Technology) and a group of consulting companies in 1984. It is capable of calculating various parameters of room acoustics based on spatial geometric conditions and surface material properties. The calculation method is a hybrid method that combines ray tracing and image sources [24].
The 3D model was drawn based on on-site spatial surveys, and the sound absorption coefficient of material was set according to the situation of the site and related values in past literature. The referenced literature values were adjusted and confirmed within a reasonable range through Odeon’s optimization function. The Genetic Material Optimizer in Odeon is an optimization tool which uses a genetic algorithm. Its function is to match the simulated room acoustic indicators with the actual measured acoustic indicators by modifying the materials in the room.
2.3. Data Generation
Data generation in this study was divided into three steps (Figure 4). First, we used the parametric design method to automatically generate 3D models, then imported the models into Odeon for acoustic simulation, and finally obtained the required room acoustic indicators. In this study, 800 sets of multi-functional activity center models were generated, with nine receiving points in each set, for a total of 7200 generated data points.
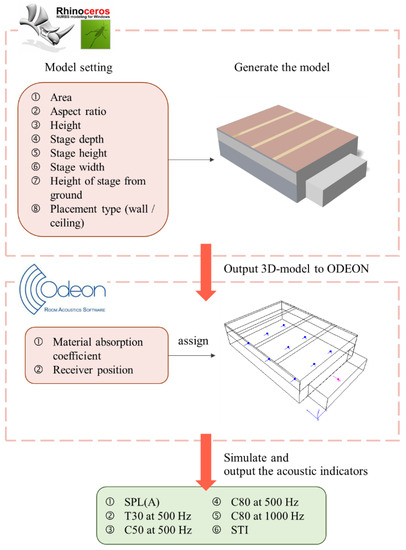
Figure 4.
Process of data generation.
2.3.1. Building the 3D Models
On the Rhino-Grasshopper platform, a 3D model of the space was automatically generated by parametric design. The basic form of the space was a rectangular space with a stage at the front (Figure 5). First, we set the geometric conditions of the space, created a space based on these conditions, and then randomly allocated the decoration surface of this space to different types of materials to generate the final 3D model. The basic parameter conditions of the model are shown in Table 2. The model was generated by randomly setting these geometric conditions and then the placement of the decoration surface was also set in a random manner. Finally, the model was imported into Odeon.
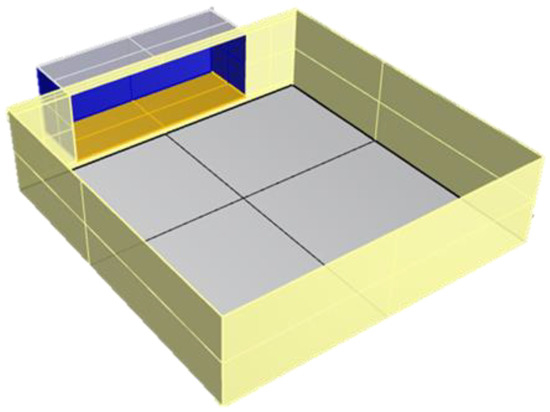
Figure 5.
The basic spatial form.

Table 2.
Setting conditions of parametric model.
The sound source required for the subsequent acoustic simulation was set at a height of 1.5 m above the ground in the center of the stage area; the receiving points were distributed equally in the audience area with nine points, all at a height of 1.5 m above the ground, to represent the distribution of the entire space (Figure 6). Various information in the process, such as geometric conditions, material placement type, sound source, and receiving point coordinates, were all recorded and exported.
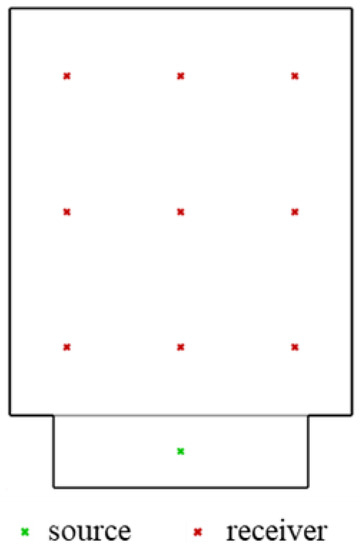
Figure 6.
Source and receiver points.
This study assumed that a decoration surface (ceiling or wall) was composed of one or two different materials. The different placement methods are shown in Figure 7. The decoration surfaces that could be changed were the ceiling, back wall, and two side walls. For subsequent data processing and ML, we had to transform such image information into a numerical description (Table 3).

Figure 7.
Placement type of wall and ceiling.

Table 3.
Numerical description of decoration surface placement.
2.3.2. Sound-Absorbing Material Setting
Regarding the material setting after the space was built, the variables that primarily affected the indoor acoustic indicators were the sound absorption coefficient and scattering coefficient of the material. This study mainly focused on the material selection and placement method of the decoration surface.
Five kinds of materials were chosen from previous literature. The selected materials ranged from having low to high sound absorption coefficients, included to represent the selection of various materials. The materials used for the ceiling are shown in Table 4, and those for the wall are shown in Table 5.

Table 4.
Material setting of ceiling.

Table 5.
Material setting of wall.
3. Machine Learning
The brief process of machine learning is shown in Figure 8. First, we performed various observations and pre-processing on the data and selected the features to be used in the model. Then the data were divided into training, validation, and testing sets. We constructed the machine learning model, evaluated its performance, and improved the performance by adjusting hyperparameters and other methods (convert or process data/input different feature combinations). Finally, the trained model was used to predict the data in the testing set.

Figure 8.
Process of machine learning.
In this study, we adopted Scikit-learn and Tensorflow to construct machine learning models, both of which are open-source libraries of python. The python version used was 3.6.8, and the main libraries used are shown in Table 6.

Table 6.
Description of used libraries.
3.1. Data Processing
In this study, we used the correlation matrix to preliminarily observe the relationship between the parameters. By observing the numerical distribution of each feature, we were able to obtain a rough understanding of the overall data and the applicability of this model.
Furthermore, the discussion of the sound absorption coefficient of the material was focused on the octave bands of 500 Hz and 1000 Hz. Considering the convenience and feasibility of practical applications in the future, sound absorption coefficients were divided into two groups: original sound absorption coefficients and leveled sound absorption coefficients, as shown in Figure 9. We then discussed and compared the performance of these two models and determined whether the leveled sound absorption coefficients was applicable within the scope of this study.
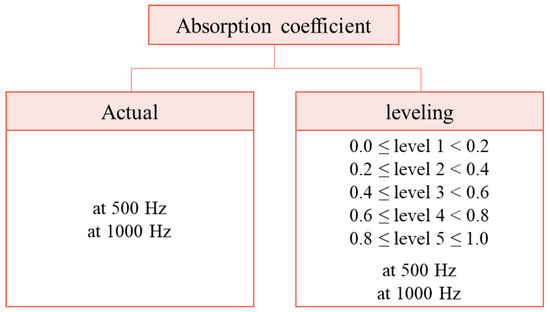
Figure 9.
Data processing of sound absorption coefficient.
Categorical data, such as the location of the receiving point, type of material placement, etc., were converted into numerical data by one-hot encoding, and the leveled sound absorption coefficient was converted by label encoding. These two, namely one-hot and label encoding, are the principal methods available for converting categories or text data into numeric data. They are presented in the form of an example in Figure 10. In label encoding, each category is assigned a unique integer. Once performed, the model will consider an order or rank between categories (as shown in Figure 10: 0 < 1 < 2) so that it is suitable for ordinal data. In one-hot encoding, every unique value in the category is added as a feature. This encoding method does not sort the categories and is suitable for data that are not ordinal.
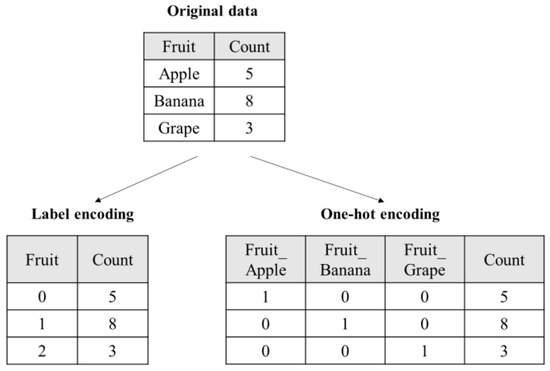
Figure 10.
Diagram of encoding method.
For the artificial neural network model, we adopted data normalization to scale different features to the same size, which may increase the convergence speed and improve the accuracy of the model [25,26,27]. In this study, the standard score (also known as z-score) was used, and it is defined by:
where is the mean of the population and is the standard deviation of the population. After this standardization action, the data had a mean value of 0 and a standard deviation of 1.
3.2. Model of Machine Learning
This study used four ML methods to build predictive models, namely the support vector machine (SVM), random forest (RF), gradient boosting decision tree (GBDT), and artificial neural network (ANN). The construction process is shown in Figure 11. The data segmentation ratio was training and validation set 80% and test set 20%. Furthermore, we adopted cross-validation (K-fold cross-validation, K = 10) to reduce overfitting.
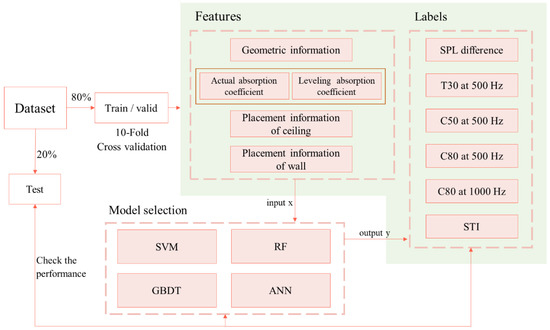
Figure 11.
Process of model construction.
- SVM was developed based on statistical learning frameworks [28], which could be used for both classification (SVC) and regression (SVR). The risk of overfitting is lower in SVM models. SVM models have good generalization ability in practice but are not suitable for large datasets because of the relatively long training time [29].
- RF was proposed by Breiman in 2001 [30] as an algorithm that belongs to ensemble learning. The concept of ensemble learning is that it combines multiple learners to produce more accurate results than a single learner [31]. RF uses the decision tree as the basic learner and adds randomly allocated training data to improve model performance.
- GBDT is an ensemble learning algorithm that combines gradient descending and boosting and uses the decision tree as the basic learner. The concept of gradient boosting was derived from the observations of Breiman [32] and was further developed by Friedman [33].
- ANN is inspired by the biological neural network [34]. It is a dense network of many neurons (operation units) connected to each other that can be simply divided into an input layer, hidden layer, and output layer. The purpose of the neural network is to find the appropriate weights and biases to minimize the value of the loss function. It is robust against irrelevant noise, but its performance is sensitive to the chosen hyperparameter values [29].
3.3. Performance Evaluation
This study uses RMSE, JND, absolute error, and R2 of the dataset original label values and model prediction values to evaluate model performance. They are respectively defined using the following equations:
where N is the number of samples, is real value, is predicted values, I is the JND limen, and is the mean of real values.
Regarding JND, the thresholds of different acoustic indicators are listed in Table 1. The closer its value is to 0, the better the predictive ability. Since SPL difference has no reference to the JND limen, absolute error is used for SPL difference.
3.4. Dataset for Machine Learning
The dataset of this study is composed of 38 columns and 7200 rows (a total of 7200 data points, each with 38 parameters), and the total matrix has 273,600 units. The histogram of the target values (acoustic indicators) and its distribution curve are shown in Figure 12. The blue curve represents kernel density estimation (KDE), the probability density function that represents the probability of the data appearing at this value. The black curve represents the normal distribution curve. Furthermore, the distribution of features is shown in Figure 13. A list of all targets and features was listed in Table A1.
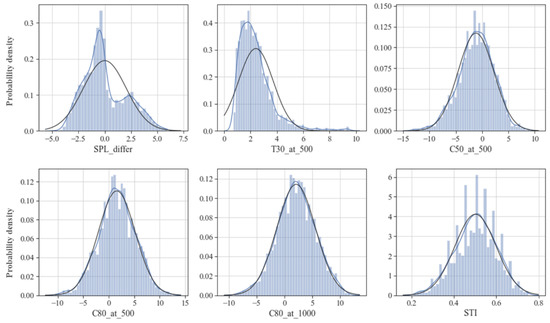
Figure 12.
The distribution of target values.
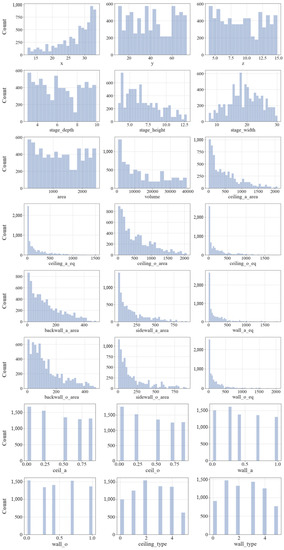
Figure 13.
The distribution of features.
4. Results and Discussions
4.1. Compatibility of the Field Measurement and Simulations
The field measurement was carried out from 12 to 14 August 2020. By changing the ceiling materials of different areas and locations, a total of 15 different sets of field measurements were conducted. The 15 sets can be divided into the original situation of the space, the change of ceiling material by 1/3 area and 1/8 area. Under the same area, 7 different placement methods were measured (placed in the middle/placed forward and backward in the short direction/placed forward and backward in the long direction/striped arrangement in the short and long direction).
Expanded metal mesh with a folding structure was used for the ceiling sound-absorbing material, and the unit size was 60 cm × 60 cm × 3 cm [35]. The sound absorption coefficient was tested in the reverberation room of the architecture acoustics laboratory at NCKU.
The 3D model used in the simulation is shown in Figure 14. The calculation parameters were set pursuant to the calculation time and equipment. The impulse response length was 4000 ms, and the number of late rays was 16,000. The sound absorption coefficients and scattering coefficients of materials were set according to the literature values, and adjustments were made using the optimization tool. The material settings are shown in Table 7.
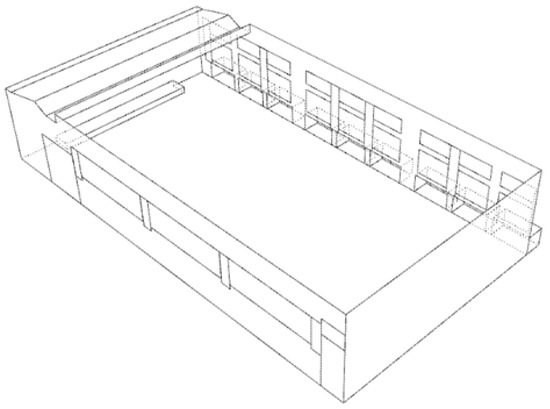
Figure 14.
3D model for simulation.

Table 7.
Absorption coefficient settings in simulation.
The following describes the comparison results of actual field measurement and simulations (ODEON). The results of each receiver point (Figure 15) demonstrate that the acoustic indicators were affected by the distance between the source and the receiving point. C50 was underestimated at the three points closest to the sound source but overestimated at the last two points. C80 also had an almost similar tendency (except for point P5), while STI was generally overestimated but still showed differences between the front and back points.
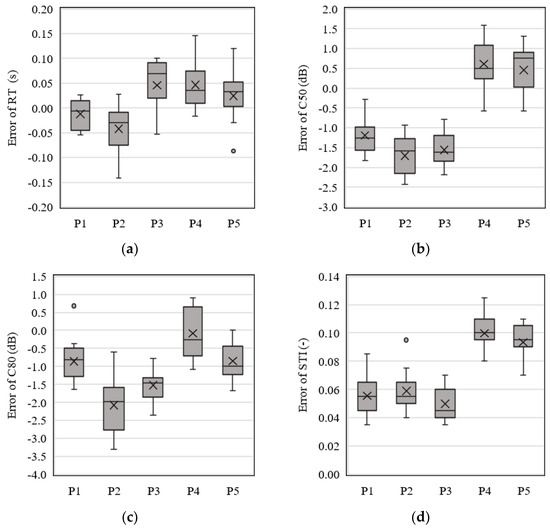
Figure 15.
Boxplot of absolute error by each receiver point. (a) RT at 500 Hz; (b) C50 at 500 Hz; (c) C80 at 1000 Hz; (d) STI.
The JND of the measured and simulated values of the overall data is shown in Figure 16, and the RMSE is shown in Table 8. It exhibits good compatibility in reverberation time and clarity, while the performance of the JND of STI is not very good (JND > 2). Judging from the trend of measured and simulated values, almost all the data are overestimated and have a clear relationship. Therefore, we have speculated that the model settings still have some imperfections, such as ignoring curtains, ceiling fans, lamps, air outlets, etc. Nevertheless, the results of the two still have a certain compatibility.
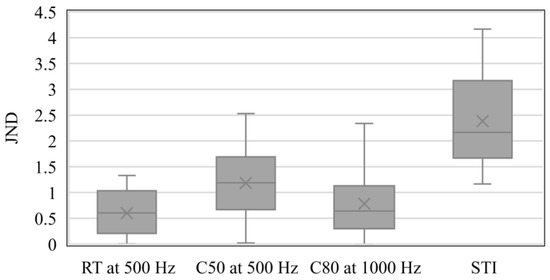
Figure 16.
Boxplot of JND.

Table 8.
The RMSE of each acoustic indicator.
4.2. Construction of the ML Model
4.2.1. Data Observation
The correlation matrix between the numerical target value and the feature is shown in Figure 17, which was used to observe the degree of correlation between the variables. Its value was between −1 and 1, and this graph was used to find the variables that had a greater impact on the target parameters.
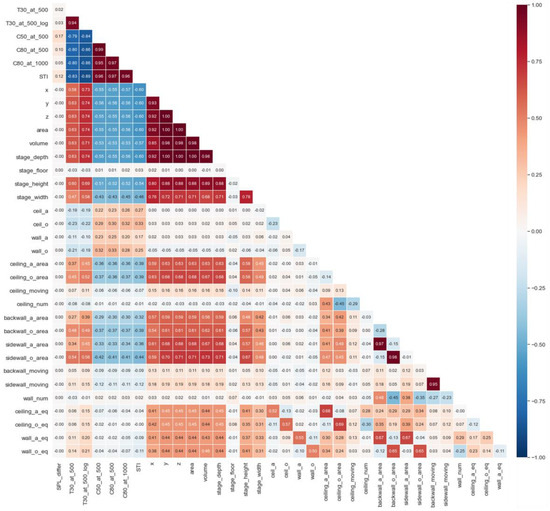
Figure 17.
Correlation matrix of dataset.
Among acoustic indicators, the geometric information of space had a great influence, but the correlation between the height of the stage and the acoustic indicators was relatively low. In addition, the equivalent sound absorption area had a low correlation with the acoustic indicators. However, the correlation matrix has limitations. The correlation coefficient only considers the linear relationship between the two variables, and a strong correlation does not necessarily indicate a causal relationship. Furthermore, variables other than these two that may affect the correlation cannot be presented.
4.2.2. Tuning the Hyperparameters
Each different ML algorithm has two types of model parameters: ordinary parameters that are automatically optimized during the model training phase, and hyperparameters that are manually set before training [36]. A hyperparameter is a parameter used to control the learning process. Different ML algorithms have different hyperparameters, and the performance of models can be improved by adjusting the hyperparameters. First, we set the default value of Scikit-learn and then slightly tuned the hyperparameters. After adjusting the hyperparameters of the model, we evaluated the model’s RMSE and the time it takes, and selected appropriate values as the final model settings.
Using the GBDT model as an example, we adjusted two hyperparameters: n_estimators and max_depth to improve performance. Their RMSE and training time are shown in Figure 18. The line shows RMSE and the brown bar shows the training time. Time is labeled in the right y-axis.
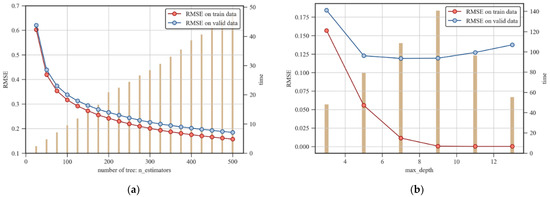
Figure 18.
Tuning the hyperparameters of the GBDT model. (a) n_estimators; (b) max_depth.
4.2.3. Data Processing for Absorption Coefficients
In this section, we discuss the difference in model performance between the actual sound absorption coefficient and the leveled sound absorption coefficient, where the remaining input features and target values are fixed.
The RMSE of the two methods of processing for the reverberation time is shown in Figure 19, and the RMSE and R2 of each target value (testing set) are shown in Table 9. It can be seen that the SVM model has an obvious difference in its the prediction. With regards to reverberation time, C50, C80, and STI, the leveled absorption coefficient obtained even better results than the actual absorption coefficient.
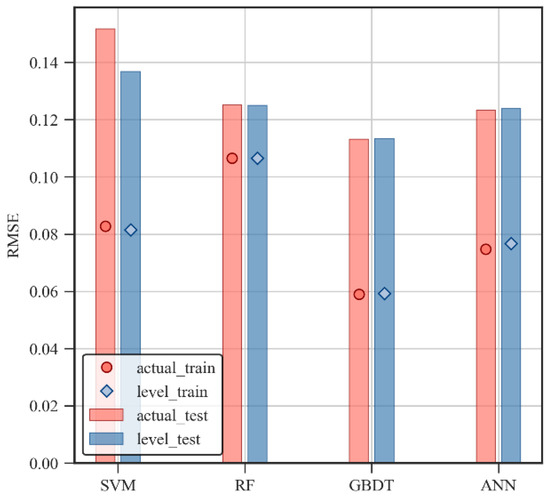
Figure 19.
The RMSE of RT by data processing for absorption coefficient.

Table 9.
Model result by data processing for absorption coefficient.
The other models had little difference in their processing results, which means that grading the sound absorption coefficient would not cause too much loss of data and information within the scope of this study. In practical applications, the leveled processing method would be more flexible and convenient, so subsequent research ought to focus on the leveled sound absorption coefficient.
4.3. Machine Learning Model Results
4.3.1. Model Settings and Performance
The final settings of the hyperparameters are shown in Table 10, and the hyperparameters not mentioned are set to default values. For the same acoustic indicator, the JND of the testing set data of the different models is shown in Figure 20. The red dashed line represents the position of JND ± 2 and 0.

Table 10.
Hyperparameter settings of machine learning models.
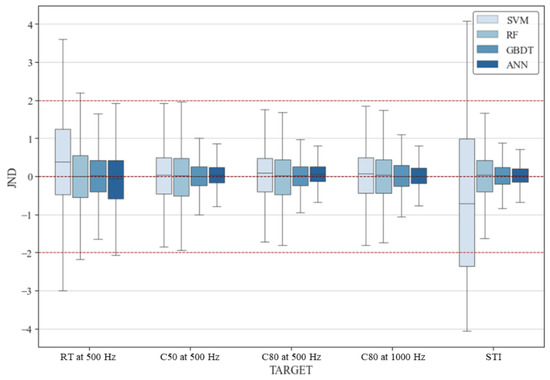
Figure 20.
JND of each model with testing set (outliers not shown).
In general, most of the data could reach the range of JND ± 2 that we set for this study, and for C50, C80, and STI, almost all data could reach within JND ± 1, which indicates excellent predictive ability. GBDT and ANN are clearly more applicable than SVM and RF, and different algorithm models are applicable to different acoustic indicators. GBDT performed best in terms of RT, while ANN performed best for the remaining targets.
4.3.2. Comparison with Traditional Estimation Formulas
For the prediction of reverberation time, we used three estimation formulas (Sabin’s, Eyring’s, and Arau-Puchades’s method) to compare with the ML model. For the 800 spaces generated in this study, the reverberation time obtained by Odeon simulation was taken as the x-axis, the scatter plot is shown in Figure 21, and the RMSE is shown in Table 11. The figure clearly shows that the predictive ability of the three traditional formulas is poor, and reverberation time would be underestimated in most spaces. In contrast, the GBDT model constructed in this study has quite a high accuracy.
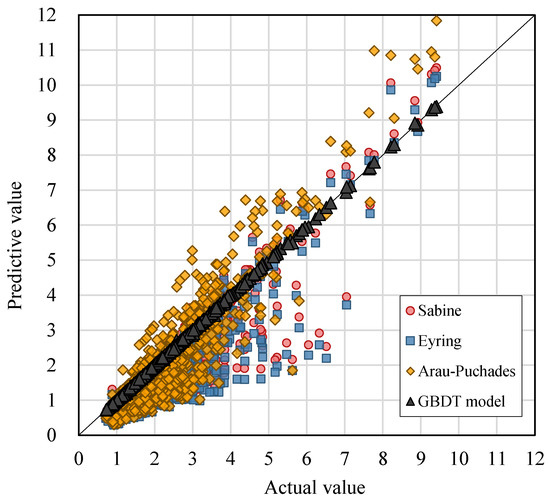
Figure 21.
Scatter plot of reverberation time.

Table 11.
The RMSE of reverberation time for 800 spaces.
Comparing the JND distributions (Figure 22), we found that the predictive ability of the ML model is much higher than that of the traditional formula. The data of the GBDT model concentrate near 0, and in almost all the data, JND falls within the range of ±1. However, the JND of the traditional estimation formula is approximately in the range of ±15, and most of the data tends to be negative, suggesting that the RT of the traditional estimation formula is likely to be underestimated within the scope of this study.
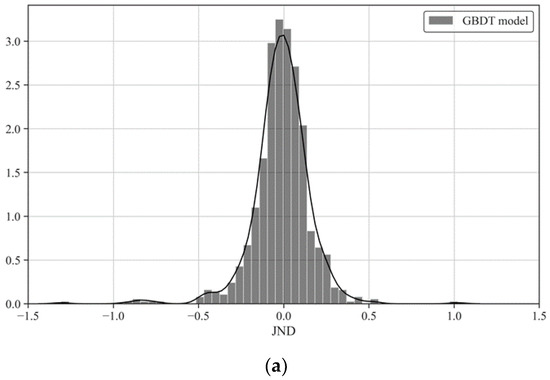
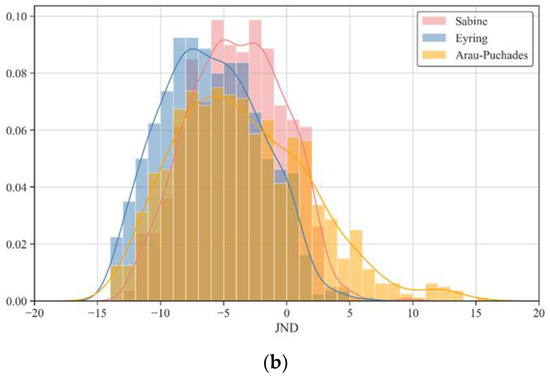
Figure 22.
JND distribution histogram of reverberation time: (a) GBDT model; (b) Traditional estimation formulas.
5. Conclusions
In this study, we focused on the current deficiencies or complicated and time-consuming processes of the current prediction of indoor acoustic indicators and constructed an innovative prediction model. It is quick and simple and does not require 3D modeling. In the practical applications of architectural design, it could more effectively and conveniently evaluate the relevant acoustic indicators and also has a certain degree of accuracy. After discussion and analysis, the conclusions of this study are summarized as follows:
- Data processing of sound absorption coefficientsIn terms of the performance of the model, with the exception of SVM, the differences in the results of the actual and leveled sound absorption coefficients are quite small. Substituting the leveled sound absorption coefficient for the actual sound absorption coefficient is a feasible, flexible, and convenient option.
- Correlation analysis and feature selection of MLIn this study, spatial geometric properties are highly correlated with acoustic indicators. Surprisingly, the correlation between the equivalent sound absorption area and acoustic indicators is low. However, in the ML model, deleting the less relevant parameters does not have good performance.In ML, various parameters may interact with each other and then affect the final prediction. Therefore, when adjusting the input features of the model, more detailed comparisons and judgments are required. In addition, the input combination of features can also be explored through methods such as sequential feature algorithms, which are used for dimensionality reduction.
- Results of the machine learning predictive modelsExcept for the reverberation time, the ANN model exhibited the best performance. The absolute error of the SPL distribution difference fell mostly within ±0.5 dB, while the JND of C50, C80, and STI were all within ±1.In terms of the reverberation time, the GBDT model performed the best. It is also comparable to the traditional estimation formula commonly used in the past. We found that the predictive ability of the GBDT model is much higher than the traditional formula, is convenient in practical applications, and can be quickly and effectively evaluated in the architectural design stage.
The main research object of this study was a multi-functional activity center with a fixed space. All the training data were generated by acoustic simulation software. The premise of the model in this study is a fixed spatial form, and the variation of material placement is limited to 6 types. Therefore, the space or material placement that falls outside of the conditions of this study set is not suitable for the prediction model proposed in this study. In addition, the applicability of space area not in the dataset of this study needs more discussion and research.
Regarding the actual field measurement, although this study carried out a compatibility comparison, its accuracy requires further discussion and research. The applicability of the model would become more credible if it could be trained with actual field measurement data. However, considering that collecting acoustic measurement data is often difficult and expensive, obtaining a large amount of real data is not necessarily feasible. It is suggested that follow-up research may try to use the transfer learning method of ML, which often uses simulated data to train the model, and then use a small amount of real-field data to adjust the model.
Furthermore, more diversified data can be added, such as that generated by considering different spaces and indoor decoration forms, creating a more general space description method, and increasing the selection of materials to develop a more widely applicable ML prediction model. The furniture placed or occupied in the space is also a factor that affects the room’s acoustic indicators. How to add these variables and convert them into a method that can be input into the ML model is also worthy of subsequent research.
Author Contributions
Conceptualization, Y.-S.T. and C.-Y.Y.; methodology, Y.-S.T. and C.-Y.Y.; software, C.-Y.Y.; validation, Y.-S.T. and C.-Y.Y.; data curation, C.-Y.Y.; writing—original draft preparation, C.-Y.Y.; writing—review and editing, Y.-S.T.; visualization, C.-Y.Y.; supervision, Y.-S.T. Both authors have read and agreed to the published version of the manuscript.
Funding
This research received no external funding.
Data Availability Statement
The data presented in this study are available on request from the corresponding author.
Conflicts of Interest
The authors declare no conflict of interest.
Appendix A

Table A1.
List of targets and features.
Table A1.
List of targets and features.
| Description | Code | Range | Unit | |
|---|---|---|---|---|
| Acoustic indicator | RT at 500 Hz | T30_at_500 | 0.68–9.62 | s |
| Logarithmic value of RT at 500 Hz | T30_at_500_log | −0.39–2.26 | - | |
| C50 at 500 Hz | C50_at_500 | −13.3–9 | dB | |
| C80 at 500 Hz | C80_at_500 | −10.6–12.3 | dB | |
| C80 at 1000 Hz | C80_at_1000 | −9.1–11.8 | dB | |
| STI | STI | 0.21–0.75 | - | |
| SPL difference | SPL_differ | −4.6–6.2 | dB | |
| Geometry information | Receiver point | position | 1, 2, 3, …, 9 | - |
| Width of the space | x | 12.4–33.5 | m | |
| Length of the space | y | 9.9–73.7 | m | |
| Height of the space | z | 4–14.8 | m | |
| Area of the space | area | 122.76–2468.95 | m2 | |
| Volume of the space | volume | 584.88–39,310.04 | m3 | |
| Stage depth | stage_depth | 3–9.9 | m | |
| Stage height from the floor | stage_floor | 0–1.5 | m | |
| Stage height | stage_height | 3.4–12.8 | m | |
| Stage width | stage_width | 7.3–30.1 | m | |
| Sound absorption coefficient | Sound absorption coefficient of ceiling material A | ceil_a | 0.01–1.00 | - |
| Sound absorption coefficient of ceiling material B | ceil_o | 0.01–1.00 | - | |
| Sound absorption coefficient of wall material A | wall_a | 0.01–1.00 | - | |
| Sound absorption coefficient of wall material B | wall_o | 0.01–1.00 | - | |
| Placement of ceiling | Placement type of ceiling | ceiling_type | 0, 1, 2, 3, 4, 5 | - |
| Area occupied by material A of ceiling | ceiling_a_area | 0–2075.7 | m2 | |
| Area occupied by material B of ceiling | ceiling_o_area | 0–2067.724 | m2 | |
| The distance of material B from the stage | ceiling_moving | 0–30.787 | m | |
| Strip number of material B | ceiling_num | 1–10 | - | |
| Placement of wall | Placement type of wall | wall_type | 0, 1, 2, 3, 4, 5 | - |
| Area occupied by material A of back wall | backwall_a_area | 0–484.43 | m2 | |
| Area occupied by material B of back wall | backwall_o_area | 0–478.28 | m2 | |
| Area occupied by material A of side wall | sidewall_a_area | 0–922.45 | m2 | |
| Area occupied by material B of side wall | sidewall_o_area | 0–910.46 | m2 | |
| The distance of back wall material B from the edge | backwall_moving | 0–14.60 | m | |
| The distance of side wall material B from the stage | sidewall_moving | 0–25.22 | m | |
| Strip number of material B | wall_num | 1–10 | - | |
| Equivalent sound absorption area | Equivalent sound absorption area of ceiling material A | ceiling_a_eq | 0–1668.033 | m2 |
| Equivalent sound absorption area of ceiling material B | ceiling_o_eq | 0–2026.369 | m2 | |
| Equivalent sound absorption area of wall material A | wall_a_eq | 0–2140.538 | m2 | |
| Equivalent sound absorption area of wall material B | wall_o_eq | 0–2164.371 | m2 |
References
- Kaarlela-Tuomaala, A.; Helenius, R.; Keskinen, E.; Hongisto, V. Effects of Acoustic Environment on Work in Private Office Rooms and Open-Plan Offices—Longitudinal Study during Relocation. Ergonomics 2009, 52, 1423–1444. [Google Scholar] [CrossRef]
- Passero, C.R.M.; Zannin, P.H.T. Acoustic Evaluation and Adjustment of an Open-Plan Office through Architectural Design and Noise Control. Appl. Ergon. 2012, 43, 1066–1071. [Google Scholar] [CrossRef]
- Xiao, J.; Aletta, F. A Soundscape Approach to Exploring Design Strategies for Acoustic Comfort in Modern Public Libraries: A Case Study of the Library of Birmingham. Noise Mapp. 2016, 3, 264–273. [Google Scholar] [CrossRef]
- Yun, J.-H.; Ju, D.-H.; Kim, J.-S. Evaluation on Architectural Acoustic Performance of Small-Scaled Multipurpose Hall for Improvement of Acoustic Performance. In Proceedings of the Korean Society for Noise and Vibration Engineering Conference, Gyeongju, Korea, 15–16 November 2007; The Korean Society for Noise and Vibration Engineering: Seoul, Korea; pp. 226–230. [Google Scholar]
- Cairoli, M. Architectural Customized Design for Variable Acoustics in a Multipurpose Auditorium. Appl. Acoust. 2018, 140, 167–177. [Google Scholar] [CrossRef]
- Gordon, D. Multipurpose Spaces; National Clearinghouse for Educational Facilities: Washington, DC, USA, 2010. [Google Scholar]
- Sabine, W.C. Collected Papers on Acoustics; Harvard University Press: Cambridge, MA, USA, 1922. [Google Scholar]
- Eyring, C.F. Reverberation Time in “Dead” Rooms. J. Acoust. Soc. Am. 1930, 1, 168. [Google Scholar] [CrossRef]
- Arau-Puchades, H. An Improved Reverberation Formula. Acta Acust. United Acust. 1988, 65, 163–180. [Google Scholar]
- Schroeder, M.R.; Gerlach, R. Diffusion, Room Shape and Absorber Location—Influence on Reverberation Time. J. Acoust. Soc. Am. 1974, 56, 1300. [Google Scholar] [CrossRef]
- Zhou, X.; Späh, M.; Hengst, K.; Zhang, T. Predicting the Reverberation Time in Rectangular Rooms with Non-Uniform Absorption Distribution. Appl. Acoust. 2021, 171, 107539. [Google Scholar] [CrossRef]
- Beranek, L.L. Analysis of Sabine and Eyring Equations and Their Application to Concert Hall Audience and Chair Absorption. J. Acoust. Soc. Am. 2006, 120, 1399–1410. [Google Scholar] [CrossRef]
- Yalçın, O.G. Introduction to Machine Learning. In Applied Neural Networks with TensorFlow 2: API Oriented Deep Learning with Python; Apress: Berkeley, CA, USA, 2021; pp. 33–55. ISBN 978-1-4842-6513-0. [Google Scholar]
- Dey, A. Machine Learning Algorithms: A Review. Int. J. Comput. Sci. Inf. Technol. 2016, 7, 1174–1179. [Google Scholar]
- Soni, J.; Ansari, U.; Sharma, D.; Soni, S. Predictive Data Mining for Medical Diagnosis: An Overview of Heart Disease Prediction. Int. J. Comput. Appl. 2011, 17, 43–48. [Google Scholar] [CrossRef]
- Patel, J.; Shah, S.; Thakkar, P.; Kotecha, K. Predicting Stock and Stock Price Index Movement Using Trend Deterministic Data Preparation and Machine Learning Techniques. Expert Syst. Appl. 2015, 42, 259–268. [Google Scholar] [CrossRef]
- Ciregan, D.; Meier, U.; Schmidhuber, J. Multi-Column Deep Neural Networks for Image Classification. In Proceedings of the IEEE Computer Society Conference on Computer Vision and Pattern Recognition, Providence, RI, USA, 16–21 June 2012; pp. 3642–3649. [Google Scholar]
- Hinton, G.; Deng, L.; Yu, D.; Dahl, G.; Mohamed, A.R.; Jaitly, N.; Senior, A.; Vanhoucke, V.; Nguyen, P.; Sainath, T.; et al. Deep Neural Networks for Acoustic Modeling in Speech Recognition: The Shared Views of Four Research Groups. IEEE Signal Process. Mag. 2012, 29, 82–97. [Google Scholar] [CrossRef]
- Freitag, D. Information Extraction from HTML: Application of a General Machine Learning Approach. In AAAI-98 Proceedings; American Association for Artificial Intelligence: Palo Alto, CA, USA, 1998; pp. 517–523. [Google Scholar]
- Nannariello, J.; Fricke, F. The Prediction of Reverberation Time Using Neural Network Analysis. Appl. Acoust. 1999, 58, 305–325. [Google Scholar] [CrossRef]
- Falcon Perez, R. Machine-Learning-Based Estimation of Room Acoustic Parameters. Master’s Thesis, Aalto University, Espoo, Finland, 2018. [Google Scholar]
- ISO 3382-1:2009 Acoustics—Measurement of Room Acoustic Parameters—Part 1: Performance Spaces; International Organization for Standardization: Geneva, Switzerland, 2009.
- Vorländer, M. Auralization: Fundamentals of Acoustics, Modelling, Simulation, Algorithms and Acoustic Virtual Reality; Springer: Berlin/Heidelberg, Germany, 2008; ISBN 978-3-540-48829-3. [Google Scholar]
- ODEON Room Acoustics Software User’s Manual; Version 14; Odeon A/S: Lyngby, Denmark, 2018.
- Sola, J.; Sevilla, J. Importance of Input Data Normalization for the Application of Neural Networks to Complex Industrial Problems. IEEE Trans. Nucl. Sci. 1997, 44, 1464–1468. [Google Scholar] [CrossRef]
- Aksu, G.; Güzeller, C.O.; Eser, M.T. The Effect of the Normalization Method Used in Different Sample Sizes on the Success of Artificial Neural Network Model. Int. J. Assess. Tools Educ. 2019, 6, 170–192. [Google Scholar] [CrossRef]
- Jayalakshmi, T.; Santhakumaran, A. Statistical Normalization and Back Propagation for Classification. Int. J. Comput. Theory Eng. 2011, 3, 1793–8201. [Google Scholar]
- Cortes, C.; Vapnik, V. Support-Vector Networks. Mach. Learn. 1995, 20, 273–297. [Google Scholar] [CrossRef]
- Singh, A.; Thakur, N.; Sharma, A. A Review of Supervised Machine Learning Algorithms. In Proceedings of the 2016 3rd International Conference on Computing for Sustainable Global Development (INDIACom), New Delhi, India, 16–18 March 2016; pp. 1310–1315. [Google Scholar]
- Breiman, L. Random Forests. Mach. Learn. 2001, 45, 5–32. [Google Scholar] [CrossRef]
- Kuncheva, L.I.; Bezdek, J.C.; Duin, R.P.W. Decision Templates for Multiple Classifier Fusion: An Experimental Comparison. Pattern Recognit. 2001, 34, 299–314. [Google Scholar] [CrossRef]
- Breiman, L. Arcing the Edge; Technical Report 486; Statistics Department, University of California: Berkeley, CA, USA, 1997; Volume 7. [Google Scholar]
- Friedman, J.H. Greedy Function Approximation: A Gradient Boosting Machine. Ann. Stat. 2001, 29, 1189–1232. [Google Scholar] [CrossRef]
- Bishop, C.M. Pattern Recognition and Machine Learning (Information Science and Statistics); Springer: Berlin/Heidelberg, Germany, 2006; ISBN 0387310738. [Google Scholar]
- Tseng, P.C. A Study on Sound Absorption Performance of Expanded Metal Mesh with Folding Structure. Master’s Thesis, National Cheng Kung University, Tainan, Taiwan, 2020. (In Chinese). [Google Scholar]
- Luo, G. A Review of Automatic Selection Methods for Machine Learning Algorithms and Hyper-Parameter Values. Netw. Modeling Anal. Health Inform. Bioinform. 2016, 5, 1–16. [Google Scholar] [CrossRef]
Publisher’s Note: MDPI stays neutral with regard to jurisdictional claims in published maps and institutional affiliations. |
© 2021 by the authors. Licensee MDPI, Basel, Switzerland. This article is an open access article distributed under the terms and conditions of the Creative Commons Attribution (CC BY) license (https://creativecommons.org/licenses/by/4.0/).