1. Introduction
In recent decades, there have been many efforts to develop new analytical techniques for localizing and mapping trace compounds in biological samples. Mass spectrometry imaging (MSI) is one method of choice because it measures the chemical composition of a sample point by point.
In 1967, Liebl [
1] reported the first MSI experiment regarding the characterization of some inorganic materials. Later, the combination of a laser probe with a time-of-flight (TOF) mass spectrometer was proposed by Hillenkamp et al. [
2], exploiting the potential of the technique for organic materials. Although the laser ion source led to extremely localized ionization, the detection of big molecules remained an open task. To overcome that limitation, Karas et al. [
3] and Tanaka et al. [
4] reported that some specific UV-adsorbent compounds (matrix) can assist laser ionization, leading to a more efficient and versatile MS technique, called matrix-assisted laser desorption ionization (MALDI). Since 1997, MALDI-MSI has become one of the most popular techniques to investigate the distribution of big biomolecules in tissue sections due to the works of Caprioli et al. [
5,
6,
7]. MALDI-MSI is currently used to investigate different samples, such as plant [
8] and animal models [
9]. Despite its high sensitivity and wide dynamic range, MALDI-MSI is not completely suitable for small molecule detection (
m/
z < 1000 Da), because of the strong background noise generated by the ion source decay of the matrix [
10]. Consequently, other ionization techniques [
11,
12] have been used to assist MSI-applications; however, the lateral resolutions they achieve are not comparable to the superior optical resolution observed with laser ion sources.
An alternative approach to the MSI of small molecules is to use UV-absorbent inorganic nanomaterials instead of the conventional MALDI matrices [
13,
14,
15,
16,
17,
18,
19]. The limiting aspects of this approach are the ad hoc synthesis required to produce nanomaterials, and their unknown shelf life and stability. As reported in the literature [
20,
21], metallic nanoparticles can undergo clusterization under laser irradiation. These side processes result in several interfering signals in the MS spectra. Commercially available oxide-based nanomaterials, with well-established physico-chemical properties and shelf lives, will overcome these issues [
22].
Aside from biological applications of MALDI-MSI [
23,
24], this technique is innovative in many other research contexts. In the forensic field, for example, it has been used to detect latent fingermarks (LFMs) [
25,
26,
27]. However, the analytical separation of overlapping LFMs and the detection of trace compounds embedded in human skin are still areas of debate [
20,
28].
We developed a new method based on MALDI-MSI, starting with commercially available TiO2 nanoparticles (Evonik P25). The technique was used to identify the chemical distribution of small molecules embedded in LFMs. The detection of endogenous compounds (e.g., lipids) was used to distinguish overlapping fingerprints from different donors. Exogenous compounds were also detected, proving direct and secondary interactions between skin and potentially illicit substances.
2. Materials and Methods
A MALDI 4800 TOF-TOF (AB SCIEX, Old Connecticut Path, Framingham, MA 01701, USA) was used. The instrument worked in reflectron mode, achieving a resolving power (RP) of 25,000 and a mass accuracy (MA) of 50 ppm. The ion source was equipped with a 355 nm Nd:YAG laser (200 Hz repetition rate) and operated under a vacuum (0.7 µTorr). The optics were oriented to focus the laser beam (50 µm) orthogonally on the target, obtaining an energy density of 500–1000 eV/mm2. Ions were extracted and accelerated by applying a high-voltage pulse (20 kV) after a predetermined time delay of 0.35 ms. The spectrometer digitalized data every 2 ns, averaging one spectrum every four laser shots. The electron multiplier was set to 0.85 V. The instrument was controlled by software with a 4000-Series SCIEX Explorer.
Before any experiment, the instrument was tuned with a CAL-MIX5 and MALDI methodology was optimized using caffeine and stearic acid as reference standards for positive and negative ion modes. A matrix suspension of a photoactive matrix (Evonik P25 TiO2, 0.5 µg/µL) was prepared using H2O and CH3OH (75:25 v/v). Approximately 1 µL of TiO2 suspension was drop-cast on the laser target, which was then dried upside-down for 2 h to ensure even TiO2 coverage. In this way, the MALDI target was functionalized with the nano-material. Finally, 1 µL of each reference standard was deposited on the TiO2 spot.
The limits of detection (LODs) were assessed in positive and negative ion modes, reducing the amounts of calibrants spotted on the MALDI target. Assuming an S/N ratio equal to 3, the LODs were estimated as 400 fmol/mm
2 for caffeine (positive ion mode) and 250 fmol/mm
2 for stearic acid (negative ion mode). The relative spectra are shown in
Figure S1.
The imaging experiment on endogenous compounds in LSM started with a donor who touched the MALDI target with the index finger. Approximately 2 mg of TiO2 nanoparticles were spread on the target. Some nanoparticles were trapped in the LFM, but the excess nanomaterial was carefully removed under a gentle nitrogen stream. The mass spectrometer was set up in order to collect each pixel using 10 individual laser shoots. The molecular distribution of the analytes was determined by recording a pixel every 30 µm. Acquisition occurred in negative ion mode, revealing skin fatty acids. The shooting rate was approximately 104 laser shoots per mm2. Time to digital converter (TDC) was set to 4 ns/bin for data storage. Dedicated software (BioMap, Novartis) was used to merge all the spectra, leading to the final chemical image. Attribution of the MS signals was based on accurate mass measurements and confirmed by analyzing the same sample with an LTQ/Orbitrap (Thermo Fisher Scientific, San Jose, CA, USA) mass analyzer, equipped with a DESI ion source (Prosolia, Indianapolis, IN, USA). The LTQ/Orbitrap operated at a resolution of 100,000, achieving a 5 ppm mass accuracy.
The imaging experiment of exogenous compounds used most of the instrumental conditions reported above. An over-the-counter drug (formulation: acetaminophen, aspirin, and caffeine) was used. The experiment started by asking a subject to touch the drug tablet with their finger and then deposit the fingerprint on the MALDI target. Approximately 2 mg of TiO2 was spread on the target, revealing the LMFs. Images were acquired in positive reflectron ion mode, revealing traces of target compounds embedded in human skin.
3. Results
3.1. TiO2-Based MALDI Matrix
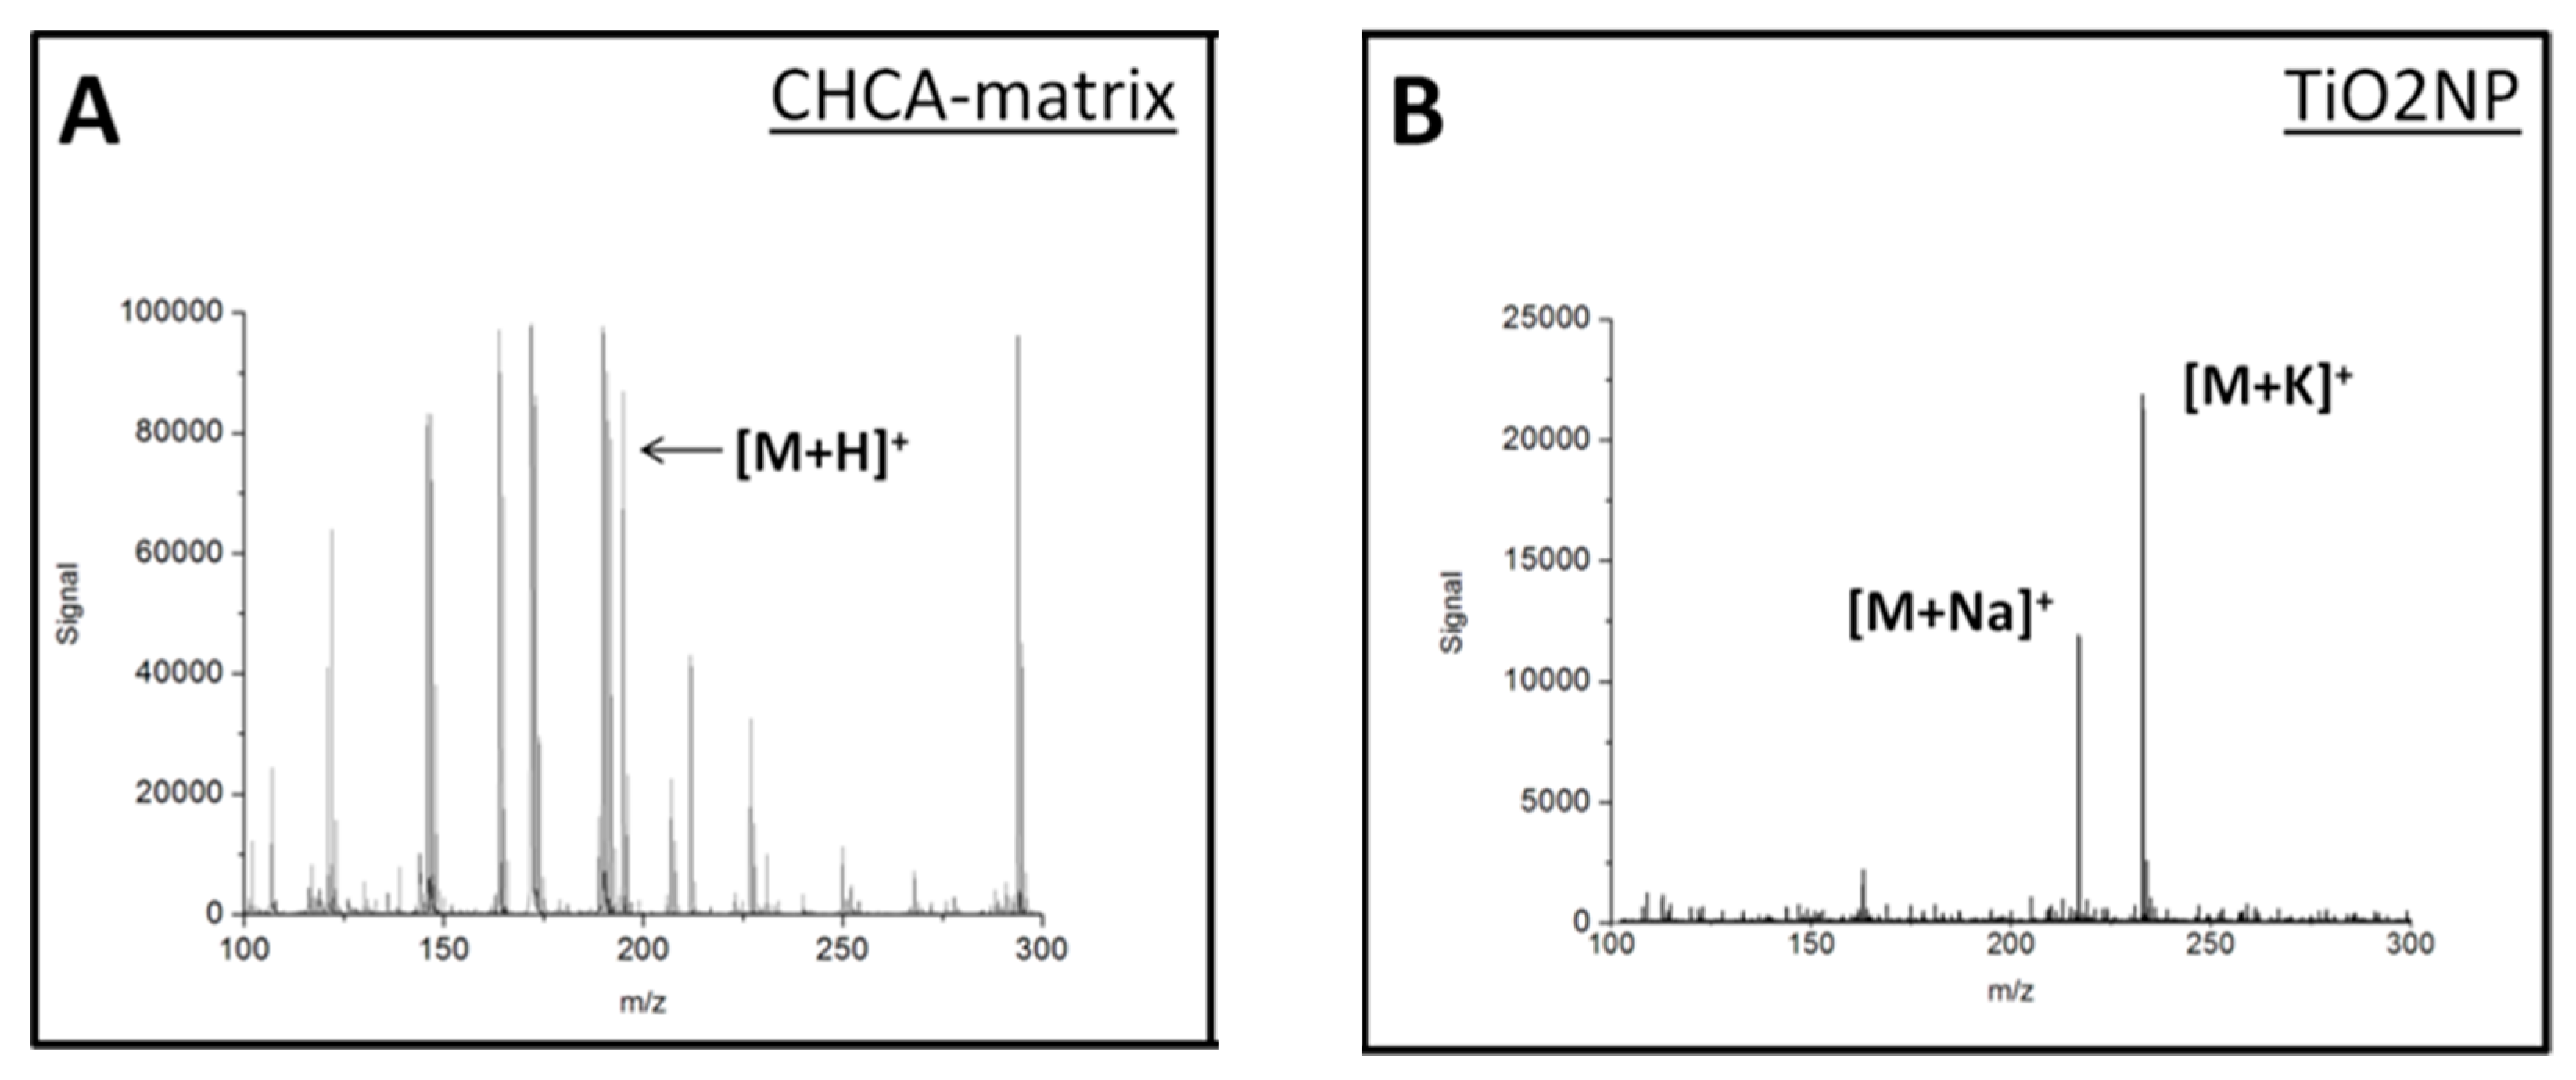
Figure 1 compares the performances of CHCA and NP TiO
2 using caffeine as a reference standard. Pristine P25 always assists the generation of Na and K molecular adducts in the course of laser ionization (
Figure 1B). This process can be enhanced by saturating the surface of P25 with protons or specific cations (Li
+, Na
+, and K
+). Doped P25 NP can modulate the ionization mechanism, driving it toward the cationization of interest (
Figure S2).
3.2. Endogenous Compounds MSI
An ion at
m/
z 265.1420 was observed in all fingerprints acquired. From the DESI/Orbitrap measurement, this signal was identified as the dodecyl sulfate anion of SDS, a surfactant usually employed in cleaning formulations. This ion was used as an instrumental reference (lock mass, red signal in
Figure 2) in LFM-analysis, achieving high mass accuracy, even with regular TOF mass detectors (resolution lower than 20,000).
Five different LFM reconstructions, obtained by MALDI-MSI, are shown in
Figure 3;
Figure 3A–D depicts palmitoleic, palmitic, oleic, and stearic acids, respectively.
Figure 3E is the chemical image obtained by mapping the relative abundance of SDS anions.
Figure 4 shows the experimental case of two overlapped LFMs. Two different people touched the MALDI target after a short time, and P25 was then used for MALDI imaging.
Figure 4A is the optical image of both LFMs, obtained with an optical stereoscope equipped with a 2× camera.
Figure 4B shows the LFMs reconstruction obtained by extracting the signal due to SDS (C
12H
25SO
4,
m/
z 265, blue) from the MSI dataset.
Figure 4C,D shows the molecular distribution of myristic acid (C
14H
28O
2,
m/
z 227, green) and arachidic acid (C
20H
40O
2,
m/
z 311, red), respectively. These fatty acids were expressed differently in the two donors, so their relative abundance allowed the full deconvolution of both LFMs.
Figure 4E is an example of a background chemical image obtained by extracting an unidentified recurring ion (
m/
z 65, grey) from the background noise. This MSI excludes the presence of artifacts or false positives in the LFM reconstruction.
3.3. Exogenous Compounds MSI
MSI detected and imaged the principal constituents of a tablet (
Table S2. All components were cationized by P25, leading to [M+Na]
+ and [M+K]
+ molecular ions. In this case too, the presence of the analytes was confirmed with DESI/Orbitrap: acetaminophen and caffeine in positive ion mode and acetylsalicylic acid in negative ion mode ([M-H]
− m/
z 179.0342) (data not shown).
Figure 5 shows the contact regions between the skin and a tablet.
Figure 5A,B describes the relative abundance of the first tablet constituent, acetaminophen, on the skin. These molecular distributions were revealed by extracting (in green) the relative abundance of the ions [M+Na]
+ m/
z 174 and [M+K]
+ m/
z 190. Similarly,
Figure 5C,D maps in blues the distribution of the second constituents (acetylsalicylic acid, [M+Na]
+ m/
z 203 and [M+K]
+ m/
z 219).
To demonstrate the ability of this technique to assess the transposition of a trace compound through several objects, a paper clip was stored in the tablet bottle, picked up with tweezers, and swiped along with the donor finger. Despite the very low concentration of the analytes (lower than the LOD) and the general complexity of drug imaging [
29], the MSI method was sensitive enough to highlight the region of contact between the clip and skin (
Figure 6). The strong and close contact with the skin can produce a sort of template effect of the tablet on the skin, similar to the effect of typebars on the ribbon in an old typewriter.
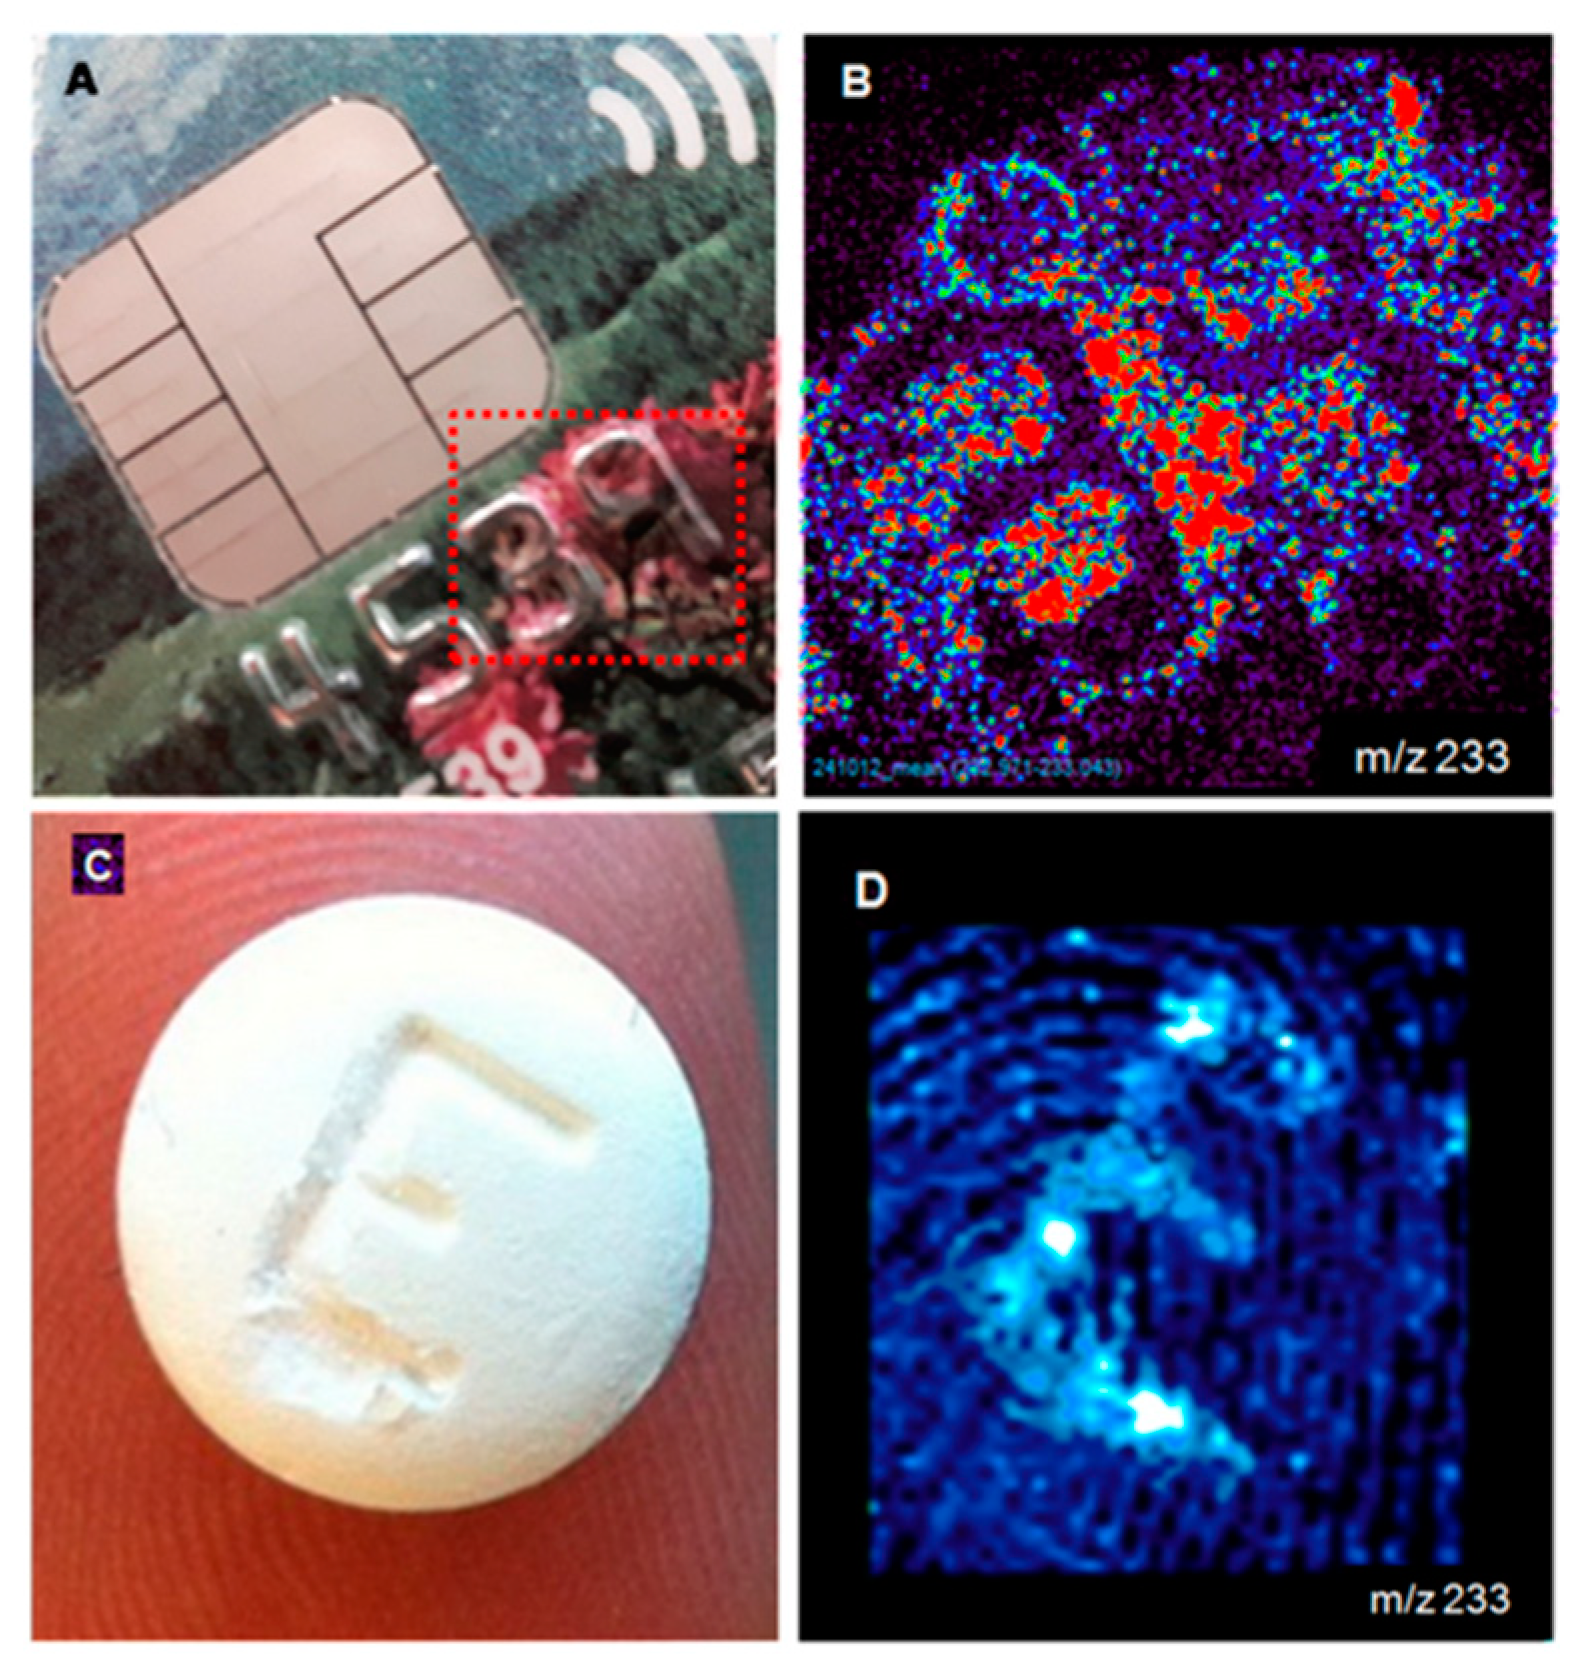
Figure 7 depicts an ad hoc MSI experiment, showing that the engraving of the capital letter E on the tablet resulted in a molecular print of the letter on human skin, which could be revealed by extracting one of the diagnostic ions from the LFM.
This chemical image originated from the residuals of the powder trapped in the groove and proved that the morphology of the object can influence the molecular distribution of specific analytes along the skin (acetaminophen, [M+Na]+ m/z 190).
Images of objects over the LFM resemble not only the shape of the object but also its surface (
Figure 7). A credit card, with embossed numbers rising above the surface of the card, produced a negative image. A tablet with an imprinted E produced a positive image of the surface. A possible explanation is that the tops of the embossed numbers on the credit card retained fewer particles, leaving more contamination around and between numbers due to less mechanical wiping out related to contact with other objects. Conversely, caffeine traces were trapped inside the groove of a tablet (
Figure 7C,D).
4. Discussions
The chemical imaging techniques discussed here, taking advantage of the low chemical noise from the matrix, allow low molecular weight imaging at high sensitivity.
One of the main features that makes P25 suitable for MSI is the ability to absorb the Nd-YAG emission wavelength (λ 355 nm,
Figure S3). In addition to the classical properties of nanomaterials (average size, surface area, and relative porosity [
30]), the P25 amphiprotic surface (isoelectric point around 6.0, typical of this oxide [
31,
32],
Figure S4) allows the modulation of the adsorption of different kinds of organic analytes [
33,
34,
35,
36,
37]. Moreover, the high surface area of the nanoparticles can easily exchange the surface cations, allowing for a controlled cationization process, assisting ionization [
15].
We compared the thermochemical properties of P25 to the conventional α-cyano-4-hydroxycinnamic acid (CHCA) MALDI matrix. P25′s high melting point and sublimation enthalpy (one order of magnitude higher than CHCA [
38,
39]) minimize the self-decomposition induced by the laser irradiation, leading to negligible background noise in the low-mass region of the spectra. Its intrinsic chemical stability means P25 can assist the Nd-YAG laser source in the desorption/ionization process without decomposing or interfering with the MS analysis [
40].
Untargeted analysis revealed endogenous compounds in LFMs: both saturated and unsaturated fatty acids (
Table S1 and
Figure 2 and
Figure S5) were recognized as [M-H]
− molecular ions. The signal’s attribution was confirmed by analyzing the same sample with DESI/Orbitrap, operating in negative ion mode.
One of the most important features in the chemical images is the strong lateral resolution, achieved by working with NP that allow for reconstructing the fine structures of the skin, determining the relative abundance of each analyte point-by-point over the skin. In summary, P25 offers an extremely localized ionization process, with good sensitivity for trace compounds. These are the two key points to use MALDI imaging to separate overlapping fingermarks, resulting from the interaction of the same object (MALDI target) with different subjects. Overlapped LFMs provide critical forensic evidence because of their controversial legal validity. MSI can selectively highlight each fingerprint according to the different expressions of lipids on the skin, thus enabling MSI to completely distinguish multiple overlapped LFMs.
5. Conclusions
The analysis of small molecules with inorganic NPs, has been described as a powerful alternative to conventional matrices for latent fingerprints [
18,
41]. All our experimental evidence indicated that commercially available P25 nanoparticles assist the ionization of small molecules in MSI experiments. The strong thermochemical stability of TiO
2 under laser irradiation resulted in negligible background noise in the low mass region (
m/
z < 500).
Based on these results, proof of concept of an innovative method using MALDI-MSI was developed. This new MSI method is suitable for the deconvolution of overlapping latent finger marks and sensitive enough to reveal exogenous trace compounds embedded in human skin. We also showed that, with the high sensitivity of this approach, one can image not only endogenous compounds but also residues of exogenous compounds on LFM. These chemical images can prove the contact between the finger and tablet, and the chemical images reflected the shape of the contaminated object (paper clip).
Thus, MALDI-MSI may be a practical analytical approach useful to support the forensic application of mass spectrometry. This approach, to the best of our knowledge, is the first demonstration of visualization by mass spectrometry of chemical images of exogenous compounds on human skin, with high sensitivity and direct analytical abilities.
Future developments will be devoted to increasing the ionization efficiency of P25, using UV photo-adsorber compounds and plasmon resonance nanostructures.
Supplementary Materials
The following are available online at
https://www.mdpi.com/article/10.3390/app11125624/s1. Figure S1: NP MALDI/TOF analysis of caffeine ([M+Na]
+ m/z 217, [M+K]
+ m/z 233) and stearic acid ([M-H]
− m/z 283). MS spectra of caffeine: A (160 pmol/mm
2), B (16.0 pmol/mm
2), and C (1.60 pmol/mm
2); MS spectra of stearic acid in box-D (111 pmol/mm
2), box-E (11.1 pmol/mm
2), and box-F (1.11 pmol/mm
2). Figure S2. NP MALDI/TOF measurements of caffeine 10 pmol/mm
2. (A) caffeine ionized by P25 H-doped ([M+H]
+ m/z 195), (B) caffeine ionized by P25 Li-doped ([M+Li]
+ m/z 201), C caffeine ionized by P25 Na-doped ([M+Na]
+ m/z 217), and D caffeine ionized by P25 K-doped ([M+K]
+ m/z 233). Figure S3. Diffuse reflectance spectrum of P25 sample. Figure S4. ζ potential vs. pH of P25 aqueous slurry. Figure S5. MALDI/TOF full mass spectrum of a fingermark showing different fatty acids (probable structures, see Table S1 for identification) and different images created on six analytes. Table S1. Probable structures of endogenous substances (fatty acids) revealed in latent fingermarks by NP MALDI/TOF and DESI/Orbitrap experiments. Table S2. Exogenous substances (caffeine, acetaminophen and acetyl salicylic acid) revealed in latent fingermarks by MALDI/TOF and DESI/Orbitrap.
Author Contributions
Conceptualization, A.C., E.D., L.F. and G.C.; methodology, A.C. and L.M.; formal analysis, A.C. and L.M.; writing—original draft preparation, A.C. and E.D.; writing—review and editing, all authors; supervision, E.D.; funding acquisition, E.D. All authors have read and agreed to the published version of the manuscript.
Funding
This work was supported by Cariplo Foundation for the project “Nanostructured-initiators for matrix-free, surface-based mass spectrometry imaging of antitumour drugs in tissues” (Project 2013-0692) to E.D.
Institutional Review Board Statement
Not applicable.
Informed Consent Statement
Not applicable.
Data Availability Statement
Acknowledgments
This work was supported by Cariplo Foundation for the project “Nanostructured-initiators for matrix-free, surface-based mass spectrometry imaging of antitumour drugs in tissues” (Project 2013-0692). The authors wish to thank J.D. Baggott for editorial assistance.
Conflicts of Interest
The authors declare no conflict of interest. The funders had no role in the design of the study; in the collection, analyses, or interpretation of data, in writing the manuscript, or in the decision to publish the results.
References
- Liebl, H. Ion Microprobe Mass Analyzer. J. Appl. Phys. 1967, 38, 5277–5283. [Google Scholar] [CrossRef]
- Hillenkamp, F.; UNSöLD, E.; Kaufmann, R.; Nitsche, R. Laser Microprobe Mass Analysis of Organic Materials. Nature 1975, 256, 119–120. [Google Scholar] [CrossRef] [PubMed]
- Karas, M.; Bachmann, D.; Hillenkamp, F. Influence of the Wavelength in High-Irradiance Ultraviolet Laser Desorption Mass Spectrometry of Organic Molecules. Anal. Chem. 1985, 57, 2935–2939. [Google Scholar] [CrossRef]
- Tanaka, K.; Waki, H.; Ido, Y.; Akita, S.; Yoshida, Y.; Yoshida, T.; Matsuo, T. Protein and Polymer Analyses up To m/z 100 000 by Laser Ionization Time-of-Flight Mass Spectrometry. Rapid Commun. Mass Spectrom. 1988, 2, 151–153. [Google Scholar] [CrossRef]
- Caprioli, R.M.; Farmer, T.B.; Gile, J. Molecular Imaging of Biological Samples: Localization of Peptides and Proteins Using MALDI-TOF MS. Anal. Chem. 1997, 69, 4751–4760. [Google Scholar] [CrossRef] [PubMed]
- Chaurand, P.; Stoeckli, M.; Caprioli, R.M. Direct Profiling of Proteins in Biological Tissue Sections by MALDI Mass Spectrometry. Anal. Chem. 1999, 71, 5263–5270. [Google Scholar] [CrossRef] [PubMed]
- Stoeckli, M.; Chaurand, P.; Hallahan, D.E.; Caprioli, R.M. Imaging Mass Spectrometry: A New Technology for the Analysis of Protein Expression in Mammalian Tissues. Nat. Med. 2001, 7, 493–496. [Google Scholar] [CrossRef] [PubMed]
- Lee, Y.J.; Perdian, D.C.; Song, Z.; Yeung, E.S.; Nikolau, B.J. Use of Mass Spectrometry for Imaging Metabolites in Plants: Mass Spectrometry for Imaging Metabolites in Plants. Plant J. 2012, 70, 81–95. [Google Scholar] [CrossRef]
- Addie, R.D.; Balluff, B.; Bovée, J.V.M.G.; Morreau, H.; McDonnell, L.A. Current State and Future Challenges of Mass Spectrometry Imaging for Clinical Research. Anal. Chem. 2015, 87, 6426–6433. [Google Scholar] [CrossRef]
- Byrd, H.C.M.; McEwen, C.N. The Limitations of MALDI-TOF Mass Spectrometry in the Analysis of Wide Polydisperse Polymers. Anal. Chem. 2000, 72, 4568–4576. [Google Scholar] [CrossRef]
- Balog, J.; Sasi-Szabo, L.; Kinross, J.; Lewis, M.R.; Muirhead, L.J.; Veselkov, K.; Mirnezami, R.; Dezso, B.; Damjanovich, L.; Darzi, A.; et al. Intraoperative Tissue Identification Using Rapid Evaporative Ionization Mass Spectrometry. Sci. Transl. Med. 2013, 5, 194ra93. [Google Scholar] [CrossRef] [PubMed]
- Eberlin, L.S.; Norton, I.; Dill, A.L.; Golby, A.J.; Ligon, K.L.; Santagata, S.; Cooks, R.G.; Agar, N.Y.R. Classifying Human Brain Tumors by Lipid Imaging with Mass Spectrometry. Cancer Res. 2012, 72, 645–654. [Google Scholar] [CrossRef]
- Taira, S.; Sugiura, Y.; Moritake, S.; Shimma, S.; Ichiyanagi, Y.; Setou, M. Nanoparticle-Assisted Laser Desorption/Ionization Based Mass Imaging with Cellular Resolution. Anal. Chem. 2008, 80, 4761–4766. [Google Scholar] [CrossRef] [PubMed]
- Huh, Y.-M.; Jun, Y.; Song, H.-T.; Kim, S.; Choi, J.; Lee, J.-H.; Yoon, S.; Kim, K.-S.; Shin, J.-S.; Suh, J.-S.; et al. In Vivo Magnetic Resonance Detection of Cancer by Using Multifunctional Magnetic Nanocrystals. J. Am. Chem. Soc. 2005, 127, 12387–12391. [Google Scholar] [CrossRef] [PubMed]
- Giordano, S.; Pifferi, V.; Morosi, L.; Morelli, M.; Falciola, L.; Cappelletti, G.; Visentin, S.; Licandro, S.A.; Frapolli, R.; Zucchetti, M.; et al. A Nanostructured Matrices Assessment to Study Drug Distribution in Solid Tumor Tissues by Mass Spectrometry Imaging. Nanomaterials 2017, 7, 71. [Google Scholar] [CrossRef]
- Arendowski, A.; Ossoliński, K.; Niziol, J.; Ruman, T. Screening of Urinary Renal Cancer Metabolic Biomarkers with Gold Nanoparticles-Assisted Laser Desorption/Ionization Mass Spectrometry. Anal. Sci. 2020, 36, 1521–1527. [Google Scholar] [CrossRef] [PubMed]
- Kratochvíl, J.; Prysiazhnyi, V.; Dyčka, F.; Kylián, O.; Kúš, P.; Sezemský, P.; Štěrba, J.; Straňák, V. Gas Aggregated Ag Nanoparticles as the Inorganic Matrix for Laser Desorption/Ionization Mass Spectrometry. Appl. Surf. Sci. 2021, 541, 148469. [Google Scholar] [CrossRef]
- Amin, M.O.; Madkour, M.; Al-Hetlani, E. Metal Oxide Nanoparticles for Latent Fingerprint Visualization and Analysis of Small Drug Molecules Using Surface-Assisted Laser Desorption/Ionization Mass Spectrometry. Anal. Bioanal. Chem. 2018, 410, 4815–4827. [Google Scholar] [CrossRef]
- Wu, Q.; Chu, J.L.; Rubakhin, S.S.; Gillette, M.U.; Sweedler, J.V. Dopamine-Modified TiO2 Monolith-Assisted LDI MS Imaging for Simultaneous Localization of Small Metabolites and Lipids in Mouse Brain Tissue with Enhanced Detection Selectivity and Sensitivity. Chem. Sci. 2017, 8, 3926–3938. [Google Scholar] [CrossRef] [PubMed]
- McLean, J.A.; Stumpo, K.A.; Russell, D.H. Size-Selected (2−10 Nm) Gold Nanoparticles for Matrix Assisted Laser Desorption Ionization of Peptides. J. Am. Chem. Soc. 2005, 127, 5304–5305. [Google Scholar] [CrossRef] [PubMed]
- Sekuła, J.; Nizioł, J.; Rode, W.; Ruman, T. Gold Nanoparticle-Enhanced Target (AuNPET) as Universal Solution for Laser Desorption/Ionization Mass Spectrometry Analysis and Imaging of Low Molecular Weight Compounds. Anal. Chim. Acta 2015, 875, 61–72. [Google Scholar] [CrossRef]
- Morosi, L.; Spinelli, P.; Zucchetti, M.; Pretto, F.; Carrà, A.; D’Incalci, M.; Giavazzi, R.; Davoli, E. Determination of Paclitaxel Distribution in Solid Tumors by Nano-Particle Assisted Laser Desorption Ionization Mass Spectrometry Imaging. PLoS ONE 2013, 8, e72532. [Google Scholar] [CrossRef]
- Chughtai, K.; Heeren, R.M.A. Mass Spectrometric Imaging for Biomedical Tissue Analysis. Chem. Rev. 2010, 110, 3237–3277. [Google Scholar] [CrossRef]
- Morosi, L.; Matteo, C.; Ceruti, T.; Giordano, S.; Ponzo, M.; Frapolli, R.; Zucchetti, M.; Davoli, E.; D’Incalci, M.; Ubezio, P. Quantitative Determination of Niraparib and Olaparib Tumor Distribution by Mass Spectrometry Imaging. Int. J. Biol. Sci. 2020, 16, 1363–1375. [Google Scholar] [CrossRef] [PubMed]
- Gao, D.; Li, F.; Song, J.; Xu, X.; Zhang, Q.; Niu, L. One Step to Detect the Latent Fingermarks with Gold Nanoparticles. Talanta 2009, 80, 479–483. [Google Scholar] [CrossRef]
- Lim, C.S.; Chua, C.K.; Pumera, M. Detection of Biomarkers with Graphene Nanoplatelets and Nanoribbons. Analyst 2014, 139, 1072. [Google Scholar] [CrossRef] [PubMed]
- Bailey, M.J.; Bradshaw, R.; Francese, S.; Salter, T.L.; Costa, C.; Ismail, M.; Webb, P.R.; Bosman, I.; Wolff, K.; de Puit, M. Rapid Detection of Cocaine, Benzoylecgonine and Methylecgonine in Fingerprints Using Surface Mass Spectrometry. Analyst 2015, 140, 6254–6259. [Google Scholar] [CrossRef] [PubMed]
- Bradshaw, R.; Rao, W.; Wolstenholme, R.; Clench, M.R.; Bleay, S.; Francese, S. Separation of Overlapping Fingermarks by Matrix Assisted Laser Desorption Ionisation Mass Spectrometry Imaging. Forensic Sci. Int. 2012, 222, 318–326. [Google Scholar] [CrossRef]
- Morosi, L.; Zucchetti, M.; D’Incalci, M.; Davoli, E. Imaging Mass Spectrometry: Challenges in Visualization of Drug Distribution in Solid Tumors. Curr. Opin. Pharmacol. 2013, 13, 807–812. [Google Scholar] [CrossRef] [PubMed]
- Nalwa, H.S. (Ed.) Encyclopedia of Nanoscience and Nanotechnology. v. 1-10; American Scientific Publishers: Stevenson Ranch, CA, USA, 2004; Volume 10, ISBN 978-1-58883-001-2. [Google Scholar]
- Oliva, F.Y.; Avalle, L.B.; Cámara, O.R.; De Pauli, C.P. Adsorption of Human Serum Albumin (HSA) onto Colloidal TiO2 Particles, Part I. J. Colloid Interface Sci. 2003, 261, 299–311. [Google Scholar] [CrossRef]
- Kosmulski, M. Compilation of PZC and IEP of Sparingly Soluble Metal Oxides and Hydroxides from Literature. Adv. Colloid Interface Sci. 2009, 152, 14–25. [Google Scholar] [CrossRef] [PubMed]
- Cappelletti, G.; Pifferi, V.; Mostoni, S.; Falciola, L.; Di Bari, C.; Spadavecchia, F.; Meroni, D.; Davoli, E.; Ardizzone, S. Hazardous O-Toluidine Mineralization by Photocatalytic Bismuth Doped ZnO Slurries. Chem. Commun. 2015, 51, 10459–10462. [Google Scholar] [CrossRef] [PubMed][Green Version]
- Soliveri, G.; Pifferi, V.; Panzarasa, G.; Ardizzone, S.; Cappelletti, G.; Meroni, D.; Sparnacci, K.; Falciola, L. Self-Cleaning Properties in Engineered Sensors for Dopamine Electroanalytical Detection. Analyst 2015, 140, 1486–1494. [Google Scholar] [CrossRef] [PubMed]
- Le, Q.-C.; Ropers, M.-H.; Terrisse, H.; Humbert, B. Interactions between Phospholipids and Titanium Dioxide Particles. Colloids Surf. B Biointerfaces 2014, 123, 150–157. [Google Scholar] [CrossRef]
- Teixeira, S.; Gurke, R.; Eckert, H.; Kühn, K.; Fauler, J.; Cuniberti, G. Photocatalytic Degradation of Pharmaceuticals Present in Conventional Treated Wastewater by Nanoparticle Suspensions. J. Environ. Chem. Eng. 2016, 4, 287–292. [Google Scholar] [CrossRef]
- Pargoletti, E.; Pifferi, V.; Falciola, L.; Facchinetti, G.; Re Depaolini, A.; Davoli, E.; Marelli, M.; Cappelletti, G. A Detailed Investigation of MnO2 Nanorods to Be Grown onto Activated Carbon. High Efficiency towards Aqueous Methyl Orange Adsorption/Degradation. Appl. Surf. Sci. 2019, 472, 118–126. [Google Scholar] [CrossRef]
- Price, D.M.; Bashir, S.; Derrick, P.R. Sublimation Properties of x,y-Dihydroxybenzoic Acid Isomers as Model Matrix Assisted Laser Desorption Ionisation (MALDI) Matrices. Thermochim. Acta 1999, 327, 167–171. [Google Scholar] [CrossRef]
- Li, W.; Ni, C.; Lin, H.; Huang, C.P.; Shah, S.I. Size Dependence of Thermal Stability of TiO2 Nanoparticles. J. Appl. Phys. 2004, 96, 6663–6668. [Google Scholar] [CrossRef]
- Schmidt, C.M.; Buchbinder, A.M.; Weitz, E.; Geiger, F.M. Photochemistry of the Indoor Air Pollutant Acetone on Degussa P25 TiO2 Studied by Chemical Ionization Mass Spectrometry. J. Phys. Chem. A 2007, 111, 13023–13031. [Google Scholar] [CrossRef] [PubMed]
- Carra, A.; Cappelletti, G.; Falciola, L.; Davoli, E. Proceedings of the 60th ASMS Conference on Mass Spectrometry and Allied Topics, Vanvouver, BC, Canada, 20–24 May 2012.
| Publisher’s Note: MDPI stays neutral with regard to jurisdictional claims in published maps and institutional affiliations. |
© 2021 by the authors. Licensee MDPI, Basel, Switzerland. This article is an open access article distributed under the terms and conditions of the Creative Commons Attribution (CC BY) license (https://creativecommons.org/licenses/by/4.0/).


 ,
, 


