1. Introduction
Disaster risk reduction (DRR) is a global challenge within the urgent context of sustainable development. The inclusion of DRR in policies and economic programs is key to providing cost-effective investment for the prevention of future losses.
EM-DAT [
1] reports that 396 natural disasters caused 11,755 deaths, with 95 million people affected and USD 103 billion in economic losses across the world in 2019. The annual average number of deaths, people affected and economic losses in the previous decade (2009–2018) were even higher (45,212 deaths, 184.7 million people affected and USD 176 billion economic losses, respectively), due to the impact of massive disaster events such as the 2010 earthquake in Haiti (222,500 deaths), the 2015–2016 drought in India (330 million people affected) and the 2011 Japan earthquake and tsunami (USD 210 billion in damages). The future projection is for this trend to rise annually and by 2050 be reaching 100,000 lost lives and more than USD 300 billion per year [
2]. This increase in vulnerability to disasters is expected due to a number of factors, including worsening socio-economic conditions, urbanization, environmental degradation, inadequate infrastructures and diseases. According to the last global assessment report [
3] on disaster risk reduction, weather-related hazards cause the most economic losses, with floods being the costliest hazard, followed by earthquakes. Meanwhile, losses in the housing sector account for two thirds of total economic losses.
Global targets and common achievements to pursue DRR have been set in the Sendai Framework for Disaster Risk Reduction 2015–2030 [
4], adopted at the Third United Nations World Conference on Disaster Risk Reduction in Sendai, Japan, in March 2015. This aims to achieve a substantial reduction in disaster risk and loss of lives, livelihoods and health, and in the economic, physical, social, cultural and environmental assets of people, businesses, communities and countries over the next 15 years. The Sendai Framework works in continuity with the Hyogo Framework for Action [
5] of the previous decade (2005–2015), that recognized DRR as a national and local priority. The Sendai Framework sets seven targets and four priorities for action to prevent new and reduce existing disaster risks: (i) understanding disaster risk; (ii) strengthening disaster risk governance to manage disaster risk; (iii) investing in disaster reduction for resilience; (iv) enhancing disaster preparedness for effective response and to “Build Back Better” in recovery, rehabilitation and reconstruction. The above priorities are rigidly interconnected: the achievement of enhanced disaster preparedness necessitates incisive investments to be driven by an aware management of DRR, based on a deep knowledge of disaster risk. Consequently, pursuing priority (i), understanding disaster risk, is very important since it is necessary for the achievement of each of the other priorities. Among the objectives constituting priority (i), the Sendai Framework requires the development and dissemination of location-based disaster risk information, including risk maps, to be periodically updated and freely accessible to decision makers, the general public and communities. The United Nation office for disaster risk reduction (UNISDR) developed and launched the Sendai Framework Monitoring System [
6], providing an online platform collecting loss data by geographic location. This tool has the potential to provide an important support to the definition of global DRR strategies thanks to data availability, accessibility and interoperability. In order to achieve the global Sendai Framework Monitoring System, UNISDR supports the implementation of national disaster loss data collection systems.
The Italian response to the above requirements, with particular concern to the seismic risk, which is historically among the largest sources of risk for this territory, consists of the development of the IRMA (Italian Risk Maps) WebGIS platform [
7,
8]. The Italian territory is prone to high seismic risk in many areas due to this significant hazard, the elevated exposure provided by the important building heritage and high population density, and the significantly vulnerable building stock [
9]. Indeed, many Italian buildings were realized in the absence of seismic code prescriptions, thus fully lacking horizontal load bearing design criteria. In addition, seismic hazard maps are constantly and continuously updated to more severe levels on the basis of new knowledge acquired by experience and by the development of more refined geological models. Inadequate maintenance further limits structural capacity, worsening the vulnerability of buildings against earthquakes.
The IRMA platform collects national census data about residential building stock and implements several vulnerability/exposure models to evaluate unconditional damage scenarios within two time windows, namely one year and fifty years. In addition, the platform provides the seismic risk impact in terms of direct economic losses, unusable or collapsed buildings and dwellings in the short and long periods and the expected number of homeless, victims and injured people. Such representation of an earthquake’s consequences is a very useful support to the definition of seismic risk mitigation policies, helping in the identification of major risk areas requiring higher investments and facilitating the calibration of insurance premiums [
7].
Today there are numerous technological strategies that can be adopted in order to achieve satisfactory seismic retrofit levels, thus reducing seismic risk. Although, as pointed out by the Organization for Economic Co-operation and Development [
10], the effective financial management of earthquake risk requires governments to consider the best use of their limited resources. As a matter of fact, when the objective is the seismic risk mitigation of a large region where a wide number of buildings may need to be retrofitted, the challenge becomes more financial than technological. The limited amount of available resources generates the crucial issue of establishing how to spend the budget to achieve the highest regional seismic risk reduction, knowing that some buildings may not be covered by the retrofit’s expense. This leads to a classical optimization problem aimed at finding the optimal trade-off between risk and the resources spent on the risk management program. The optimal decision would be the one minimizing the expected cost while maximum benefit could be yielded.
Many recent studies investigate the use of multi-criteria decision methods (MCDM) within the context of regional seismic risk assessment. Nyimbili et al. [
11] applied MCDM within a GIS environment to generate earthquake hazard maps using five main evaluation criteria (field topography, source-to-site distance, soil classification, liquefaction potential and fault/focal mechanism). The authors present the potentiality of integrating such maps with population and building data for the territory in order to provide regional risk information in terms of the potential impacts of earthquake effects. In a different way, Cremen and Galasso [
12] combined MCDM and performance-based earthquake engineering (PBEE) in order to provide a viable tool for risk-informed earthquake early warning (EEW). In this case, the evaluation criteria assumed in the MCDM are the casualties, downtime and direct costs, i.e., the results of the PBEE, and are used to compare possible mitigation actions implementable when an EEW system triggers an alarm, finally determining the optimal one. Sadeghi et al. [
13] implemented a multi-objective optimization approach based on a genetic algorithm in order to define the optimal mitigation measure for a given return period event according to two issues, i.e., (1) the household annual expenses, such as mandatory earthquake insurance premiums and mitigation costs; and (2) the effects of mitigation measures on saving human lives. A different procedure was introduced by Vona et al. [
14], consisting of the use of MCDM to create prioritization strategies to reduce the territorial seismic risk associated with public and strategic buildings. In particular, the proposed methodology compares the convenience of giving priority to the most vulnerable buildings, most exposed buildings (in terms of number of occupants) or to buildings located in the most severe seismic hazard zones. Other authors [
15] focused on the assessment of the earthquake risk in historical urban fabrics with commercial value, based on the definition of the “historic-commercial urban fabrics risk index” (HCRI). This index can be estimated locally according to the contribution of hazard, vulnerability and response capacity, which are expressed by means of indicators and sub-indicators weighted through questionnaire surveys or expert judgement. In other studies [
16] attention is given to the problem of management and planning of the post-earthquake emergency within an urban area, in order to provide a measure of the resources and equipment needed during rescue activities. The proposed method is based on the availability of damage quantification reports, to be assessed immediately after the event through the completion of specific forms (AeDES forms). None of the above studies addressed the problem of the optimal budget definition and allocation for regional seismic risk mitigation. Motamed et al. [
17] proposed an automated model for optimizing budget allocation in earthquake mitigation scenarios through an iterative procedure looking for a retrofitting strategy with a cost within the available budget. The procedure integrates HAZUS vulnerability classes and parameters for several building typologies, similarly to the method proposed by Zolfaghari and Peyghaleh [
18] that additionally introduced the concept of equity in the distribution of resources among different groups of people. In the approach proposed by Caterino et al. [
19], the optimal budget allocation for seismic risk mitigation was achieved through the analysis of a wide range of possible retrofit strategies for the buildings stock, based on the seismic vulnerability of each building. This allows for a dense cloud of cost–benefit scenarios to be obtained, where the cost corresponds to the needed territorial investment and the benefit is the achieved seismic risk mitigation. The optimal retrofit solution can be selected among the possible scenarios as the one that allows minimization of the seismic risk given the available budget. This procedure can provide significant support to decision makers in planning appropriate seismic risk mitigation strategies since they are able to provide a global and comprehensive overview of the costs and benefits associated with a very large number of different scenarios. However, handling the huge amount of data that is consequent to the application of this procedure is a challenging task that can discourage its effective use. Indeed, differently to the methodologies suggested in [
17,
18], where loss analyses are performed by means of the HAZUS external tool, in [
19] the seismic risk and loss assessment is performed for each building belonging to the portfolio. This implies that not only does the output cost–benefit analysis generate a large amount of information, but also managing the input data could be an issue. This is the motivation behind the present work that integrates and organizes the procedure proposed in [
19] on an Italian geo-referenced platform, freely available online, allowing an interactive implementation of a decision-making assessment for the prioritization of regional seismic retrofit interventions, satisfying a financial constraint. Basically, the decision process is divided into two sections: (1) collection of building stock data to perform seismic risk assessment and calculate the risk of failure at each building of class and then (2) management and mitigation of seismic risk through prioritization of interventions and optimal budget allocation. Decision making concerns any intervention for all included buildings that may or may not be subjected to the seismic retrofit, based on the defined strategy to reduce the expected future loss. The platform is herein presented for the case study of a school building’s stock in the Campania region in south Italy, but it could be customized for any typology of building portfolio in any area. An interactive tab enables the user to select the available budget for the risk mitigation investment: as a result, the platform returns the optimal seismic retrofit strategy to be adopted for each building belonging to the portfolio under study. In addition, the evolution of territorial seismic risk in the post-retrofit environment is shown on the Campania region map, allowing a prompt comparison with respect to the initial (i.e., pre-retrofit) seismic risk. Not only budget allocation but also budget selection can be a challenging task within the DRR framework. An insight about this topic is herein provided through a sensitivity analysis about budget variation and consequent adopted retrofit strategies and achievable risk reduction.
The platform has been developed within GRISIS project-Risks and Safety Management of Infrastructures at Regional Scale. This project is based on a multidisciplinary approach to achieve a holistic analysis of both natural and anthropic risks on civil infrastructure in the Campania region in south Italy.
3. A Technological Platform to Manage Regional Seismic Risk Accounting for Available Economic Resources
To facilitate the spread of the practical use of the procedure described above for seismic risk mitigation on a territorial scale, it is crucial to have the support of a valid operational IT tool, with a simple and effective interface for the user. Within a European research project called GRISIS (Risk Management and Safety of Infrastructures at a regional scale), a technological platform has been used to assess and manage natural and anthropic risks at regional scale within a unique tool. The prototype release of such a tool focuses on the territorial area of the Campania region in southern Italy and involves seismic, hydrogeological, environmental risks as well as that associated with the potential collapse of human infrastructures like telecommunication networks.
The GRISIS backend data management combines technologies and features to integrate and make available IoT, geo-referred data, reprocessed data and products. The backend integrates data services and catalogues such as GeoServer, THREDDS Data Server and ERDDAP, which also implement system layers for machine-to-machine interoperability according to OGC standards. On top of this backend private-cloud infrastructure, a webGIS portal provides a gateway to data, metadata and data products. It provides digital maps, with panning, zooming and selecting features allowing users to view and interact with data products, with full metadata including links to retrieve further documentation and references. These features are designed to help users and providers understand the density and typology of measurements where there are data gaps, etc. The portal front end is developed in Angular using Leaflet libraries, and it is compliant to the Web Content Accessibility Guidelines 2.0 of the World Wide Web Consortium (W3C) [
28].
The homepage of the platform shows the geographic map of the territory of interest, as shown in
Figure 4. It is a dynamic map with three control/filters areas and each item (dots, lines, shape) is interactive. From the menu on the left it is possible to select the type of risk to be analyzed, allowing to contemporarily display and overlap different levels of information on the map. Legends appear on the right of the map according to the selected typology of risk.
The multi-risk platform presents a specific section implementing the decision-making tool for the management and mitigation of regional seismic risk of a portfolio of buildings. It is available online (
http://151.1.25.86/GrisisWeb/Rischio, accessed on 14 June 2021) and it collects geo-referenced information and data about buildings belonging to a specific portfolio, which can be consulted by users on practical maps. Such data correspond to the input information required to apply the framework proposed in [
19] and described in the previous section, i.e., site location, age of construction and frame geometry. Geographical coordinates of buildings are needed to get information about local seismic hazards: to simplify this step, seismic hazard gridded maps are integrated in the platform (
Figure 5), presenting the peak ground acceleration (PGA) in false colors with a grid resolution of 4 km by 4 km. Clicking on an indicator opens the data panel and shows the PGA value for the selected grid cell.
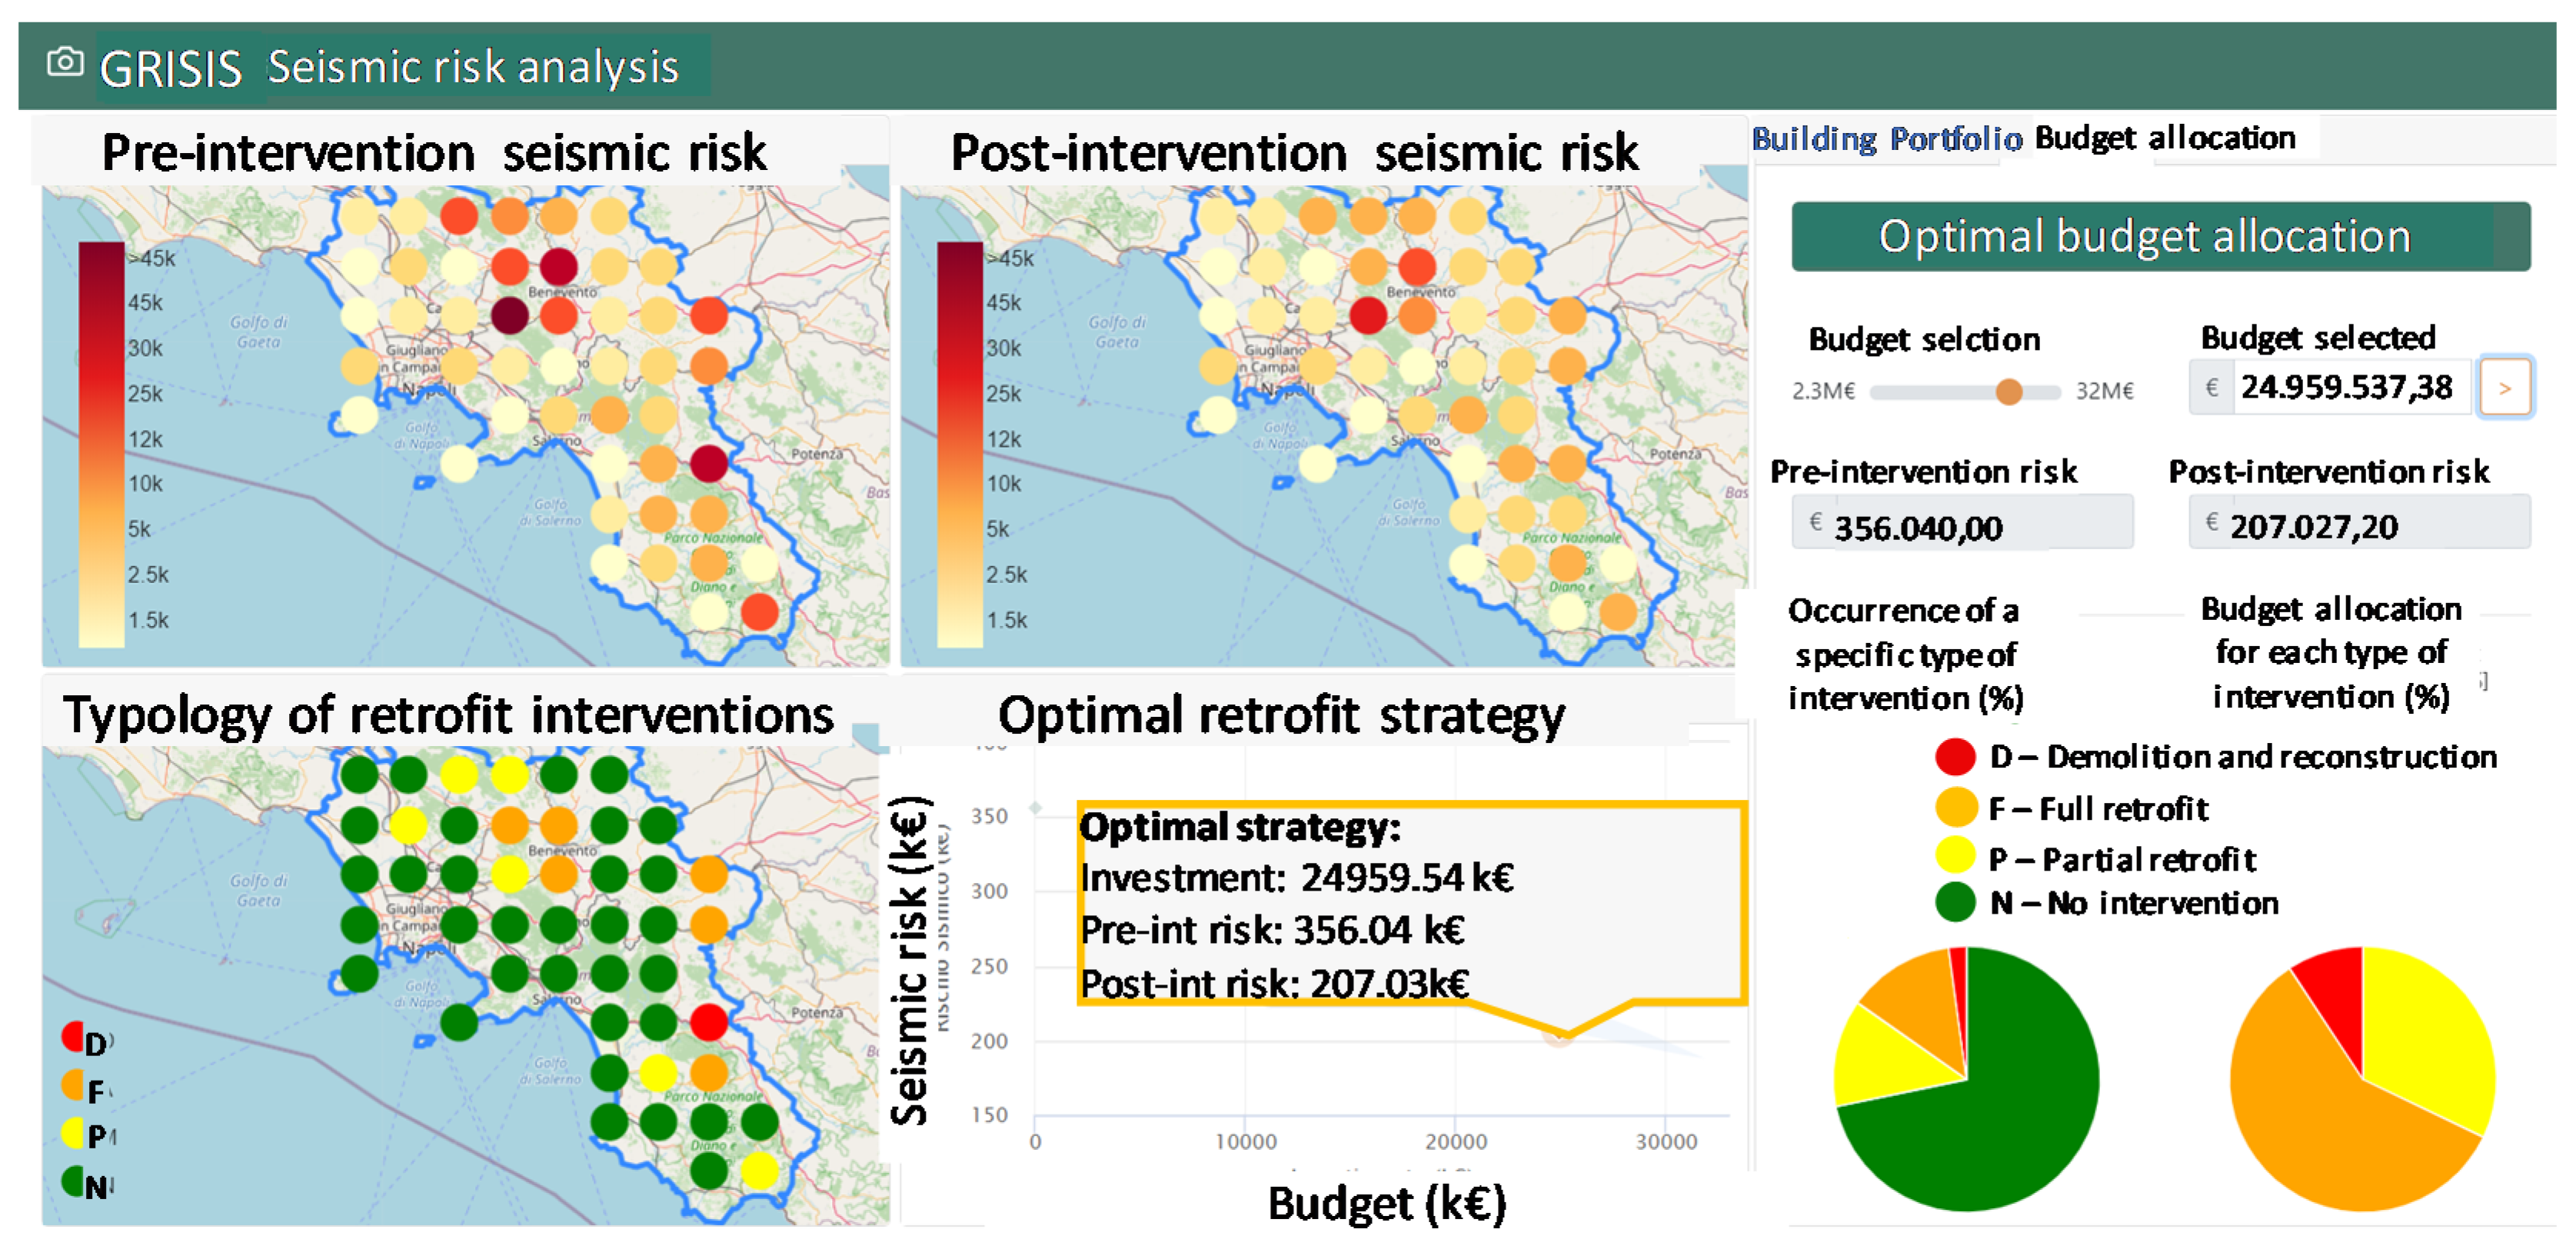
The decision-making platform is composed of a graphical section and an information portal (
Figure 6). The former includes three different maps of the area of interest that show the pre- and post-intervention seismic risk and the type of retrofit intervention for each building, respectively. In particular, each colored dot on these maps represents a building belonging to the portfolio and the interpretation of the information it provides can be read on each map by means of the relative legends. This section also includes the cloud of cost–benefit scenarios correlating to the total seismic risk and the total investment.
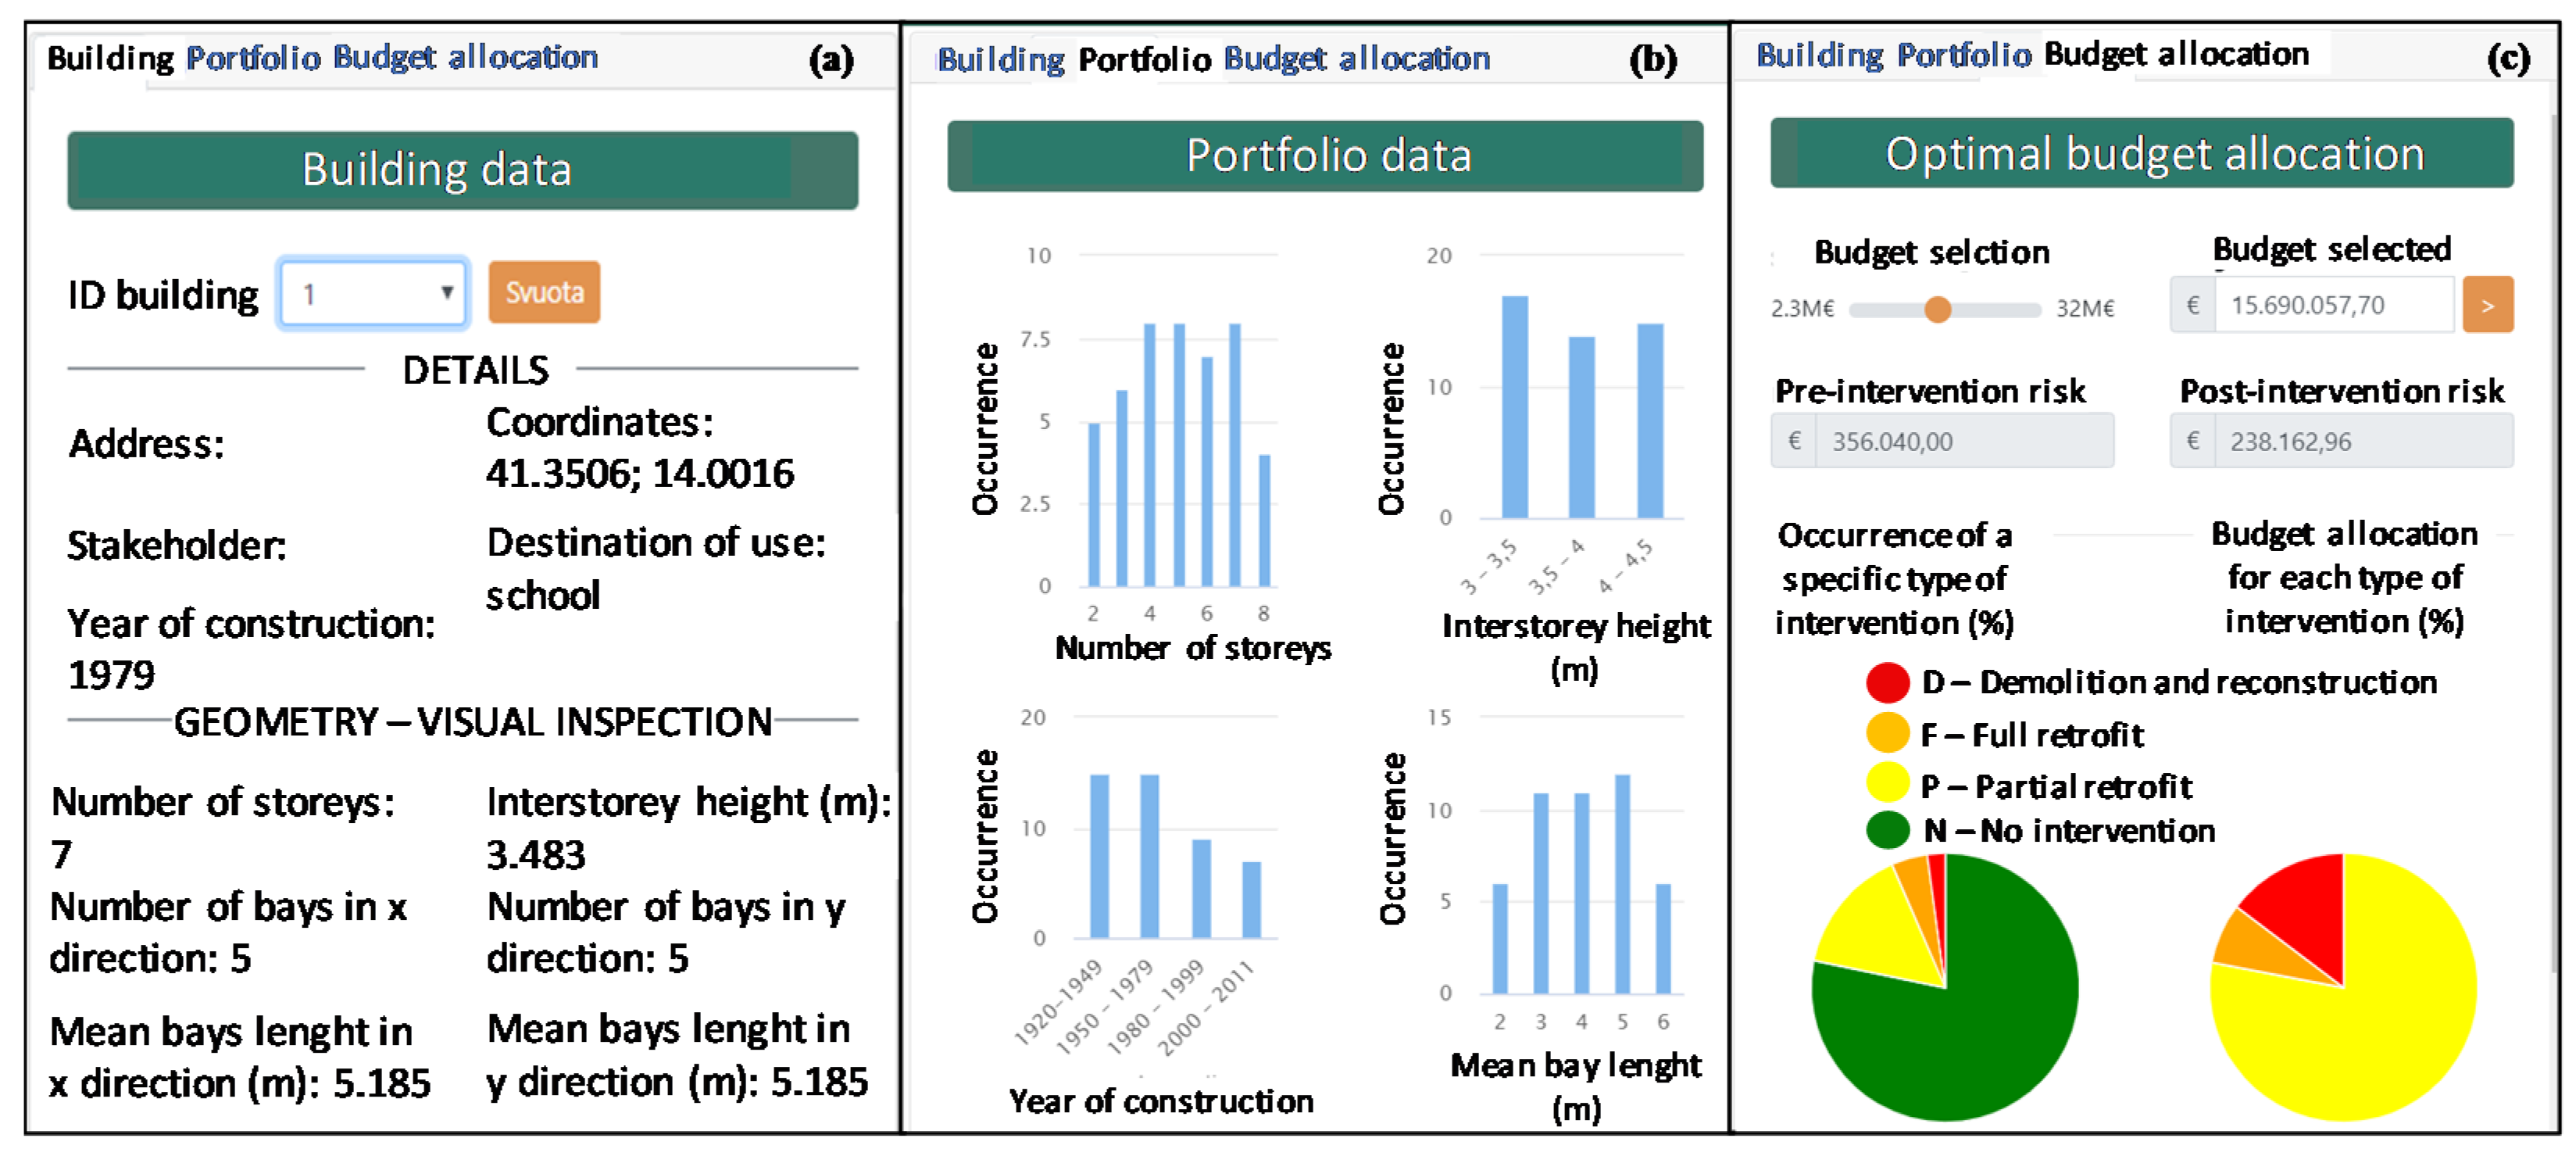
The information panel on the right side of the platform is composed of three different tabs. In the first (
Figure 7a), building data concerning its identity (address and geographical coordinates, stakeholder’s name, destination of use and year of construction) and geometry (number of storeys, interstorey height, number of bays, mean length of bay) are collected. The statistical occurrence of these date in the portfolio is shown in the second tab (
Figure 7b), thus providing the user with an overall view of the portfolio’s main characteristics. At this point, all the needed information to start the portfolio seismic risk assessment has been gathered and the framework can be applied after assuming probabilistic distributions of the 11 RVs involved. At this stage of the research, the algorithms behind the procedure have not been integrated in the platform, instead they have been elaborated through external MATLAB codes. The results of the pre-intervention seismic risk assessment are then shown on the graphical section (
Figure 6) both by a regional map, where each building is represented by a scale-colored dot corresponding to a certain extent of risk, and on the cost–benefit curve as the seismic risk corresponding to zero-cost investment (scatter point on the vertical axis). The outcomes of the post-intervention seismic risk assessment can be analyzed by the user through the third tab of the information panel (
Figure 7c), which is interactive allowing the user to insert the desired budget to be invested for the seismic risk mitigation. On the basis of this value, the system provides the optimal retrofitting strategy, updating the post-intervention seismic risk and type of intervention maps of the graphical section. The corresponding total seismic risk of the overall portfolio is indicated on the cost–benefit plot in correspondence with the user-selected budget value. Moreover, additional pie charts showing the occurrence of intervention typologies and the budget allocation in correspondence with each of them are provided in the third tab (
Figure 7c). Moving the cursor on the maps, a summary of initial and post-intervention seismic risk is shown in correspondence with a specific ID building, together with the type of intervention and the relative cost. As well as this, the optimal strategy on the cost–benefit plot is further detailed recalling the amount of the investment and the initial and post-intervention total seismic risk (see
Figure 8).
In summary, input and output data in the decision-making platform for optimal seismic risk mitigation are listed in
Table 2.
4. Example Application of the Prototype Decision-Making Platform
The prototype platform has been tested by making a first application with reference to a simulated building stock: a set of 46 RC school buildings ideally and uniformly distributed over the territory of the Campania region. Deterministic data are intended to be presumed by means of visual inspection and/or original design documentation. The variability of random parameters concerning structural details and materials is expressed through probability distributions assumed from relevant literature or by expert judgment, distinguishing two different classes of buildings according to their year of construction (namely pre or post 1972). More details can be found in [
19].
The pre-intervention seismic risk assessment and the cost–benefit seismic risk mitigation analysis were performed and the relative results provided through the web platform in a direct and graphical supported approach, thanks to the interactive user-friendly interface. The main objective and potentiality of this tool is to allocate the budget to the right place so the client should know how much they should spend on each building and what would be the best decision strategy to intervene. Hence, the final report of the decision-making process should be able to provide (i) the suggested intervention strategy for each building (demolition/reconstruction, no intervention, partial retrofitting or full retrofitting); (ii) the cost to be paid for each building according to the required retrofit option; (iii) the total cost to be invested, which must obviously be lower than the available budget; (iv) the reduced seismic risk (SRpost-int), as well as the initial risk (SRpre-int), provided to appreciate the total seismic risk mitigation achieved.
Assuming an available budget equal to EUR 2.5 × 10
7, the suggested retrofit intervention for each building, maximizing the seismic risk mitigation, is provided in
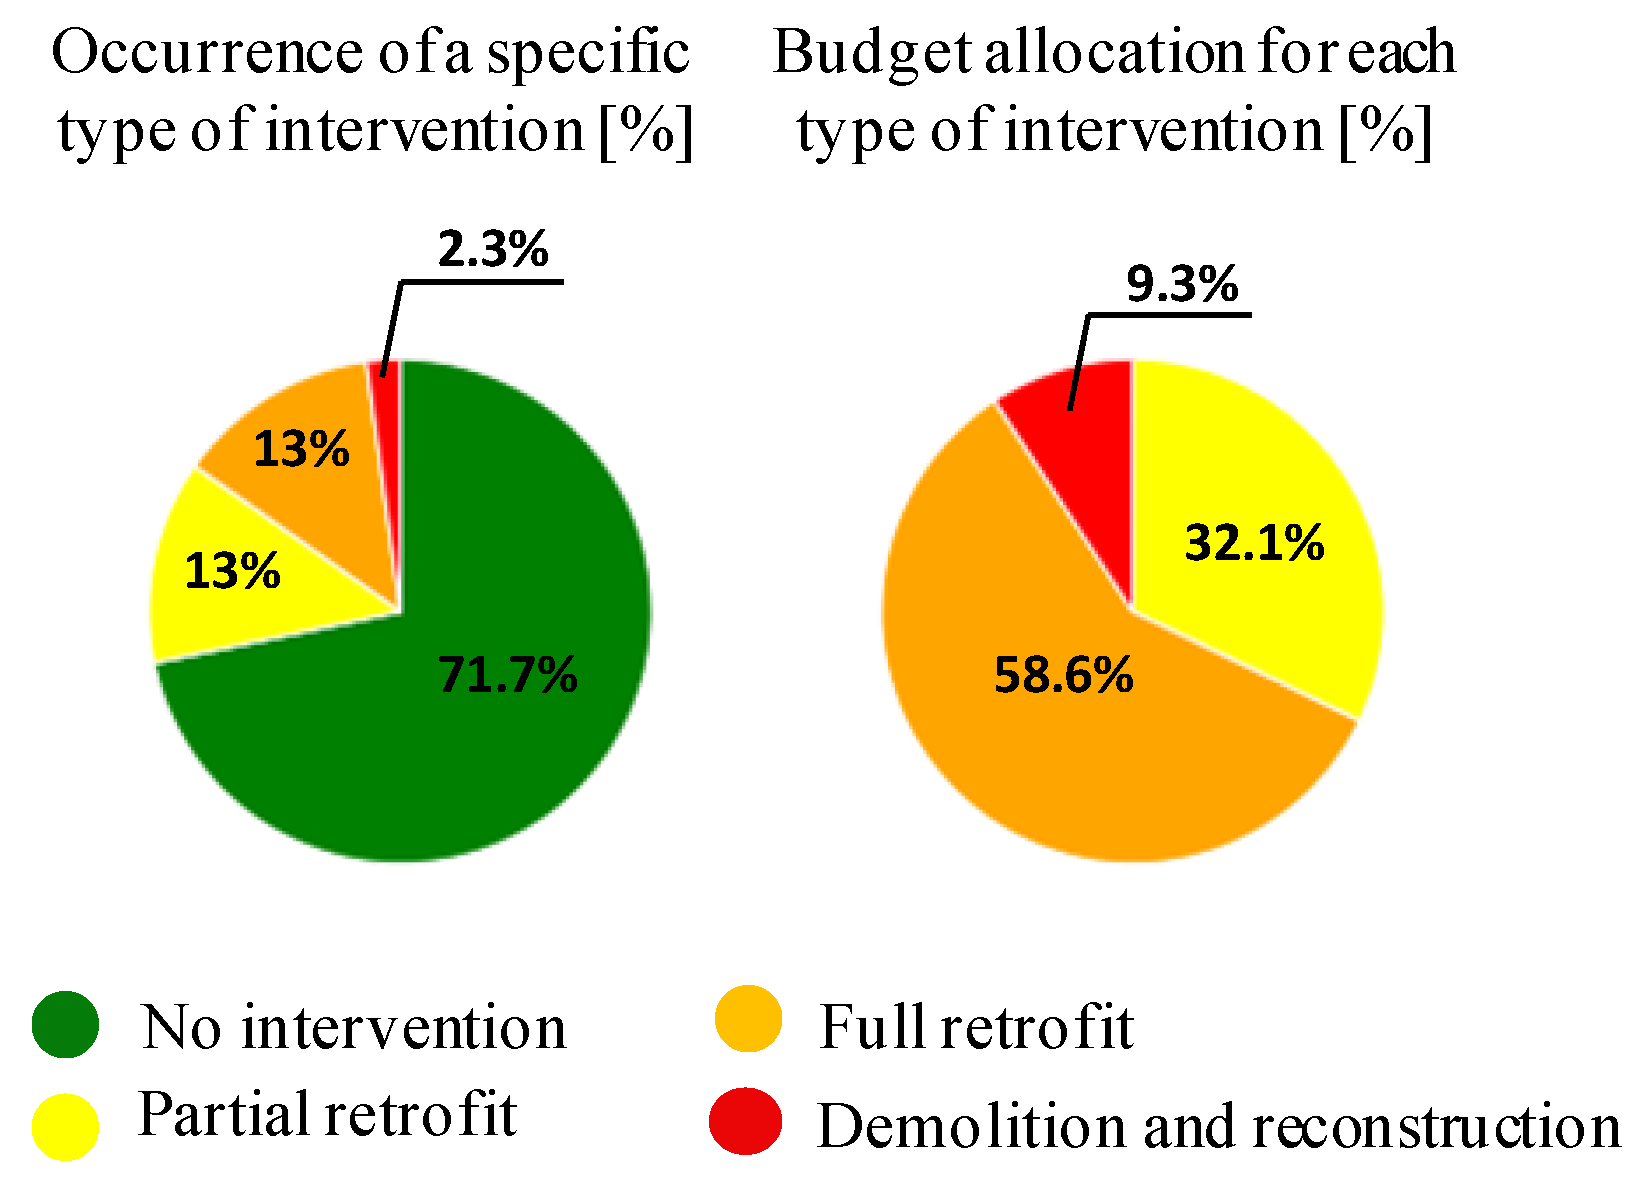
Figure 9. The seismic risk distribution on the area of interest allows for a prompt and clear summary of the most vulnerable buildings in the pre-intervention condition (top map on left side) and the achievable mitigation (top map on right side) thanks to the suggested retrofit interventions (bottom map on left side). In addition, moving the cursor on the pie charts in the bottom right side of the platform provides a picture of the distribution of interventions and corresponding budget allocation (
Figure 10). In this case, it appears that, for the available budget, 28.3% of buildings were subjected to interventions, with only one building needing to be demolished and rebuilt and an equal number of buildings (six) being partially and fully retrofitted. The biggest amount of the budget was spent in order to fully recover the six identified buildings, while half of this amount was required for the partial retrofit of the other six buildings. The rest of the budget (around 10%) was spent on the demolition and reconstruction of the most vulnerable building. The biggest part of the portfolio (almost 72%) was left as it was. This strategy allowed for the achievement of a total seismic risk reduction of 41.8%, decreasing the initial seismic risk (SR
pre-int = 356.04 k€) to the final value of SR
post-int = 207.03 k€, as provided on the cost-risk curve of the platform.
Modifying the amount of budget enables the user to analyze what the optimal use is and the corresponding extent of seismic risk mitigation. Consequently, the presented platform allows not only to support stakeholders to solve the decision-making problem of optimal budget allocation, but also to analyze several possible scenarios considering different amounts of budget. From this perspective, the platform can be used as a tool to achieve the optimal budget selection. In general, the expected trend is that the higher the available investment, the bigger the seismic risk reduction and the number of possible retrofit interventions will be. However, it could happen that within certain ranges of budget values the achievable seismic risk reduction, even if improving, does not vary significantly. This condition may be observed when the available budget is incremented to a given amount that results in it not being adequate to support further full retrofit interventions, thus limiting its use, for example, for just partial retrofitting. A specific sensitivity analysis is addressed in the next section to investigate the variability of risk reduction with the budget variation.
5. Sensitivity Analysis in Capital Budgeting for Territorial Seismic Risk Mitigation
The budget allocation for the retrofitting of portfolio RC buildings shown above was performed by assuming a hypothetical budget value. The choice of intervention for each single building is a function of the budget limit when the minimum risk of optimum solution is chosen according to the constraint. Thus, changing the budget value may change the decision of intervention. Actually, for this type of decision-making problem, the budget is assumed to be known. However, in some projects spending a partial amount of budget might be more appropriate than the whole. Hence, that would be a complementary analysis of the budget allocation to see if spending a different amount than the budget might change the final decision remarkably or not. The sensitivity analysis reported here was not made to find out which parameters had more impact on the final decision but to figure out how just one parameter (i.e., budget) could affect the final decision. The electronic platform can be of great use to achieve this goal.
The analysis was conducted by changing the budget level in different discretized values from the minimum total cost to maximum total cost value. The former corresponds to the needed cost to achieve a minimum global seismic risk mitigation. Conversely, the maximum total cost is the investment allowing to upgrade seismic capacity of all buildings up to the full satisfaction, that in this framework was set to be the achievement of a vulnerability index χ
i ≥ 0.8. Indeed, in this case, no further interventions were suggested to furtherly reduce seismic risk, matching the Italian national requirements [
21].
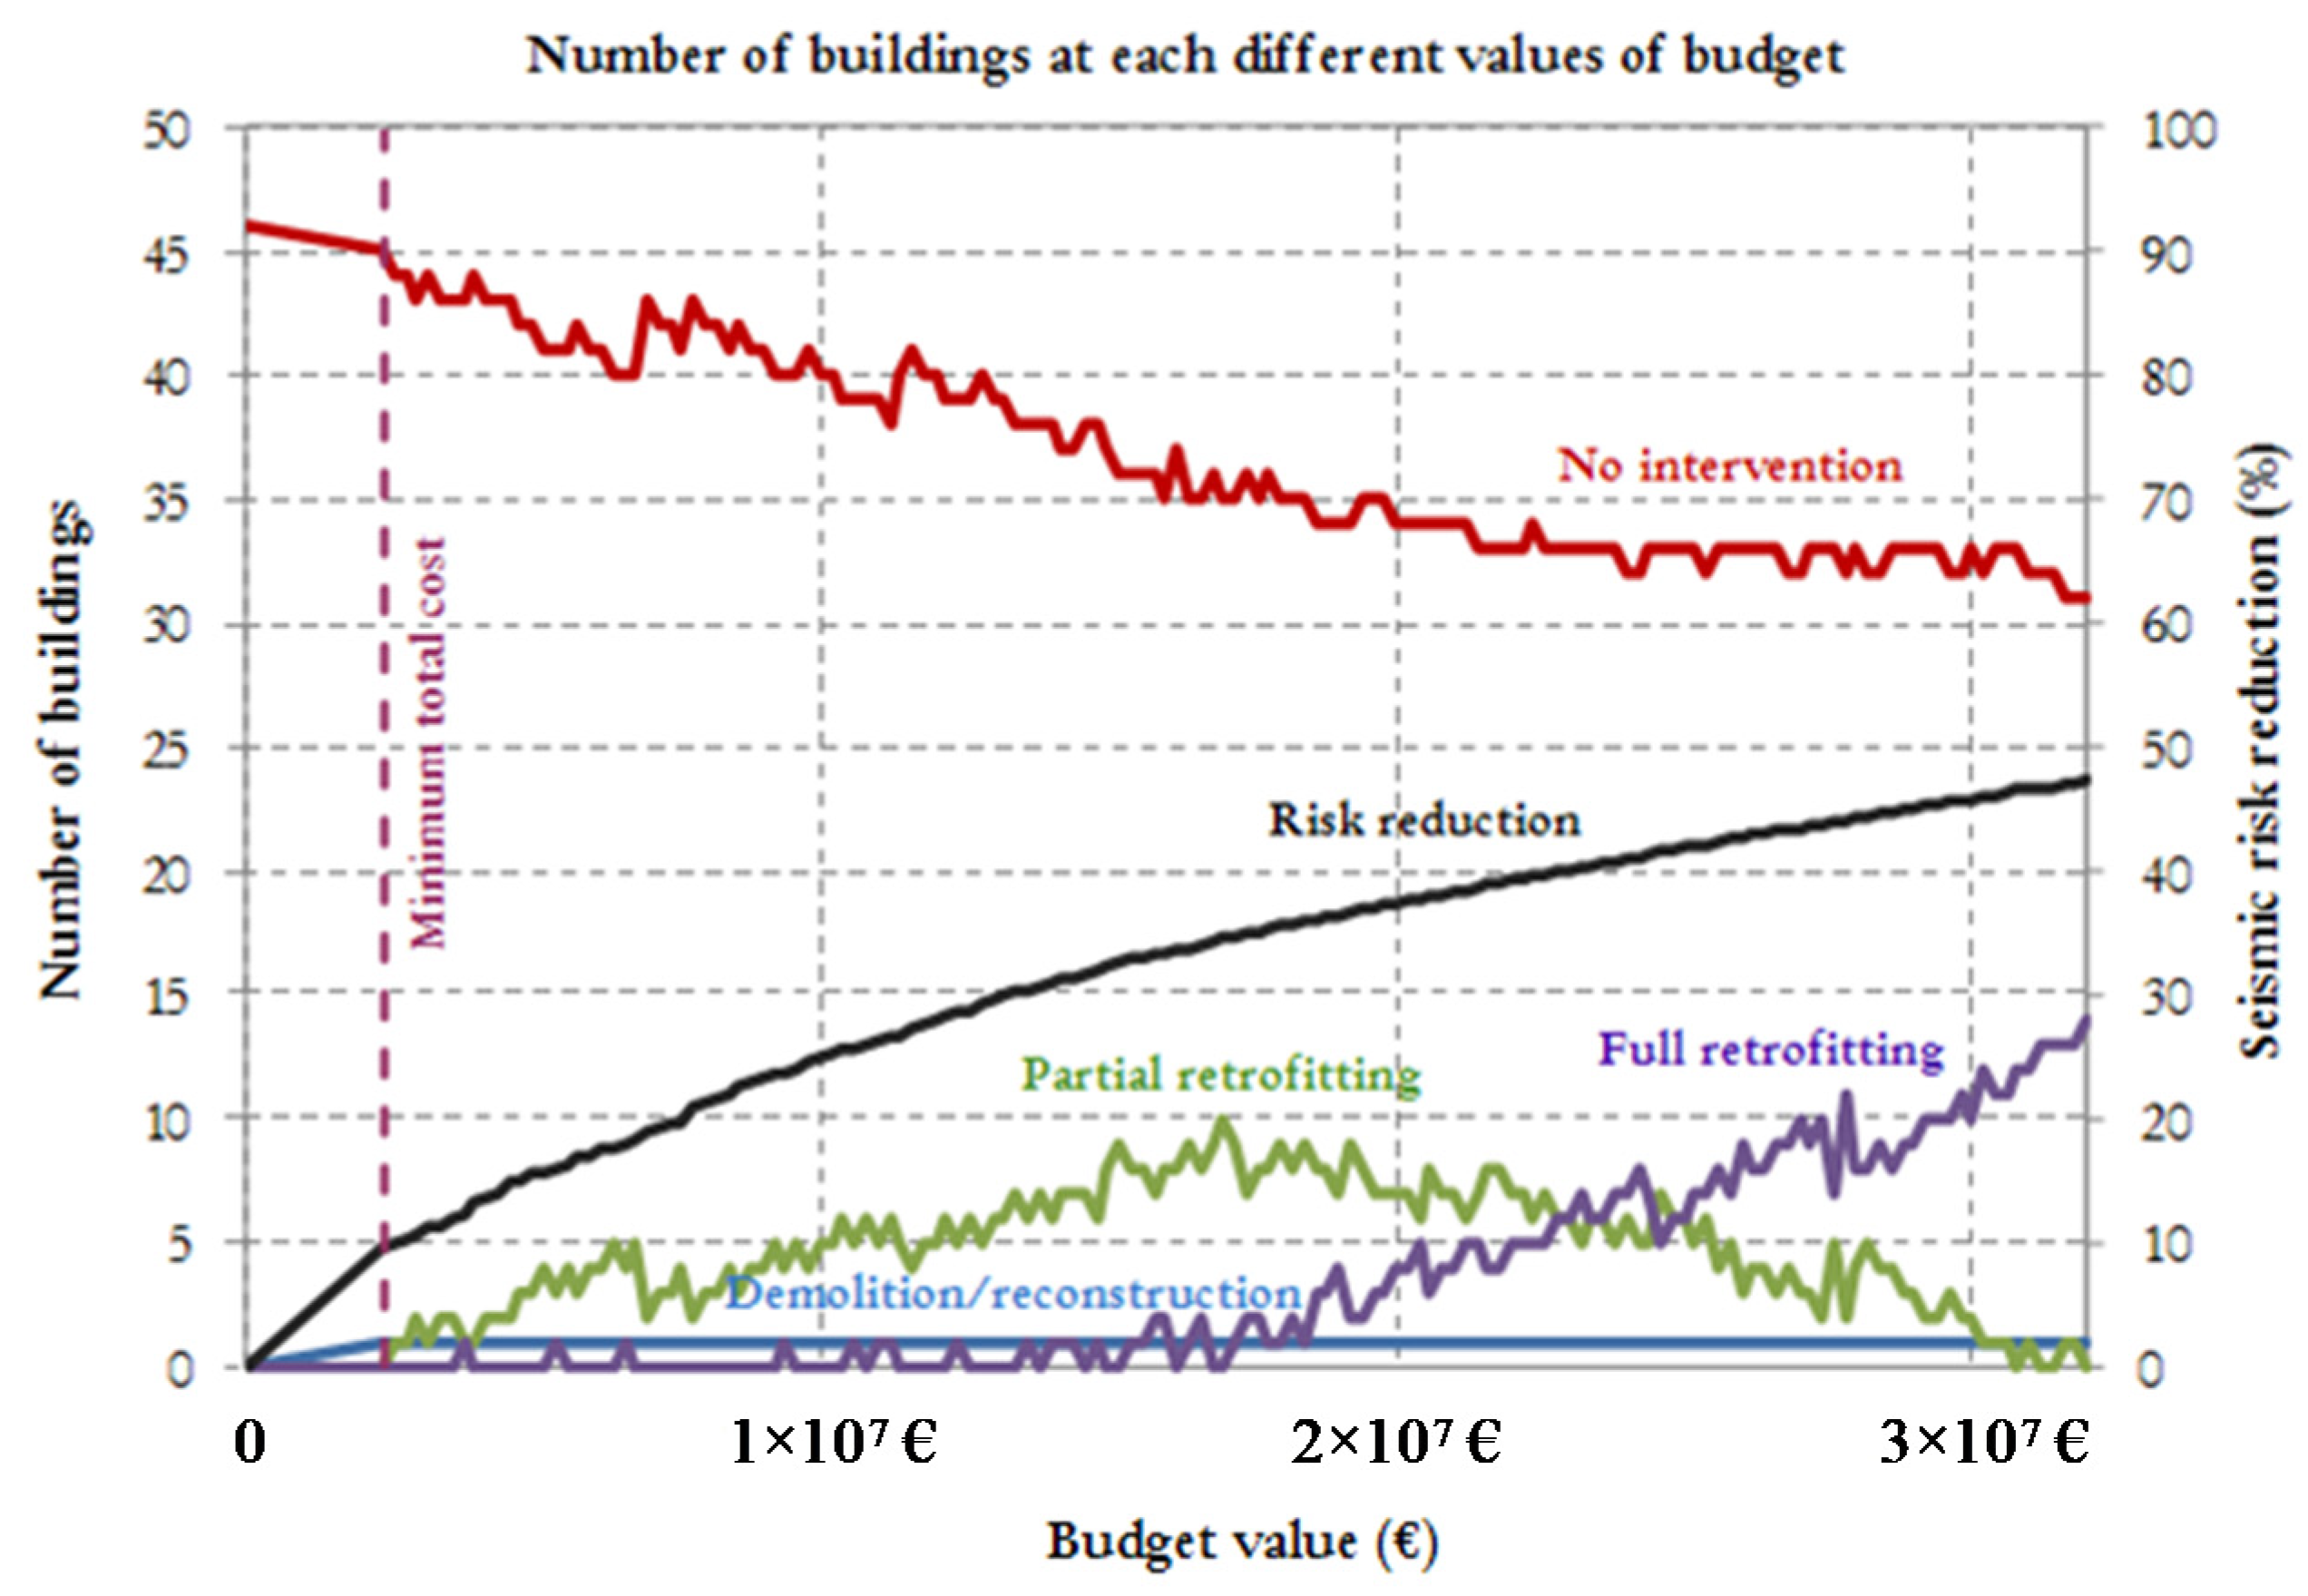
Two decision parameters were considered to observe the effect of budget variation on the final decision: (1) number of buildings involved in a decision strategy by spending any amount of budget rate and (2) total risk reduction achieved in comparison to the initial total risk level.
The effect of budget variation on the two selected decision parameters for the case study presented in the previous section is shown in
Figure 11 starting from zero budget to the maximum possible investment for the project. The variation in the number of buildings involved in each of the four decision strategies and the corresponding seismic risk reduction due to the amount of investment are depicted.
If the budget is lower than the minimum total cost, all the buildings are in the condition of no intervention. In the case of a very limited budget, at least equal to the minimum total cost, it is not possible to intervene in all the buildings. Then, retrofit actions would be the first preferred option for the most vulnerable buildings (χ ≤ 0.2), to be sorted according to the lowest vulnerability indices corresponding to the most urgent buildings for intervention. In this case study, there was only one building needing to be demolished and rebuilt with a minimum cost of EUR 2.4 million, while the other 45 buildings were left in the condition of status quo. In this scenario a seismic risk reduction of 9.56% was achieved. In correspondence with the maximum total cost, the risk reduction could achieve the maximum value of 47.2%. This limit value is influenced by the choice, made in the framework, to stop the retrofit interventions on the buildings when their vulnerability indexes achieve the value of 0.8. This means that further increases in the investment would not contribute to furtherly reduce the seismic risk, provided that the decision would always result in “no intervention”. Spending any budget amount in between the minimum and the maximum total cost allows intervention on a specific number of buildings with any of the presumed intervention strategies. The number of buildings with no interventions evidently tends to decrease as the budget increases, in favor of the number of buildings with partial or full retrofitting programs. In particular, for lower values of the budget, the number of partial retrofitted buildings is higher than the number of fully retrofitted ones, while this condition is inverted from a certain threshold (around 2.5 × 10
7 €). Indeed, the increase in budget constantly makes for an increase in full retrofitting instead of partial retrofitting solutions. In addition, there is an indented trend on both curves that is explained by the philosophy within the framework, according to which is the priority to intervene first on those buildings with the highest vulnerability. For instance, in
Figure 12a it may be observed that at a budget level of EUR 1.60 × 10
7 eight buildings are partially retrofitted (yellow tag) and two buildings fully retrofitted (orange tag), while in
Figure 12b, at the next budget level (budget = EUR 1.64 × 10
7), nine buildings are partially retrofitted and one building is chosen for full retrofitting.
Considering that an “increase in the investment should make more risk reduction” justifies the observation of a reduction in the number of fully retrofitted buildings and an increase in the number of partial retrofittings. Actually, buildings have different vulnerability indexes and decision making is made through different decision cases according to
Table 1. Given a certain budget level, it may be more convenient for risk mitigation to invest in the partial retrofit of a very vulnerable building (i.e., belonging to case 2) instead of fully retrofitting a building in a less severe condition (i.e., of case 3). Furthermore, the former intervention may be more expensive than the latter considering the lower value of the corresponding vulnerability index. Therefore, in such a scenario, the budget increase may result in a higher number of partially retrofitted buildings with respect to the fully retrofitted ones. It is interesting to observe that the fully retrofitting solution in
Figure 12b does not correspond to any of the two buildings tagged with the same retrofit intervention in
Figure 12a. This is because buildings belonging to case 2 may equally be tagged as “no intervention”, “full retrofit” or “partial retrofit”. The final type of intervention indicated by the platform on the map results is the one that minimizes the territorial seismic risk within the budget limit.
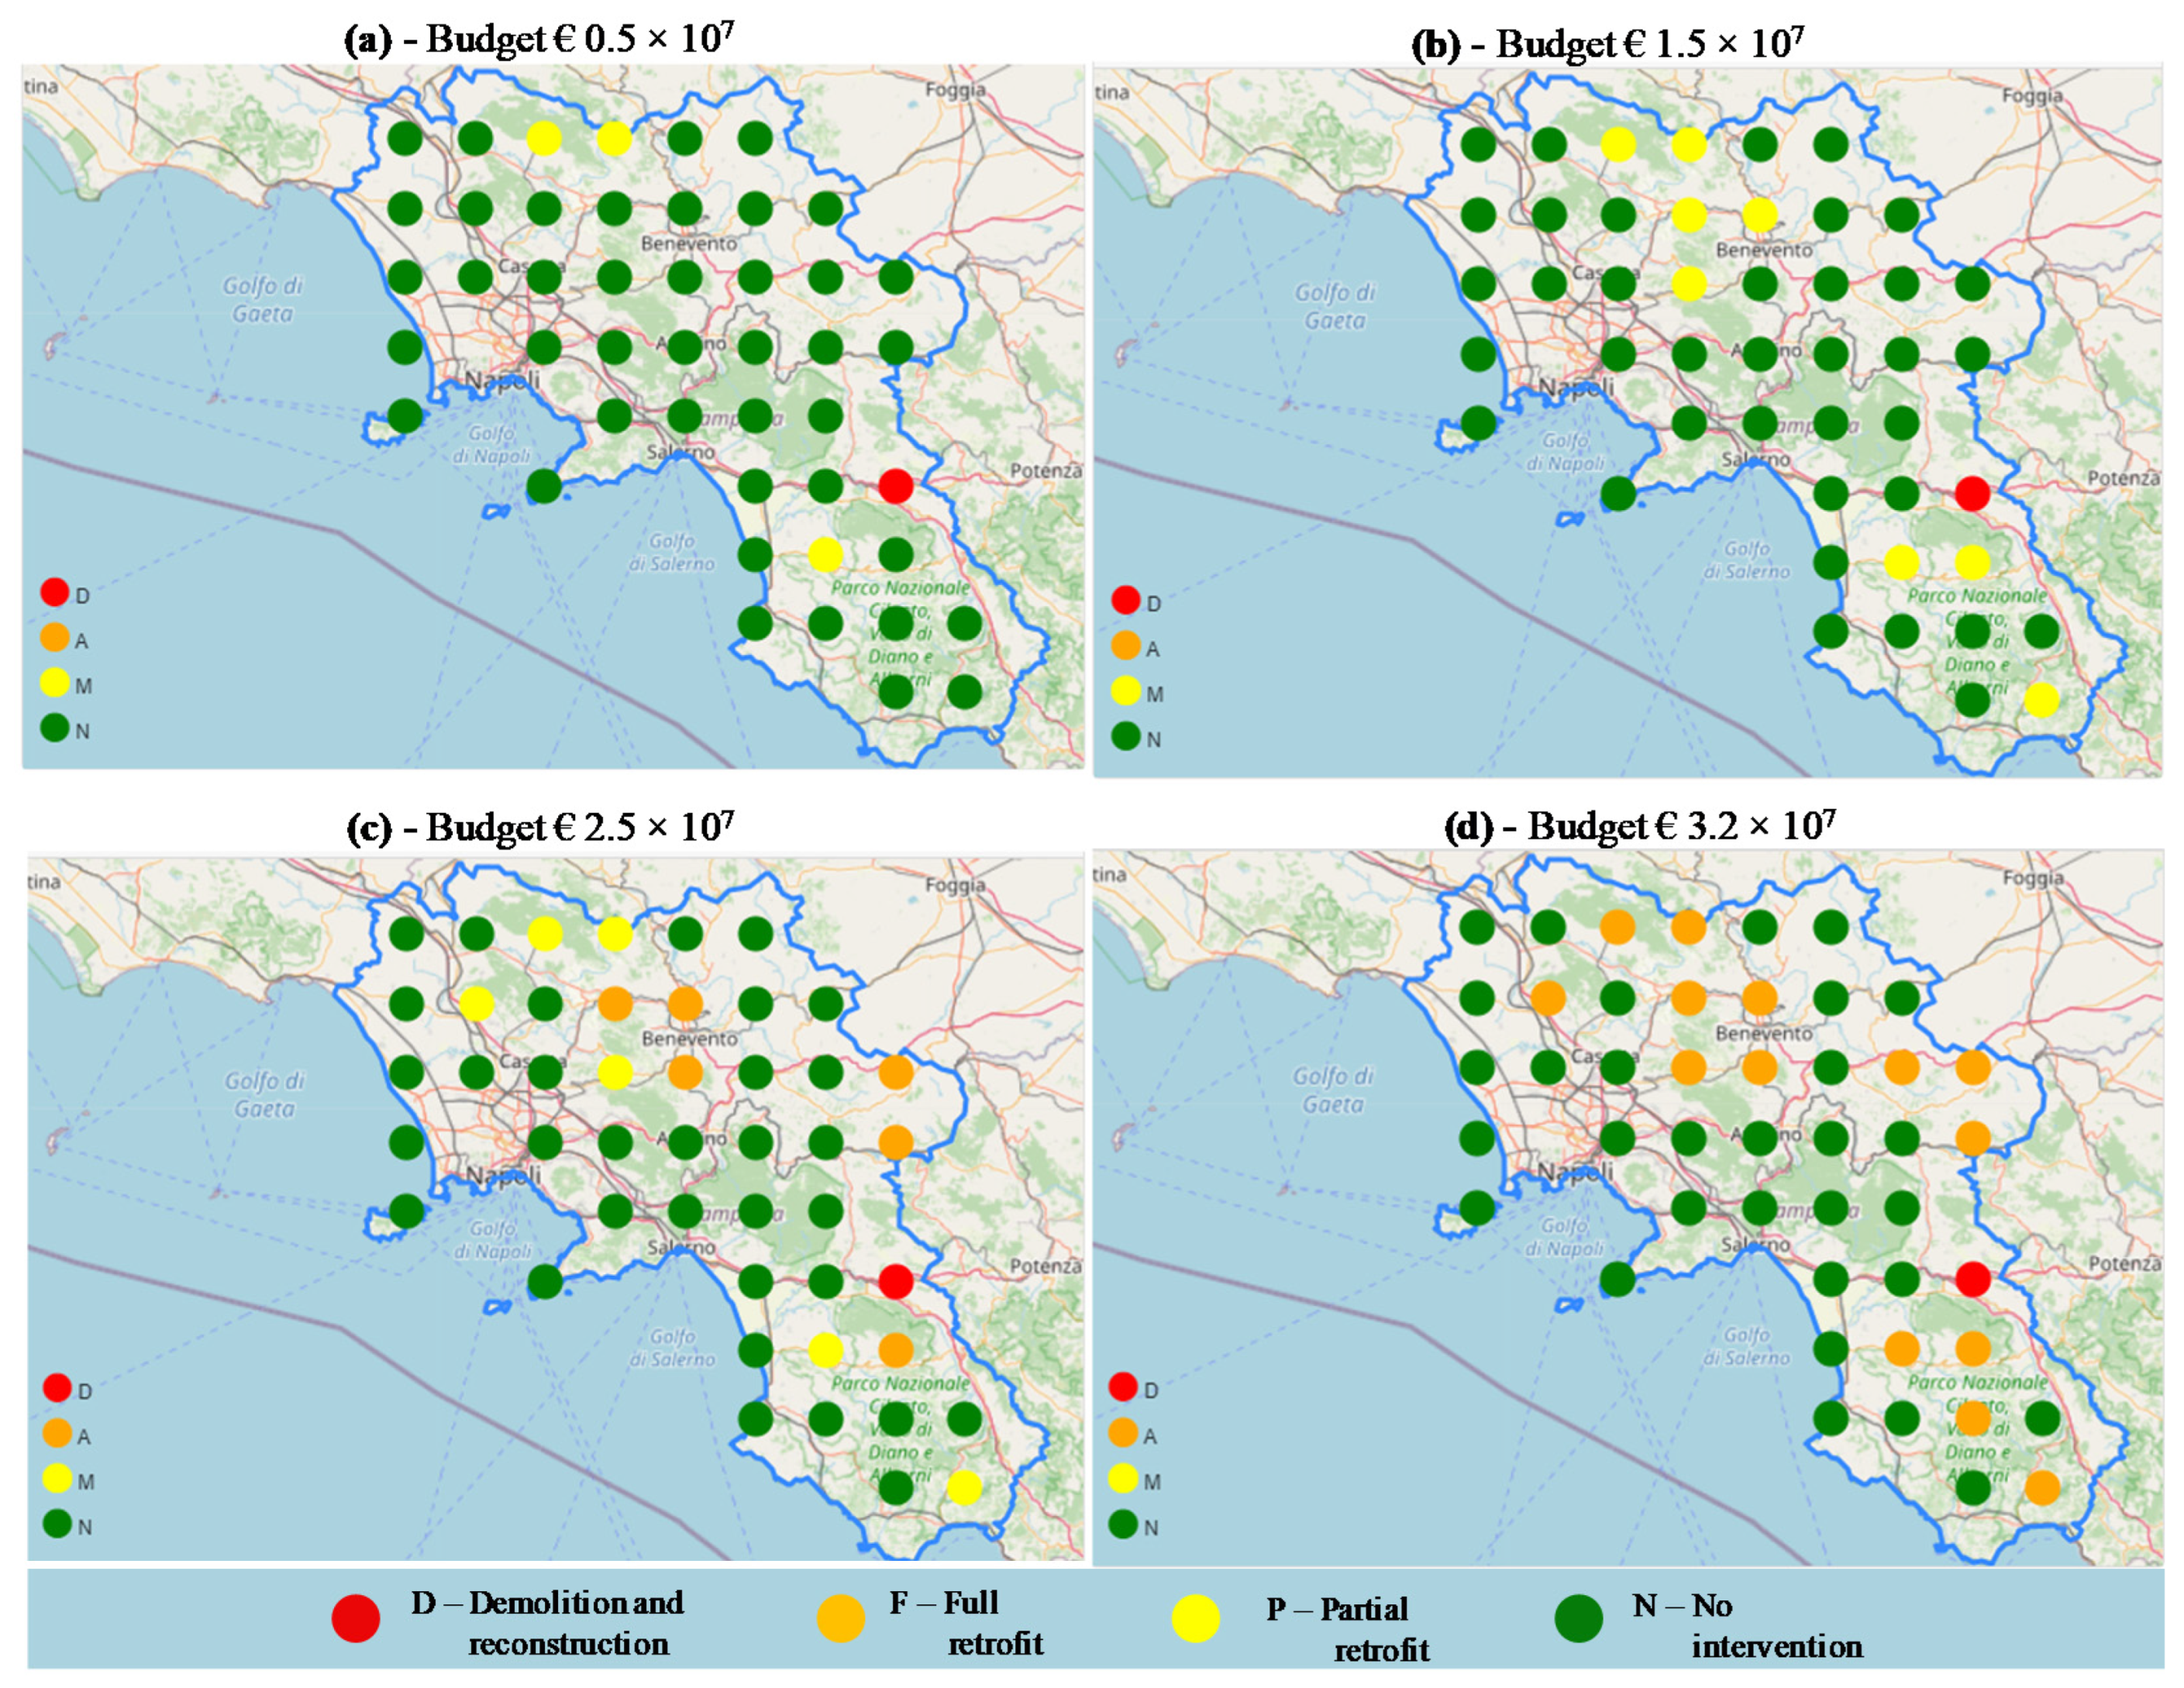
In addition, the cumulative number of buildings decided for each decision category is provided in
Figure 13, where each colored area denotes the portion of budget range allocated for those specified number of buildings. The general trend is that first the budget goes for partial retrofitting. For instance, for a budget value of EUR 0.5 × 10
7 there are three partial retrofitting solutions, one demolition and reconstruction, forty-two buildings with no interventions and no full retrofit solutions (
Figure 14a). For a budget level of EUR 1.5 × 10
7, the number of partial retrofit solutions rises to eight, while the budget is used for a full retrofit intervention for no buildings (
Figure 14b). In a different way, when the budget is further increased to the value of EUR 2. 5 × 10
7 (
Figure 14c), the number of partial retrofit interventions decreases in favor of the number of full retrofit interventions, which in this case assume the same value (i.e., six buildings in partial retrofit and six buildings in full retrofit). This trend is confirmed when the maximum budget cost is achieved, which in this case corresponds to EUR 3.2 × 10
7 (
Figure 14d). Indeed, at this level, no partial retrofit solutions are planned, while a total of 14 buildings are to be fully retrofitted. Increasing the budget level changes the type of intervention from partial to full retrofitting. From a certain budget level, more investment causes a decrease in partial and increase in full retrofitting until the maximum cost is achieved. At this point, the maximum risk has been lessened by the maximum possible full retrofitting for all buildings with χ < 0.8 (i.e., 15 buildings).
The sensitivity analysis allows for an overview of seismic risk mitigation as a function of the available budget. It enables decision-makers to highlight when it is worth increasing the investment designated to DRR or to save it for a more convenient use. As a matter of fact, analyzing the risk reduction curve of
Figure 11, it is evident that the tangent to it has a descending slope as the budget rises. This means that at low values of the budget, small increases may produce a significant increase in the risk reduction. Conversely, at higher values of the budget, there may be only small enhancements in terms of risk reduction meaning it may not be worth raising the budget at all.
6. Conclusions
In Italy, the allocation of budgets is unsystematic since no solid principle has been established. In this regard, decision makers face a challenge given that there are a large number of vulnerable buildings. This project was inspired by the idea from the aforementioned missing point in the seismic risk management of building portfolios. It attempts to develop a decision-making procedure to figure out how to distribute the budget not casually but wisely and with cogent reasoning. The study has been built on the platform of seismic risk analysis of buildings to understand how to manage budgets in order to lessen the future risk. The seismic risk is calculated in dimensions of monetary loss by combining the data of hazard, vulnerability and exposure. The algorithm for making decisions about how to reduce the seismic risk of an entire portfolio has been established by estimating the cost of retrofitting and calculating the benefit gained due to such an investment. The vulnerability index of buildings has been used to distinguish buildings that are vulnerable or not. Four intervention strategies have been assumed as possible interventions for each building: demolition/reconstruction, no intervention, partial retrofitting and full retrofitting. The best choice of intervention has been defined as that which meets both the needs and limits of the clients. From all of the combinations of interventions for each of the buildings the total cost and total seismic risk of post-intervention configuration can be calculated. The optimum selection of decision strategies is the one requiring a cost lower than the budget limit and yielding the minimum seismic risk in post-intervention. Finally, it is established how to intervene for each building and how much should be spent for each building to achieve the perceived minimum seismic risk.
A web platform system has been developed with the collaboration of ETT industrial partner within the framework of the GRISIS research project. The platform is able to provide a practical map of the seismic risk of a certain stock of RC buildings in the pre-intervention condition, particularly indicating the contribution of each building to the overall seismic risk of the portfolio. In a different section, geo-referenced data concerning a building’s identity and geometry are stored. Then, an interactive section of the web system allows the user to insert the available budget to be allocated for the seismic risk mitigation. Knowing this, the system provides the optimal strategy for the budget’s use and the corresponding post-intervention seismic risk map. In particular, the system is able to inform the user about (i) the retrofit intervention to adopt for each building of the portfolio, (ii) the post-intervention seismic risk in correspondence with each building and (iii) for the whole portfolio, (iv) the occurrence of each intervention typology in the portfolio and (v) the budget allocation for each type of intervention.
The use of the platform is shown through the applicative case study concerning the seismic risk mitigation of an RC school building portfolio distributed in the territory of the Campania region in south Italy. Supposing the availability of EUR 2.5 × 10⁷ investment for the portfolio’s seismic risk mitigation, the platform provides the best budget allocation corresponding with intervention on 28.3% of buildings. In particular, one building was to be demolished and rebuilt because it was characterized by very severe vulnerability, while 26% of buildings were equally distributed among partial and full retrofit solutions. An investment of 58.6% of the budget was spent on full retrofit interventions, while 32.1% was spent on partial retrofit buildings and 9.3% of the budget for the demolition and reconstruction. A sensitivity analysis concerning the variation of the budget value has shown that for lower values partial retrofitting is preferred with respect to full retrofit strategies. The trend is inverted when the budget rises. This observation is determined by searching for the decision that provides the biggest seismic risk reduction that can be achieved by spending the available budget in the partial retrofit of a higher number of buildings rather than in the full retrofit of fewer buildings.
The interactive web platform for seismic risk management and mitigation can be very useful to promptly know which is the optimal use of the investment, indicating the type of strategy to implement for each building of the portfolio. In addition, the ease of use enables the user to analyze the extent of risk reduction achievable for different budget levels. Therefore, the platform represents a powerful tool to accomplish two challenging tasks, namely optimal budget selection and optimal budget allocation to gain territorial seismic risk mitigation.
The algorithm for the definition of the optimal decision strategy is based on some simplifications that can be improved in future developments. The structural analysis is performed on 2D frames: the development of new simplified methods including more structural details will provide 3D analysis of buildings. Moreover, an improvement concerning the collection of building data will be provided thanks to the results achieved by the authors in relation to another research project (ARES) concerning the development of a platform gathering structural data and information on the state of maintenance in school buildings in the Campania region. This platform may be linked to communicate with the seismic risk mitigation platform proposed in this work in order to allow a prompt collection of the deterministic data needed to implement the framework. The final aim is to provide the public administrator with a practical, reliable and effective tool supporting decision-making for the management of territorial seismic risk mitigation.


