Article

Online Critical Unit Detection and Power System Security Control: An Instance-Level Feature Importance Analysis Approach

1
State Key Laboratory of Advanced Electromagnetic Engineering and Technology, Huazhong University of Science and Technology, Wuhan 430074, China
2
Guangzhou Power Supply Bureau, China Southern Power Grid Company Limited, Guangzhou 510000, China
*
Author to whom correspondence should be addressed.
Appl. Sci. 2021, 11(12), 5460; https://doi.org/10.3390/app11125460
Submission received: 21 May 2021 / Revised: 1 June 2021 / Accepted: 10 June 2021 / Published: 12 June 2021
(This article belongs to the Special Issue Artificial Intelligence for Power System Applications)

Abstract

:
Rapid and accurate detection of critical units is crucial for the security control of power systems, ensuring reliable and continuous operation. Inspired by the advantages of data-driven techniques, this paper proposes an integrated deep learning framework of dynamic security assessment, critical unit detection, and security control. In the proposed framework, a black-box deep learning model is utilized to evaluate the dynamic security of power systems. Then, the predictions of the model for specific operating conditions are interpreted by instance-level feature importance analysis. Furthermore, the critical units are detected by reasonable local interpretation, and the security control scheme is extracted with a sequential adjustment strategy according to the results of interpretation. The numerical simulations on the CEPRI36 benchmark system and the IEEE 118-bus system verified that our proposed framework is fast and accurate for specific operating conditions and, thereby, is a viable approach for online security control of power systems.

1. Introduction

As one of the most complex artificial systems, the power system is operated to maintain the security and stability of the power generation, transmission, and distribution process [1]. However, the power system would inevitably suffer from various natural or human-made disturbances and faults, which may cause a loss of system synchronism and even large-scale blackout. Rapid dynamic security assessment (DSA) and accurate security control (SC) are necessary to protect the power system from dynamic insecurity.
Traditional approaches of DSA include time-domain simulation (TDS) methods [2,3,4] and direct methods [5]. TDS methods rely on iteratively solving high-dimensional differential-algebraic equations. Such a high computational burden makes it unsuitable for real-time applications. Parallel computation techniques [6,7] and stopping strategies [8] are applied to TDS to reduce its time consumption. Based on the Lyapunov stability theory, direct methods are fast but challenging to construct the energy function for large-scale power systems.
In comparison, data-driven machine learning methods provide better performance with faster assessment and more robust generalization, which are considered promising approaches for the real-time DSA [9]. Some machine learning models have been successfully applied to DSA, such as decision trees [10], support vector machine [11], artificial neural network [12], convolutional neural network [13,14,15], stacked auto-encoder [16], generative adversarial network [17], and deep belief network [18].
In general, deep learning (DL) networks can dig out the potential physical information of power systems more profoundly and provide higher prediction accuracy [19]. However, DL is a black box with a certain opacity, which often causes suspicion from system operators and makes such a technique not fully trusted by the industry [20]. In this context, opening the black box by explaining the DL models and their predictions is an indispensable part of DL research, and thus it has become an increasingly hot topic in the industry [21,22,23,24].
Feature importance analysis (FIA), as one of the interpretation approaches for machine learning models, is an available tool for critical feature detection. The traditional FIA is based on the impurity in random forests (RFs) [25]. The impurity is referred to the reduction in a specific criterion brought by a particular feature and is regarded as the feature importance. In addition, Pan, G. et al. proposed a visual feature importance (ViFI) method to visualize the importance of input features of deep neural network by observing the change of weights when training [26]. The above approaches presented a comprehensive influence of features on the model prediction for all samples, called model-level FIA (M-FIA).
However, in DSA and SC of power systems, decision makers usually pay more attention to those real-time insecure operating conditions (OCs). Therefore, it is necessary to develop an instance-level FIA (I-FIA) approach to detect the critical units for specific OCs and further to control the power system security.
Another exciting issue discussed in this paper is the SC. Traditionally, the SC problem is mathematically modeled as the solution of security constraint optimal power flow (SCOPF) and is tackled with mathematical programming [27,28,29] or swarm intelligence optimization [30,31,32,33]. Such methods are treated as global approaches. However, due to the high time complexity of TDS, the excessively long processing times and the large memory space requirement are significant problems in the global approaches. Therefore, it is necessary to develop a faster SC strategy using sequential processing.
The main contributions of this paper are as follows.
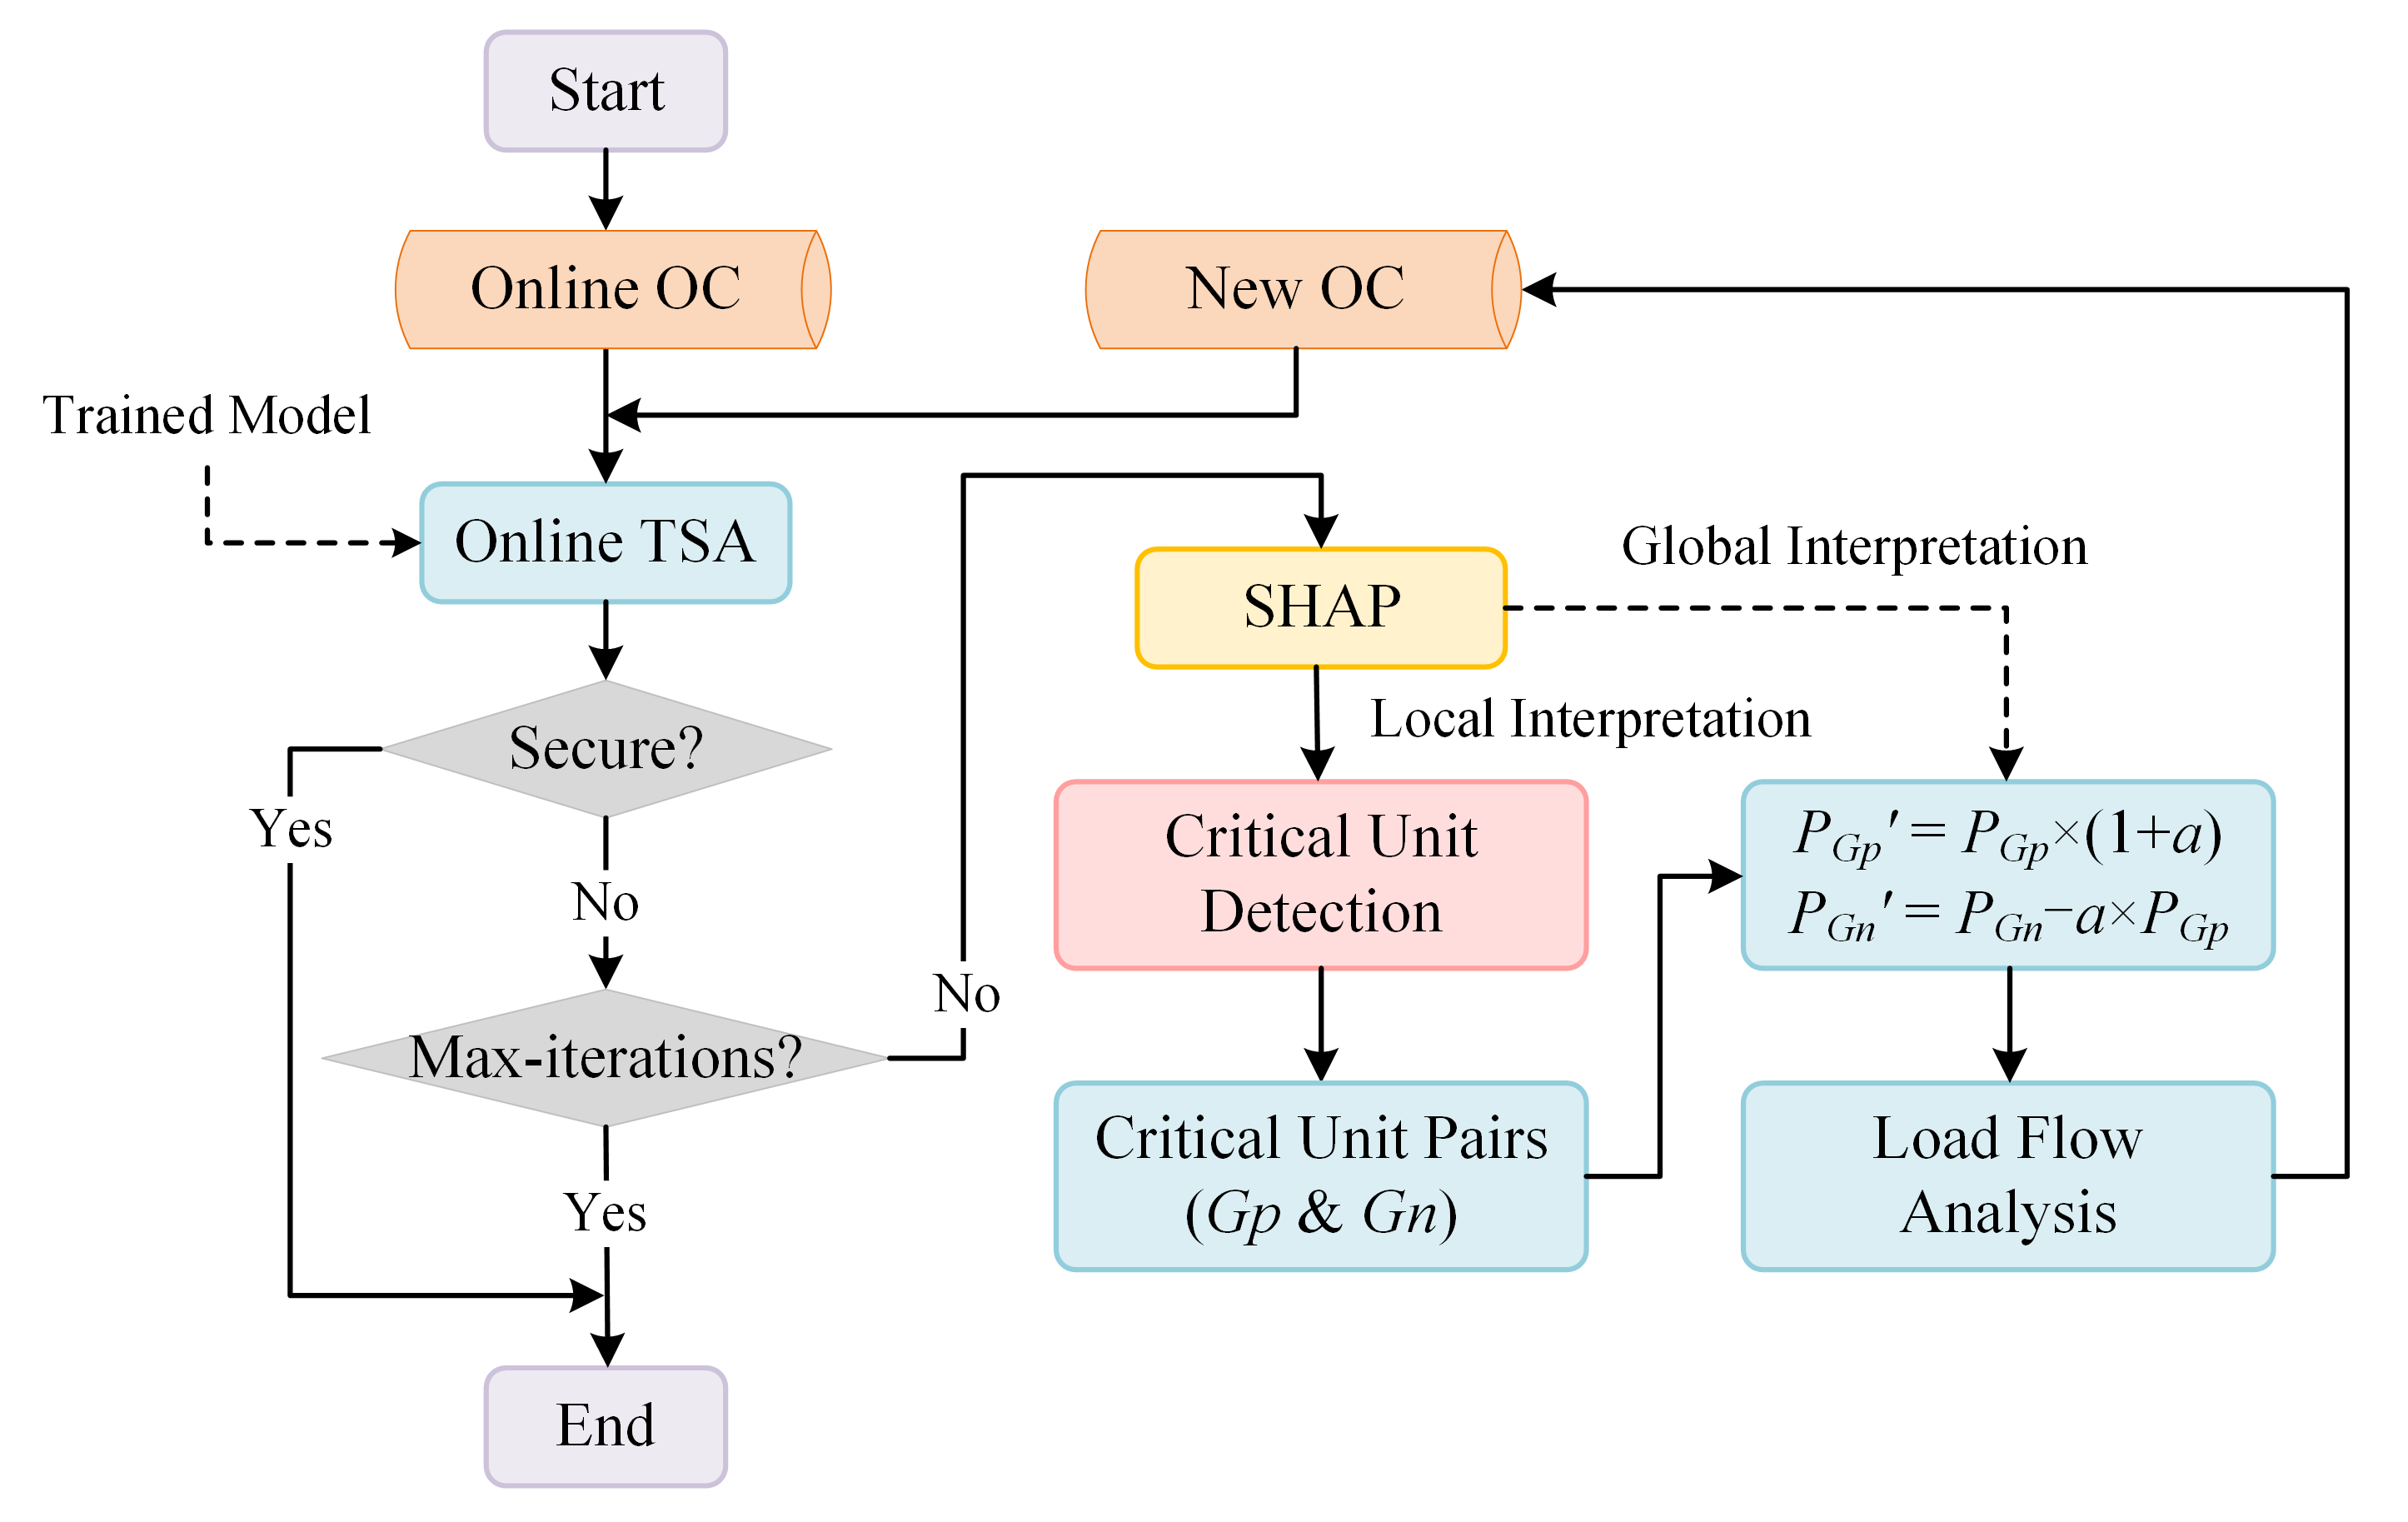
  • An efficient DL framework integrated with DSA, critical unit detection, and security control is proposed, achieving rapid security assessment and recovery.
  • An accurate detection method of critical units in power systems for specific OCs utilizing instance-based Shapley additive explanations (SHAP) is proposed. Compared with traditional FIAs, the proposed method more accurately reveals how each feature influences DSA-DL models in a specific OC.
  • A fast generation strategy of SC schemes based on the interpretation results is proposed, successfully maintaining the security of large-scale power systems.
The remaining sections of this paper are organized as follows. The details of SHAP and the proposed I-FIA framework for DSA-DL models are explained in Section 2. The results of DSA, model interpretation, and security control for the CEPRI36 benchmark system and the IEEE 118-bus system are presented in Section 3. Finally, Section 4 summarizes the conclusions drawn from this research.

2. Developed Methodology

2.1. SHAP

SHAP is an instance-based interpretation method of visualizing and explaining black-box classification or regression models using a game-theoretic solution, Shapley value ( φ ). The Shapley value is defined as the feature importance in specific instances. The Shapley value of the i-th feature for a specific sample x is calculated as (1) and (2) [34,35].
φ i ( x ) = 1 n ! O π ( n ) ( Δ ( P r i ( O ) { i } ) ( x ) Δ ( P r i ( O ) ) ( x ) )
Δ ( Q ) ( x ) = y Y p ( y ) ( f ( τ ( x , y , Q ) ) f ( y ) )
In the above formulas, assuming that A represents the original feature space, Y is a background data set extracted from A at random or by clustering algorithms. In this paper, the classical clustering algorithm, k-means (Algorithm 1), is embedded into SHAP to reduce the background data set. Q is a certain subset of features in a given instance x, and Δ ( Q ) ( x ) represents its influence. f is the function of predicting the probability of a category in the basic classifier. p is the probability of a given sample y Y . τ ( x , y , W ) = ( z 1 , z 2 , , z n ) , where z i = x i iff i W and z i = y i , otherwise. π ( n ) represents the set of all permutations of n elements, and P r i ( O ) represents the set of all features which precede the i-th feature in permutation O . Further, the SHAP interpretation results are obtained by using Algorithm 2. Assuming that the prediction time of the basic model is T ( f ( x ) ) , the time complexity of the algorithm is O ( K · n · T ( f ( x ) ) ) .
Algorithm 1 k-means algorithm.
Input: dataset x = { x 1 , x 2 , , x n } , K
Output: c = { c 1 , c 2 , , c K }
  • c select K samples from x at random
  • while the termination conditions are not satisfied do
  •   for k 1 to K do
  •     C k { }
  •    for i 1 to n do
  •      j arg min j d ( x i , c k )
  •      C j C j x n
  •    end for
  •   end for
  •   for k 1 to K do
  •     c k 1 | C k | x C k x
  •   end for
  • end while
  • return c
Algorithm 2 SHAP algorithm.
Require: 
f: a regression function; x: a given instance; K: the number of background data; A : a dataset representing feature space.
Ensure: 
φ : Shapley values of features.
1:
Y K-means( A , K) or Random( A , K)
2:
for i = 0 to n do
3:
φ i ( x ) 0
4:
for k = 0 to K do
5:
  select a permutation O π ( n ) randomly
6:
   y Y k
7:
   x 1 { A 1 , , A i  from x in  O }∪{ A i + 1 , , A n  from y in  O }
8:
   x 2 { A 1 , , A i 1  from x in  O }∪{ A i , , A n  from y in  O }
9:
   φ i ( x ) φ i ( x ) + f ( x 1 ) f ( x 2 )
10:
end for
11:
φ i ( x ) φ i ( x ) K
12:
end for
The Shapley values of features have a welcome nature of implicit normalization as (3), where f b a s e is the average prediction of all background samples. Thus, the interpretation results can explain how the machine learning model’s output is pushed from the base value to the final prediction by each feature’s influence.
f ( x ) = f b a s e + i n φ i ( x )

2.2. Instance-Level Feature Importance Analysis for DSA-DL Model

The proposed method of overall I-FIA for the DSA-DL model consists of four stages, namely DSA Database establishment, DSA-DL model construction, online DSA, and instance-level feature importance analysis. The overall flowchart of the proposed method is shown in Figure 1.

2.2.1. DSA Database Establishment

A database of OCs for DSA mainly consists of historical data, real-time data, and planning data. The diversity of OCs can be enhanced by a stochastic variation of load demands and generation schedules. Upon each OC, the pre-defined credible contingencies are simulated by TDS. The post-disturbance dynamic security is evaluated using specific security criteria, e.g., transient stability, voltage stability, and frequency stability. Some variables that can reflect the system dynamics are chosen to construct the input features of DSA, including the active and reactive power of generators (G), AC line branches ( A C ) and loads (L), as well as the magnitude and phase of bus voltage ( P G , Q G , P A C , Q A C , P L , Q L , V m B u s , V a B u s ). With the variables and the DSA results of OCs to be the input features and labels of models, samples are saved to form the DSA database.

2.2.2. DSA-DL Model Construction

A dataset for modeling, extracted from the generated DSA database, is pre-processed by normalization and feature dimension reduction, successively, followed by being divided into a training dataset and a testing dataset. A DL model is trained by the training dataset, and the performance test is carried out to ensure that the model is suitable for online applications.

2.2.3. Online DSA

DSA can be completed by DL in real-time. The trained model is used in the online stage for real-time dynamic security detection of the power system. As mentioned before, the most exciting predictions are those insecure results, which need further analysis and adjustment. Once the insecurity is detected, the alarm should be triggered. Then, the optimal control strategy should be implemented to return the OC back into the secure operating region as soon as possible.

2.2.4. Instance-Level Feature Importance Analysis

For the insecure OC/instance, SHAP is utilized to obtain the top influential variables on the prediction of the DSA-DL model by calculating the FIA on the specific instance, which is called local interpretation. The units corresponding to the top influential variables are recognized as the critical units in the power system under the current OC. Besides, through the global interpretation of multiple typical OCs/instances, the qualitative relationship of the importance and value of features is explicitly demonstrated, further providing a strategy of control direction of units for SC. Based on the strategy, SC can finally be achieved through step-by-step adjustment.
The flow chart of online SC is illustrated as Figure 2. The online OC is detected in real-time by online TSA using the offline-trained model. Once the OC is determined to be insecure, SC is activated. SC is conducted in a limited number of iterations. Local interpretation by SHAP is applied to the critical unit detection. In SC, the balance of power generation or adjustment must be considered. Therefore, critical unit pairs are determined, in which the positive critical unit (Gp) has the most influence on the secure prediction, while the negative critical unit (Gn) has the most significant impact on the insecure prediction. Global interpretation globally analyzes the importance of features and the correlation between features and predictions, thus adjunctively judging the directional correctness of SC. Then, the adjustment amount for critical unit pairs is calculated according to a given adjustment rate (a). After that, the load flow of the system is analyzed to check the static security and output a new OC. Then, online TSA will be executed again until the secure SC is determined or the maximum number of iterations is reached.

3. Results and Discussion

The proposed method is first tested on the CEPRI36 benchmark system in Power System Analysis Synthesis Program (PSASP). The single line diagram of the CEPRI36 system is given in Figure 3. Unless otherwise specified, the unit of power in the numerical test is p.u. The reference value of system power is 100 MVA. The power flow and the time-domain simulation are computed in PSASP. Model construction and interpretation are implemented in Python. Multi-layer perceptron (MLP) is selected as the DL model for testing. Rotor angle-based transient stability assessment (TSA) is taken as an example of DSA. Note that other stability assessments and deep learning models in power systems are also suitable for our method. The numerical test is done on a computer with an Inter(R) Core(TM) i7-10700F CPU and 16.0 GB RAM.

3.1. Transient Stability Assessment

The security condition of the OCs is labeled with a heuristic transient stability criterion based on the angle coherency. When the difference between rotor angles of any two generators is greater than a heuristic threshold during the post-disturbance period, the sample is labeled “unstable”. Otherwise, the sample is labeled “stable”. The threshold is usually set to π [13] or 2 π [18]. The latter is used in this paper.
Three-phase to ground fault on A C 29 connecting Bus 19 and Bus 30 is set as one of the pre-defined faults and is taken as an example to be tested. Sufficient OCs are collected considering the variation of the power system. According to the feature selection stated in the previous section, 120-dimension features are collected to the knowledge base. The perceptron structure of the MLP model is set as [500-100-50-10] empirically. The total number of data points is 4415, 2640 of which are stable, and the rest are unstable. Eighty percent of the data are selected randomly for model training, and the rest are used for testing. The adaptive strategy is adopted in the learning process. The initial learning rate is 0.001. Each time two consecutive epochs fail to decrease training loss by at least 0.0001, the current learning rate is divided by 5. In the experiment, the training time of the model is 9.312 s, while the prediction time is within several milliseconds. The accuracy rate is 98.1%, the false-positive rate is 3.1%, and the false-negative rate is 1.13%. The model has a fast prediction speed, high accuracy rate, low false-negative rate, and low false-positive rate. Thus, the model is suitable for real-time TSA.

3.2. Instance-Level Feature Importance Analysis

In this section, the traditional M-FIA method is first discussed. An RF model is constructed with 100 trees and trained by adopting a warm-start to speed up the training. The accuracy of the trained RF is 96.0%. Figure 4 illustrates the results of impurity-based M-FIA from RF. The calculation time of M-FIA is 0.019 s. In the M-FIA, Q A C 42 , Q A C 27 , P A C 29 are at the top. The information of which feature contributes the most to the model prediction is given. However, this is just an overall analysis, rather than focusing on a specific instance or OC. Compared with the traditional method, our proposed I-FIA for DSA by SHAP has higher practical value. The detailed analysis is divided into local interpretation and global interpretation.

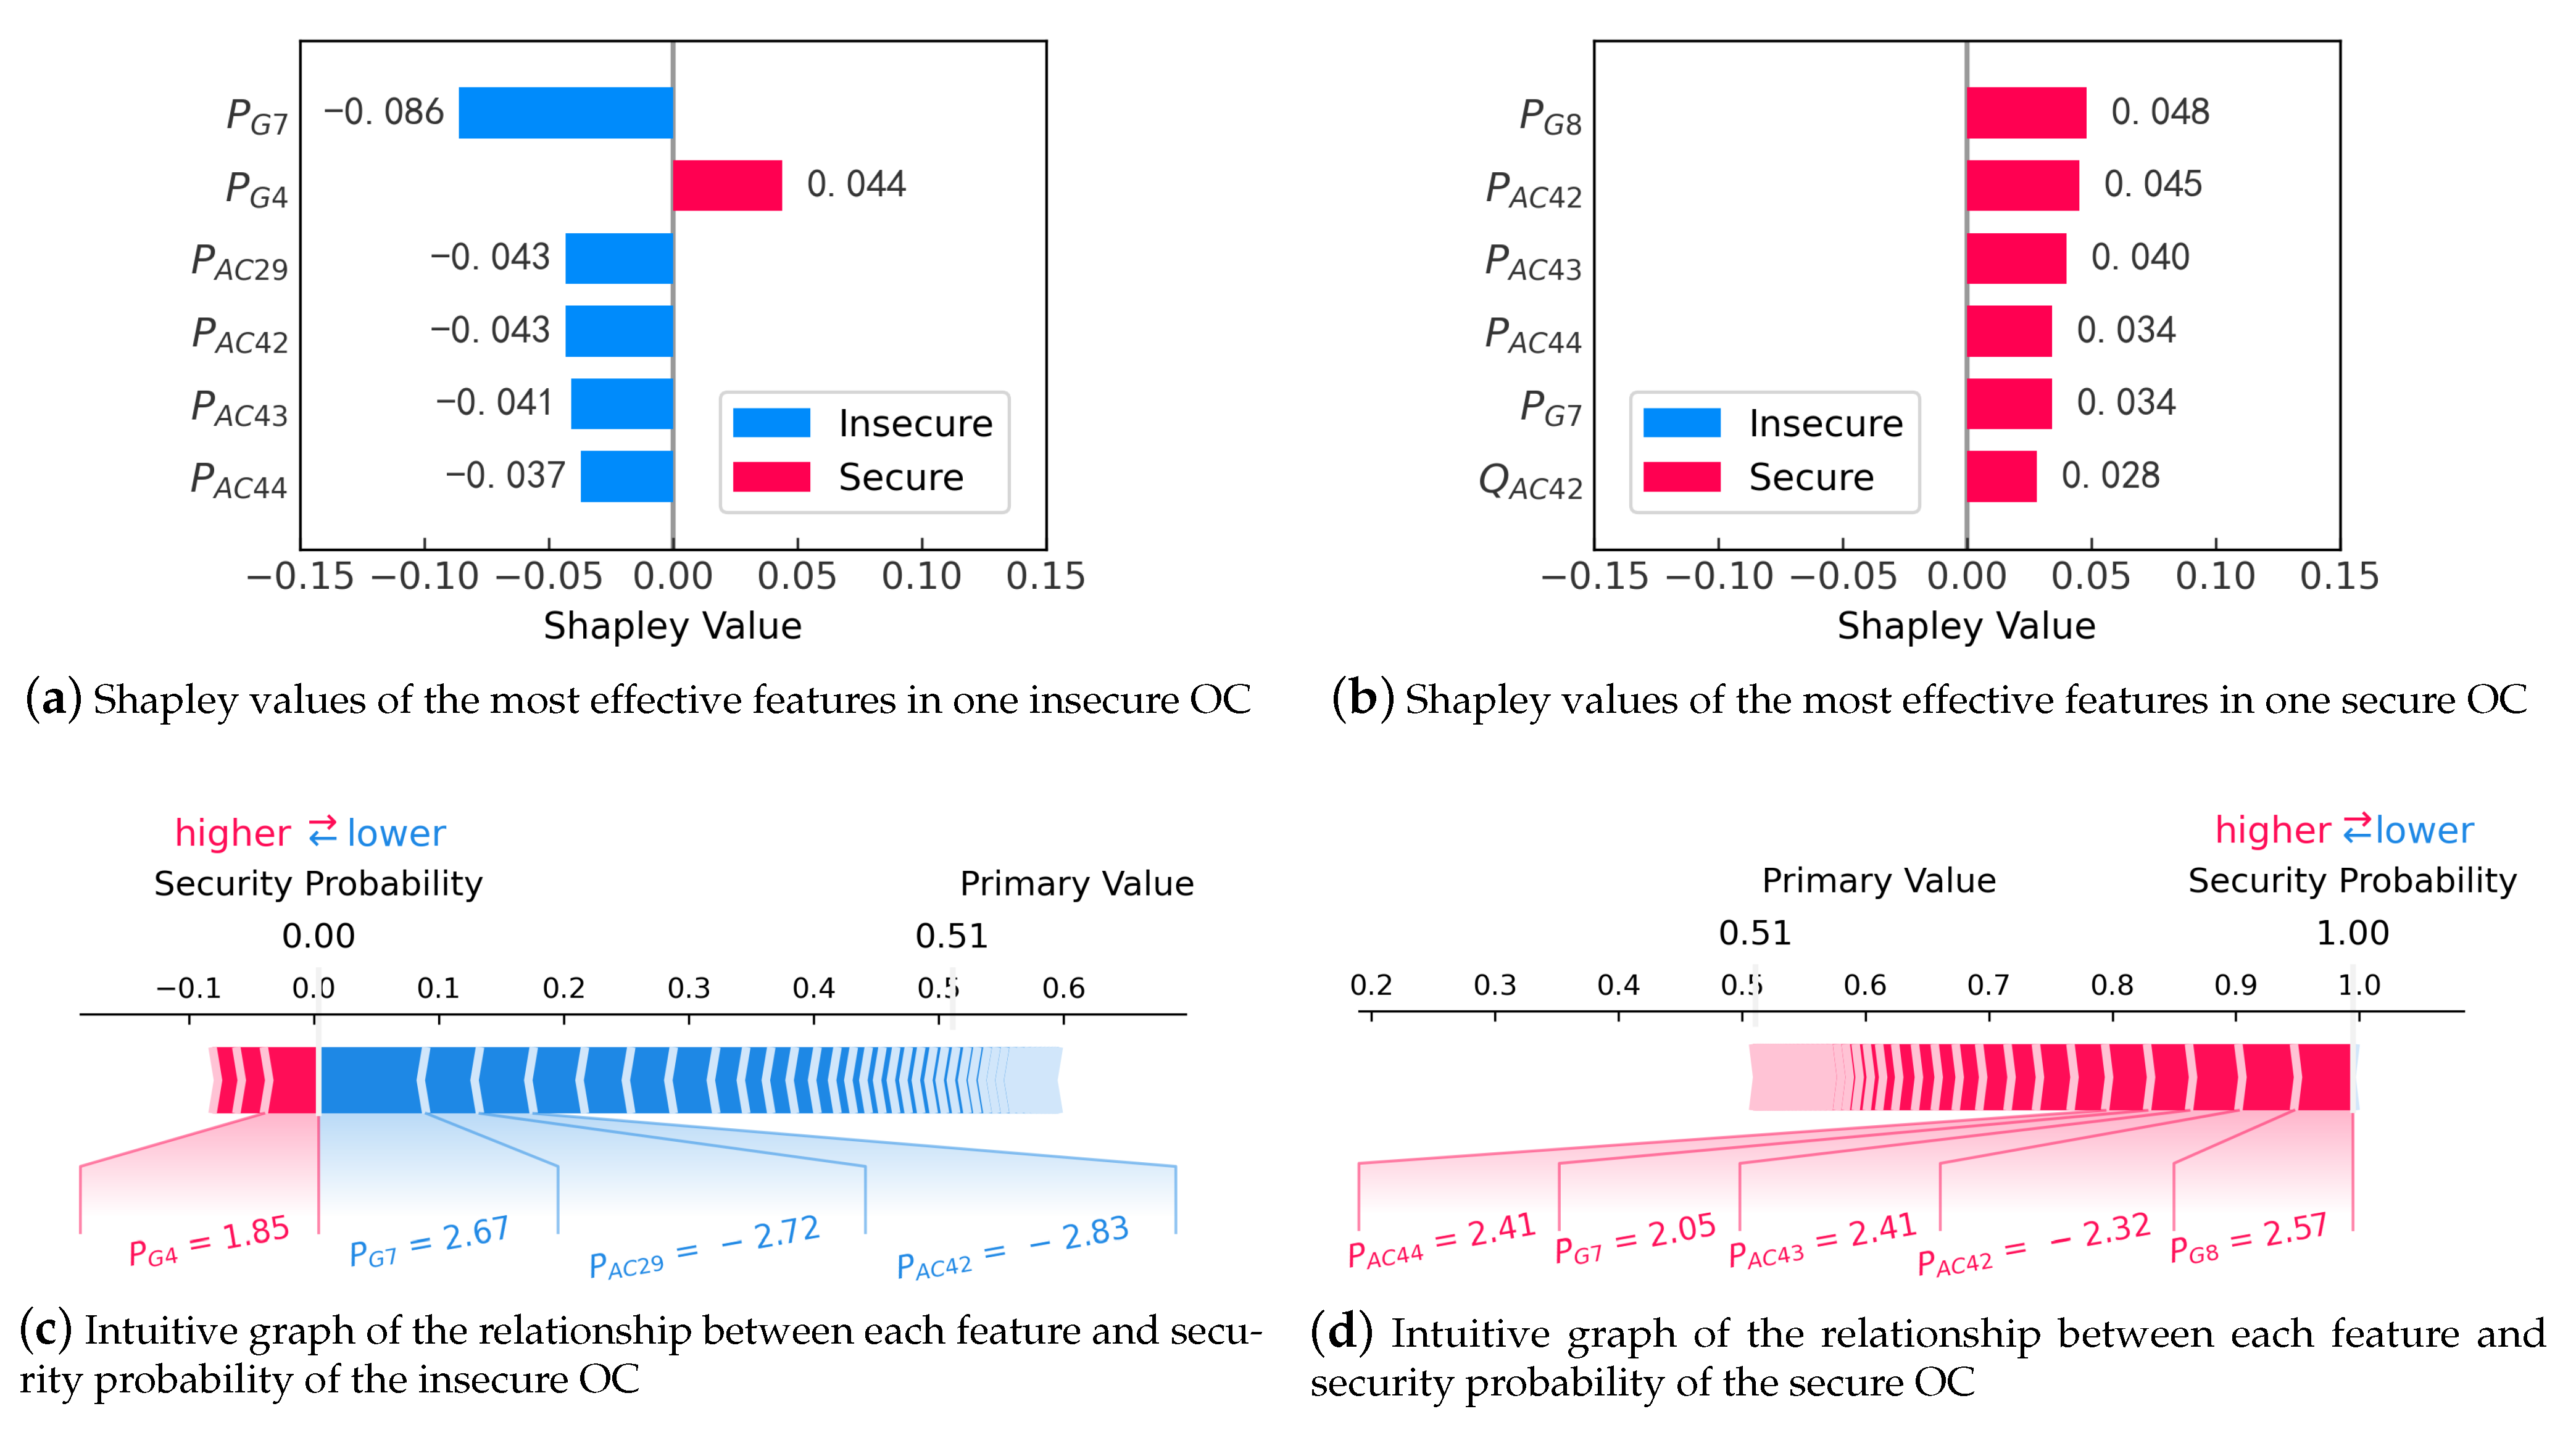
3.2.1. Local Interpretation

An insecure OC/instance and a secure one are analyzed sequentially. The main parameters of these two OCs are shown in Table 1. The background data for interpretation are summarized as 20 samples, using the k-means algorithm to reduce the interpretation time. Figure 5 presents the interpretation results.
In the insecure OC/instance, the top six features with the highest Shapley value are P G 7 , P G 4 , P A C 29 , P A C 42 , P A C 43 , and P A C 44 . The positive and negative of the numerals indicate a category of secure and insecure, respectively. According to (3), the security probability decreases from a primary value of 0.51 to the final value of 0.00 with every feature’s contribution, causing the TSA-ML model to predict the OC as insecure. Among the features, P G 4 has the highest Shapley value in class secure, which means it has the most influence on secure prediction. Other features influence insecure prediction, in which P G 7 influences most. G 7 and G 4 are determined as the critical generators in this insecure OC. In the CEPRI36 system, the pre-defined fault line, A C 29 , is located G 4 and G 7 . These two generators are easily influenced by the fault because they would receive the sheer change of power and voltage once the fault occurs. Thus, it is reasonable to indicate that the active power of these two generators casts the most influence on prediction under such fault. Further, A C 42 , A C 43 , and A C 44 are determined as the critical AC lines in the insecure OC, to which operators should also pay more attention.
As for the secure OC/instance, the top six features with the highest Shapley value are P G 8 , P A C 42 , P A C 43 , P A C 44 , P G 7 , and Q A C 42 . These features support secure prediction and contribute to pushing the security probability from the primary value of 0.51 to the final value of 1.00, identifying the OC as secure.
Through SHAP interpretation, it is easy to figure out the feature importance and detect the critical units for any specific OC/instance.

3.2.2. Global Interpretation

Global interpretation is conducive to analyzing the prediction of DL further. Multiple OCs/instances are selected at random to be interpreted with SHAP. Figure 6 intuitively presents the results of 20 OCs with the top 20 most influential features.
Among all features, P G 7 , P G 8 , P A C 29 , P A C 42 , Q A C 27 , P G 4 , Q A C 42 , P A C 43 , P A C 44 , and P G 5 are the top features that are the most important to the prediction of the trained DL model for the specific fault. In the expert’s experience, the devices corresponding to the features are more related to the fault on A C 29 because they are close to the fault electrically. Therefore, the interpretation results are matched with the real physical rules.
For each feature, there are also other exciting results from the Shapley value. Taking P G 7 as an example, the Shapley value of P G 7 is roughly negatively correlative with the value of itself, indicating that the lower the value of P G 7 is, the higher the probability of predicting the OC as secure is. By contrast, as for P G 4 , its Shapley value is positively correlative with the value of itself. Although some values of features are not wholly monotonic, the grasp of the overall interpretation of the model will not be affected. The findings of the interpretation are beneficial to further the SC application, as discussed in the following section.

3.3. Security Control

SC is one of the terminal applications of I-FIA. The SC of insecure OC/instance mentioned in the previous section is performed. Using the proposed SC method, the critical unit pairs that own the highest Shapley values (positive and negative) and the amount of adjustment can be determined in each iteration. After four iterations, SC can be achieved. The iteration process of adjustment is shown in Table 2.
A total of three generators ( G 4 , G 7 , and G 8 ) are determined to adjust their active power output to achieve SC. Unlike the traditional strategy of preventive control by constrained optimal power flow, our proposed method narrows the number of controlled generators. It is thus welcome to be applied to the actual online SC. At the same time, the generation of the slack machine G 1 has little change due to the balance strategy of critical unit pairs, and the change is allowed to be ignored in SC. The total time of SC generation is 3.148 s, which satisfies the requirement of online applications.
The TDS of OCs before and after the security control is illustrated in Figure 7. Before SC, G 7 and G 8 located in one plant in the CEPRI36 system deviate from other generators after the disturbance. Thus, the system is deteriorated out of synchronization. In contrast, after implementing SC, the generators retain synchronization after the disturbance, validating the control strategy. From the angle trajectories of eight generators, G 7 and G 8 are the critical units affecting the security and stability of the system, which validates the instance-based local and global interpretation results.

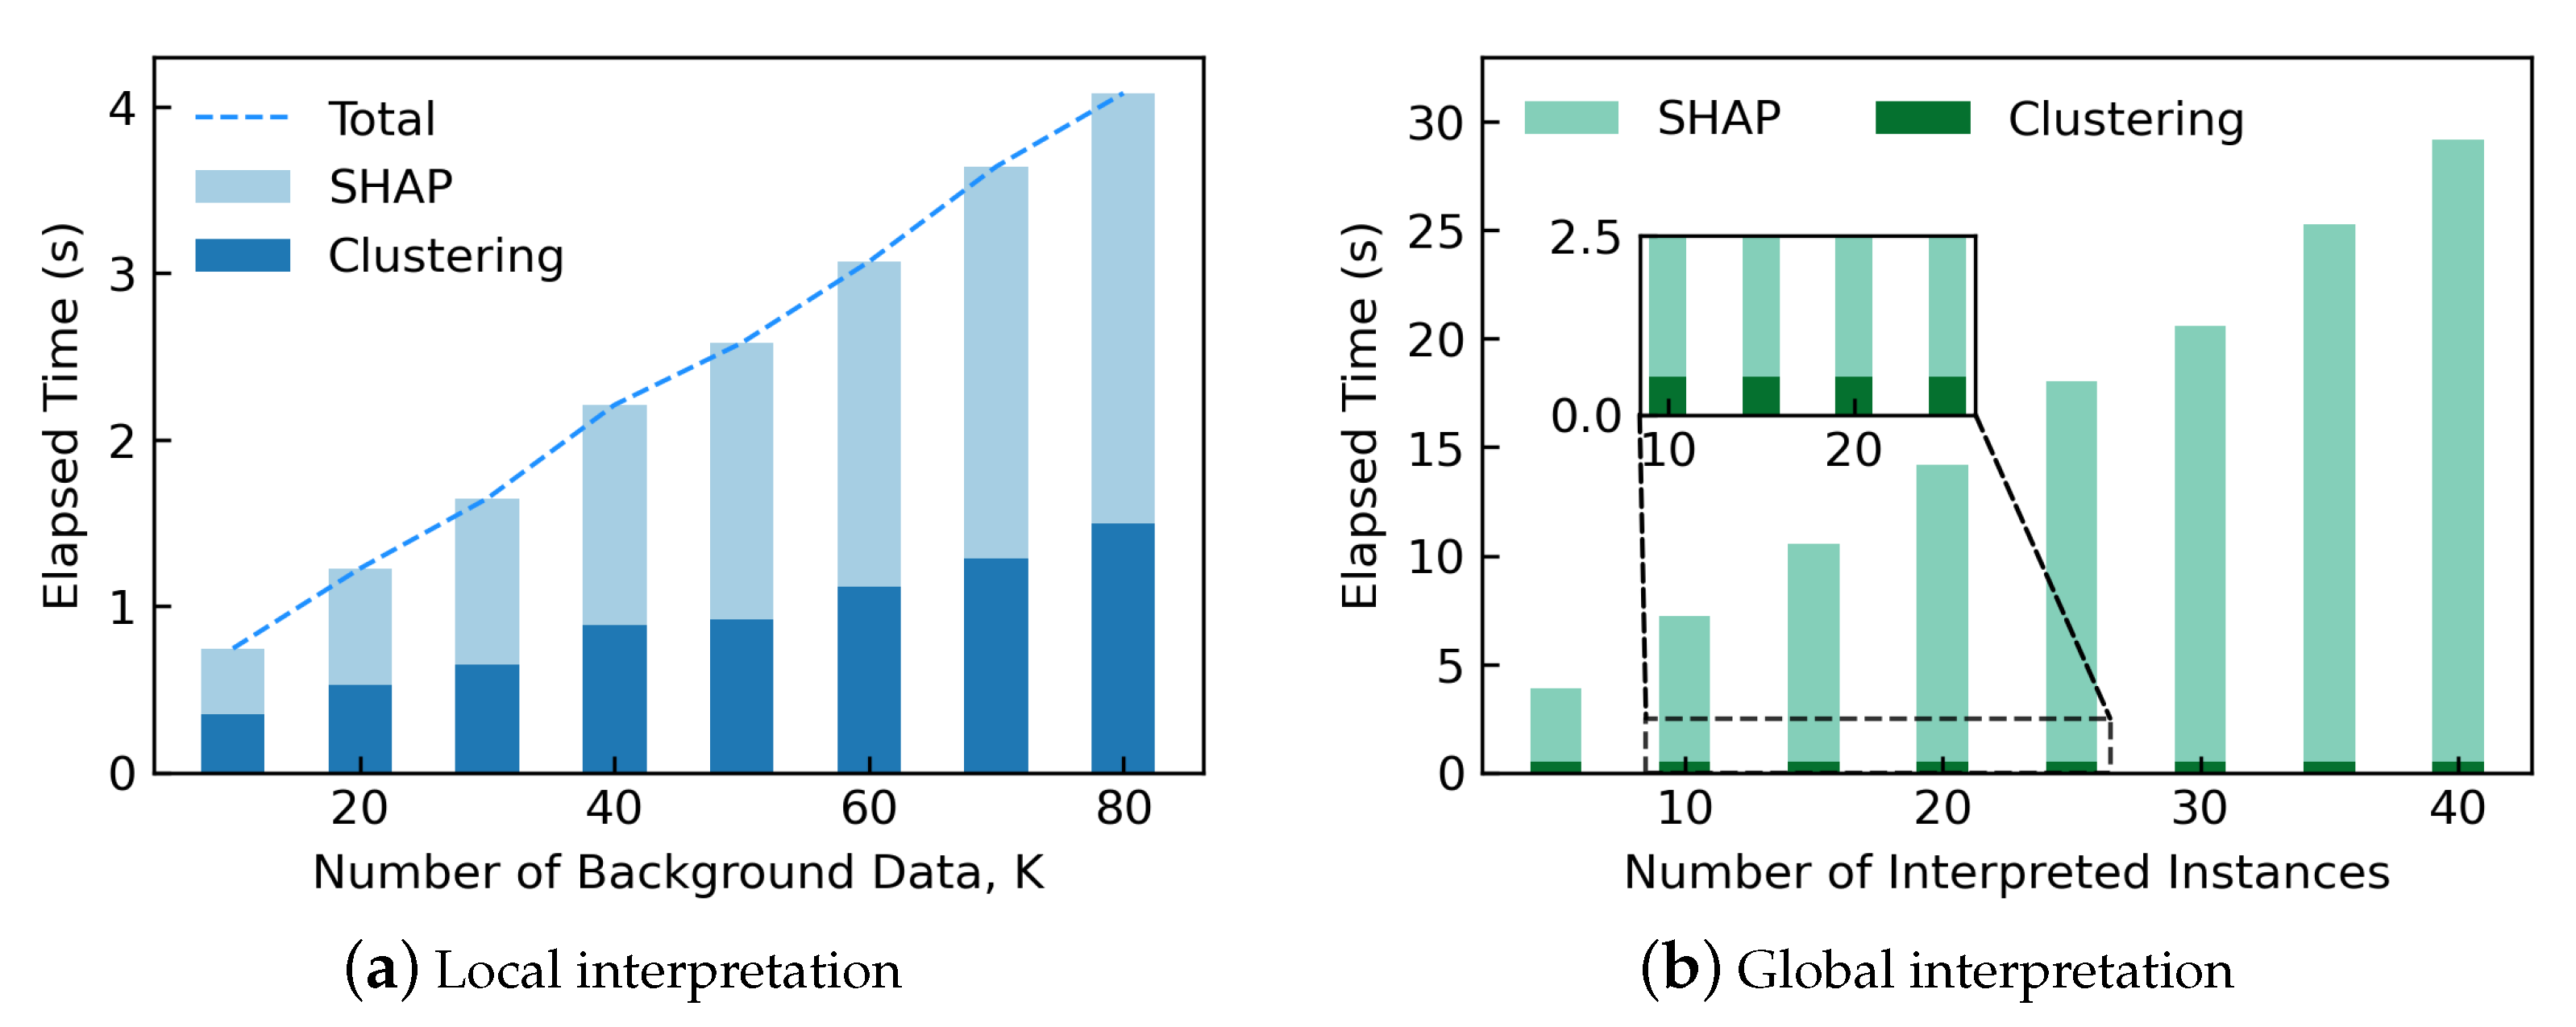
3.4. Analysis on Time Consumption

Time consumption is essential for the online engineering applications. Figure 8 illustrates the simulation results of time consumption of interpretation. For the local interpretation shown in Figure 8a, the elapsed time mainly consists of two parts: the clustering time by k-means and the calculation time of SHAP. For example, when the number of background data points is 20, the time cost of clustering is 0.529 s, and the elapsed time of SHAP is 0.698 s for each interpreted OC/instance. Besides, the elapsed time is nearly proportional to K. To reduce the interpretation time, K should be reduced by aggregating instances.
The global interpretation shown in Figure 8b is based on the interpreter trained by 20 background data points. For example, when the number of interpreted instances is 20, the global interpretation takes 13.639 s, nearly 20 times the consuming time of SHAP for one interpreted OC/instance. The elapsed time is nearly in proportion to the number of interpreted instances. Thus, the number of interpreted instances for the global interpretation should not be too large and is recommended below 20. Twenty instances can well describe the characteristics of the value change of the features (e.g., Figure 6).
Overall, the time consumption of the proposed interpretation method for DSA instances is low, satisfying the requirements of the online rolling applications of critical unit detection and power system preventive security control.

3.5. Scalability Analysis in a Larger-Scale System

The IEEE 118-bus system is investigated to verify the scalability of the proposed method. Suppose the expected contingency is a three-phase fault on bus 5 in the IEEE 118-bus system. Figure 9a illustrates the rotor angle trajectories of generators after the specific contingency in the IEEE 118-bus system without security control. The initial rotor angle trajectory of G40 deviates from other generators, thus directly causing the maximum angle difference of over 200 degrees after the contingency. The system is not secure according to the angle consistency criterion. From the rotor angle trajectories of 54 generators, G 40 is the critical unit affecting the security of the system.
Table 3 shows the iteration process of adjustment for the IEEE 118-bus system using the proposed SC strategy. The iteration process is converged within three epochs. A total of three generators ( G 21 , G 40 , and G 54 ) are determined to adjust their active power output to achieve SC according to the interpretation results. G 40 is adjusted in each iteration, indicating that G 40 is one of the critical units.
The total elapsed time for iteration is 8.583 s. Compared with the classical differential evolution-based global SCOPF method, which takes 59.260 s on average, the calculation speed of this method is increased by 85.5%.
Figure 9b illustrates the rotor angles of generators after the contingency in the IEEE 118-bus system taking the SC. G40 is accurately identified as the generator with the most significant impact on system security from the results of control generators obtained by the proposed SC strategy. Its power output is correctly guided to be reduced. After taking the security control, the initial rotor angle of G40 is reduced. Thus, the maximum angle difference is reduced to below 180 degrees after the expected fault, which is considered stable according to the criterion.

4. Conclusions

An instance-level feature importance analysis approach is proposed in this paper to achieve online critical unit detection and power system security control. Unlike the traditional model-level feature importance analysis, the proposed critical unit detection method is instance-level, focusing on the specific operating conditions concerned by operators, so it has more advantages of practical application in power systems. Numerical simulations on the CEPRI36 system and the IEEE 118-bus system have validated its effectiveness, and it is fast enough to be worthy of online application. Furthermore, the sequential security control generation scheme is superior to the global SCOPF methods in time consumption, especially for large-scale systems. Thus, the proposed strategy has good applicability in large-scale systems.
The proposed method is also up-and-coming to solve other similar detection and control tasks in power systems. It will be interesting in future works to utilize the proposed method to speed up other applications, such as fault detection and static-state security assessment. Furthermore, other control strategies, such as emergency control and corrective control, which the instance-level feature importance analysis approach can inspire, are also our future interests.

Author Contributions

Conceptualization, J.C.; methodology, J.R.; investigation, J.R.; validation, J.R.; writing—original draft preparation, J.R.; writing—review and editing, J.C.; project administration, L.W., S.Z. and Y.C. All authors have read and agreed to the published version of the manuscript.

Funding

This research received no external funding.

Conflicts of Interest

The authors declare no conflict of interest.

References

  1. Luo, F.; Dong, Z.; Chen, G.; Xu, Y.; Meng, K.; Chen, Y.; Wong, K. Advanced Pattern Discovery-based Fuzzy Classification Method for Power System Dynamic Security Assessment. IEEE Trans. Ind. Inform. 2015, 11, 416–426. [Google Scholar] [CrossRef] [Green Version]
  2. Kundur, P. Power System Stability and Control; McGraw-Hill: New York, NY, USA, 1994; Volume 7. [Google Scholar] [CrossRef]
  3. Wang, L.; Girgis, A.A. A new method for power system transient instability detection. IEEE Trans. Power Deliv. 1997, 12, 1082–1088. [Google Scholar] [CrossRef]
  4. Romay, O.; Martínez-Parrales, R.; Fuerte-Esquivel, C.R. Transient Stability Assessment Considering Hard Limits on Dynamic States. IEEE Trans. Power Syst. 2021, 36, 533–536. [Google Scholar] [CrossRef]
  5. Gless, G.E. Direct Method of Liapunov Applied to Transient Power System Stability. IEEE Trans. Power Appar. Syst. 1966, PAS-85, 159–168. [Google Scholar] [CrossRef]
  6. Scala, M.L.; Bose, A.; Tylavsky, D.J.; Chai, J.S. A highly parallel method for transient stability analysis. IEEE Trans. Power Syst. 1990, 5, 1439–1446. [Google Scholar] [CrossRef]
  7. Gurrala, G.; Dimitrovski, A.; Pannala, S.; Simunovic, S.; Starke, M. Parareal in time for fast power system dynamic simulations. IEEE Trans. Power Syst. 2016, 31, 1820–1830. [Google Scholar] [CrossRef]
  8. Maria, G.A.; Tang, C.; Kim, J. Hybrid transient stability analysis. IEEE Trans. Power Syst. 1990, 5, 384–391. [Google Scholar] [CrossRef]
  9. Ren, C.; Xu, Y. Incremental broad learning for real-time updating of data-driven power system dynamic security assessment models. IET Gener. Transm. Distrib. 2020, 14, 4052–4059. [Google Scholar] [CrossRef]
  10. Kamwa, I.; Samantaray, S.R.; Joos, G. Catastrophe Predictors from Ensemble Decision-Tree Learning of Wide-Area Severity Indices. IEEE Trans. Smart Grid 2010, 1, 144–158. [Google Scholar] [CrossRef]
  11. Hu, W.; Lu, Z.; Wu, S.; Zhang, W.; Dong, Y.; Yu, R.; Liu, B. Real-time transient stability assessment in power system based on improved SVM. J. Mod. Power Syst. Clean Energy 2019, 7, 26–37. [Google Scholar] [CrossRef] [Green Version]
  12. Jensen, C.A.; El-Sharkawi, M.A.; Marks, R.J. Power system security assessment using neural networks: Feature selection using Fisher discrimination. IEEE Trans. Power Syst. 2001, 16, 757–763. [Google Scholar] [CrossRef] [Green Version]
  13. Yan, R.; Geng, G.; Jiang, Q.; Li, Y. Fast Transient Stability Batch Assessment Using Cascaded Convolutional Neural Networks. IEEE Trans. Power Syst. 2019, 34, 2802–2813. [Google Scholar] [CrossRef]
  14. Shi, Z.; Yao, W.; Zeng, L.; Wen, J.; Fang, J.; Ai, X.; Wen, J. Convolutional neural network-based power system transient stability assessment and instability mode prediction. Appl. Energy 2020, 263, 114586. [Google Scholar] [CrossRef]
  15. Yan, R.; Wang, Z.; Yuan, Y.; Geng, G.; Jiang, Q. Information entropy based prioritization strategy for data-driven transient stability batch assessment. CSEE J. Power Energy Syst. 2021, 7, 443–455. [Google Scholar] [CrossRef]
  16. Huang, T.; Guo, Q.; Sun, H.; Tan, C.; Hu, T. A deep spatial-temporal data-driven approach considering microclimates for power system security assessment. Appl. Energy 2019, 237, 36–48. [Google Scholar] [CrossRef]
  17. Ren, C.; Xu, Y. A Fully Data-Driven Method Based on Generative Adversarial Networks for Power System Dynamic Security Assessment With Missing Data. IEEE Trans. Power Syst. 2019, 34, 5044–5052. [Google Scholar] [CrossRef]
  18. Wu, S.; Le, Z.; Wei, H.; Yu, R.; Liu, B. Improved Deep Belief Network and Model Interpretation Method for Power System Transient Stability Assessment. J. Mod. Power Syst. Clean Energy 2020, 8, 29–39. [Google Scholar] [CrossRef]
  19. Hyun, K.; Hyunsoo, Y.; Ki-Woong, P. Acoustic-decoy: Detection of adversarial examples through audio modification on speech recognition system. Neurocomputing 2020, 417, 357–370. [Google Scholar] [CrossRef]
  20. Kamwa, I.; Samantaray, S.R.; Joos, G. On the Accuracy Versus Transparency Trade-Off of Data-Mining Models for Fast-Response PMU-Based Catastrophe Predictors. IEEE Trans. Smart Grid 2012, 3, 152–161. [Google Scholar] [CrossRef]
  21. Castelvecchi, D. Can we open the black box of AI? Nature 2016, 538, 20–23. [Google Scholar] [CrossRef] [PubMed] [Green Version]
  22. Voosen, P. How AI detectives are cracking open the black box of deep learning. Science 2017, 357, 22–28. [Google Scholar] [CrossRef] [PubMed] [Green Version]
  23. Shi, Z.; Yao, W.; Li, Z.; Zeng, L.; Zhao, Y.; Zhang, R.; Tang, Y.; Wen, J. Artificial intelligence techniques for stability analysis and control in smart grids: Methodologies, applications, challenges and future directions. Appl. Energy 2020, 278, 115733. [Google Scholar] [CrossRef]
  24. Han, T.; Chen, J.; Fu, Y.; Cai, Y.; Zhang, S. Stability Assessment Machine Learning Models Interpretation Based on Surrogate Models and Clustering. In Proceedings of the 2019 IEEE Sustainable Power and Energy Conference (iSPEC), Beijing, China, 21–23 November 2019; pp. 986–991. [Google Scholar] [CrossRef]
  25. Breiman, L. Random Forests. Mach. Learn. 2001, 45, 5–32. [Google Scholar] [CrossRef] [Green Version]
  26. Pan, G.; Fu, L.; Chen, Q.; Yu, M.; Muresan, M. Road safety performance function analysis with visual feature importance of deep neural nets. IEEE/CAA J. Autom. Sin. 2020, 7, 735–744. [Google Scholar] [CrossRef]
  27. Gan, D.; Thomas, R.; Zimmerman, R. Stability-constrained optimal power flow. IEEE Trans. Power Syst. 2000, 15, 535–540. [Google Scholar] [CrossRef] [Green Version]
  28. Zarate-Minano, R.; Van Cutsem, T.; Milano, F.; Conejo, A.J. Securing Transient Stability Using Time-Domain Simulations within an Optimal Power Flow. IEEE Trans. Power Syst. 2010, 25, 243–253. [Google Scholar] [CrossRef] [Green Version]
  29. Pizano-Martianez, A.; Fuerte-Esquivel, C.R.; Ruiz-Vega, D. Global Transient Stability-Constrained Optimal Power Flow Using an OMIB Reference Trajectory. IEEE Trans. Power Syst. 2010, 25, 392–403. [Google Scholar] [CrossRef]
  30. Mo, N.; Zou, Z.Y.; Chan, K.W.; Pong, T. Transient stability constrained optimal power flow using particle swarm optimisation. IET Gener. Transm. Distrib. 2007, 1, 476–483. [Google Scholar] [CrossRef]
  31. Cai, H.R.; Chung, C.Y.; Wong, K.P. Application of Differential Evolution Algorithm for Transient Stability Constrained Optimal Power Flow. IEEE Trans. Power Syst. 2008, 23, 719–728. [Google Scholar] [CrossRef]
  32. Xia, S.; Chan, K.W.; Bai, X.; Guo, Z. Enhanced particle swarm optimisation applied for transient angle and voltage constrained discrete optimal power flow with flexible AC transmission system. IET Gener. Transm. Distrib. 2015, 9, 61–74. [Google Scholar] [CrossRef]
  33. Maihemuti, S.; Wang, W.; Wang, H.; Wu, J.; Zhang, X. Dynamic Security and Stability Region under Different Renewable Energy Permeability in IENGS System. IEEE Access 2021, 9, 19800–19817. [Google Scholar] [CrossRef]
  34. Strumbelj, E.; Kononenko, I. An Efficient Explanation of Individual Classifications using Game Theory. J. Mach. Learn. Res. 2010, 11, 1–18. [Google Scholar] [CrossRef]
  35. Strumbelj, E.; Kononenko, I. A General Method for Visualizing and Explaining Black-Box Regression Models. In Proceedings of the 10th International Conference on Artificial Neural Networks and Genetic Algorithms, Ljubljana, Slovenia, 14–16 April 2011; pp. 21–30. [Google Scholar] [CrossRef]
Figure 1. Overall flowchart of I-FIA for DSA-DL model.
Applsci 11 05460 g001
Figure 2. The flow chart of online security control based on SHAP.
Applsci 11 05460 g002
Figure 3. The single line diagram of the CEPRI36 benchmark system.
Applsci 11 05460 g003
Figure 4. Impurity-based M-FIA for the DSA-DL model.
Applsci 11 05460 g004
Figure 5. Local interpretation for one insecure OC and one secure OC from the perspective of feature importance. Note that the numerals beside bars in (a,b) are Shapley values of corresponding features, and the numerals under the bars in (c,d) are feature values in units of p.u.
Applsci 11 05460 g005
Figure 6. Global interpretation for 20 OCs.
Applsci 11 05460 g006
Figure 7. Angle trajectories to a disturbance at 0.2 s before and after implementing SC.
Applsci 11 05460 g007
Figure 8. Time consumption of I-FIA.
Applsci 11 05460 g008
Figure 9. Rotor angles of 54 generators after a specific contingency in the IEEE 118-bus system.
Applsci 11 05460 g009
Table 1. Main parameters of an insecure OC and a secure OC in the CEPRI36 system.
Operation Condition (OC) P G 1 P G 2 P G 3 P G 4 P G 5 P G 6 P G 7 P G 8
Insecure5.785.303.231.844.590.002.673.16
Secure5.504.823.541.774.41−0.012.052.57
Unit: p.u.
Table 2. The iteration process of adjustment.
IterationActive Power Generation (p.u.)Control GeneratorsElapsed Time (s)
G1*G2G3G4G5G6G7G8
15.785.303.231.844.590.002.673.16G4(+), G7(−)1.053
25.845.303.232.024.590.002.463.16G4(+), G7(−)1.050
35.855.303.232.224.590.002.233.16G4(+), G8(−)1.044
45.865.303.232.444.590.002.232.91 0.001
Asterisk indicates the slack machine.
Table 3. The iteration process of adjustment for the IEEE 118-bus system.
IterationActive Power Generation (p.u.)Control GeneratorsElapsed Time (s)
G21G30*G40G54
14.4215.2719.920.00G54(+), G40(−)4.378
24.4213.4217.931.79G21(+), G40(−)4.201
36.0412.9016.141.79 0.004
Asterisk indicates the slack machine.
Publisher’s Note: MDPI stays neutral with regard to jurisdictional claims in published maps and institutional affiliations.

