Abstract
The aim of this paper is to obtain the strut friction–touchdown performance relation for designing the parameters involving the strut friction of the landing gear in a light aircraft. The numerical model of the landing gear is validated by drop test of single half-axle landing gear, which is used to obtain the energy absorption properties of strut friction in the landing process. Parametric studies are conducted using the response surface method. Based on the design of the experiment results and response surface functions, the sensitivity analysis of the design variables is implemented. Furthermore, a multi-objective optimization is carried out for good touchdown performance. The results show that the proportion of energy absorption of friction load accounts for more than 35% of the total landing impact energy. The response surface model characterizes well for the landing response, with a minimum fitting accuracy of 99.52%. The most sensitive variables for the four landing responses are the lower bearing width and the wheel moment of inertia. Moreover, the max overloading of sprung mass in LC-1 decreases by 4.84% after design optimization, which illustrates that the method of analysis and optimization on the strut friction of landing gear is efficient for improving the aircraft touchdown performance.
1. Introduction
The aircraft landing gear plays a crucial role in the takeoff, landing impact energy-absorbing, and ground operations [1]. In the shock absorber strut, the friction force is an elemental force of the total strut force and converts kinetic energy into internal energy in the landing process [2]. Therefore, friction can affect landing performance, especially in the light aircraft landing gear [3], which has a smaller structure stiffness and total strut force. To improve the landing performance by designing friction in the strut, a dynamic model of the landing gear needs to be established to obtain the effect of friction load on the soft landing buffering; it is also required for the designer to determine the influence of landing gear structure parameters on strut friction.
The dynamic modeling and analysis of a landing gear with an oleo-pneumatic shock absorber has received relatively large attention in the literature [4,5,6]. The analysis model with sprung and unsprung mass vertical degrees of freedom is established in Milwitzky [7]. Various studies have focused on predicting landing gear dynamics behavior during landing [8,9,10] based on the numerical model. Elemental forces, including gas spring stiffness, oleo damping, and friction, are expressed in the literature. In particular, the friction force is calculated as the absorber strut is regarded as a rigid body [9,11,12] or flexible body [13].
Response surface methodology (RSM) is an assemblage of statistical and mathematical techniques utilized to develop, improve, and optimize processes of industrial production [14,15]. It is commonly used in the design process of some complex objects such as planet lander [16,17] and aircraft [18,19]. RSM can reduce the computational expense for analysis by constructing a substitute model to approximately conform to the numerical model response based on the design of experiment results [20]. To acquire the relation between the design parameters of landing gear with the strut friction force and the preferable touchdown performance, parametric studies on the half-axle aircraft main landing gear with oleo-pneumatic shock absorber are carried out using RSM. The studies are organized into two parts. Section 2 presents the dynamics model of the main landing gear, including the dynamics equation and the elemental force expression. The method for analyzing normal forces in bearing contact area considering strut flexibility is expressed in Section 2.2. Moreover, a drop test is conducted to validate the numerical model in two landing conditions. Section 3 first illustrates the effect of strut friction on landing gear touchdown performance. Second, Section 3.2 and Section 3.3 present the response surface functions for the landing responses and the sensitivity analysis of the parameters, respectively. Finally, Section 3.4 presents a multi-objective optimization design of the parameters of the landing gear to improve the landing performance based on response surface functions.
2. Landing Gear Modeling and Validating
2.1. Landing Gear Dynamics Model
In this subsection, the aircraft half-axle main landing gear (MLG) is selected as the research object, and a two-degrees-of-freedom spring damping model is established, as shown in Figure 1. The aircraft landing buffer response is simplified as the dynamic response of two masses under spring damping constraint in this model [7]. The two masses are the sprung mass and unsprung mass. The sprung mass is the airframe structure and the structural mass above the outer cylinder of the shock absorber, and the unsprung mass is the other structure of the landing gear below the shock absorber piston rod. The oleo-pneumatic shock absorber consists of upper and lower chambers separated by orifices and the metering pin. The upper part of the upper chamber is filled with pressurized nitrogen to provide a gas spring, and the other spaces of the two chambers are filled with oil to provide oil damping. The tire force acting point of the half-axle landing gear is not on the strut axis, which will augment the normal force in the bearing area. In this way, the half-axle landing gear can fully reflect the impact of the friction load on the landing buffer.
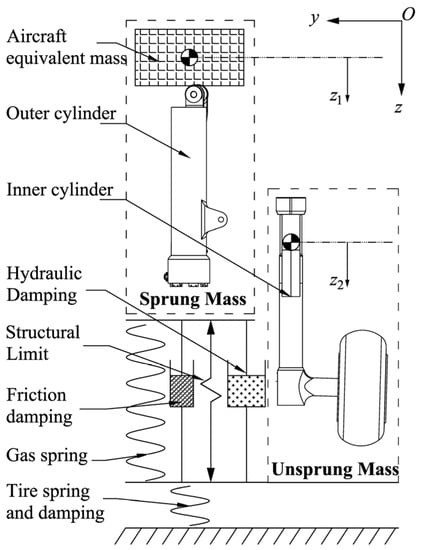
Figure 1.
Schematic of the landing gear with two degrees of freedom.
According to the mathematical model shown in Figure 1, the dynamic equilibrium governing equation of motion for the main landing gear is written as
where and indicate the sprung mass and unsprung mass, respectively; and denote the vertical displacement of the sprung mass and unsprung mass, respectively; , , and represent the gas spring stiffness force, oil damping force, and friction force in the absorber strut, respectively. is the ground vertical force acting on the tire.
The gas spring stiffness force is related to initial gas volume closely, the equation can be expressed as
where is the gas compressed area, is the gas initial pressure, is the gas initial volume, is the shock absorber stroke, is the gas polytropic exponent, and is the atmospheric pressure.
The oil damping force is proportional to stroke slide velocity squared and parameters of the orifice, which is presented by the equation
where is the mass density of oil, is the oil compressed area of the absorber, is the orifice bypass area, is the oil damping discharge coefficient, and is the stroke slide velocity.
The friction forces in the strut contain the journal friction force and seal friction force. The journal friction force is induced by the normal force acting on the upper and lower bearing area. The seal friction force result from the friction of internal seals in the shock absorber depends on the internal gas pressure. The friction forces in the shock strut are described by equation
where is the journal friction force and is the seal friction force. The seal friction force depends on the internal gas pressure [11] and is expressed as
where is the seal friction coefficient and is the signum function.
The journal friction force is the product of the friction coefficient and the normal force. Due to the poor lubricating properties of hydraulic oil and the shape of the bearing surfaces in the shock absorber, it can be assumed that the shock–strut is under a dry friction condition [7]. Coulomb’s law is the simplest and most utilized friction force model since it only requires one input parameter, i.e., the kinetic coefficient of friction [21]. The model with the Stribeck effect reveals that the friction force decreases continuously with the increase of relative velocity from zero velocity, which can be described as
where and represent the magnitude of static friction and Coulomb friction, respectively. denotes the static coefficient of friction which is higher than the kinetic coefficient . is the relative velocity, is the Stribeck velocity, and is an exponent which depends on the geometry of the contacting surfaces, often considered to be equal to 2. indicates the viscous friction coefficient, which is neglected in this work as the dry friction is considered.
Figure 2a shows the classic shape of the Stribeck curve, which contains discontinuity at zero velocity. This discontinuity brings about several numerical issues during a dynamic simulation. To eliminate the numerical issues at zero velocity, a finite slope model is established to replace the discontinuity at zero velocity, as shown in Figure 2b. The model utilized in this work can be expressed by the following equations:
where is the tolerance velocity.
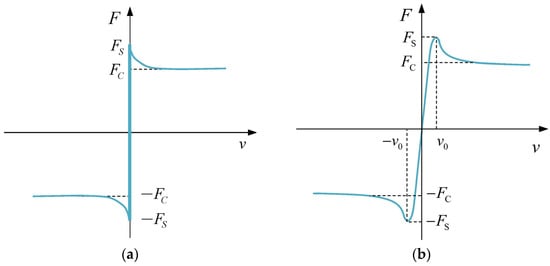
Figure 2.
Representation of Stribeck curves: (a) The classic Stribeck curve; (b) Stribeck curve without discontinuity.
The ground vertical force results from the compression of the tires of the landing gear after touching the ground. A semi-empirical computational model [22] can be described by the equation
where is the tire vertical damping deformation coefficient, and is the tire vertical static force corresponding to the tire compression amount.
The ground longitudinal force is the friction load caused by the relative rotation of the landing gear tire and the ground. Its magnitude is related to the ground vertical force and the ground friction coefficient, which are given by
where is the ground friction coefficient with typical values ranges from 0.4 to 0.9, which depends on tire angular velocity, tire-ground contact pressure, and runway condition.
2.2. Bearing Normal Force Analysis
The effects of ground forces on the absorber strut contain the normal force on the bearing area between the outer cylinder and the piston rod, and the strut elastic deformation. Additional bending moments will be generated at the bearing area to ensure that the deformation of the outer cylinder and the piston rod remains consistent within the supporting area. It is embodied by the reaction force on the upper and lower surfaces of the bearing, which increases the total normal force on the bearing area. Figure 3 is a schematic diagram of the internal force analysis for the half-axle main landing gear in the xoz plane and the yoz plane under the ground vertical force and longitudinal force.
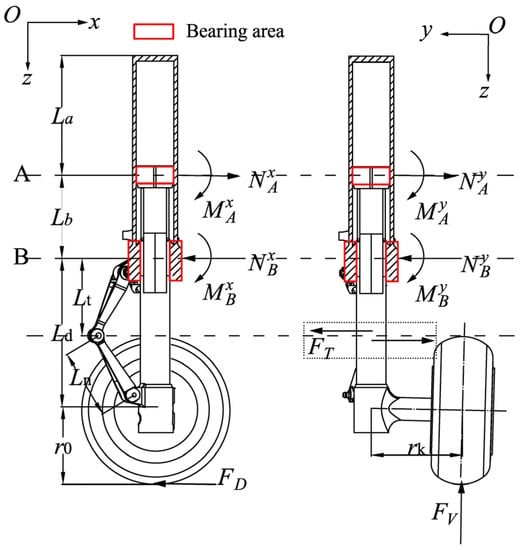
Figure 3.
Schematic of main landing gear (MLG) load analysis.
and in Figure 3 denote the normal forces and additional bending moments, the subscripts “A” and “B” mean the acting points point A and point B, the superscripts “x” and “y” indicate the xoz plane and the yoz plane, respectively. is the internal force acting on the intersection point of the upper and lower torque link.
To simplify the calculation process, the following assumptions are made for the landing gear strut in this work. The outer cylinder is simplified to a cantilever beam model, and the piston rod is simplified to an overhanging beam model. The flexible deformation of the outer cylinder and the piston rod is considered under the small deformation assumption, which uses the equivalent area moment of inertia of the simplified uniform beam for calculation, as shown in Figure 4.

Figure 4.
Schematic of uniform beam with equivalent area moment of inertia.
and in Figure 4 represent the equivalent area moment of inertia of the outer cylinder and the piston rod, respectively. In the xoz plane and the yoz plane, the outer cylinder and the piston rod are subjected to the external forces and the internal forces at the bearing area. The deformation and rotation angle of the outer cylinder and the piston rod at the upper and lower bearing area can be calculated using the external force and the contact internal force. The deformation and rotation angle on the piston rod are recorded as , , , and . The deformation and rotation angle on the piston rod are written as , , , and , respectively. According to the coordinated relationship of deformation, it is concluded that
The calculation results of four equations for normal forces and bending moments on point A and point B in the xoz plane and yoz plane can be described as
The normal forces and bending moments are resulting from the reaction forces on the upper and lower surfaces of bearings, as shown in Figure 5.
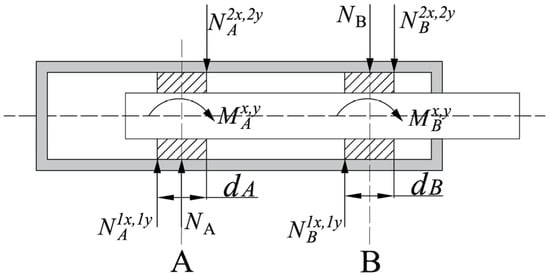
Figure 5.
Schematic of reaction forces on upper and lower surfaces of bearings.
The reaction force on the upper and lower surfaces of bearings can be calculated by the equations
where and indicate the upper bearing width and the lower bearing width, the superscript “1” and “2” mean the upper surface and lower surface of each bearing, respectively. The resultant forces of reaction forces on each surface of the bearing can be presented as
Thus, the total normal force on the contact area of the outer cylinder and piston rod is given by
where N denotes the total normal force on the contact area of the outer cylinder and the piston rod, utilized to calculate the friction force in shock absorber strut.
2.3. Drop Test and Model Validation
To verify the accuracy of the numerical model of the landing gear, a single landing gear drop test system is established in this subsection, as shown in Figure 6. The truss structure installed on the vertical slide rail is used to simulate the landing gear fuselage installation point and the mass of the aircraft body. The vertical landing velocity of the aircraft is simulated through a fixed height free fall. Turn the wheel of landing gear in reverse to simulate the aircraft landing longitudinal speed. A suitable rough plate is installed on the impact plate to simulate the dry runway. The load sensors are installed at the bottom of the impact flat to measure the ground vertical load and longitudinal load.
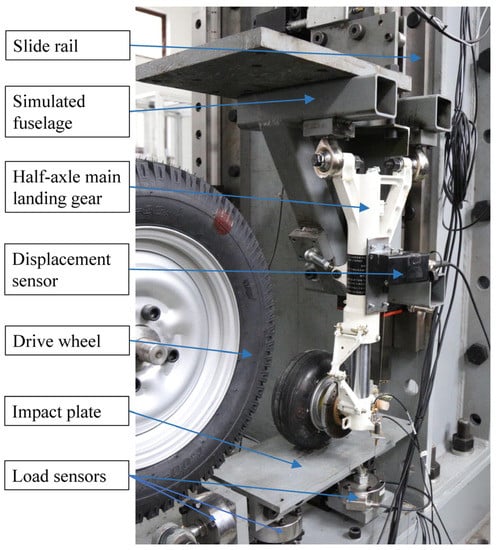
Figure 6.
Drop test system of the single landing gear.
The buffer stroke is measured by a displacement sensor mounted on the landing gear. The various response data are collected in the buffering process, including the displacement of the sprung mass and the unsprung mass, sprung mass acceleration, ground vertical force and longitudinal force, and buffer stroke. We used a multi-channel signal collector to acquire real-time test data of each dynamic response.
The drop test is carried out in two landing conditions with various vertical descending velocities and sprung mass, shown in Table 1. The LC-1 is the regular landing condition with lower vertical descending velocity and sprung mass. The LC-2 is the extreme worst design landing condition with the highest design vertical descending velocity and sprung mass.

Table 1.
Landing condition properties.
The calculation results of the numerical model of landing gear dynamic responses in two landing conditions were obtained using the same values of landing gear parameters as the drop test, and the parameter values used in this work are shown in Table 2.

Table 2.
Landing gear parameters definition and value.
To verify the accuracy of the numerical model, the comparison of the landing gear landing dynamic responses obtained from the drop test with the results calculated by the numerical model is shown in Table 3 and Figure 7. Table 3 shows the landing dynamic response results of landing gear acquired from two methods and the relative errors between the results. The ground vertical force and shock absorber stroke are two crucial dynamic responses of landing gear in the landing process. Figure 7 is the corresponding curve of the two crucial responses, which can express the quantity and the energy absorption efficiency.

Table 3.
Comparison of numerical results and test results.
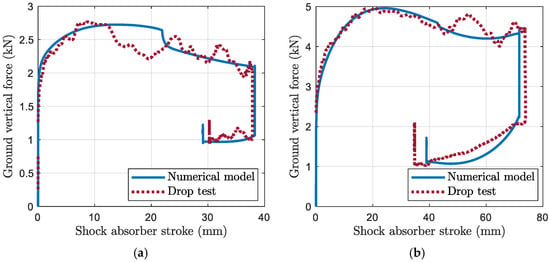
Figure 7.
The ground vertical force curve with shock absorber stroke: (a) LC-1; (b) LC-2.
According to the result in Table 3, it can be seen that the numerical simulated results have good agreement with the drop test results. The maximum discrepancy error is 4.58% in the sprung mass displacement of LC-1. As shown in Figure 7, the numerical simulated corresponding curve has good consistency with the drop test corresponding curve. Therefore, the numerical model can predict the dynamic response of the landing gear in the landing process accurately, which can be used to analyze the friction effect on touchdown performance in the following research.
3. Analysis of Strut Friction Effect on Touchdown Performance Using RSM
3.1. Energy Absorption Analysis
In this subsection, the percentage of strut friction energy absorption of the strut total energy absorption during the landing process is calculated based on the numerical model of the landing gear established in Section 2. Two performance criteria are considered in this work to express the effect of strut friction on energy absorption: energy quantity and energy absorption efficiency . The two performance criteria are defined as
where denotes the elemental force in shock strut. and are the maximum shock absorber stroke and elemental force during the landing process.
The landing process can be divided into six phases, of which the impact energy dissipation mainly occurs in the third phase, namely, the first compression of the shock strut [23]. The strut friction, gas spring, and oil damping corporately dissipate the impact energy during the landing process. This work considers the energy absorption in the third phase as the judging criteria of energy absorption capability, with the results shown in Figure 8 and Table 4.
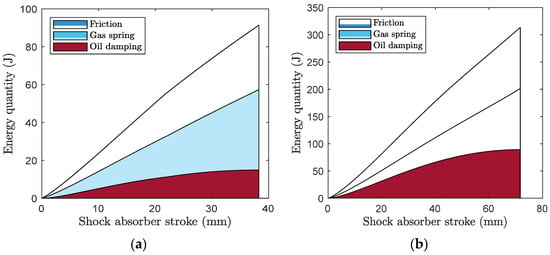
Figure 8.
Energy absorption quantity trend of elemental forces: (a) LC-1; (b) LC-2.

Table 4.
Results of energy absorption of elemental forces.
As shown in Figure 8, the energy absorption of strut friction has a considerable proportion of total impact energy in two landing conditions. Moreover, the oil damping absorbs more energy in LC-2 as the larger vertical descending velocity.
Table 4 lists the results of energy absorption of elemental forces. The results show that the proportions of energy absorbed by friction are more than 35% in two landing conditions: 38.15% and 35.76%. Moreover, the proportion of energy absorbed by friction decreases by the increase of the landing impact energy. The shock–strut efficiency in LC-2 is larger than the efficiency in LC-1 as the friction efficiency enlarges as the larger landing impact energy.
According to the results in Figure 8 and Table 4, the strut friction has a considerable influence on aircraft and landing gear touchdown performance when the landing impact energy is small, which is common in light aircraft. The higher friction efficiency can lead to the higher shock–strut efficiency, which illustrates that the touchdown performance of aircraft can be improved by designing the parameters involving the strut friction.
3.2. RS-Model and Analysis
In this subsection, the response surface method is employed in parallel with the validation numerical model obtained from Section 2. To acquire the relation between design variables (involving the strut friction) and landing dynamic response for designing a good configuration quickly, the response surface functions are constructed, which can reduce the computational expense for analysis and design. The construction of the response surface function includes three steps: the design of experiment (DOE), response surface fitted, and the analysis of variance (ANOVA).
In this work, eight design parameters of the landing gear involving the strut friction are selected in the design space , and the structural parameters are shown in Figure 3. To obtain a fewer number of sample points while retaining the accuracy of the RS-model, the DOE is constructed based on a three-level Box–Behnken design with full factorial, which has one hundred and twenty sample points as shown in Table 5. The symbol (,) means that all combinations of plus and minus levels are to be run. The Box–Behnken design is an independent quadratic design in which the treatment combinations are at the midpoints of edges of the process space and at the center [24]. The center point is run 8 times to allow for a more uniform estimate of the prediction variance over the entire design space. The design space of variables is selected based on the original value of the landing gear. The values and design levels of variables are shown in Table 6.

Table 5.
Three-level Box–Behnken design for 8 factors.

Table 6.
Design variables and design level in DOE.
The four dynamic responses during the landing process are shown in Table 7. The shock–strut energy absorption efficiency, max overloading of sprung mass, and the shock–strut stroke are the crucial criteria in characterizing the touchdown performance.

Table 7.
The information of four landing dynamic responses.
Every situation of DOE result is run in the numerical model of the landing gear for the four landing responses. Furthermore, the results are fitted with a quadratic polynomial function using the stepwise regression method in this research [14]. To examine the accuracy of the fitted model, the common indexes are selected, including p-value, R-squared, Adj R-squared, and Adequate precision. The calculation methods of indexes are listed in [14]. The accurate fitted model must satisfy the requirements regarding the four indexes, which are shown in Table 8. Moreover, the scatter points of the numerical model response values versus the predicted values should evenly distribute on both sides of the 45-degree diagonal.

Table 8.
The ANOVA results of RS model for the four response values.
The ANOVA results acquired from the RS-model for the four dynamic responses are shown in Table 8. The table illustrates that all four indexes for checking the coincidence of the fitted model are meet the criteria. Furthermore, the scatter plots of the numerical model response values versus the predicted values are shown in Figure 9. These figures demonstrate that the sample points are split evenly by the 45-degree diagonal.
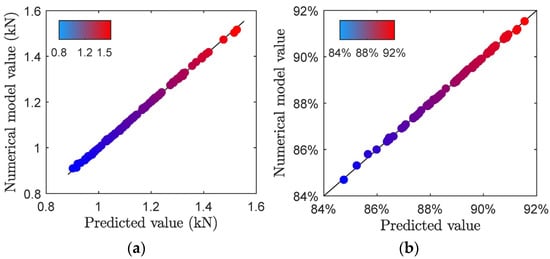
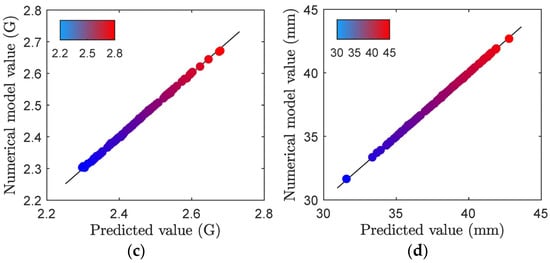
Figure 9.
The numerical model values versus the predicted values of the responses: (a) Max load of strut friction; (b) Shock-strut efficiency; (c) Max overloading of the sprung mass; (d) Shock absorber stroke.
As described in [14], the response surface models for the four landing dynamic responses can be used to simulate the landing response in the design space . The four RS functions are listed in Table 9. All the functions have three order effects, including the first-order, the second-order, and the interaction effects.

Table 9.
RS functions for the four landing dynamic responses.
3.3. Sensitivity Analysis
In this subsection, a global sensitivity analysis based on the Sobol’s method is executed to obtain the influence of the design variables on the four landing response functions in the design space. According to the theory of Sobol’s method [25], the first-order indices represent the sensitivity of the single variable, and the total-effect indices denote all order sensitivity of a variable, including the interaction effects with other variables. The sensitivity analysis results of each design variable under the four RS functions of landing response are shown in Figure 10. It can be seen that the sensitivity indices distribution of design variables on max friction load and max overloading are approximately the same. The friction force has a considerable proportion of the shock–strut total force, which directly reflects the max overloading, and the larger the friction force is, the larger the overloading is. Therefore, the friction force can be considered as the design object for improving the touchdown performance by revising the variables in the design space. Moreover, the lower bearing width () is the most influential variable for the max friction load, the max overloading, and the shock absorber stroke. It indicates that the lower bearing should be widened to reduce the normal reaction force induced by the additional bending moments.
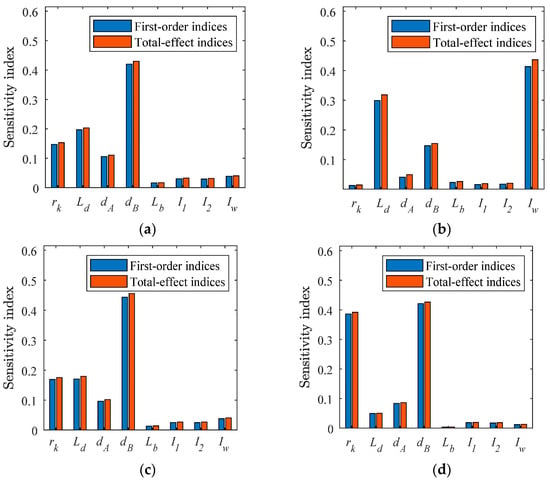
Figure 10.
The sensitivity indices for the four landing responses: (a) Max load of strut friction; (b) Shock-strut efficiency; (c) Max overloading of the sprung mass; (d) Shock absorber stroke.
Figure 11 illustrates the top two noticeable variables affecting the four landing responses while the coded values of other variables are set to be zero. The top two sensitive variables for the max friction load and the max overloading are the distance between the lower bearing and wheel axis (), and the lower bearing width (). The similarity of variation trend in Figure 11a,c also demonstrates the correlation between these two landing responses. In Figure 11a,c, when the value of the lower bearing width () at a low level, the response value increases rapidly as the lower bearing width () decreases and the distance between the lower bearing and wheel axis () increases, proceeding toward an unfavorable level. Moreover, when the value of the lower bearing width () at a high level, the values of these two landing responses are at a stable and favorable level.
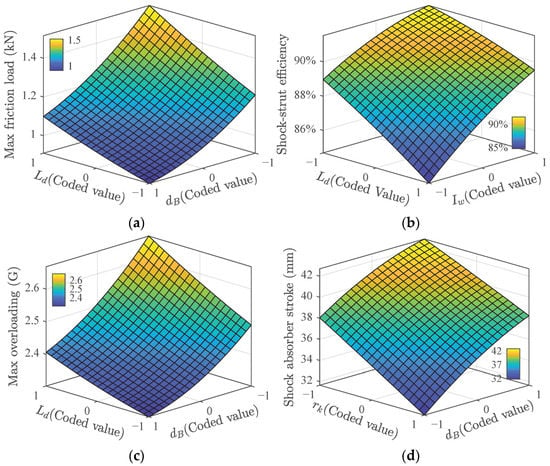
Figure 11.
The top two sensitive variables influence on the four landing responses: (a) Max load of strut friction; (b) Shock-strut efficiency; (c) Max overloading of the sprung mass; (d) Shock absorber stroke.
Figure 11b shows that the shock–strut efficiency is at a stable and beneficial level when the distance between the lower bearing and wheel axis () is at a high level and the wheel moment of inertia () is at a low level. The wheel moment of inertia affects the acting duration of ground longitudinal force. The longer the acting duration, the higher the energy absorption efficiency of the strut friction load, which is reflected in the shock-strut efficiency as shown in Figure 11b.
Figure 11d denotes the effect of the top two noticeable parameters on shock absorber stroke, namely, the half-axle distance () and the lower bearing width (). The half-axle distance () affects the shock strut bending moments induced by the ground vertical force. As the strut friction is mainly generated by the ground vertical force, the larger value of the half-axle distance () leads to the smaller shock absorber stroke.
3.4. Design Optimization
Design optimization applies the method of mathematical optimization to design projects, which involves the selection of variables and objectives and the determination of constraints and an optimal value set of variables [26]. The design optimization is carried out to prove that adjusting the friction load can improve the touchdown performance based on the response surface model. The design variables for design optimization are the same as those mentioned in Table 6. According to the RS functions, the overloading of sprung mass in two landing conditions is selected as the optimization objective. The constraint boundary of the design parameters is defined in the design space as shown in Table 6. To maintain the comparability of the result, the shock absorber stroke is limited to be smaller than the original value of stroke in Section 2.3. As the two optimization objectives, the multi-objective optimization (MDO) is carried out using the elitist non-dominated sorting genetic algorithm version II (NSGA-II) [27] for the design optimization. The mathematical model of the design optimization can be expressed as
where the superscript “b” denotes the original value of stroke. After the design optimization, the Pareto front of the optimization result fitted by the two optimization goals is shown in Figure 12. The Pareto front is non-convex, which is most obvious at the right end. As these non-convexities do not cause a dominated solution [28,29], the Pareto optimal solutions in the Pareto front are all non-inferior solutions. Because of the more probability of the LC-1 of all landing conditions, the optimum parameter values of landing gear are selected comprehensively from the left area of the Pareto front as shown in Table 10. The numerical model of the landing gear is modified according to the selected parameter values. Then, the dynamics simulations of the two landing conditions are carried out.
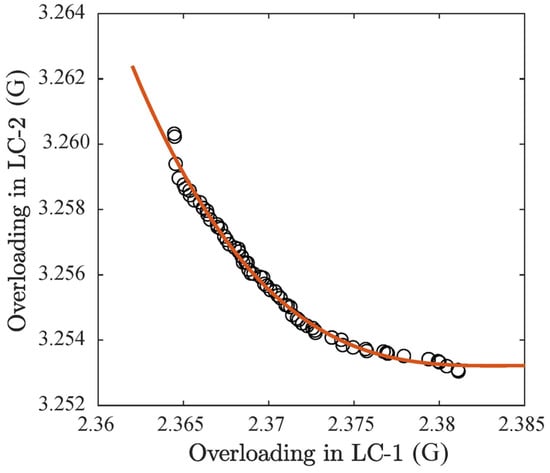
Figure 12.
The Pareto front of two optimization goals.

Table 10.
The optimized values of the landing gear parameters.
Table 11 compares the landing response results before and after design optimization. It can be seen that the max friction load decreased by 12.39% in LC-1, while the shock absorber stroke is at the same level as the original value. The max overloading of sprung mass decreased by 4.84% as the shock–strut efficiency increased by 4.03% in LC-1. The design optimization results in LC-2 are inefficient as the selection of optimum parameter values takes the touchdown performance in LC-1 as the principal object. The touchdown performance in LC-1 still gets some improvement after design optimization, and even the shock–strut efficiency is already at a high level in the original layout of the landing gear.

Table 11.
Comparison of the design optimization results.
4. Conclusions
In this paper, a numerical dynamic model of the half-axle main landing gear of a light aircraft is established, considering the influence of the flexibility of the shock strut on the friction load. The calculations of the two landing conditions are carried out. The drop test is executed in equal conditions to verify the simulated accuracy of the numerical model for the touchdown performance. Based on the validated model, the energy absorption of friction load in the landing process is analyzed. The results show that the proportion of energy absorption of the friction load accounts for more than 35% of the total landing impact energy, indicating that friction load has a considerable effect on touchdown performance. The energy absorption efficiency of shock–strut and strut friction increase as the increase of the landing impact energy.
The four landing responses and eight design variables of the landing gear are analyzed based on the response surface method. The response surface models all meet the fitness evaluation criteria. Based on the Sobol’s method, the parameter sensitivity analysis of the four landing responses is carried out. The results show that the lower bearing width () is the parameter with the greatest influence on max strut friction load, max overloading of sprung mass, and shock absorber stroke. The wheel moment of inertia () is the parameter that has the greatest influence on shock–strut efficiency. The influence trend of each design variable on max friction load and max overloading are approximately the same, indicating the correlation between these two landing responses.
The multi-objective optimization is carried out based on the response surface models. The max overloading of sprung mass in the two landing conditions are selected as the optimization goals. The results show that the optimized max overloading is reduced by 4.84% in LC-1 while the original energy absorption efficiency is already at a high level, indicating that the touchdown performance of the aircraft can be improved by optimizing the design parameters that affect the friction load.
These studies provide guidance to the design of aircraft landing gear, including modelling, experiment, performance analysis, and design optimization. The role of friction in landing performance is notable for designers, which can be utilized to improve the landing performance. The response surface method coupled with the numerical model and design optimization provides a feasible scheme for the optimal design of the project with similar properties.
Author Contributions
Conceptualization, X.W.; methodology, S.G.; software, S.G.; validation, S.G. and X.F.; formal analysis, S.G.; investigation, X.F.; resources, S.G.; data curation, X.F.; writing—original draft preparation, S.G.; writing—review and editing, X.W.; visualization, X.F.; supervision, X.W.; project administration, X.W.; funding acquisition, X.W. All authors have read and agreed to the published version of the manuscript.
Funding
This research was funded by the National Defense Outstanding Youth Science Foundation (Grant No. 2018-JCJQ-ZQ-053).
Institutional Review Board Statement
Not applicable.
Informed Consent Statement
Not applicable.
Data Availability Statement
In this paper, the relevant experimental data and calculation results can be obtained through the first author.
Acknowledgments
The authors gratefully acknowledge the support of the Chengdu Aircraft Industrial (Group) Co., Ltd. for the aircraft landing gear used in this work.
Conflicts of Interest
The authors declare no conflict of interest. The funders had no role in the design of the study; in the collection, analyses, or interpretation of data; in the writing of the manuscript; or in the decision to publish the results.
References
- Currey, N.S. Aircraft Landing Gear Design: Principles and Practices; American Institute of Aeronautics and Astronautics: Washington, DC, USA, 1988. [Google Scholar]
- Lucas, G.H.; Robert, H.D.; Veloria, J.M. Modeling and Validation of a Navy A6-Intruder Actively Controlled Landing Gear System. NASA-TP-209124; National Aeronautics and Space Administration: Hampton, VA, USA, 1999. [Google Scholar]
- Fasanella, E.L.; McGehee, J.R.; Pappas, M.S. Experimental and Analytical Determination of Characteristics Affecting Light Aircraft Landing-Gear Dynamics. NASA-TM-X-3561; National Aeronautics and Space Administration: Hampton, VA, USA, 1977. [Google Scholar]
- Pritchard, J. Overview of landing gear dynamics. J Aircr. 2001, 38, 130–137. [Google Scholar] [CrossRef]
- Krüger, W.R.; Morandini, M. Recent developments at the numerical simulation of landing gear dynamics. CEAS Aeronaut. J. 2011, 1, 55–68. [Google Scholar] [CrossRef]
- Pecora, R. A Rational Numerical Method for Simulation of Drop-Impact Dynamics of Oleo-Pneumatic Landing Gear. Appl. Sci. 2021, 11, 4136. [Google Scholar] [CrossRef]
- Milwitzky, B.; Cook, F.E. Analysis of landing-gear Behavior. NACA-TN-2755; National Advisory Committee for Aeronautics: Hampton, VA, USA, 1953. [Google Scholar]
- Li, Y.; Jiang, J.Z.; Neild, S.A.; Wang, H. Optimal Inerter-Based Shock–Strut Configurations for Landing-Gear Touchdown Performance. J. Aircr. 2017, 54, 1901–1909. [Google Scholar] [CrossRef]
- Suresh, P.S.; Sura, N.K.; Shankar, K. Investigation of nonlinear landing gear behavior and dynamic responses on high performance aircraft. Proc. Inst. Mech. Eng. Part G J. Aerosp. Eng. 2019, 233, 5674–5688. [Google Scholar] [CrossRef]
- Yadav, D.; Ramamoorthy, R.P. Nonlinear Landing Gear Behavior at Touchdown. J. Dyn. Syst. Meas. Control 1991, 113, 677–683. [Google Scholar] [CrossRef]
- Khapane, P.D. Simulation of asymmetric landing and typical ground maneuvers for large transport aircraft. Aerosp. Sci. Technol. 2003, 7, 611–619. [Google Scholar] [CrossRef]
- Heirendt, L.; Liu, H.H.T.; Wang, P. Aircraft Landing Gear Thermo-Tribomechanical Model and Sensitivity Study. J. Aircr. 2014, 51, 511–519. [Google Scholar] [CrossRef][Green Version]
- Wei, X.H.; Liu, C.L.; Song, X.C.; Nie, H.; Shao, Y.Z. Drop dynamic analysis of half-axle flexible aircraft landing gear. J. Vibroengineering 2014, 16, 266–274. [Google Scholar]
- Myers, R.H.; Montgomery, D.C.; Anderson-Cook, C.M. Response Surface Methodology: Process and Product Optimization Using Designed Experiments; John Wiley & Sons: Hoboken, NJ, USA, 2016. [Google Scholar]
- Bae, J.; Kim, H.; Park, S.; Kim, K.S.; Choi, H. Parametrization Study of Electrospun Nanofiber Including LiCl Using Response Surface Methodology (RSM) for Water Treatment Application. Appl. Sci. 2020, 10, 7295. [Google Scholar] [CrossRef]
- Ding, Z.; Wu, H.; Wang, C.; Ding, J. Hierarchical Optimization of Landing Performance for Lander with Adaptive Landing Gear. Chin. J. Mech. Eng. 2019, 32, 1–12. [Google Scholar] [CrossRef]
- Zheng, G.; Nie, H.; Luo, M.; Chen, J.; Man, J.; Chen, C.; Lee, H.P. Parametric design and analysis on the landing gear of a planet lander using the response surface method. Acta Astronaut. 2018, 148, 225–234. [Google Scholar] [CrossRef]
- Park, S.; Ko, H.; Kang, M.; Lee, Y. Characteristics of a Supersonic Fluidic Oscillator Using Design of Experiment. AIAA J. 2020, 58, 2784–2789. [Google Scholar] [CrossRef]
- Hanif, A.; Li, H.S.; Raza, M.A.; Kamran, M.; Abdullah, M. Optimization Design of an Aircraft Wing Structure Based on Response Surface Method; IOP Conference Series: Materials Science and Engineering, 2020; IOP Publishing: Chengdu, China, 2020; p. 12024. [Google Scholar]
- Liao, X.; Li, Q.; Yang, X.; Li, W.; Zhang, W. A two-stage multi-objective optimisation of vehicle crashworthiness under frontal impact. Int. J. Crashworthiness 2008, 13, 279–288. [Google Scholar] [CrossRef]
- Marques, F.; Flores, P.; Claro, J.C.P.; Lankarani, H.M. Modeling and analysis of friction including rolling effects in multibody dynamics: A review. Multibody Syst. Dyn. 2019, 45, 223–244. [Google Scholar] [CrossRef]
- Wen, Z.; Zhi, Z.; Qidan, Z.; Shiyue, X. Dynamics Model of Carrier-based Aircraft Landing Gears Landed on Dynamic Deck. Chin. J. Aeronaut. 2009, 22, 371–379. [Google Scholar] [CrossRef]
- Wei, X.; Liu, C.; Liu, X.; Nie, H.; Shao, Y. Improved Model of Landing-Gear Drop Dynamics. J Aircr. 2014, 51, 695–700. [Google Scholar] [CrossRef]
- NIST/SEMATECH. E-Handbook of Statistical Methods. Available online: https://www.itl.nist.gov/div898/handbook/pri/section3/pri3362.htm (accessed on 2 June 2021).
- Sobol, I.M. Global sensitivity indices for nonlinear mathematical models and their Monte Carlo estimates. Math. Comput. Simul. 2001, 55, 271–280. [Google Scholar] [CrossRef]
- Papalambros, P.Y.; Wilde, D.J. Principles of Optimal Design: Modeling and Computation; Cambridge University Press: Cambridge, UK, 2000; pp. 10–17. [Google Scholar]
- Deb, K. Multi-Objective Optimization Using Evolutionary Algorithms: An Introduction; Springer: London, UK, 2011. [Google Scholar]
- Pardalos, P.M.; Žilinskas, A.; Žilinskas, J. Non-Convex Multi-Objective Optimization; Springer: London, UK, 2017; pp. 8–9. [Google Scholar]
- Kim, I.Y.; de Weck, O.L. Adaptive weighted-sum method for bi-objective optimization: Pareto front generation. Struct. Multidiscip. Optim. 2005, 29, 149–158. [Google Scholar] [CrossRef]
Publisher’s Note: MDPI stays neutral with regard to jurisdictional claims in published maps and institutional affiliations. |
© 2021 by the authors. Licensee MDPI, Basel, Switzerland. This article is an open access article distributed under the terms and conditions of the Creative Commons Attribution (CC BY) license (https://creativecommons.org/licenses/by/4.0/).