Article

Spindle Thermal Error Prediction Based on LSTM Deep Learning for a CNC Machine Tool

1
Department of Computer Science and Information Engineering, National Chin-Yi University of Technology, Taichung 411030, Taiwan
2
Graduate Institute of Precision Manufacturing, National Chin-Yi University of Technology, Taichung 411030, Taiwan
*
Author to whom correspondence should be addressed.
Appl. Sci. 2021, 11(12), 5444; https://doi.org/10.3390/app11125444
Submission received: 10 May 2021 / Revised: 5 June 2021 / Accepted: 7 June 2021 / Published: 11 June 2021

Abstract

:
In the precision processing industry, maintaining the accuracy of machine tools for an extensive period is crucial. Machining accuracy is affected by numerous factors, among which spindle thermal elongation caused by an increase in machine temperature is the most common. This paper proposed a key temperature point selection algorithm and thermal error estimation method for spindle displacement in a machine tool. First, highly correlated temperature points were clustered into groups, and the characteristics of small differences within groups and large differences between groups were realized. The optimal number of key temperature points was then determined using the elbow method. Meanwhile, the long short-term memory (LSTM) modeling method was proposed to establish the relationship between the spindle thermal error and changes of the key temperature points. The results show the largest root mean square errors (RMSEs) of the proposed LSTM model and the key temperature point selection algorithm were within 0.6 µm in the spindle thermal displacement experiments with different temperature changes. The results demonstrated that the combined methodology can provide improved accuracy and robustness in predicting the spindle thermal displacement.

1. Introduction

The global precision machinery market has expanded and shifted its focus to high value-added products, particularly those in the spaceflight, automotive, and mold industries. The products in these industries are mostly characterized by complex structures or irregular surfaces, and are thus difficult to process. During the transformation of high value products, increasing or maintaining the machining accuracy of machine tools is essential. Researchers have indicated that the thermal deformation in precision machinery caused by the internal and external heat sources of machine tools accounts for 50–70% of total errors [1,2,3], making thermal deformation a major precision control problem common to all precision machinery. In order to improve the above problem, researchers have proposed using thermal stability materials to manufacture machine tools [4,5,6,7], redesign the mechanism of isolating heat sources [8] or redesign cooling channels to reduce the temperatures of heat sources [9,10,11,12]. Although these approaches effectively mitigate thermal errors, they are considerably cost intensive and cause other problems, such as increased vibration and reduced acceleration of the machine tool [13]. Therefore, mathematical prediction models of the spindle thermal displacement have been proposed to establish the temperature–spindle deformation relationship in a machine tool and to provide the basis for a controller to compensate for the thermal displacement of the spindle. Such models have become widely preferred and applied in various types of computer numeric control (CNC) machine tools, such as gantry-type machine centers [14], three-axis vertical machining centers [15], lathe machines [16] and so on. In application, the hardware module for compensation of spindle thermal error was established to collect the online temperature values from the key positions of a machine tool, calculate the compensation value using mathematical models, and communicate with the CNC controller. The axes positioning was periodically readjusted by the control of the machine tool, based on the received compensation value. Multiple linear regression (MLR) is a common algorithm for creating mathematical prediction models of thermal displacement [17,18,19,20,21,22,23]. Some neural network modeling techniques have also been proposed to obtain more robust and accurate predictions [24,25,26,27,28,29,30,31,32]. In addition, how to select and decide the representative temperature-sensitive points among numerous Initial Temperature Points (ITPs) is crucial. The performance of the selection method directly affects the accuracy of the estimation model as well as the cost of system implementation. Miao et al. [21] proposed a modeling method based on a principal component regression (PCR) algorithm, which can eliminate the influence of multi-collinearity among temperature variables. Both PCR and MLR were given practice tests through thermal error experiments of actual machine. And the results show, the model had good forecasting accuracy and robustness using the PCR model. Liu et al. [22] proposed using a fuzzy clustering algorithm to cluster highly correlated ITPs. With a gray prediction algorithm, the gray correlation between the temperature points of each group and displacements was analyzed. The temperature point with the greatest gray correlation was selected as the key temperature point (KTP) for each group. Finally, a ridge regression algorithm was proposed to establish the thermal displacement model. Liu et al. [23] presented a new thermal error modeling method called GR-SUE. In the GR-SUE method, several temperature-sensitive points with the highest-influence weights on thermal error ware directly selected using the gray relation algorithm. A split unbiased estimation modeling algorithm was subsequently proposed to improve the MLR algorithm to inhibit the influence of collinearity on model prediction accuracy and robustness. The experimental results indicated that the GR-SUE method could significantly reduce the volatility of temperature-sensitive points and improve the prediction accuracy and robustness of the model. Yin et al. [29] used the fuzzy c-means clustering algorithm to cluster ITPs and select key temperature-sensitive points. Yin et al. also adopted a genetic algorithm to optimize a BackPropagation neural network (BPNN) to reduce the instability of the thermal displacement estimation models. Zhou et al. [30] established a total of 222 ITPs from different structural positions of a machine tool; among the ITPs, KTPs were selected using density-based clustering. Subsequently, a steepest descent algorithm was replaced by the genetic algorithm in a BPNN to establish a thermal displacement model. Lou et al. [31] analyzed 27 ITPs and displacement stability by using the ratio of temperature variations to displacement variations over time. Highly correlated ITPs were clustered using a fuzzy clustering algorithm, and the KTPs with the greatest stability for each cluster were defined. Finally, a BPNN was used to create a thermal displacement model. The results revealed that the screened KTPs had higher estimation accuracy than did the remaining points. By performing an analysis based on the grey prediction algorithm, Abdulshahed et al. [32] analyzed the grey action values of 76 ITPs and their displacement levels, after which the fuzzy clustering algorithm was used to cluster these values for KTP selection. Finally, the adaptive neuro-fuzzy inference system was adopted to establish a spindle thermal displacement model. The results demonstrated that the root mean square errors (RMSEs) of the proposed model were within 4 µm in thermal error experiments with different temperature increases and decreases.
The aforementioned studies have demonstrated that appropriate KTP selection and the use of highly accurate and robust estimation models are necessary for the improvement of spindle thermal errors in machine tools. In the present study, several ITPs were defined according to an analysis of machine tool structures, experience, and internal and external heat sources. Subsequently, the spindle thermal displacement experiments were conducted to measure both the temperatures of all the ITPs and the spindle displacement in the z-direction for different spindle rotation speeds. After the experimental data were collected, a reference point for temperature increase was obtained by calculating the variance for each ITP. Highly correlated ITPs were then clustered, and the elbow method [33] was adopted to determine the optimal number of KTPs. Finally, according to the characteristics of the data, an artificial neural network (ANN) using long short-term memory (LSTM) architecture was designed to establish a spindle thermal displacement model in the z-direction. This model can be used as the basis for the spindle thermal displacement compensation in a machine tool to maintain machining accuracy.

2. Materials and Methods

The proposed method included ITP analysis, experimental design to obtain experimental data, temperature increase reference point analysis, ITP clustering, KTP selection, data normalization, and the establishment of the thermal displacement model of the spindle in the z-direction. The flowchart of the proposed method is shown in Figure 1. In Table A1, the notations of all the symbols and variables used are summarized in this paper.

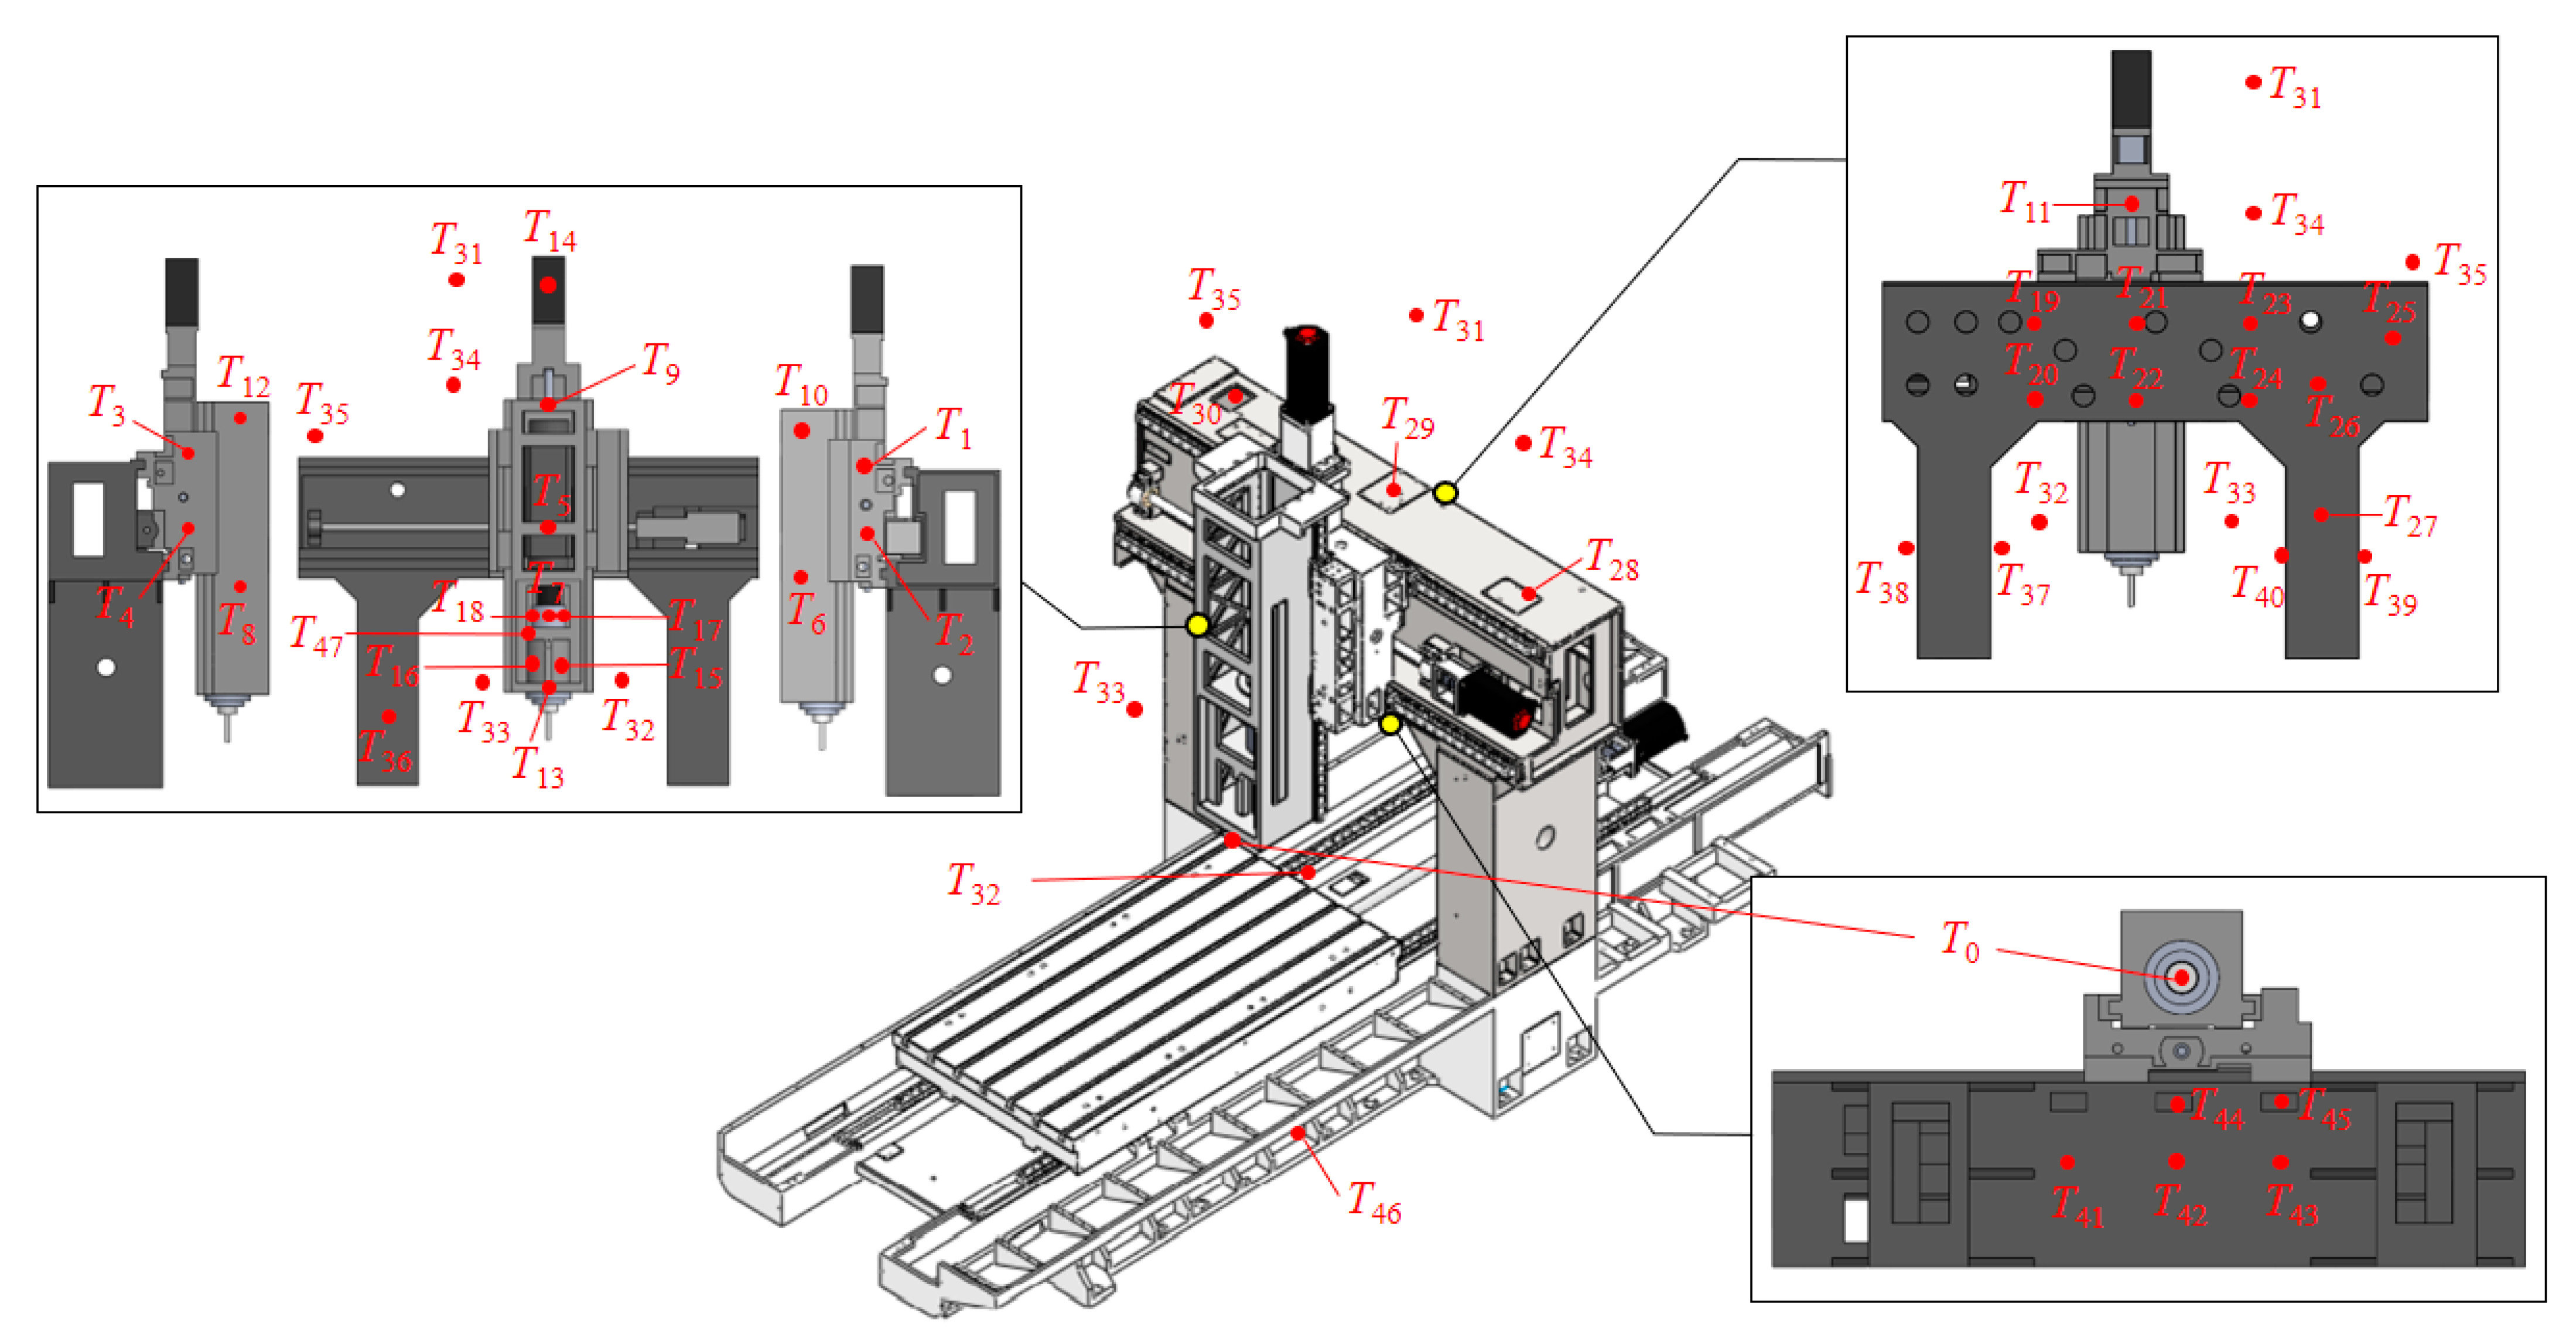
2.1. ITP Analysis and Experimental Design

Spindle thermal displacement in a machine tool is mainly caused by the expansion of metal parts in response to internal and external heat sources. When the spindle starts to rotate at high speed, mechanical friction occurs between the spindle motor, bearing, and gear, producing thermal energy. These resultant internal heat sources transfer heat through conduction to the spindle part and the ambient casting parts. The temperature of these casting parts increases, resulting in heat deformation [13]. In addition, external heat sources (i.e., environmental temperature and sunlight) indirectly affect casting part temperature through heat radiation [13]. By considering the heat sources, machine tool structures, and experience, n ITPs T = {T1, T2, …, Tn} can be selected. Meanwhile, three thermal error experiments with low, moderate, and high machine tool rotation speeds were separately conducted. For example, because the maximum rotation speed of the spindle is 10,000 rpm, three spindle thermal error experiments were planned at three rotation speeds: 3000, 6000, and 9000 rpm. The machine tool was run for 8 h at each speed level and stopped for another 8 h for cooling, enabling the identification of structural deformations. For each experiment, the spindle thermal error was measured in accordance with the “five-point method” from the international standard “Test code for machine tools—Part 3: Determination of thermal effects” (ISO 230-3:2001 IDT) [34]. Specifically, five Omron ZX-EM02T [35] eddy current noncontact displacement sensors were installed, along with a test bar, to simulate the cutting points of the machine tool, as illustrated in Figure 2. The specifications of the MISUMI NT50-CMA30-225 (Ikoma, Japan) test bar [36] are shown in Figure 3. Online data of the spindle displacement in the z-direction E were sampled at a frequency of 30 s.

2.2. Analysis and Selection of the Temperature Rise Reference Point

Generally, the machining accuracy of a machine tool is affected by the environmental temperature unless it is placed in a processing environment with a constant temperature. The environmental temperature changes with the amount of sunlight, the season, and weather, creating different environmental temperature conditions at the beginning of and during machine tool processing [37]. Under such circumstances, thermal errors that occur after the machine tool has been running for a long period may have various consequences. To mitigate the effects of environmental temperature on the machine tool and obtain a stable basis for thermal error compensation, this paper aimed to identify a reference point Tb of temperature rise among the ITPs. Specifically, the variance of each ITP was calculated by Equation (1). In probability theory and statistics, variance is a statistical measurement of the spread between numbers in a data set. Variance can measure how far each number in the set is from the mean. The larger variance value, the greater the data dispersion and variation were. Conversely, a small variance value indicates slight variation. When this characteristic is used, the ITP with minimum variation after a long period of spindle operation can be identified and defined as the reference point Tb. Since Tb was excluded from the original ITPs, the number of ITPs is hereafter denoted as n − 1. Subsequently, the temperature difference of each ITP (except for the reference ITP) was obtained by subtracting Tb from the ITP value, which was denoted as ΔT =T1, ΔT2, …, ΔTn−1 }, where ΔT1 = T1Tb. These temperature differences were adopted as the basis for the subsequent spindle thermal displacement analysis, modeling, and model application.
S S T = 1 A a = 1 A T 1 , a T 1 ¯   2   ,
where A denotes the number of data.

2.3. KTP Selection Method

The effectiveness of the KTP selection method affects the performance of spindle thermal displacement modeling and the cost of system implementation. Excessive temperature points cause overfitting in ANN learning, consequently reducing the predictive ability of the model. To solve the aforementioned problems, a clustering algorithm with the elbow method was proposed to determine the optimal number of KTPs in this study. This approach can effectively reduce the dimensionality of ITPs. Specifically, the Pearson correlation coefficient was used to acquire a measure of the linear correlation CZ(E, ΔT) between the temperature difference ΔT of each ITP and the spindle displacement in the z-direction E, as expressed in Equation (2). The correlation coefficient CT between ITPs can also be measured. In addition, the RMSE was calculated to confirm the performance of the estimation model in Equation (3). A small RMSE indicates a small difference between the actual and estimated value of spindle displacement in the z-direction E and suggests a higher predictive ability of the estimation model.
C z E , Δ T = a = 1 A Δ T 1 , a Δ T 1 ¯ Z a Z ¯ Δ T 1 , a Δ T 1 ¯ Z A Z ¯ ,
R M S E = 1 A a = 1 A Z a y a   2 ,
where A denotes the number of data, E is the actual spindle displacement in the z-direction, and y represents the estimated output from the estimation model. The steps of the KTP selection method are described as follows:
Step 1:
Define the clustering threshold ρ.
Step 2:
Obtain the correlation coefficient CZ(E, ΔT) between the temperature difference of each unclassified IPT, ΔT, and the actual spindle displacement in the z-direction E.
Step 3:
Among the unclassified IPTs, select the temperature point that is the most correlated with the spindle thermal displacement and define it as cluster centroid Ts.
Step 4:
Calculate the correlation coefficient CT(Ts, ΔT) between cluster centroid Ts and all other unclassified IPTs, individually.
Step 5:
If the correlation coefficient CT(Ts, ΔT) of the unclassified IPTs is larger than the clustering threshold ρ, then they are grouped in a cluster with cluster centroid Ts. Meanwhile, import cluster centroid Ts into a candidate KTP set TK.
Step 6:
Repeat Steps 3–5 until all the n–1 ITPs are grouped, resulting in the final candidate KTP set TK = {tk1, tk2, …, tkv}, where v denotes the total number of groups.
Step 7:
In the candidate KTP set TK, select KTPs from tk1 to tkr, where r is initially set to 1. Next, establish the prediction model of the thermal displacement of the spindle, the details of which are specified in Section 2.4 and Section 2.5.
Step 8:
Use the data from the high-speed spindle rotation experiment to calculate the RMSE between the estimated values and actual values of spindle thermal displacement.
Step 9:
Add 1 to r and repeat Steps 6 and 8 until the RMSEs are obtained for all the KTP combinations.
Step 10:
Adopt the elbow method [33] to plot a graph, in which the x-axis denotes the number of KTP c and the y-axis denotes the RMSE.
Step 11:
Identify where the line in a graph is curved without an obvious decrease and relate the point (i.e., the elbow of the curve) to the corresponding c value (i.e., the point where all RMSEs have nearly converged). This value c was defined as the optimal number of KTPs.

2.4. Definition and Normalization of the Modeling Data

Li et al. [38] mentioned that when establishing a thermal displacement model, inputting variables unrelated to temperature increase into the model (e.g., spindle rotation speed, load inertia ratio, and spindle current) can improve the predictive ability of the model. Therefore, in addition to treating the KTP combination obtained in the previous section as a model input, the model uses the spindle rotation speed S as a variable. The values of these model inputs undergo min–max normalization as expressed in Equation (4). All values were mapped to the range [0, 1] and were used as the input for model training and application.
d n o m = d d min d max d min ,
where dmax and dmin denotes the maximum and minimum value in the specified data, respectively.

2.5. Establishment of a Spindle Thermal Displacement Model in the Z-Direction

In a recurrent neural network (RNN), when a hidden layer is calculated, the output is passed back to the layer itself as an input. This approach enables the effective storage of historical information. Therefore, an RNN can more effectively predict time series data compared to a feedforward neural network. However, the conventional RNN method will cause long-term memory to be covered by short-term memory because of the mathematical vanishing gradient problem. The RNN method thus has difficulties in capturing long-term memory. Hochreiter et al. proposed the LSTM [39] to improve this RNN defect. An LSTM memory cell has several gates that can decide whether the input and output information can be stored and exported. A memory cell is mainly comprised of an input gate, a forget gate, and an output gate. The input gate determines whether the neural input in question should enter the memory cell, the forget gate decides whether the information within the cell should be eliminated, and the output gate decides whether the memory cell should be output. The updated equations for the three gates are as follows:
i t = s i g m o i d x t U i + h t 1 W i + b i
f t = s i g m o i d x t U f + h t 1 W f + b f
o t = s i g m o i d x t U o + h t 1 W o + b o
c ˜ t = tanh   x t U g + h t 1 W g + b g
c t = s i g m o i d   f t × c t + i t × c ˜ t
h t = tanh   c t × o t
where xt is the input value of the tth datum. Variables it, Ui, Wi, and bi denote the output, input weight, previous output weight, and bias of the input gate, respectively. Variables ft, Uf, Wf, and bf are the output, input weight, previous output weight, and bias of the forget gate, respectively. Variables ot, Uo, Wo, and bo represent the output, input weight, previous output weight, and bias of the output gate, respectively. Variable c ˜ t is the current neural output, while Ug is the neural input weight, Wg is the previous output weight of the neuron, bg is the bias of the neuron, ct is the memory cell output, and ht is the LSTM unit output. With the three-gate mechanism, LSTM architecture can store old data on a memory cell for deep learning. This technique has advanced in fields such as text generation, machine translation, speech recognition, and image description generation. Because the data of temperature increase and spindle displacement resemble time series data, the LSTM scheme is an ideal option for modeling. In this study, LSTM modeling was adopted to create a z-direction spindle thermal displacement model to accurately estimate the spindle displacement with various rotation speeds. The temperature increase ΔT of the KTP combination and the spindle rotation speed S were the inputs, and the z-direction displacement of the spindle was the output. Based on input data complexity, the control parameters, including several hidden-layer neurons, several hidden layers, neuron bias, and nonlinear transfer functions, were designed for LSTM training. The LSTM estimation results were later compared to those of an MLR and BPNN.

3. Experimental Results

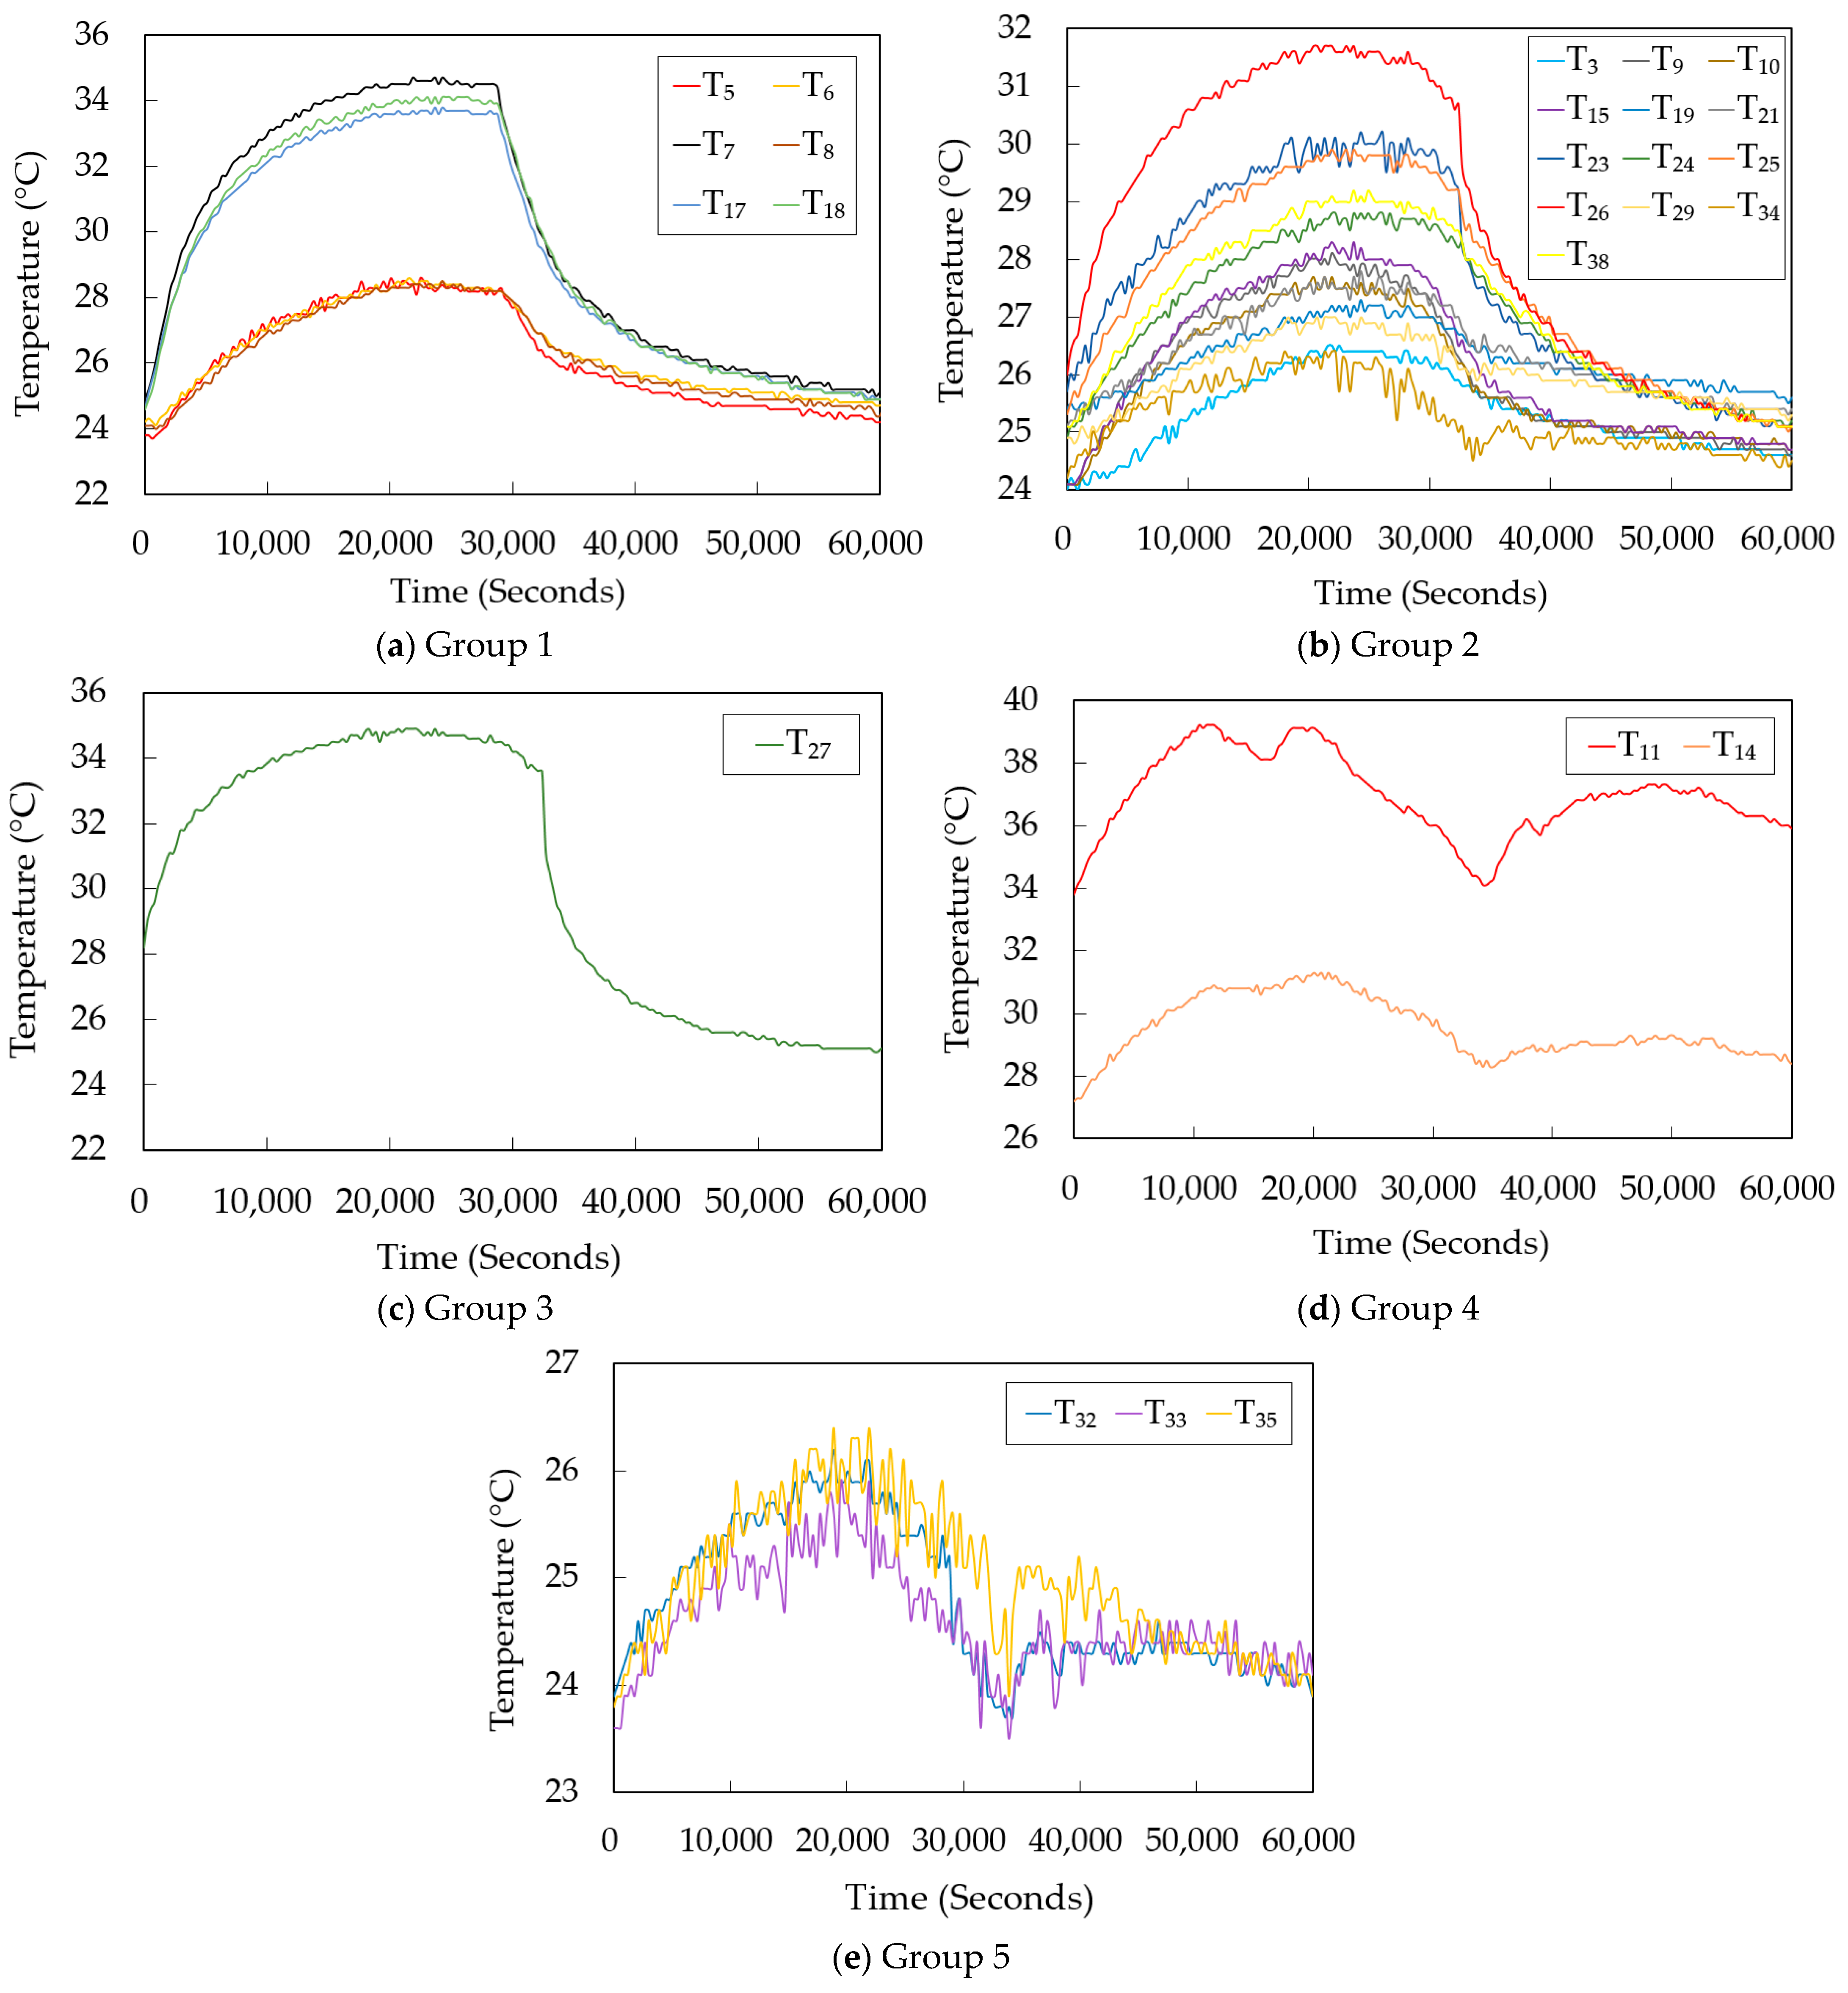
3.1. Environment Establishment and Experimental Result Analysis

In this study, an AWEA VP-2012 (Hsinchu, Taiwan) three-axis gantry-type machining center with a direct drive spindle was the experimental subject, of which the highest rotation speed is 10,000 rpm. According to the heat source and experience analytical results, a total of 47 ITPs were established in different machine structures and positions of the machine tool, as shown in Figure 4 and Table 1, respectively. In Figure 4, T0 is defined as the origin of the mechanical coordinates for AWEA VP-2012, and the absolute Cartesian coordinates for all ITPs are shown in Table A2.
Subsequently, three spindle thermal displacement experiments were conducted in a constant temperature environment of 25 degrees. For each experiment, the spindle thermal displacement was measured in accordance with the “five-point method” from the international standard, and the details are recorded in Section 2.1. The spindle rotation speeds were set to 3000, 6000, and 9000 rpm. For each experiment, the machine was run for 8 h and turned off for another 8 h, as shown in Figure 5. The maximum spindle displacements at 3000, 6000, and 9000 rpm were −18, −39, and −65 µm, respectively. When the machine was turned off after running for 8 h hours, temporary reverse displacement of the spindle in the z-direction was observed. This phenomenon occurred because when the spindle rotation speed was switched between high rates, the resulting centrifugal force changes caused a change in the bearing load, which indirectly affected the contact angle between the inner and outer bearing rings and the balls, leading to changes in spindle displacement in the z-direction. The higher the spindle rotation speed, the greater the axial displacement.
To select the reference point of the temperature increase, the variance of the 47 ITPs T = {T1, T2, …, T47} was be calculated by using Equation (1). The resulting values were then arranged in ascending order. Table 2 lists the serial numbers of the first ten ITPs and their variance. ITP T46 with the smallest variance was set as the reference point Tb. Subsequently, the temperature rise of each ITP (except for the reference ITP) was obtained by subtracting the value of Tb from the ITP value in question, which is denoted as ΔT = T1, ΔT2,…, ΔTn−1 }, where ΔT1 = T1Tb.
At the stage of obtaining KTPs, the correlation coefficients CZ(E, ΔT) between the temperature increase of each ITP and the spindle displacement in the z-direction E were calculated. To simplify observation, the acquired correlation coefficients were arranged in descending order, as presented in Table 3. ITP T17 was set as the first KTP group centroid because it had the strongest correlation with the spindle displacement. Subsequently, the correlation coefficients (CT) between ITP T17 and the other 45 ITPs were determined. Table 4 presents the first ten ITPs in descending order and their corresponding correlation coefficients. The clustering threshold ρ was set to 0.9. ITPs larger than this ρ value were then grouped together. Specifically, T5, T6, T7, T8, and T18 were assigned to group 1, and the ITP T17 was the cluster centroid. The remaining ITPs were continuously analyzed according to their correlations with the spindle displacement, as shown in Table 5. Table 5 indicates that ITP T9 was the centroid of group 2. The correlation coefficients between T9 and the remaining ITPs were determined, as listed in Table 6. According to the clustering threshold ρ, the temperature points belonging to group 2 were then identified. These steps were repeated until all the ITPs were clustered. Finally, 13 clustering results were obtained, as shown in Table 7. Meanwhile, 13 cluster centroids were collected as candidate KTP set TK.
In determining a favorable KTP combination, the x-axis and y-axis of an analysis chart were first defined as the number of KTP and the RMSE, respectively. The number of the KTP of the x-axis means that the several KTPs will be selected, in sequence, beginning from the first one in candidate KTP set TK. For example, two KTPs, T17 and T9, will be picked up in order from the first one in TK when the number of KTP is 2. And, when the number of KTP is 7, seven KTPs will be selected in sequence from the first KTP in TK: T17, T9, T27, T14, T32, T16 and T37. In this case, 13 KTP combinations could be obtained. Placing the RMSE on the y-axis represents the predictive ability of the KTP combination using the data from the 9000 rpm spindle rotation speed rotation experiment. Meanwhile, the spindle thermal displacement model for each KTP combination was individually established by the proposed LSTM modeling method, the details of which are specified in Section 3.3. On the basis of the elbow method, the point corresponding to the elbow of the curve, with relatively convergent clusters, was identified and linked to the corresponding KTP number c on the y axis. This point represents the point where the RMSEs of all KTPs were nearly convergent, and it was thus regarded as the optimal KTP number. Figure 6 shows the RMSEs of a different number of KTPs within the LSTM model at the 9000 rpm spindle rotation speed. It indicates that a turning point occurred when the KTP number was two. When the KTP number was increased to five, the curve no longer exhibited a noticeable decrease, indicating that the optimal number of KTPs is five.

3.2. Analysis of KTP Combinations

Figure 7 shows the temperature trends within the first five groups clustered by the above subsection. The proposed KTP selection method was proven to result in a small intragroup difference and large intergroup difference. Moreover, T17, which was the KTP of group 1 and its group members were all distributed near the spindle motor. The temperature points of group 2 (with T9 being the KTP) were situated above the cross beam, which was close to the spindle motor. The temperature points of group 3 (KTP = T27) were located behind the cross beam on the left, close to the oil chiller. The temperature points of group 4 (KTP = T14) were located on the spindle motor. Three temperature points of group 5 (KTP = T32) represented the environmental temperatures below the spindle head. Figure 8 presents the trend analysis of five KTP temperatures and spindle displacement, revealing considerable differences in temperature increases among the clusters. These results indicate that the proposed KTP selection method has effective grouping ability.

3.3. Model Establishment and Modeling Effect Comparison

To verify that the proposed LSTM modeling method could favorably estimate the spindle thermal displacement, the estimation effectiveness of the proposed model was compared with that of the MLR and BPNN models. The same five KTPs and the spindle speed S were used as the input, and spindle displacement in the z-direction was the output for the three modeling methods. Subsequently, three models of spindle displacement in the z-direction were separately established with the experimental data gathered at different spindle rotations. For the architecture of the ANN, the proposed LSTM and BPNN models were both set to have two hidden layers. Each of the two layers had ten hidden neurons, and the maximum training count was set to 100,000. The training curves of two modeling methods are shown in Figure 9. When the iteration number was 20,000, the proposed LSTM model was close to convergence with fewer errors than the BPNN. By contrast, the BPNN model approached convergence after 100,000 iterations.
For the MLR modeling method, five KTPs and the spindle rotation speed S were the dependent variables, and the spindle thermal displacement in the z-direction was the independent variable. The best-fit coefficients between these independent and dependent variables were then obtained using the least squares method. The established MLR model is expressed in Equation (11).
Z = 0.93246 Δ T 17 + 0.535236 Δ T 9 0.30063 Δ T 27 0.18147 Δ T 14 0.19361 Δ T 32 0.01884 S + 1.08416
where ΔT17, ΔT9, ΔT27, ΔT14, and ΔT32 denote the temperature increase of the KTPs, and S is the spindle rotation speed. Figure 10 presents the results of the MLR, BPNN, and proposed LSTM models at different spindle rotation speeds. In the MLR modeling method, larger estimation errors occurred at the turning point of the spindle displacement curve (e.g., the estimation results at the 4th, 8th, and 12th hour). The largest estimated error reached 12.85 µm when the spindle rotation speed was 9000 rpm. The linear mathematical model is not enough to accurately describe the relationship between the temperature increase and spindle displacement. By contrast, the largest estimated errors for the BPNN and the proposed LSTM modeling methods were 6.96 and 3.22 µm, respectively. The ANN methods significantly outperformed the MLR modeling method. The proposed LSTM modeling method with memory characteristics had the best estimation performance at different spindle rotations.
Table 8 presents the RMSEs of the MLR, BPNN, and the proposed LSTM modeling methods at different spindle rotation speeds. The three modeling methods exhibited a similar trend of more accurate estimations at low spindle speeds. The proposed LSTM modeling method consistently outperformed the MLR and BPNN methods in estimation for every spindle speed.

4. Conclusions

This study aimed to develop a robust and effective spindle thermal displacement modeling method to establish the relationship between the spindle thermal errors and the temperature changes. The selection of KTPs from the machine tool is important information that affects the performance of the prediction model and the cost of system implementation. The KTP selection method proposed to solve this problem removes the ITPs of invalid or highly identical features. The number of KTPs was reduced from 47 possible points to 5. Based on the proposed KTP selection scheme, three type of modeling methods, LSTM, MLR and BPNN, were discussed and compared. The results demonstrate that the performance of ANN-based modeling schemes (LSTM and BPNN) significantly outperformed the MLR modeling method, especially under a high rotation spindle speed. Different to BPNN, the proposed LSTM modeling scheme has a memory characteristic that can keep track of long-term dependencies in the input sequences. The experimental results demonstrate that the RMSE of the proposed LSTM is better than that of a BPNN at all spindle operating conditions. It proves the proposed LSTM is an ideal means of modeling temperature changes and spindle displacement.
The proposed spindle thermal error prediction scheme is verified at 3000, 6000, and 9000 rpm spindle rotation speeds. For the actual cutting state, more training data for modeling on different processing conditions, such as random spindle rotation speeds, need to be further considered and collected to simulate the actual cutting state, changes in temperature increases, and displacement of the spindle under different ambient temperatures. At the same time, the predicted effect of the machine tool in a real cutting stat also needs to be further studied.

Author Contributions

Conceptualization, Y.-C.L.; data curation, K.-Y.L.; investigation, K.-Y.L.; methodology, Y.-C.L.; project administration, Y.-C.L.; resources, Y.-C.L.; software, Y.-C.T.; validation, K.-Y.L.; visualization, Y.-C.T.; writing—original draft, Y.-C.T.; writing—review & editing, Y.-C.L.; All authors have read and agreed to the published version of the manuscript.

Funding

Please add: This research received no external funding.

Acknowledgments

This study was supported in part by grants from the Ministry of Science and Technology of the Republic of China (Taiwan) (Grant No. MOST 109-2221-E-167-014).

Conflicts of Interest

The authors declare no conflict of interest.

Appendix A

Table A1. Nomenclature used in this paper.
ITPInitial Temperature Point.
KTPKey Temperature Point.
BPNNBackPropagation Neural Network.
RMSERoot Mean Square Errors
ANNArtificial Neural Network.
LSTMLong Short-Term Memory.
MLRMultiple Linear Regression.
RNNRecurrent Neural Network
nThe number of ITPs.
ΔTThe temperature differences.
T ¯ The average of temperature.
CZThe correlation coefficient between ΔT of each ITP and the spindle displacement in the z-direction.
AThe number of data.
ZThe actual spindle displacement in the z-direction.
Z ¯ The average of spindle displacement in the z-direction.
yThe estimated output from the estimation model.
TbThe reference point of the temperature rise.
TsThe cluster centroid.
CTThe correlation coefficient between Ts of cluster centroid and the other unclassified IPTs.
ρThe clustering threshold.
vThe number of groups.
rThe number of KTP.
dmax, dminThe maximum and minimum value in the specified data.
xtThe LSTM unit input value of the tth datum.
it, Ui, Wi, biDenoted as the output, input weight, previous output weight, and bias of the input gate.
ft, Uf, Wf, bfDenoted as the output, input weight, previous output weight, and bias of the forget gate.
ot, Uo, Wo, boDenoted as the output, input weight, previous output weight, and bias of the output gate.
c ˜ t Denoted the current neural output.
Ug, Wg, bgDenoted as the output, input weight, previous output weight, and bias of the neural.
ctThe memory cell output.
htThe LSTM unit output.
Table A2. The absolute Cartesian coordinates of all ITPs for experimental machine tool.
ITPsAbsolute Cartesian Coordinates (mm)ITPsAbsolute Cartesian Coordinates (mm)ITPsAbsolute Cartesian Coordinates (mm)
T0(0, 0, 0)T16(140, −64, 260)T32(0, 280, 270)
T1(−150, 269, 1040)T17(140, 64, 420)T33(0, −280, 270)
T2(−150, 269, 780)T18(140, −64, 420)T34(−716, −327, 1190)
T3(−111, −186, 1040)T19(−616, 327, 840)T35(−616, −780, 1080)
T4(−111, −186, 780)T20(−616, 327, 600)T36(−185, −554, 70)
T5(140, 0, 740)T21(−616, 0, 840)T37(−434, 455, 0)
T6(0, 140, 550)T22(−616, 0, 600)T38(−434, 686, 0)
T7(140, 0, 420)T23(−616, −327, 840)T39(−434, −686, 0)
T8(0, −140, 550)T24(−616, −327, 600)T40(−434, −455, 0)
T9(140, 0, 1180)T25(−616, −764, 830)T41(−388, −217, 580)
T10(0, 140, 1120)T26(−616, −552, 610)T42(−388, 0, 580)
T11(−180, 0, 1200)T27(−616, −552, 300)T43(−388, 217, 580)
T12(0, −140, 1120)T28(−275, 556, 990)T44(−265, 0, 580)
T13(140, 0, 190)T29(−275, 0, 990)T45(−265, 217, 580)
T14(140, 0, 1610)T30(−275, −556, 990)T46(1,000, 686, −180)
T15(140, 64, 260)T31(−716, −327, 1560)T47(140, −64, 380)

References

  1. Bryan, J. International Status of Thermal Error Research. CIRP Ann. 1990, 28, 645–656. [Google Scholar] [CrossRef]
  2. Mayr, J.; Jedrzejewski, J.; Uhlmann, E.; Donmez, M.A.; Knapp, W.; Hartig, F.; Wendt, K.; Moriwaki, T.; Shore, P.; Schmit, R.; et al. Thermal issues in machine tools. CIRP Ann. 2012, 61, 771–791. [Google Scholar] [CrossRef] [Green Version]
  3. Postlethwaite, S.R.; Allen, J.P.; Ford, D.G. The use of thermal imaging, temperature and distortion models for machine tool thermal error reduction. Proc. Inst. Mech. Eng. 1998, 212, 671–679. [Google Scholar] [CrossRef]
  4. Kim, H.S.; Jeong, K.S.; Lee, D.G. Design and manufacture of a three-axis ultra-precision CNC grinding machine. J. Mater. Process. Technol. 1997, 71, 258–266. [Google Scholar] [CrossRef]
  5. Sugishita, H.; Nishiyama, H.; Nagayasu, O.; Shin-nou, T.; Sato, H.; O.-hori, M. Development of Concrete Machining Center and Identification of the Dynamic and the Thermal Structural Behavior. CIRP Ann. 1988, 37, 377–380. [Google Scholar] [CrossRef]
  6. Spur, G.; Hoffmann, E.; Paluncic, Z.; Benzinger, K.; Nymoen, H. Thermal Behaviour Optimization of Machine Tools. CIRP Ann. 1988, 37, 401–405. [Google Scholar] [CrossRef]
  7. Tanabe, I.; Takada, K.; Tsutsumi, M. Thermal deformation of machine tool structures using epoxy resin concrete. In Proceedings of the International Machine Tool Design and Research Conference, Manchester, UK, 17–18 September 1986; pp. 245–252. [Google Scholar]
  8. Sun, L.; Ren, M.; Hong, H.; Yin, Y. Thermal error reduction based on thermodynamics structure optimization method for an ultra-precision machine tool. Int. J. Adv. Manuf. Technol. 2017, 88, 1267–1277. [Google Scholar] [CrossRef]
  9. Li, K.Y.; Luo, W.J.; Wei, S.J. Machining Accuracy Enhancement of a Machine Tool by a Cooling Channel Design for a Built-in Spindle. Appl. Sci. 2020, 10, 3991. [Google Scholar] [CrossRef]
  10. Mori, K.; Bergmann, B.; Kono, D.; Denkena, B.; Matsubara, A. Energy efficiency improvement of machine tool spindle cooling system with on–off control. CIRP J. Manuf. Sci. Technol. 2019, 25, 14–21. [Google Scholar] [CrossRef]
  11. Shi, H.; He, B.; Yue, Y.; Min, C.; Mei, X. Cooling effect and temperature regulation of oil cooling system for ball screw feed drive system of precision machine tool. Appl. Therm. Eng. 2019, 161, 114150. [Google Scholar] [CrossRef]
  12. Grama, S.N.; Badhe, A.N. A model-based cooling strategy for motorized spindle to reduce thermal errors. Int. J. Mach. Tools Manuf. 2018, 132, 3–16. [Google Scholar] [CrossRef]
  13. Ramesh, R.; Mannan, M.A. Error compensation in machine tools—A review Part II. Int. J. Mach. Tools Manuf. 2000, 40, 1257–1284. [Google Scholar] [CrossRef]
  14. Zhang, H.; Zhao, W.; Du, C.; Liu, H.; Zhang, J. Dynamic modeling and analysis for gantry-type machine tools considering the effect of axis coupling force on the slider–guide joints’stiffness. Proc. Inst. Mech. Eng. Part B J. Eng. Manuf. 2016, 230, 2036–2046. [Google Scholar] [CrossRef]
  15. Shen, L.; Ding, X.; Li, T.; Kong, X.; Dong, X. Structural dynamic design optimization and experimental verification of a machine tool. Int. J. Adv. Manuf. Technol. 2019, 104, 3773–3786. [Google Scholar] [CrossRef]
  16. Lv, Y.; Li, C.; Tang, Y.; Chen, X.; Zhao, X. Towards Lightweight Spindle of CNC Lathe Using Structural Optimization Design for Energy Saving. In Proceedings of the IEEE International Conference on Automation Science and Engineering (CASE), Hong Kong, China, 20–21 August 2020; pp. 220–225. [Google Scholar]
  17. Li, Y.; Shi, H.; Ji, S.; Liang, F. Thermal Positioning Error Modeling of Servo Axis Based on Empirical Modeling Method. Micromachines 2021, 12, 201. [Google Scholar] [CrossRef]
  18. Lin, C.J.; Su, X.Y.; Hu, C.H.; Jian, B.L.; Wu, L.W.; Yau, H.T. A Linear Regression Thermal Displacement Lathe Spindle Model. Energies 2020, 13, 949. [Google Scholar] [CrossRef] [Green Version]
  19. Chen, T.C.; Chang, C.J.; Hung, J.P.; Lee, R.M.; Wang, C.C. Real-Time Compensation for Thermal Errors of the Milling Machine. Appl. Sci. 2016, 6, 101. [Google Scholar] [CrossRef] [Green Version]
  20. Li, F.; Li, T.; Wang, H.; Jiang, Y. A Temperature Sensor Clustering Method for Thermal Error Modeling of Heavy Milling Machine Tools. Appl. Sci. 2017, 7, 82. [Google Scholar] [CrossRef] [Green Version]
  21. Miao, E.; Liu, Y.; Liu, H.; Gao, Z.; Li, W. Study on the effects of changes in temperature-sensitive points on thermal error compensation model for CNC machine tool. Int. J. Mach. Tools Manuf. 2015, 97, 50–59. [Google Scholar] [CrossRef]
  22. Liu, H.; Miao, E.; Wei, X.Y.; Zhuang, X.D. Robust modeling method for thermal error of CNC machine tools based on ridge regression algorithm. Int. J. Mach. Tools Manuf. 2017, 113, 35–48. [Google Scholar] [CrossRef]
  23. Liu, H.; Miao, E.; Zhuang, X.; Wei, X. Thermal error robust modeling method for CNC machine tools based on a split unbiased estimation algorithm. Int. J. Precis. Eng. 2018, 51, 169–175. [Google Scholar] [CrossRef]
  24. Pozevalkin, V.; Parfenov, V.; Polyakov, N. Approximation of machine tool experimental thermal characteristics by neural network. J. Phys. Conf. Ser. 2019, 1–6. [Google Scholar] [CrossRef] [Green Version]
  25. Jian, B.L.; Wang, C.C.; Hsieh, C.T.; Kuo, Y.P.; Houng, M.C.; Yau, H.T. Predicting spindle displacement caused by heat using the general regression neural network. Int. J. Adv. Manuf. Technol. 2019, 104, 4665–4674. [Google Scholar] [CrossRef]
  26. Jian, B.L.; Guo, Y.S.; Hu, C.H.; Wu, L.W.; Yau, H.T. Prediction of Spindle Thermal Deformation and Displacement Using Back Propagation Neural Network. Sens. Mater. 2020, 32, 431–445. [Google Scholar] [CrossRef]
  27. Reddy, T.N.; Shanmugaraj, V.; Vinod, P.; Krishna, S.G. Real-time Thermal Error Compensation Strategy for Precision Machine tools. Mater. Today Proc. 2020, 22, 2386–2396. [Google Scholar] [CrossRef]
  28. Tian, Y.; Pan, G. An Unsupervised Regularization and Dropout based Deep Neural Network and Its Application for Thermal Error Prediction. Appl. Sci. 2020, 10, 2870. [Google Scholar] [CrossRef] [Green Version]
  29. Yin, Q.; Tan, F.; Chen, H.; Yin, G. Spindle thermal error modeling based on selective ensemble BP neural networks. Int. J. Adv. Manuf. Technol. 2019, 101, 1699–1713. [Google Scholar] [CrossRef]
  30. Zhou, Z.; Hu, J.; Liu, Q.; Lou, P.; Yan, J.; Hu, J.; Gui, L. The selection of key temperature measurement points for thermal error modeling of heavy-duty computer numerical control machine tools with density peaks clustering. Adv. Mech. Eng. 2019, 11, 1–11. [Google Scholar] [CrossRef]
  31. Lou, P.; Liu, N.; Chen, Y.; Liu, Q.; Zhou, Z. The selection of key temperature measuring points for the compensation of thermal errors of CNC machining tools. Int. J. Manuf. Res. 2017, 12, 338–350. [Google Scholar] [CrossRef]
  32. Abdulshahed, A.M.; Longstaff, A.P.; Fletcher, S. The application of ANFIS prediction models for thermal error compensation on CNC machine tools. Appl. Soft Comput. 2015, 27, 158–168. [Google Scholar] [CrossRef]
  33. Kodinariya, T.M.; Makwana, P.R. Review on determining number of Cluster in K-Means Clustering. Int. J. Adv. Res. Comput. Sci. Manag. Stud. 2013, 1, 90–95. [Google Scholar]
  34. ISO. Test Code for Machine Tools-Part 3: Determination of Thermal Effects, Standard ISO/FDIS 230-3; International Organization for Standardization: Geneva, Switzerland, 2001. [Google Scholar]
  35. OMRON Corporation. Available online: https://automation.omron.com/en/us/products/family/ZX-E (accessed on 21 May 2021).
  36. MST Corporation. Available online: http://teknikatools.myfactory.space/mk_urun_pdf/2017121391131.pdf (accessed on 20 May 2021).
  37. Zhanga, C.; Gaoa, F.; Li, Y. Thermal error characteristic analysis and modeling for machine tools due to time varying environmental temperature. Precis. Eng. 2017, 47, 231–238. [Google Scholar] [CrossRef]
  38. Li, Y.; Zhao, W.; Lan, S.; Ni, J.; Wu, W.; Lu, B. A review on spindle thermal error compensation in machine Tools. Int. J. Mach. Tools Manuf. 2015, 95, 20–38. [Google Scholar] [CrossRef]
  39. Hochreiter, S.; Schmidhuber, J. Long short-term memory. Neural Comput. 1997, 9, 1735–1780. [Google Scholar] [CrossRef]
Figure 1. The flowchart of the proposed method.
Applsci 11 05444 g001
Figure 2. Installation description of the displacement sensor and test bar.
Applsci 11 05444 g002
Figure 3. The specifications of the MISUMI NT50-CMA30-225 (Ikoma, Japan) test bar [36].
Applsci 11 05444 g003
Figure 4. Positions of the 47 ITPs for AWEA VP-2012 (Hsinchu, Taiwan).
Applsci 11 05444 g004
Figure 5. Spindle displacement in the z direction at different spindle rotation speeds.
Applsci 11 05444 g005
Figure 6. The root mean square errors (RMSEs) for different number of key temperature point (KTP).
Applsci 11 05444 g006
Figure 7. Temperature trends within the first five groups.
Applsci 11 05444 g007
Figure 8. Trend analysis of five KTP temperatures and spindle displacement.
Applsci 11 05444 g008
Figure 9. Training curve comparison between the proposed LSTM and BPNN models.
Applsci 11 05444 g009
Figure 10. Comparison estimation results of MLR, BPNN, and the proposed LSTM modeling methods at different spindle rotation speeds.
Applsci 11 05444 g010
Table 1. Description of the ITPs corresponding to machine structure positions.
Position on the Machining CenterInitial Temperature Points (ITPs)
SpindleT1, T2, …, T18
Behind the cross beamT19, T20, …, T27
Above the cross beamT28, T29, T30
Environmental temperatureT31, T32, T33, T34, T35
ColumnT36, T37, T38, T39, T40
Below the cross beamT41, T42, T43, T44, T45
BaseT46
Oil chiller inletT47
Table 2. The variance of the first ten ITPs.
Temperature PointVariance
T460.491
T390.532
T360.535
T400.573
T190.586
T200.591
T430.593
T280.596
T340.601
T20.606
Table 3. The strongest negative correlations of five ITPs with spindle displacement.
ITPCorrelation Coefficient Cz
T17−0.959
T7−0.957
T18−0.956
T5−0.911
T9−0.890
Table 4. The ten ITPs with the strongest correlations with T17.
ITPCorrelation Coefficient CT
T180.999
T70.993
T50.965
T60.958
T80.951
T150.899
T90.886
T100.880
T160.852
T210.830
Table 5. The five ITPs with the strongest negative correlations with the spindle displacement.
ITPCorrelation Coefficient Cz
T9−0.890
T15−0.883
T10−0.871
T27−0.851
T23−0.842
T26−0.830
T14−0.807
T25−0.796
T34−0.788
T21−0.785
Table 6. The fifteen ITPs with the strongest correlations with T9.
ITPCorrelation Coefficient CT
T100.995
T150.993
T230.945
T210.943
T340.926
T250.922
T380.921
T290.920
T260.917
T240.909
T30.908
T190.900
T270.898
T140.894
T350.888
Table 7. Final ITP clustering results.
GroupITPsKey Temperature Point (KTP)
1T5, T6, T7, T8, T17, T18T17
2T3, T9, T10, T15, T19, T21, T23, T24, T25, T26, T29, T34, T38T9
3T27T27
4T11, T14T14
5T32, T33, T35T32
6T16, T13, T12,T16
7T4, T20, T22,T28, T30, T37, T40, T41T37
8T1, T2T1
9T31T31
10T47T47
11T42, T43, T44, T45T42
12T39T39
13T36T36
Table 8. RMSEs of the MLR, BPNN, and the proposed LSTM models at different spindle rotation speeds.
Spindle SpeedMLRBPNNLSTM
3000 rpm2.716 µm0.690 µm0.529 µm
6000 rpm3.792 µm0.828 µm0.554 µm
9000 rpm4.966 µm0.958 µm0.625 µm
Publisher’s Note: MDPI stays neutral with regard to jurisdictional claims in published maps and institutional affiliations.

