Featured Application
Left atrial stasis is a useful metric to evaluate hemodynamic recovery of the left atrial after pulmonary vein ablation.
Abstract
Atrial fibrillation (AF) is associated with systemic thrombo-embolism and stroke events, which do not appear significantly reduced following successful pulmonary vein (PV) ablation. Prior studies supported that thrombus formation is associated with left atrial (LA) flow alterations, particularly flow stasis. Recently, time-resolved three-dimensional phase-contrast (4D-flow) showed the ability to quantify LA stasis. This study aims to demonstrate that LA stasis, derived from 4D-flow, is a useful biomarker of LA recovery in patients with AF. Our hypothesis is that LA recovery will be associated with a reduction in LA stasis. We recruited 148 subjects with paroxysmal AF (40 following 3–4 months PV ablation and 108 pre-PV ablation) and 24 controls (CTL). All subjects underwent a cardiac magnetic resonance imaging (MRI) exam, inclusive of 4D-flow. LA was isolated within the 4D-flow dataset to constrain stasis maps. Control mean LA stasis was lower than in the pre-ablation cohort (30 ± 12% vs. 47 ± 18%, p < 0.001). In addition, mean LA stasis was reduced in the post-ablation cohort compared with pre-ablation (36 ± 15% vs. 47 ± 18%, p = 0.002). This study demonstrated that 4D flow-derived LA stasis mapping is clinically relevant and revealed stasis changes in the LA body pre- and post-pulmonary vein ablation.
1. Introduction
Atrial fibrillation (AF) is the most common arrhythmia associated with high morbidity and thrombo-embolism mortality [1]. At age 40 and older, AF lifetime risks increase for both men and women [2]. Previous studies have suggested that reduced flow velocity, i.e., flow stasis, in the left atria (LA) and LA appendage among subjects with paroxysmal AF in sinus rhythm can be an independent predictor of thrombus formation and stroke [3,4,5]. The complex 3-dimensional nature of LA flow can be explored using four-dimensional flow (4D-flow) by magnetic resonance imaging (MRI), which has proved to effectively assess LA stasis [6,7,8]. Furthermore, 4D-flow facilitates the visualization of flow patterns [9,10], vortex formation [8], and other advanced hemodynamic biomarkers [9,10]. In patients where rate control and anti-arrhythmic drugs are insufficient, pulmonary vein (PV) ablation therapy is used to maintain sinus rhythm. Therefore, the assessment of LA stasis changes due to ablation therapy requires further exploration.
This study aims to demonstrate that LA stasis, derived from 4D-flow, is a useful biomarker of LA recovery in patients with AF undergoing PV ablation. Our hypothesis is that LA recovery will be associated with a reduction in LA stasis.
2. Materials and Methods
2.1. Study Population
A total of 172 subjects were recruited prospectively. This included a control cohort (n = 24), a pre-ablation cohort (n = 108) with paroxysmal AF with an over 2-year duration of the first-time diagnosis, and a post-ablation cohort (n = 40) with PV ablation therapy performed 3–6 months prior to imaging exam. A commercial software (Acuity®, Cohesic Inc., Calgary, AB, Canada) was used for the delivery of informed consent, health questionnaires, and collection of MRI-related variables.
Pre-ablation and post-ablation patients were required to be ≥18 years of age and have sinus rhythm at the time of imaging, with no more than mild mitral valve insufficiency, no cardiomyopathy, or complex congenital heart disease. Patients with implantable devices, severe renal impairment (eGFR ≤ 30 mL/min/1.73 m2), or other recognized contraindications to MRI were excluded. Control subjects were required to be ≥18 years of age and have no history of cardiovascular disease, diabetes, or uncontrolled hypertension.
2.2. Risk Score
In all patients, the CHA2DS2-VASc risk score was calculated following current AF guidelines [11,12]. In addition, medical records obtained prior to MRI exam were used to document clinical risk factors for stroke/thrombo-embolism. Patients were given a single point for congestive heart failure/left ventricular (LV) systolic dysfunction, hypertension, diabetes mellitus, vascular disease, age 65–74, female gender, and two points for age ≥ 75 and prior stroke/transient ischemic attack thrombo-embolism [12].
2.3. Cardiac Magnetic Resonance Imaging Protocol
Cardiac imaging examination was performed using 3T MRI scanners (Skyra and Prima, Siemens, Germany). All subjects underwent a standardized clinical imaging protocol inclusive of retrospective electrocardiographic gating, time-resolved balanced steady-state free precession (SSFP) cine imaging in four-chamber, three-chamber, two-chamber, and short-axis views of LV at end-expiration. Contrast usage of gadolinium contrast volume of 0.2 mmol/kg (Gadovist®, Bayer Inc., Mississauga, ON, Canada) was administrated to acquire a contrast-enhanced 3D magnetic resonance angiogram (MRA) of the pulmonary veins in all subjects for assessing LA structure. Time-resolved three-dimensional phase-contrast MRI with three-directional velocity encoding (4D-flow, Siemens WIP 785A) was performed for 5–10 min, following contrast administration to measure in-vivo blood flow velocities within the whole heart. We have previously reported this whole-heart protocol [8,13]. Briefly, 4D-flow data was acquired during free breathing using navigator gating of diaphragmatic motion; sequence parameters were as follows: flip angle = 15 degrees, spatial resolution = 2.0 − 3.5 × 2.0 − 3.5 × 2.5 − 3.5 mm; temporal resolution = 39–48 ms; and velocity sensitivity = 150–200 cm/s. Total acquisition time varies between 8–12 min, depending on heart rate and respiratory navigator efficiency. The number of phases was adjusted to 25.
2.4. Standard Cardiac Imaging Analysis
Standard cardiac images were analyzed by a blinded reader to the study, using dedicated software (cvi42, Circle Cardiovascular Imaging Inc., Calgary, AB, Canada) to determine LV end-diastolic and LV end-systolic volume, LV ejection fraction, LV mass, and LA maximum volume.
2.5. 4D-Flow Data Analysis
4D-flow data were pre-processed for Maxwell terms, eddy current-induced phase offset, and velocity aliasing (if present), Figure 1A. A 3D phase-contrast magnetic resonance angiogram was generated for each subject and used to perform a LA segmentation using an in-house program based on Matlab (Matlab, Mathworks, Natick, MA, USA), Figure 1B. Then, the 4D-flow data set was masked to calculate velocity magnitude and stasis maps, Figure 1C. Velocity magnitude was calculated as follows:
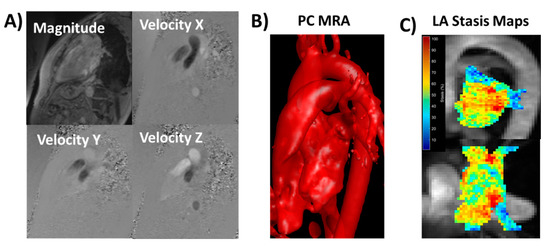
Figure 1.
Data processing and analysis workflow. Panel (A) shows an example of corrected 4D-flow images. Panel (B) illustrates a time-average phase-contrast (PC) magnetic resonance angiogram (MRA) with an optimal threshold for visualizing left atrial (LA) anatomy. The LA was manually segmented using slice-by-slice, isolating the LA volume. Panel (C) shows the calculated LA stasis maps within the LA volume using a sagittal and a top-view maximum intensity projection. Red areas represent high stasis; blue areas represent low stasis.
Velocity magnitude from all voxels inside the isolated LA volume at all cardiac time-frames was used to create a velocity histogram [6,14]. Local peak velocity was obtained by averaging the top 5% of all velocity magnitude values. Local mean and standard deviation velocity were obtained. The relative amount of flow stasis (in percent) was calculated for each voxel by determining the incidence of voxels < 0.1 m/s among the total number of time frames [7,8]. Mean LA stasis was obtained by averaging the relative amount of flow stasis of voxels in the segmented LA volume. Volumetric LA stasis mapping was used to characterize stasis distribution visually.
2.6. Statistical Analysis
Shapiro-Wilk test was used to determine if parameters were normally distributed. To compare parameters within groups, 1-way analysis of variance or Kruskal-Wallis was used. Since AF prevalence increases with age, subjects were divided into three groups (<50 years, between 50 to 60 years, and >60 years) to assess age effect on LA stasis. Tukey’s test or Mann-Whitney U-test were performed for multiple comparisons. Bonferroni correction was used to adjust for multiple comparisons and the differences were considered significant if p < 0.0166. Pearson correlation was calculated to investigate relationships between parameters. Statistical analysis was performed using SPSS 25 (SPSS, Chicago, IL, USA).
3. Results
3.1. Patient Characteristics
Patient baseline demographics are summarized in Table 1. The mean age of the pre-ablation cohort was 58 ± 10 years with 76% of men; the post-ablation cohort was 58 ± 11 years with 80% of men. Both cohorts were significantly older than the control cohort, 38 ± 15 years with 71% of men (p < 0.001). Similar differences were found for weight, body surface area, and diastolic blood pressure (p = 0.001). The mean CHA2DS2-VASc risk score of the pre-ablation patient population was 1.83 ± 0.98 (versus 0.33 ± 0.48 in controls, p < 0.001; and versus 0.81 ± 0.88 in post-ablation patients, p < 0.001). In pre-ablation patients, 2 (1.8%) having a risk score of 0, 47 (43.5%) having a risk score of 1, 34 (31.5%) having a risk score of 2, 18 (16.7%) having a risk score of 3, and 7 (6.5%) having a risk score of ≥4. Post-ablation patients showed a lower average risk score than pre-ablation (0.81 ± 0.88, p < 0.001), with 21 (52.5%) having a risk score of 0, 10 (25%) having a risk score of 1, 8 (20%) having a risk score of 2, and 1 (2.5%) having a risk score of 3. Cohorts showed a significant difference in LA volume (p < 0.001), with higher pre-ablation LA volume than controls (88 ± 29 mL vs. 66 ± 15 mL, p < 0.001), and lower post-ablation LA volume than pre-ablation (74 ± 20 mL vs. 88 ± 15 mL, p = 0.018). LV function remained similar pre- and post-ablation, however, controls differed, showing lower end-systolic volume than pre-ablation cohort (54 ± 11 mL vs. 69 ± 20 mL, p = 0.002). Ejection fraction was reduced in AF cohorts (p < 0.004), with similar values pre- and post-ablation.

Table 1.
Data baseline.
3.2. Left Atrial Hemodynamic Assessment
Control mean LA stasis was lower than in the pre-ablation cohort (30 ± 12% vs. 47 ± 18%, p < 0.001). Mean LA stasis was reduced in the post-ablation cohort as compared with pre-ablation (36 ± 15% vs. 47 ± 18%, p = 0.002), Figure 2A. Both pre- and post-ablation cohorts showed elevated standard deviation LA stasis as compared with controls (23 ± 5% vs. 17 ± 3%, p < 0.001; 22 ± 5% vs. 17 ± 3%, p = 0.001, Figure 2B). Similarly, mean LA velocity and standard deviation also decreased, Figure 2C,D.
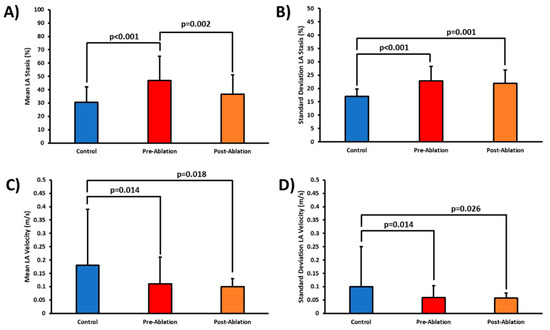
Figure 2.
Left atrial stasis and velocity in controls, pre-ablation, and post-ablation patients. Panel (A) shows the comparison of all cohorts for mean left atrial (LA) stasis. Panel (B) shows the comparison of standard deviation LA stasis. Panels (C) and (D) show the comparison for all cohorts for mean and standard deviation LA velocity.
When comparing age groups, subjects older than 60-year-old showed an increased LA volume compared with the younger group of 50-year-old (88 ± 29% vs. 73 ± 19%, p = 0.01, Figure 3A). Standard deviation LA stasis increased with age when considering all subjects (p < 0.001, Figure 3B). Subjects between 50 and 60 years showed an increment of 13% in standard deviation LA stasis as compared with the younger cohort of 50-year-old (p = 0.008). Similarly, an increment of 21% was observed in the older cohort of >60-year-old (p < 0.001). LA volume was >100 mL in 20% of subjects with an increased stasis compared with a lower LA volume of 60 mL, which included 45 subjects (23 ± 6% vs. 20 ± 5%, p = 0.033). Overall, subjects with risk score > 2 (n = 26) showed more increased standard deviation LA stasis than those with a risk score of 0 (n = 122) (24 ± 5% vs. 21 ± 5%, p = 0.031). No association was found with LA peak velocity, mean velocity, or standard deviation velocity.
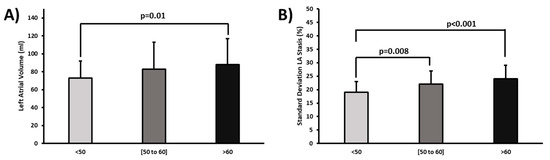
Figure 3.
Age comparison for left atrial volume and standard deviation stasis. Panel (A) shows the comparison of age groups for left atrial (LA) volume. Panel (B) indicates the comparison of age groups for standard deviation LA stasis.
4. Discussion
This study illustrates the usefulness of 4D-flow to quantify and assess LA stasis. The main findings of our study were: (1) LA stasis can be substantially reduced after PV ablation; (2) Standard deviation LA stasis and atrial volume significantly increase with age; (3) Standard deviation LA stasis was higher in patients with risk score > 2 pre-ablation and was reduced post-ablation.
Virchow’s triad is widely accepted and defines the main factors leading to thrombogenesis [15]. These factors include abnormal stasis or reduced blood flow, endothelial/endocardial injury or dysfunction, and hypercoagulability. Time-resolved 4D-flow provides a non-invasive characterization of LA hemodynamics and has been used to assess AF patients pre-ablation [7,8,16]. As derived from 4D-flow, LA stasis may serve as an essential biomarker that characterizes the predisposition to atrial thrombogenesis to that of regular risk predictors (e.g., CHA2DS2-VASc Score). Despite the comprehensive assessment obtained by 4D-flow, an accurate 3D segmentation is required. In our study, semi-manual segmentation was obtained. A careful selection of intensity threshold can facilitate the appropriate visualization of PV and LA appendage. Fluckiger et al. reported comparable mean flow velocity in the LA between paroxysmal AF patients and controls [14]. In our study, the mean LA velocity was significantly reduced in pre-ablation and post-ablation, which aligned with a more extensive study conducted by Lee et al. [17]. The latter was supported by other recent studies [6,8,16]. Significant inverse relationships between LA mean/peak velocity and risk score were reported in previous studies [6,17]. In our study, no significant associations were found for LA mean/peak and standard deviation velocities. Much of the attention has been given to the LA appendage as the primary source of thrombus formation in AF. A previous study from Markl et al. suggested that atrial flow dynamics are disrupted in AF patients, even during coordinated activity, thus suggesting an AF component that may be unrecognized [6]. In one of our recent studies, we demonstrated that vortex formation within the LA is influenced by pulmonary vein inflow velocities and LA remodeling with a higher prevalence of stasis [8]. There may be an interplay between the functional (LA volume, pressure overload, and dilation) and hemodynamic features (stasis, vortex formation, energetics, and flow patterns). The associations between these factors are complex and may have compensatory effects. However, identifying irreversible recovery should warn for earlier detection of complications or adverse outcomes [18,19]. Despite the lack of significant change in LA velocities between the pre-ablation and post-ablation cohort, we were able to detect an improvement via mean LA stasis. Note that LV and LA standard metrics also failed to detect a significant change pre- and post-ablation.
Overall, these findings put in context new evidence characterizing paroxysmal AF complex hemodynamics. However, current guidelines rely on clinical factors and comorbidities, with the exclusion of AF burden, atrial size, flow hemodynamics, and other factors that may suggest more advanced atrial disease and this higher risk of thromboembolic events [20]. Therefore, including the above-mentioned factors may help to improve long-term LA recovery outcomes.
This study has some limitations, including limited patients matching pre and post-ablation, follow-up of AF recurrence, age-matching, and manual static segmentation. Our study excluded patients with more than mild mitral insufficiency, given that it is anticipated to be a potential confounder to LA hemodynamics and baseline characteristics. Clinical background decision for ablation referral was not individually investigated. Our segmentations did not separate LA volume from the LA appendage, which can be useful for a better characterization of LA stasis. However, LA appendage measurements may be affected by the high noise levels and the influence of low spatial resolution. For all subjects, we used an optimized 4D-flow WIP sequence for Siemens scanners. However, this sequence is based on average data over multiple heart cycles, which is known to limit the assessment of arrhythmic effects. The latter justifies, in part, that all our subjects were in sinus rhythm. Recent developments are leading towards multi-dimensional and self-gated acquisition frameworks that may allow better to explore heart variability and its hemodynamics [21]. However, these developments are still in the early stage, require high computational cost, and are not widely accessible for clinical application.
5. Conclusions
This study demonstrated that 4D-flow could characterize relevant LA blood flow stasis changes in patients with AF undergoing PV isolation.
Author Contributions
Conceptualization, H.S., S.W., J.A.W., and J.G.; methodology, H.S., J.G.; software, H.S., H.K., J.G.; validation, S.W., J.A.W. and J.G.; formal analysis, H.S., J.G.; investigation, J.G.; resources, J.G.; data curation, H.S., H.K., and J.G.; writing—original draft preparation, H.S., J.G.; writing—review and editing, H.S., H.K., S.W., J.A.W.; visualization, J.G.; supervision, J.G.; project administration, J.G.; funding acquisition, J.G. All authors have read and agreed to the published version of the manuscript.
Funding
This research was funded by The University of Calgary, URGC SEM #1054341; J.G. start-up funding; H.S. received support from The Libin Cardiovascular Institute, H.K. from the Biomedical Engineering graduate program. We acknowledge the support of the Natural Science and Engineering Research Council of Canada/Conseil de recherche en science naturelles et en génie du Canada, RGPIN-2020-04549 and DGECR-2020-00204.
Institutional Review Board Statement
The study was conducted according to the guidelines of the Declaration of Helsinki and approved by the Conjoint Health Research Ethics Board of University of Calgary (REB13-0902 approved on 6/18/2014; and currently active MOD11 approved on 10/5/2020).
Informed Consent Statement
Written informed consent was obtained from all subjects involved in the study.
Data Availability Statement
The anonymized data presented in this study are available on request from the corresponding author. The data are not publicity available due to privacy and ethical restrictions.
Acknowledgments
We thank Easter Prosia for her assistance in verifying heart volume measurements and Sandra Rivest for English editing revision.
Conflicts of Interest
The authors declare no conflict of interest.
References
- Fuster, V.; Rydén, L.E.; Cannom, D.S.; Crijns, H.J.; Curtis, A.B.; Ellenbogen, K.A.; Halperin, J.L.; Kay, G.N.; Le Huezey, J.-Y.; Lowe, J.E.; et al. ACCF/AHA/HRS focused updates incorporated into the ACC/AHA/ESC 2006 guidelines for the management of patients with atrial fibrillation: A report of the American College of Cardiology Foundation/American Heart Association Task Force on practice guidel. Circulation 2011, 123, e269–e367. [Google Scholar] [CrossRef] [PubMed]
- Lloyd-Jones, D.M.; Wang, T.J.; Leip, E.P.; Larson, M.; Levy, D.; Vasan, R.S.; D’Agostino, R.B.; Massaro, J.M.; Beiser, A.; Wolf, P.A.; et al. Lifetime Risk for Development of Atrial Fibrillation. Circulation 2004, 110, 1042–1046. [Google Scholar] [CrossRef] [PubMed]
- Goldman, M.E.; Pearce, L.A.; Hart, R.G.; Zabalgoitia, M.; Asinger, R.W.; Safford, R.; Halperin, J.L. Pathophysiologic correlates of thromboembolism in nonvalvular atrial fibrillation: I. Reduced flow velocity in the left atrial appendage (The Stroke Prevention in Atrial Fibrillation [SPAF-III] study). J. Am. Soc. Echocardiogr. 1999, 12, 1080–1087. [Google Scholar] [CrossRef]
- Zabalgoitia, M.; Halperin, J.L.; Pearce, L.A.; Blackshear, J.L.; Asinger, R.W.; Hart, R.G. Transesophageal echocardiographic correlates of clinical risk of thromboembolism in nonvalvular atrial fibrillation. Stroke Prevention in Atrial Fibrillation III Investigators. J. Am. Coll. Cardiol. 1998, 31, 1622–1626. [Google Scholar] [CrossRef]
- Fyrenius, L.; Wigström, T.; Ebbers, M.; Karlsson, J.; Engvall, A.; Bolger, F. Three dimensional flow in the human left atrium. Heart 2001, 86, 448–455. Available online: http://www.ncbi.nlm.nih.gov/pubmed/11559688 (accessed on 14 April 2021). [CrossRef]
- Markl, M.; Lee, D.; Furiasse, N.; Carr, M.; Foucar, C.; Ng, J.; Carr, J.; Goldberger, J.J. Left Atrial and Left Atrial Appendage 4D Blood Flow Dynamics in Atrial Fibrillation. Circ. Cardiovasc. Imaging 2016, 9, e004984. [Google Scholar] [CrossRef]
- Markl, M.; Lee, D.C.; Ng, J.; Carr, M.; Carr, J.; Goldberger, J.J. Left Atrial 4-Dimensional Flow Magnetic Resonance Imaging: Stasis and Velocity Mapping in Patients With Atrial Fibrillation. Investig. Radiol. 2016, 51, 147–154. [Google Scholar] [CrossRef]
- Garcia, J.; Sheitt, H.; Bristow, M.S.; Lydell, C.; Howarth, A.G.; Heydari, B.; Prato, F.S.; Drangova, M.; Thornhill, R.E.; Nery, P.; et al. Left atrial vortex size and velocity distributions by 4D flow MRI in patients with paroxysmal atrial fibrillation: Associations with age and CHA2 DS2-VASc risk score. J. Magn. Reson. Imaging 2020, 51, 871–884. [Google Scholar] [CrossRef]
- Dyverfeldt, P.; Bissell, M.; Barker, A.J.; Bolger, A.F.; Carlhäll, C.-J.; Ebbers, T.; Francios, C.J.; Frydrychowicz, A.; Geiger, J.; Giese, D.; et al. 4D flow cardiovascular magnetic resonance consensus statement. J. Cardiovasc. Magn. Reson. 2015, 17, 72. [Google Scholar] [CrossRef]
- Garcia, J.; Barker, A.J.; Markl, M. The Role of Imaging of Flow Patterns by 4D Flow MRI in Aortic Stenosis. JACC Cardiovasc. Imaging 2019, 12. [Google Scholar] [CrossRef]
- January, C.T.; Wann, L.S.; Alpert, J.S.; Calkins, F.H.; Cigarroa, J.E.; Cleveland, J.C.; Conti, J.B.; Ellinor, P.T.; Ezekowitz, M.D.; Field, M.E.; et al. 2014 AHA/ACC/HRS guideline for the management of patients with atrial fibrillation: Executive summary: A report of the American College of Cardiology/American Heart Association Task Force on practice guidelines and the Heart Rhythm Society. Circulation 2014, 130, 2071–2104. [Google Scholar] [CrossRef]
- Lip, G.Y.H.; Nieuwlaat, R.; Pisters, R.; Lane, D.A.; Crijns, H.J.G.M. Refining clinical risk stratification for predicting stroke and thromboembolism in atrial fibrillation using a novel risk factor-based approach: The euro heart survey on atrial fibrillation. Chest 2010, 137, 263–272. [Google Scholar] [CrossRef]
- Garcia, J.; Beckie, K.; Hassanabad, A.F.; Sojoudi, A.; White, J.A. Aortic and mitral flow quantification using dynamic valve tracking and machine learning: Prospective study assessing static and dynamic plane repeatability, variability and agreement. JRSM Cardiovasc. Dis. 2021, 10, 204800402199990. [Google Scholar] [CrossRef]
- Fluckiger, J.U.; Goldberger, J.J.; Lee, D.; Ng, J.; Lee, R.; Goyal, A.; Markl, M. Left atrial flow velocity distribution and flow coherence using four-dimensional FLOW MRI: A pilot study investigating the impact of age and Pre- and Postintervention atrial fibrillation on atrial hemodynamics. J. Magn. Reson. Imaging 2013, 38, 580–587. [Google Scholar] [CrossRef]
- Watson, T.; Shantsila, E.; Lip, G.Y. Mechanisms of thrombogenesis in atrial fibrillation: Virchow’s triad revisited. Lancet 2009, 373, 155–166. [Google Scholar] [CrossRef]
- Demirkiran, A.; Amier, R.P.; Hofman, M.B.M.; van der Geest, R.J.; Robbers, L.F.H.J.; Hopman, L.H.G.A.; Mulder, M.J.; van de Ven, P.; Allaart, C.P.; van Rossum, A.C.; et al. Altered left atrial 4D flow characteristics in patients with paroxysmal atrial fibrillation in the absence of apparent remodeling. Sci. Rep. 2021, 11, 5965. [Google Scholar] [CrossRef] [PubMed]
- Lee, D.C.; Markl, M.; Ng, J.; Carr, M.; Benefield, B.; Carr, J.C.; Goldberger, J.J. Three-dimensional left atrial blood flow characteristics in patients with atrial fibrillation assessed by 4D flow CMR. Eur. Hear. J. Cardiovasc. Imaging 2016, 17, 1259–1268. [Google Scholar] [CrossRef] [PubMed]
- Burstein, B.; Nattel, S. Atrial fibrosis: Mechanisms and clinical relevance in atrial fibrillation. J. Am. Coll. Cardiol. 2008, 51, 802–809. [Google Scholar] [CrossRef]
- Shen, M.J.; Arora, R.; Jalife, J. Atrial Myopathy. JACC Basic Transl. Sci. 2019, 4, 640–654. [Google Scholar] [CrossRef]
- January, C.T.; Wann, L.S.; Calkins, H.; Chen, L.Y.; Cigarroa, J.E.; Cleveland, J.C.; Ellinor, P.T.; Ezekowitz, M.D.; Field, M.E.; Furie, K.L. 2019 AHA/ACC/HRS Focused Update of the 2014 AHA/ACC/HRS Guideline for the Management of Patients With Atrial Fibrillation: A Report of the American College of Cardiology/American Heart Association Task Force on Clinical Practice Guidelines and the Heart R. Circulation 2019, 140, e125–e151. [Google Scholar] [CrossRef]
- Ma, L.; Yerly, J.; Di Sopra, L.; Piccini, D.; Lee, J.; DiCarlo, A.; Passman, R.; Greenland, P.; Kim, D.; Stuber, M.; et al. Using 5D flow MRI to decode the effects of rhythm on left atrial 3D flow dynamics in patients with atrial fibrillation. Magn. Reson. Med. 2021, 85, 3125–3139. [Google Scholar] [CrossRef]
Publisher’s Note: MDPI stays neutral with regard to jurisdictional claims in published maps and institutional affiliations. |
© 2021 by the authors. Licensee MDPI, Basel, Switzerland. This article is an open access article distributed under the terms and conditions of the Creative Commons Attribution (CC BY) license (https://creativecommons.org/licenses/by/4.0/).