Article

Synergistic Effects of Heat-Moisture Treatment Regime and Grape Peels Addition on Wheat Dough and Pasta Features

Faculty of Food Engineering, Stefan Cel Mare University of Suceava, 13 Universitatii Street, 720229 Suceava, Romania
*
Authors to whom correspondence should be addressed.
Appl. Sci. 2021, 11(12), 5403; https://doi.org/10.3390/app11125403
Submission received: 10 May 2021 / Revised: 31 May 2021 / Accepted: 7 June 2021 / Published: 10 June 2021
(This article belongs to the Special Issue Effects of Plants’ Ingredients on Dough and Final Product)

Abstract

:
Heat moisture treatment (HMT) can be a useful method of wheat flour functionality modification, improving the nutritional value of pasta along with grape peels (GPF) addition. The aim of this study was to investigate the combined effects of HMT temperature, time, and moisture and GPF level on dough and pasta properties. Dough rheology and texture, pasta color, texture, total polyphenols (TPC), dietary fiber (DF), and resistant starch (RS) contents were evaluated. Furthermore, an optimization was performed based on Response Surface Methodology (RSM) and desirability function. The results showed that HMT regime and GPF determined proportional dough viscoelastic moduli and firmness increase. On the other hand, cooked pasta firmness and gumminess decreased with HMT conditions and GPF level rise. Higher pasta RS and DF content was promoted by HMT and GPF components. The reduction effect of HMT on TPC was countered by the incorporation of GPF, a rich source of polyphenols. The optimization revealed that the recommended wheat flour treatment regime would be 87.56 °C, 3 h, and 26.01% moisture, while the quantity of GPF that could be added was 4.81%. For these values, the maximum functional and nutritional values would be achieved with minimum negative impact on pasta quality.

1. Introduction

Wheat flour is the basic ingredient for many staple foods, such as bread, pasta, muffins, biscuits, etc., consumed worldwide. Food industry evolution implies the development of novel products with high nutritional value that could capture consumers’ attention. In countries such as Romania, where the cultivated area of durum wheat (Triticum durum) is small, only 1% of the total wheat cultivated area [1], pasta producers usually use common (Triticum aestivum) wheat flour for short pasta manufacturing, trying to achieve the quality of durum wheat pasta by employing special processing technologies such as vacuum dough mixing and extrusion.
The nutritional and technological behavior of wheat flour can be changed by applying various physical treatments, one of them being heat-moisture treatment (HMT) which implies flour heating at higher level than the gelatinization temperature and under water restriction (<35%) [2]. HMT is an easy to control process and it is eco-friendly compared to chemical modifications of starch-based matrices. The intensities of component change in wheat flour during treatment depends on the regime applied (temperature, time, and moisture level), but also on the interactions between molecules, especially starch-protein and starch-lipids [3]. The main effects of HMT consist of starch crystalline area disruption, double helices destruction, and a reorganization of the crystallites and interactions between wheat polymer chains [4]. These molecular changes lead to nutritional value enhancement, but also to different technological properties of the final product. Some studies have revealed positive effects of HMT, including improving starch digestibility, increasing resistant and slowly digestible starch, and lowering rapid digestible starch values [4,5]. Dough rheological properties and final product texture are affected by flour treatment, depending on the amylose content, starch shape deformation that may occur, starch swelling and interactions between continuous and dispersed phases [3,6]. Liao et al. [7] reported higher elastic and viscous moduli of vermicelli pasta dough from HMT potato starch as the moisture content applied was higher, with the textural parameters in terms of hardness, springiness and chewiness also increasing with treatment moisture increase.
The wine industry generates high amounts of valuable by-products that can be successfully incorporated in food formulations as functional ingredients due to their raised quantity of dietary fibers and bioactive compounds with antioxidant properties [8,9]. Grape peels are rich in dietary fibers, 98.5% being represented by insoluble fractions, the chemical composition depending on the variety and vinification process [10]. The potential of grape peels to inhibit oxidative processes is given by their high contents of polyphenols such as anthocyanins, hydroxycinnamic acids, catechins, and flavonols [10,11]. Therefore, grape peels can be used to increase the nutritional and functional value of foods. Gaita et al. [12] reported higher polyphenolics and antioxidant activities of pasta enriched with grape peels. According to the data presented by Savla and Yardi [13], the addition of 5% grape pomace to gluten free pasta caused the increase of fiber content 13.50 times compared to the control. Tolve et al. [14] obtained increases of total polyphenolics content of pasta with grape pomace of 200–500% compared to the control. Gaceu et al. [15] stated that wheat flour supplemented by 15% grape peels presented 90% more fiber than flour without addition, while the calcium and potassium contents were improved by more than 150%. Sant’Anna et al. [16] reported higher cooking loss (5.38–6.35%) of fettuccini pasta with 25–75 g/kg grape marc incorporated, compared to the control (5.45%).
The rheological tests can give valuable information about the interactions between grape peels and wheat flour components and gluten matrices, and could differentiate the rheological behavior of supplemented flour dough during mixing, modelling and drying [17]. Frequency sweep tests can provide information about the differences of dough structures between samples with different ingredients added [18]. For this purpose, the deformation frequency is increased progressively at a constant amplitude of the strain. The results obtained at low frequencies led to the behavior of dough at slow changes of stress, while at high frequencies information of dough response to fast load is given [18]. Dough rheology and final product texture could be negatively affected by the addition of fiber-rich ingredients, depending on the amount and particle size. In order to minimize the negative effects of grape peels addition on dough rheological and pasta texture properties due to the gluten dilution, a small particle size could be used since a smaller impact was observed in previous studies [19]. According to the literature, wheat dough with grape peels added presented higher hardness compared to the control [20], with the elastic and viscous moduli being higher compared to the control [17]. The data presented by Tolve et al. [14] showed an increase in durum wheat pasta firmness of 30% and an increase in adhesiveness caused by the addition of grape pomace, while uncooked pasta luminosity decreased from 65.95 to 43.55 [14].
In Europe, pasta is usually made from durum semolina, while for Asian noodle manufacturing soft wheat flour is used [21]. Soft wheat pasta is usually processed by sheeting and cutting, while pasta from durum wheat is cold-extruded. Thus, compared to durum wheat pasta, soft wheat pasta has a softer and more elastic structure, with a color that ranges from “white to creamy white to moderately yellow”. Durum wheat products are characterized as having a harder structure, intense yellow nuance, nutty flavor, stability to overcooking, and a particular eating quality [22]. The intrinsic properties of wheat flour and the processing conditions are the most important factors that influence pasta cooking quality [23].
There are a few researches presenting the impact of HMT applied to wheat. Furthermore, even if there are some papers that showed the influence of grape peels on dough and final product properties, to our knowledge, no studies have been published regarding the combined effect of HMT and grape peels addition on common wheat dough and pasta quality. Thus, the aim of this investigation was to evaluate the synergistic effects of HMT regime in terms of temperature, time, and moisture content and grape peels addition level on dough rheology and texture and on pasta’s functional, physical, and textural properties in order to optimize the production process.

2. Materials and Methods

2.1. Materials and Treatment Regime

The wheat flour used for investigation belonged to the Triticum aestivum species and was produced in 2019 by Dizing S.R.L. (Brusturi, Neamt, Romania). Grape peels flour (GPF) of the Feteasca Regala variety coming from Iasi Research and Development Center for Viticulture and Vinification (Iasi, Romania) was obtained from grinding in a Kitchen Aid mill (Whirlpool Corporation, Benton Harbor, MI, USA), after manual separation from dried pomace. The particle size of <180 μm was achieved by sieving the resultant flour on a Retsch Vibratory Sieve Shaker AS 200 basic (Retsch GmbH, Haan, Germany). The magnitude of changes caused by heat moisture treatment (HMT) depend on wheat botanical origin, amylose and amylopectin contents, and treatment conditions such as temperature, moisture, and time [6]. The conditions of HMT should be selected in function of cereal type, since native starches present different properties, especially different amylose-amylopectin ratio, and have different processing requirements [24].
HMT of wheat flour was done according to a process outlined in a previous study [25]. The desired moisture was achieved by calculating the appropriate amount of water, according to the native flour moisture previously determined (Figure 1). Water was incorporated in small portions into wheat flour samples by continuous mixing in a sealed system of a Kitchen Aid mixer (Whirlpool Corporation, Benton Harbor, MI, USA), and the mix was placed in hermetically sealed glass containers in 2 cm layers (about 200 g). After 24 h of resting at 20 °C for moisture equilibration, the samples were placed in a convection oven for the given time in agreement with the experimental matrix, which was calculated after 30 min of sample thermalization. After 30 min of cooling, the treated flour was dried at 40 °C for 12 h, ground, and sieved to obtain a particle size of <300 μm.

2.2. Dough and Pasta Manufacturing

Composite flours from treated wheat flour and grape peels were obtained by 15 min mixing the appropriate amounts of ingredients in a Yucebas Y21 machine (Izmir, Turkey).
Pasta dough with a moisture of 40% was produced by adding the corresponding water to the flour (according to the moisture previously established) and mixing for 5 min in a Kitchen Aid mixer (Whirlpool Corporation, Benton Harbor, MI, USA). Moisture contents were checked with a Kern DBS thermobalance with infrared emission quartz heaters (Kern, Balingen, Germany). The dough was put for at least 15 min in sealed containers for moisture equilibration, then the pasta was modeled using a rigatoni mold accessory of the Kitchen Aid mixer. Pieces of dough were subjected to rheological and texture analysis before pasta modelling. Samples were dried first for 30 min at 20 °C, then 60 min at 40 °C, 120 min at 80 °C, and 120 min at 40 °C [26]. After cooling, pasta was packed in polyethylene bags and kept in a dry place until analysis.

2.3. Synergistic Effects of HMT and GPF on Dough Properties

2.3.1. Dough Rheological Behavior

Dynamic rheological testing was carried out by means of frequency sweep analysis on a Thermo-HAAKE, MARS 40 (Karlsruhe, Germany) device. Laminated dough samples rested for at least 15 min [27] were placed between the parallel plates at a gap of 3 mm, and the edges were sealed with Vaseline to avoid water evaporation. The elastic (G’) and viscous (G”) moduli variation with frequency were registered at 20 °C in triplicate by increasing the range from 0.1 to 20 Hz, at a strain of 15 Pa, in the linear viscoelastic region previously established. For further optimization, the values of G’ and G” at 1 Hz frequency were considered.

2.3.2. Dough Texture

Texture profile analysis (TPA) was used to evaluate dough firmness in triplicate by double cycle compression on a Perten TVT-6700 texturometer (Perten Instruments, Hägersten, Sweden). For this purpose, a spheric piece of dough of 50 g was subjected to analysis at a testing speed of 5.0 mm/s and a trigger force of 20 g [28], with a 35 mm cylindrical probe. The measurements were performed the same day as pasta manufacturing, at 20 °C.

2.4. Synergistic Effects of HMT and GPF on Dry Pasta Properties

2.4.1. Dry Pasta Color

CIE Lab system was used for pasta color property evaluation, the measurements being done on a Konica Minolta CR-400 (Konica Minolta, Tokyo, Japan) colorimeter. The calibration of the device was performed with a standard white [28]. Sample luminosity (L*) was reported as mean of three determinations. Durum wheat pasta of good quality has a bright yellow color given by the presence of natural carotenoid pigments [29], while soft wheat pasta has a “white to creamy white to moderately yellow” appearance [21].

2.4.2. Total Polyphenolics Content (TPC)

The method described by Melilli et al. [30] was carried out to prepare pasta extracts for TPC determination. Mixes of 1:10 of ground sample with methanol (80% v/v) were vortexed and put on a sonication water bath at 37 °C and 45 Hz for 40 min. After filtration on a Whatman paper with 125 μm pores dimensions, portions of 200 μL were mixed with 800 μL distillated water, 500 μL of Folin–Ciocalteu reagent (1N) and 2500 μL of sodium carbonate (20% v/v). Triplicate samples were prepared and were left to rest in a dark place for 40 min, then the absorbance at 725 nm was measured on a UV–VIS–NIR Shimadzu 3600 (Tokyo, Japan) device. The calibration curve was made with gallic acid and the coefficient of determination was R2 = 0.99. The results were expressed as mg GAE/100 g of pasta as it is.

2.4.3. Dietary Fiber Content (DF)

An Infrared FOSS 6500 NIR (Foss, Silver Springs, FL, USA) device was employed to estimate the DF content. Ground pasta was subjected to analysis at room temperature and the spectrometer was calibrated by using INGOT calibrations (AUNIR, Towcester, UK). Three measurements were performed for each experiment and the results were reported on dry pasta as it is.

2.5. Synergistic Effects of HMT and GPF on Cooked Pasta Properties

Pasta was boiled according to the optimum cooking time considered when the white core of uncooked starch disappeared.

2.5.1. Cooked Pasta Texture

Pasta texture was evaluated by TPA, firmness and gumminess parameters being registered in triplicate. For this purpose, one piece of pasta was subjected to double compression with a cylindrical probe of 35 mm, at a height of 50%, a speed of 5.0 mm/s, and a trigger force of 20 g [28]. Measurements were performed on a Perten TVT-6700 device (Perten Instruments, Hägersten, Sweden).

2.5.2. Resistant Starch (RS) Determination

Fresh boiled pasta resistant starch content was determined by using a Megazyme kit (Cat. No. K-DSTRS; Megazyme, Bray, Ireland), according to the standard method AOAC 2017.16. The principle of the method was to digest the sample with α-amylase and a-myloglucosidase for 4 h and to quantify spectrophotometrically (at 510 nm) the resultant glucose by using GOPOD reagent.

2.6. Optimization of HMT Regime and GPF Addition

The Design Expert software (Stat-Ease, Inc., Minneapolis, MN, USA) trial version was employed to create the experimental matrix in order to evaluate the effects of factors (temperature, time, moisture, GPF level) on the considered responses (dough G’, G”, firmness, pasta color, TPC, DF, firmness, gumminess and RS content). The study was carried out on 30 resulting experiments (Table 1). Response surface methodology (RSM) with a central composite design (CCD) was used for experiment planning and data processing. The option of face centered at α = 1 with six points at the center and three repetitions for each experiment was selected. Mathematical model fittings were evaluated trough F sequential test, coefficient of determination (R2), and adjusted coefficients of determination (Adj.-R2). Analysis of Variance (ANOVA) performed by Design Expert software was used to establish the significant effects at p < 0.05 of the factors and their interactions on the responses. The optimization of HMT regime and GPF level was done by means of desirability function. The constraints applied consisted of maximization of G’, G”, TPC, RS, DF, and pasta firmness, while L*, dough hardness, and pasta gumminess were kept within the range.
RSM is a well-known tool successfully employed in different industries, with various applications in food formulation, quality, and processing technologies optimization. RSM is based on simple algebraic equations although they present an advantage regarding ease of use [31].

3. Results

Dough elastic and viscous moduli, firmness, pasta color, polyphenolics contents, dietary fiber content, pasta firmness, gumminess, and resistant starch content responses were fitted to the quadratic polynomial regression model. The quadratic models (Equation (1)) were selected because they presented the highest Adj.-R2 values compared to other mathematical models proposed:
Y = x 0 + x 1 A + x 2 B + x 3 C + x 4 D + x 5 AB + x 6 AC + x 7 BC + x 8 AD + x 9 CD + x 10 BD + x 11 A 2 + x 12 B 2 + x 13 C 2 + x 14 D 2
where Y is the response, x0-x9 are the regression coefficients, and A, B, C, and D are the factors.

3.1. Pasta Dough Properties

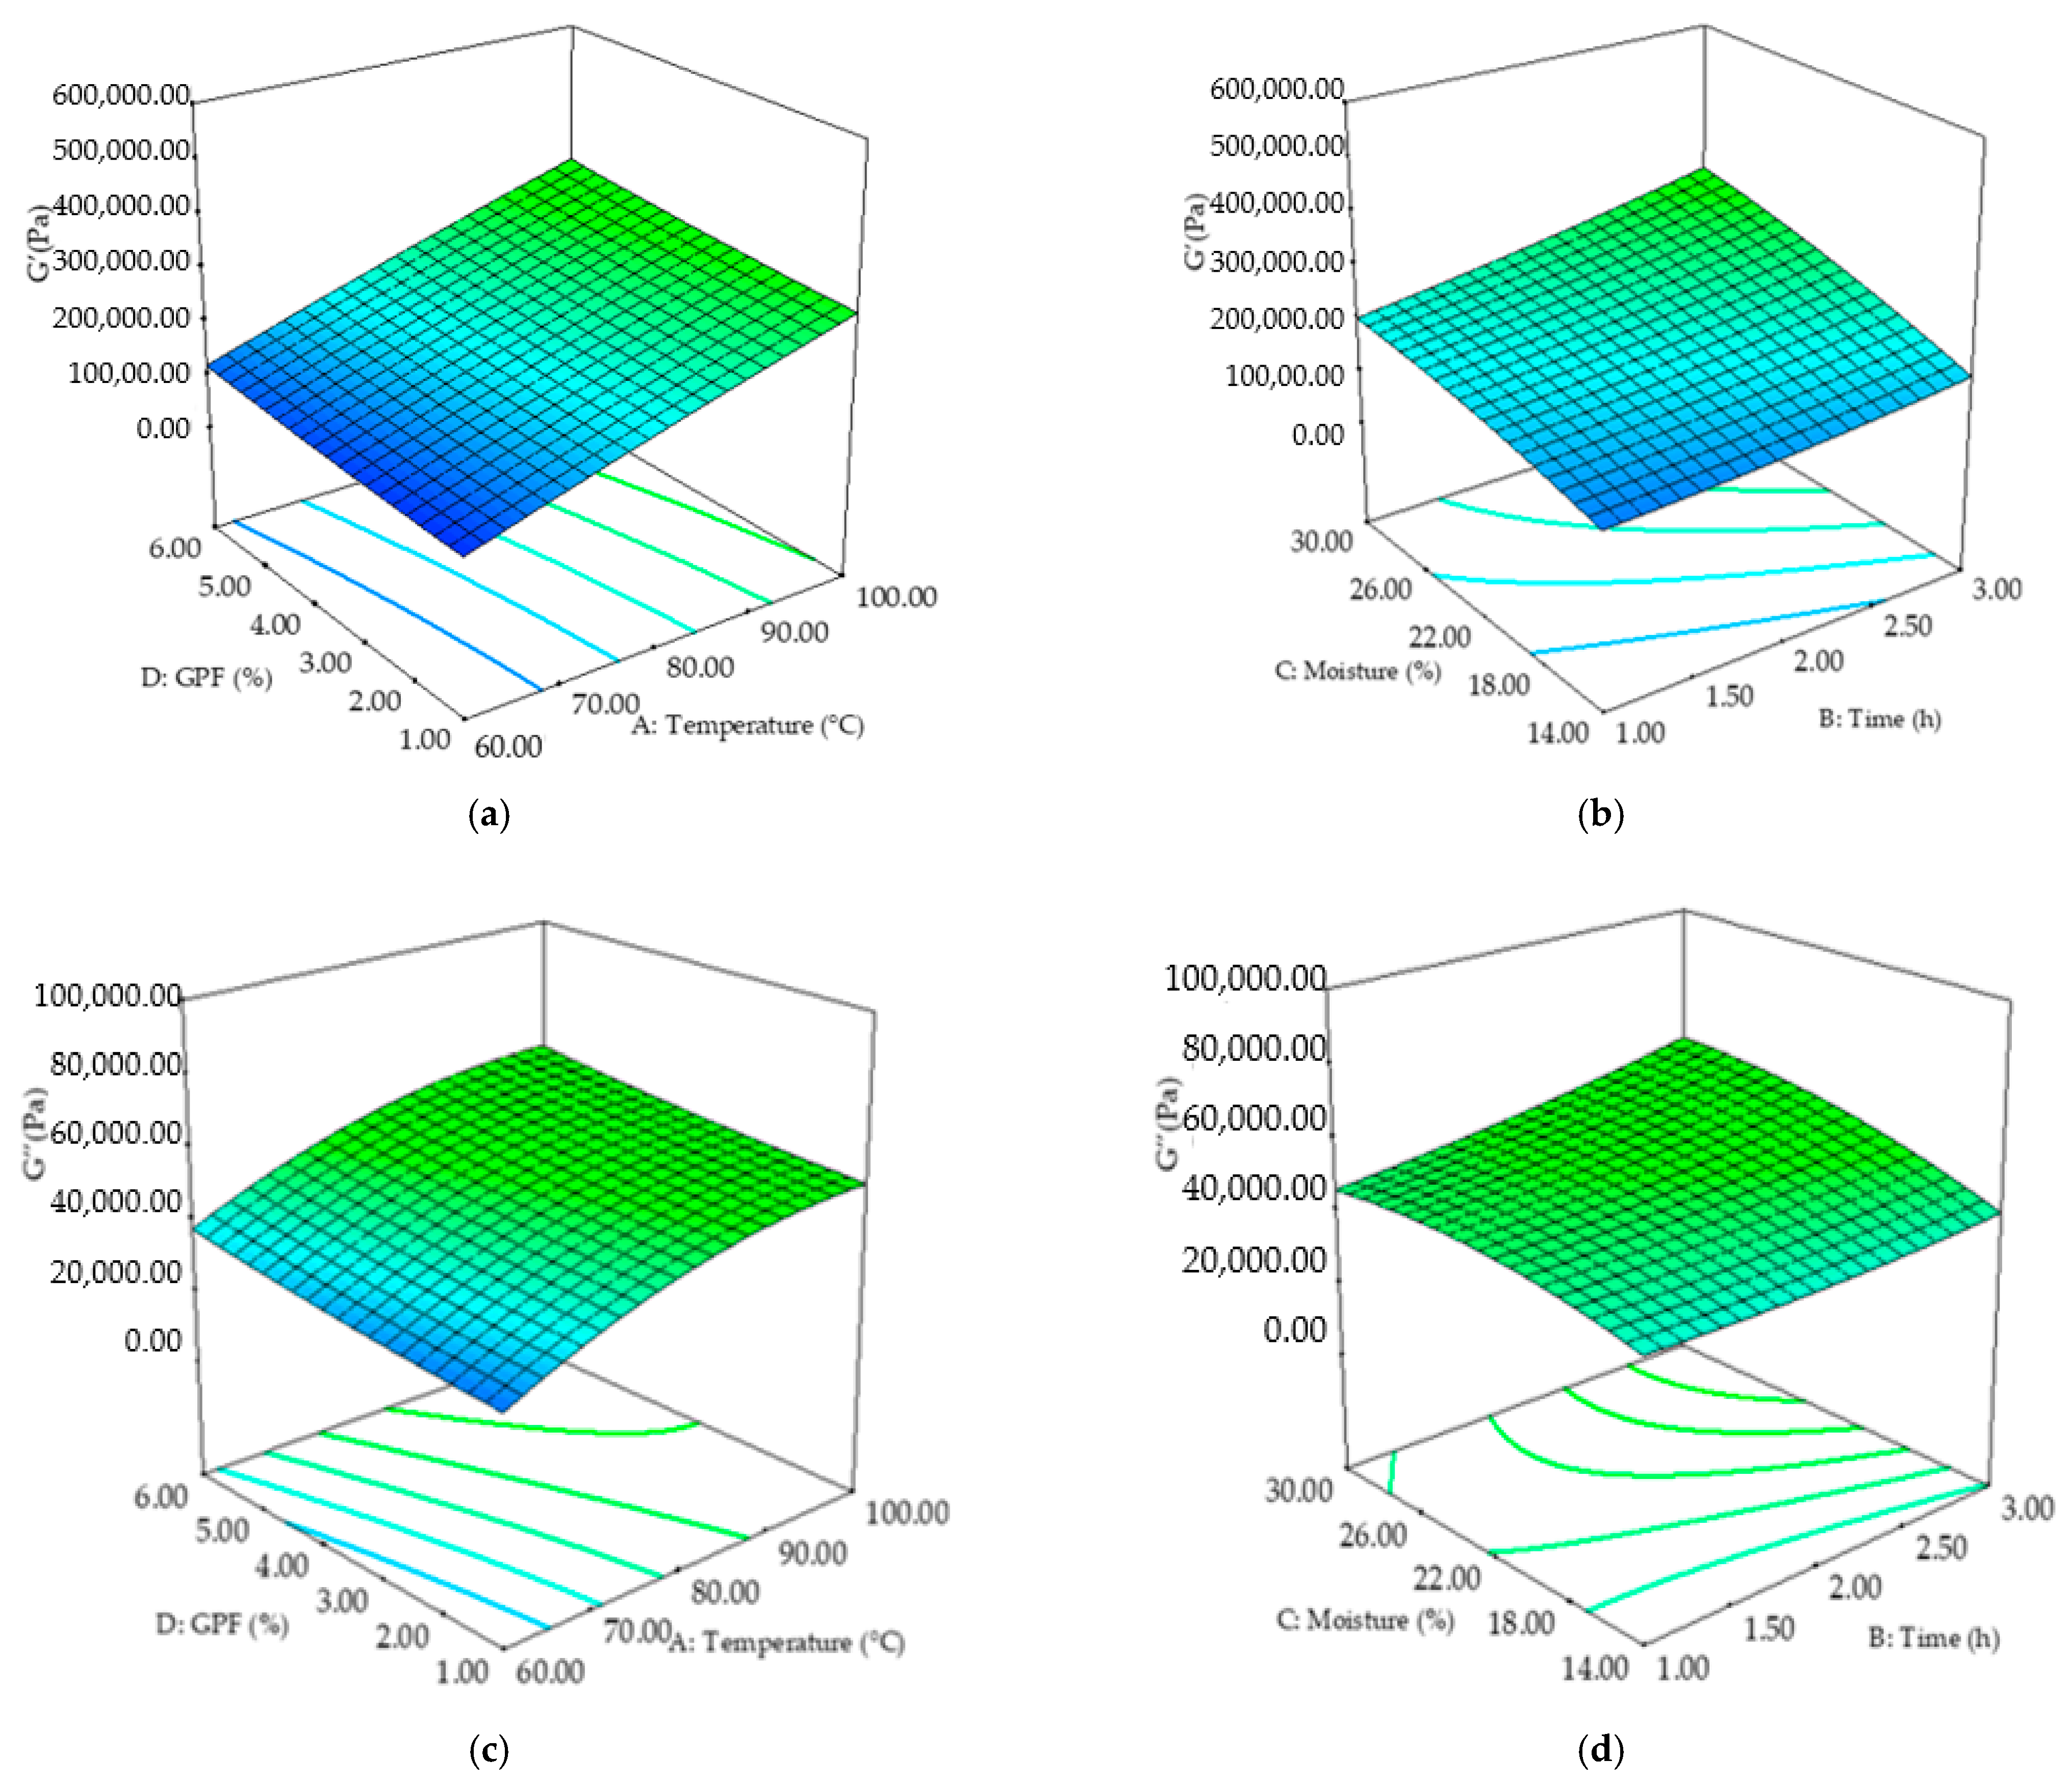
Dough pasta rheological properties are affected by HMT and the addition of fiber-rich ingredients such as GPF. The variation on the elastic modulus G’ was explained by the quadratic model (R2 = 0.93, p < 0.01), temperature, time, moisture, and GPF level factors significantly influencing this parameter (Table 2).
The response surface plot showed (Figure 2a,b) that G’ significantly (p < 0.01) increased with an increase in factor levels, indicating a strengthening effect of HMT and GPF on wheat dough. The biggest significant (p < 0.01) positive influence was observed for temperature factor, while the interaction between moisture and GPF level presented the highest significant negative effect on G’. The variation of the viscous modulus (G”) was successfully described by the quadratic model (R2 = 0.86, p < 0.01). Temperature, time, moisture, and GPF level rise led to higher G” values (Figure 2c,d), with all the considered factors presenting significant (p < 0.01) influence (Table 2).
HMT temperature showed the biggest positive influence, while the most important negative effect on G” was observed for the quadratic term of temperature, considering a significance level of p < 0.01. Higher elastic and viscous moduli are desirable for pasta shape keeping. G’ and G” values (Figure 2) were significantly higher compared to the data obtained by Fanari et al. [32] for semolina dough, probably due to the difference in dough moisture used.
Wheat flour HMT and GPF addition affected dough firmness, the quadratic model describing 71% of data variation at p < 0.01. Only temperature and GPF level factors influenced significantly (p < 0.05) dough firmness (Table 2). The highest positive effect was observed for the linear term of temperature, while the interaction between HMT time and moisture showed a significant (p < 0.01) negative effect. Dough firmness increase was directly proportional with temperature level increase, while GPF determined higher dough firmness at additions up to 5% (Figure 3). Dough firmness is an important technological property that is directly related to pasta handling and modeling. Soft doughs are not desirable for short pasta due to their low capacity to keep the shape and the issues that may appear during drying. These results showed that both HMT and GPF addition had beneficial effects on dough firmness and on further pasta quality.

3.2. Dry Pasta Properties

Pasta color is one of the quality characteristics of pasta and impacts directly the consumer perception and purchase intention. The ANOVA results for the quadratic models fitted to the dry pasta properties are presented in Table 3. The quadratic regression model explained 87% of L* parameter variation, being significant at p < 0.01 (Table 3). Temperature, moisture, and GPF level showed significant (p < 0.01) influence on L*, while time factor had a non-significant influence (p > 0.05).
The highest positive effect was observed for the linear term of temperature, while the most important negative effect (p < 0.01) was that of GPF level. The decrease of L* was proportional with GPF level increase, while the opposite trend was obtained with temperature (Figure 4).
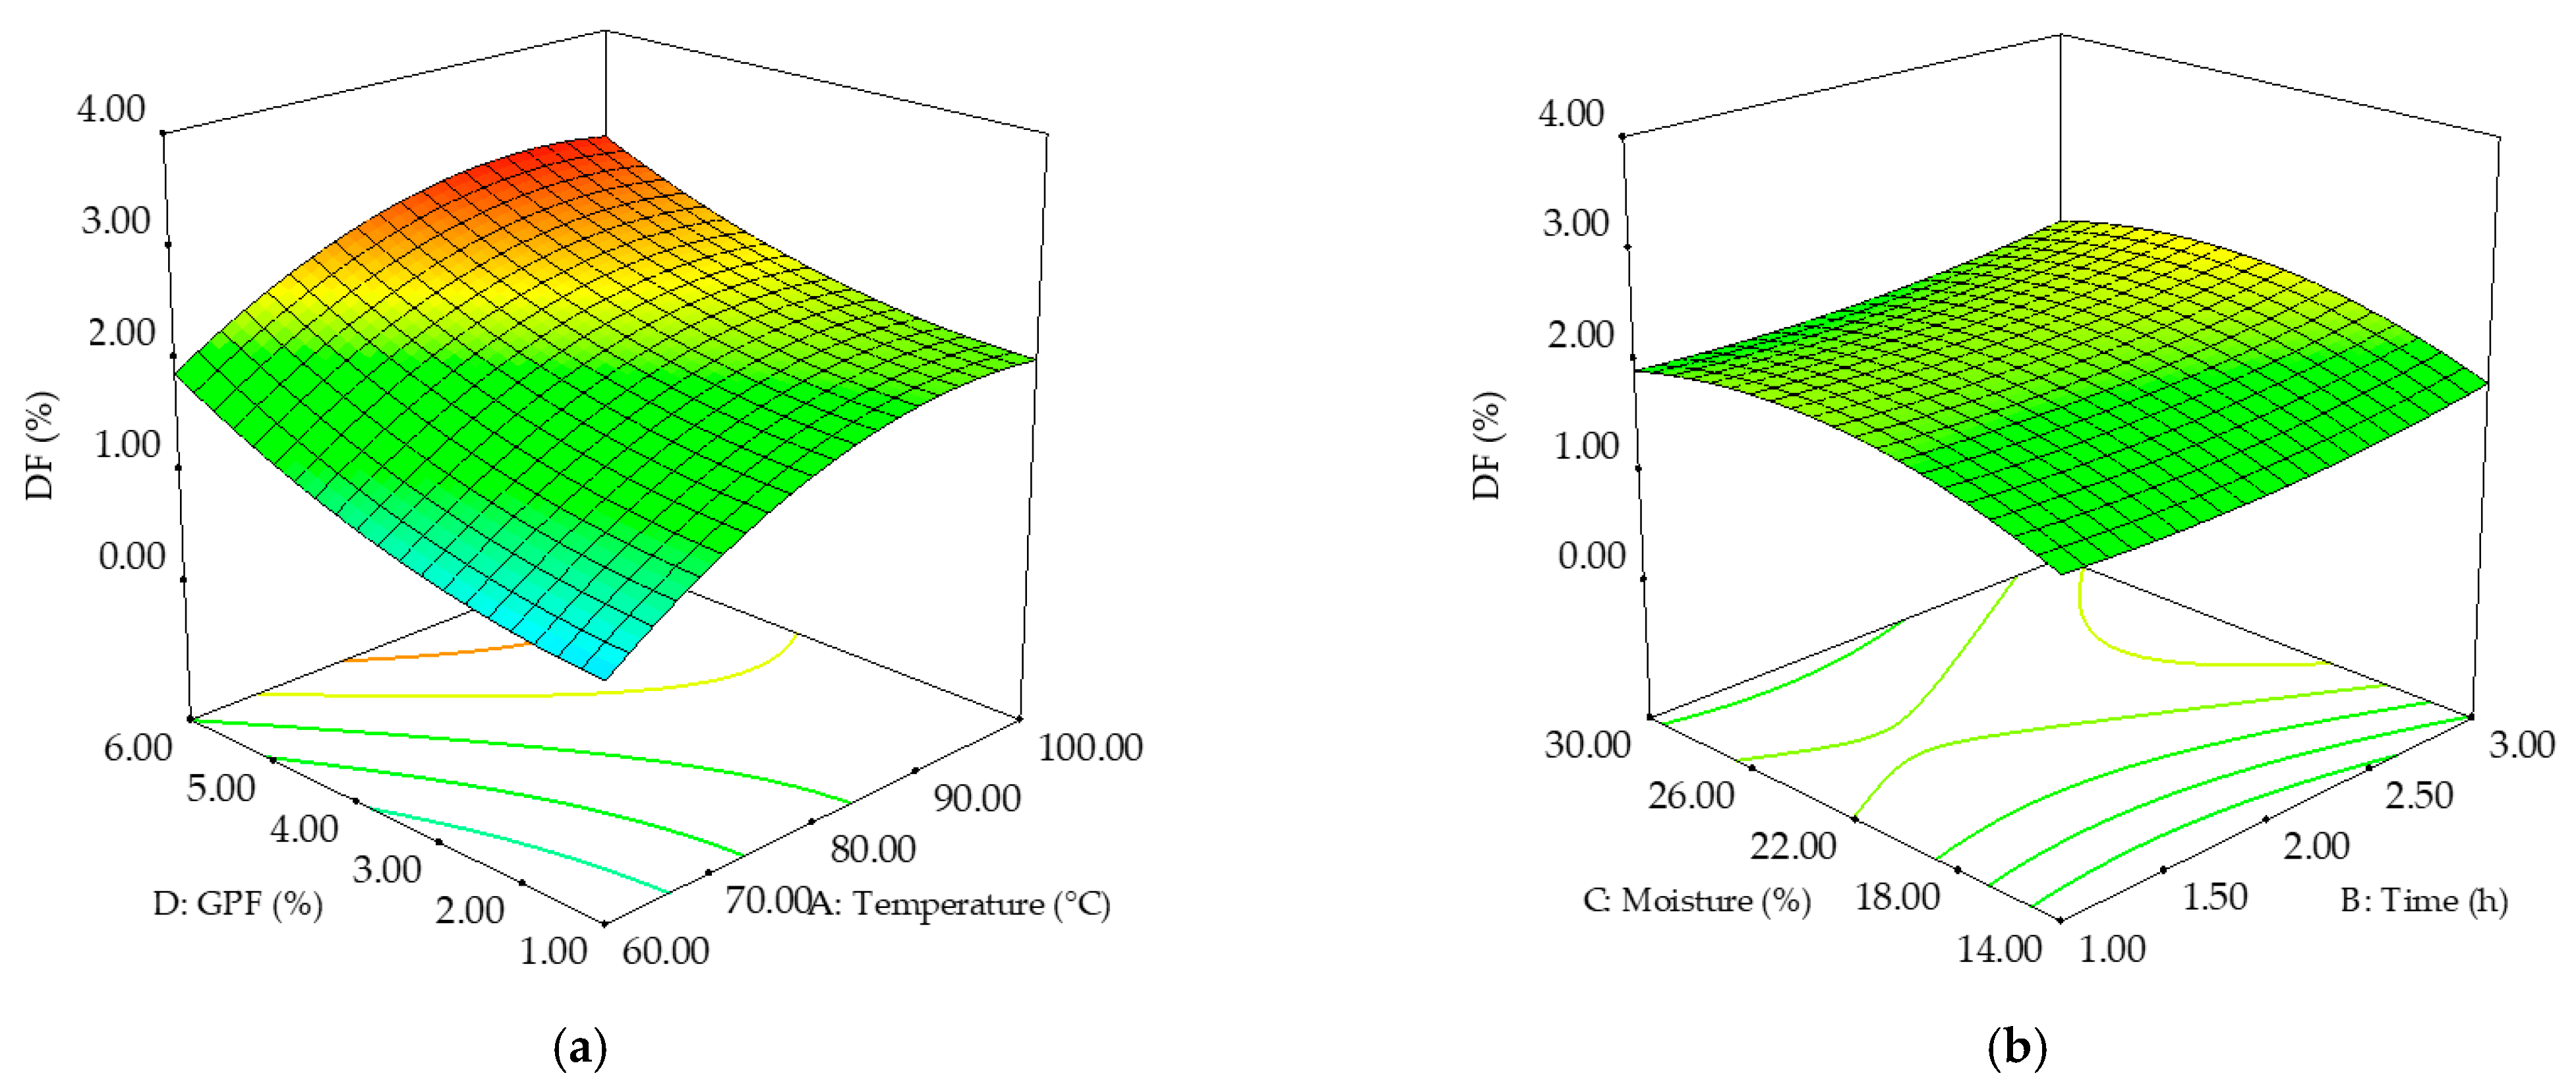
Grape peels are known to increase DF content of foods since they are an important source of insoluble and soluble fibers. The quadratic model was correctly chosen (p < 0.01) to describe 97% of DF content data variation. HMT conditions and GPF addition level showed significant effects (p < 0.01) on DF. The linear term of temperature presented the biggest positive influence, while its quadratic term had the highest negative effect on DF. The response surface plots describing the synergistic effects of factors on pasta DF are given in Figure 5. These results are confirming the enhancement of pasta nutritional value by HMT and GPF addition.
Pasta polyphenolics content is affected by HMT regime and the addition of GPF, which is a rich source of bioactive compounds. The quadratic model was adequate (p < 0.01) to describe 92% of TPC data variation. HMT temperature and time and GPF addition level showed significant (p < 0.01) effects on TPC (Table 3). GPF level linear term had the highest positive influence, while the quadratic term of temperature showed the most important negative effect at p < 0.01. The negative impact of HMT given by the decrease of TPC with temperature and time increase was countered by the addition of GPF, which determined raised TPC values as the level was higher (Figure 6).

3.3. Cooked Pasta Properties

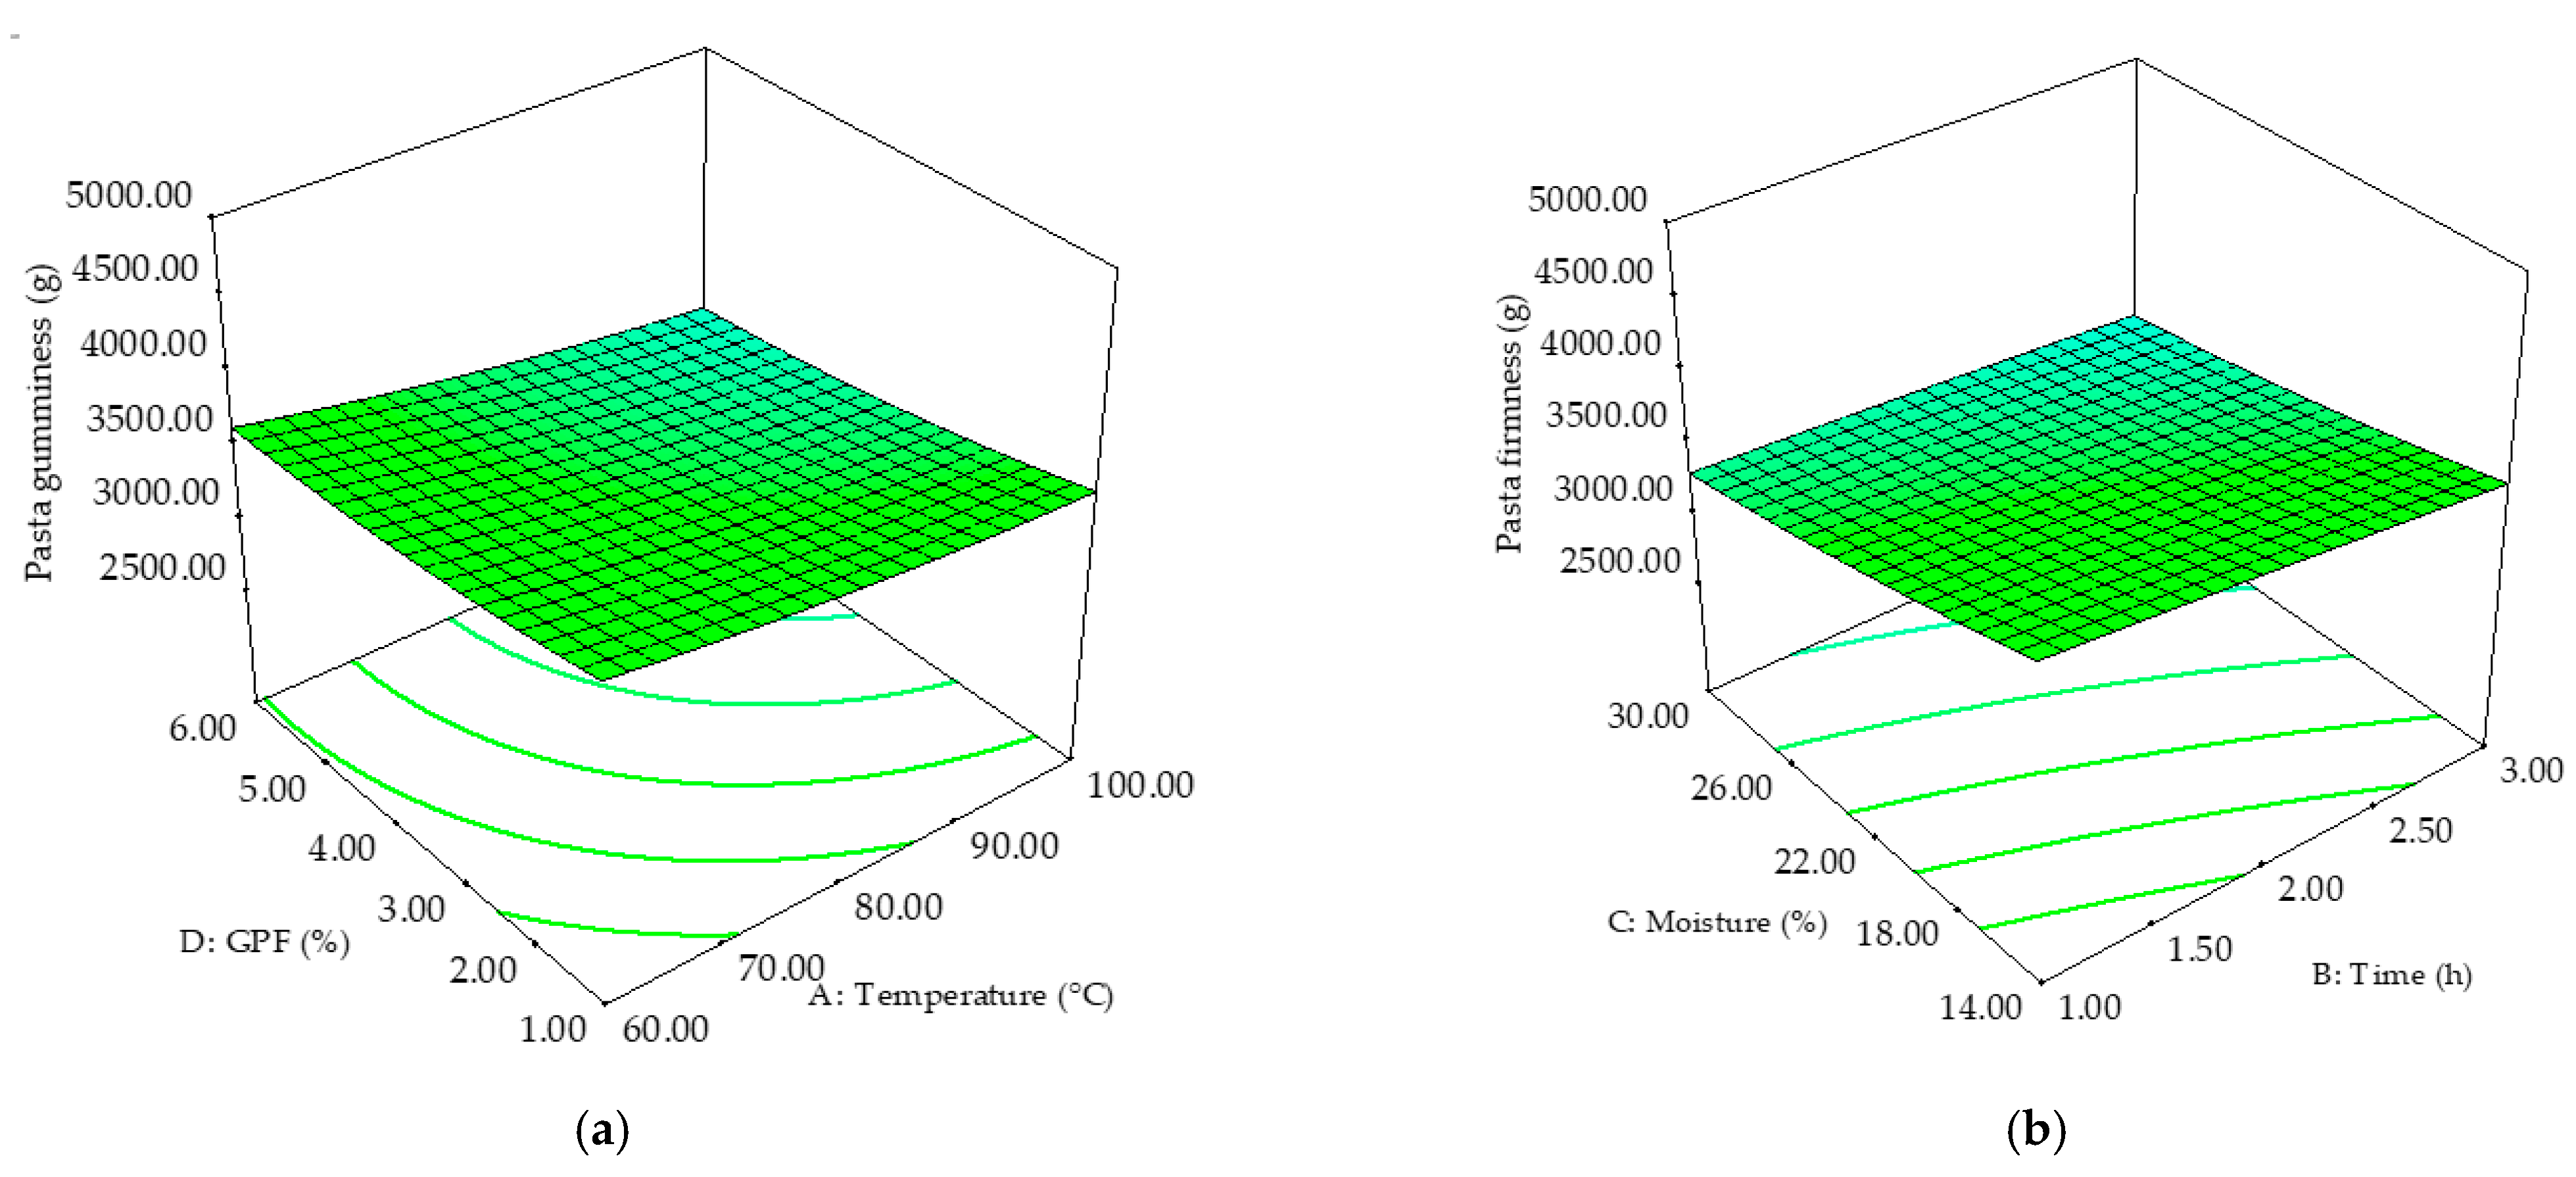
Pasta texture could be a predictor for some of the sensory characteristics of the product. Cooked pasta firmness is another important quality parameter that was significantly influenced (p < 0.05) by wheat HMT temperature and time (Table 4).
The quadratic regression model explained 79% of data variation at p < 0.01. The highest negative effect was that of the linear term of temperature, while the interaction between moisture and GPF level showed the larger positive effect (p < 0.01). As can be seen in Figure 7, pasta firmness decreased with temperature and time increase, while moisture and GPF level had a non-significant effect (p > 0.05).
Pasta gumminess data were fitted to the quadratic regression model, which presented a coefficient of determination of 0.79 and a significance of p < 0.01. All the considered factors showed significant effects (p < 0.01) on pasta gumminess, while their interactions and quadratic terms had a non-significant effect (p > 0.05). The highest negative influence was obtained for HMT moisture factor (Table 4). HMT regime in terms of temperature, time, moisture, and the GPF level determined a proportional decrease of pasta gumminess, as it is shown in Figure 8.
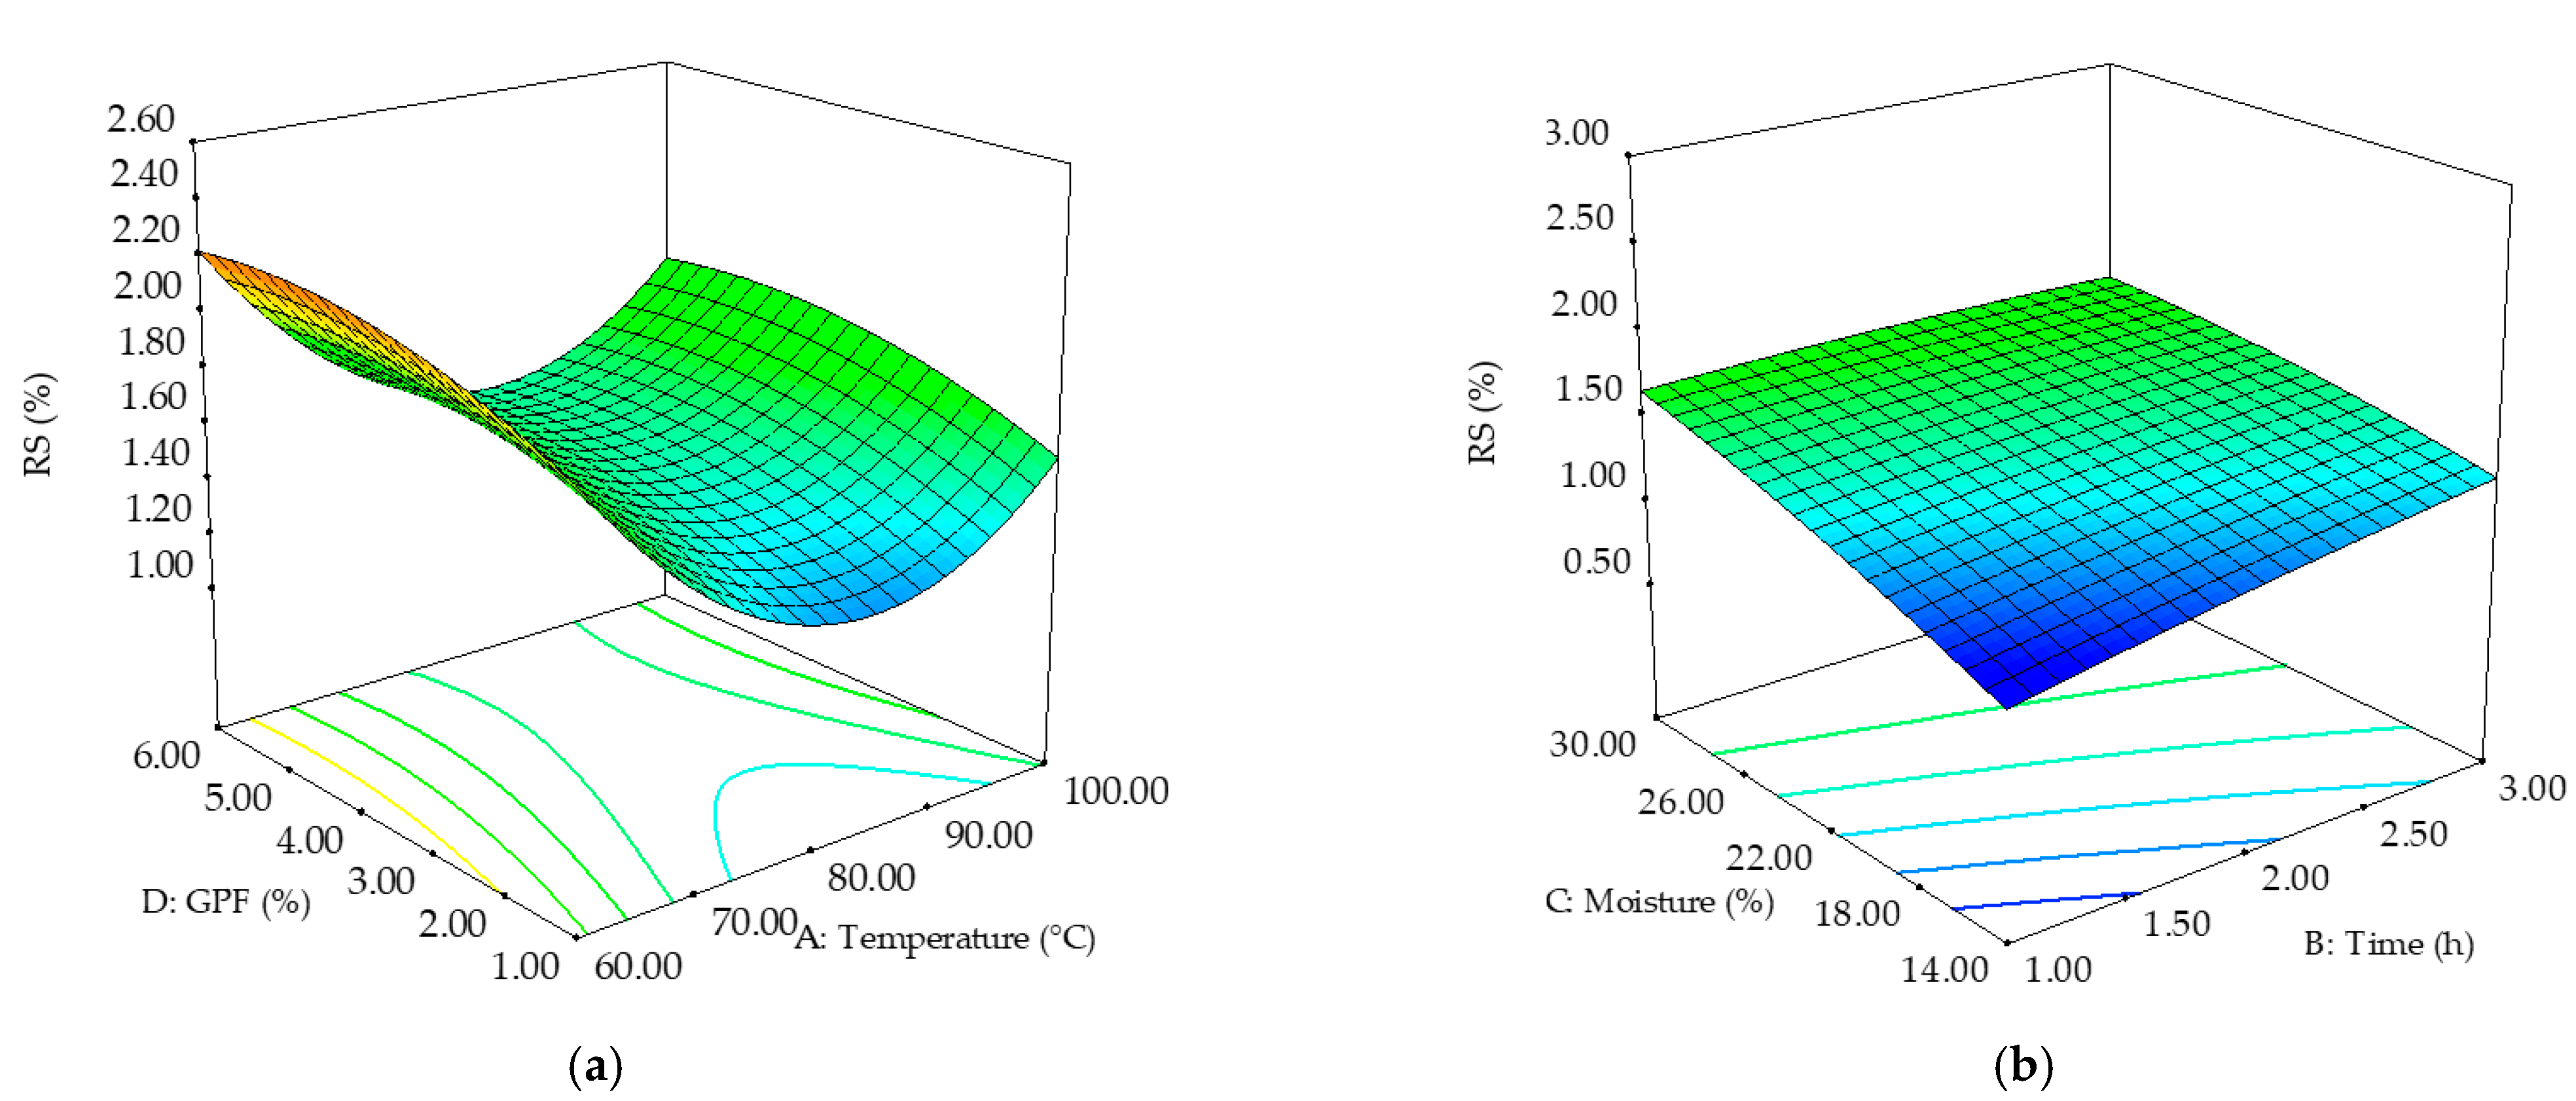
The formation of RS during HMT led to improved nutritional and functional value of pasta. The quadratic model chosen to describe RS content data variation was suitable (p < 0.01), since a high determination coefficient (R2 = 0.96) was obtained. All the factors presented significant (p < 0.01) influence on past RS content (Table 3). The quadratic term of temperature had the biggest positive influence at p < 0.01, while its linear term had the highest negative effect on RS. GPF addition level, HMT time, and moisture increase determined increases of RS content, while temperature showed an opposite trend up to 80 °C (Figure 9).
HMT temperature increase up to 80 °C determined RS increase. A similar trend was observed for time factor and moisture up to 22%. GPF addition level increase resulted in a proportional RS contents rise (Figure 9).

3.4. Optimization

The optimal values of the factors and the predicted values of the responses are shown in Table 5.
The results of the optimization revealed a recommended HMT regime for wheat flour of 87.56 °C temperature applied for 3 h at a moisture of 26.01%. GPF can be incorporated in wheat pasta at a level of 4.81% without major negative impact on quality parameters and with considerable nutritional and functional benefits.

3.5. Correlations between Dough and Pasta Properties

Correlations between dough and pasta properties were obtained and are presented in Table 6. Pasta luminosity L* was significantly (p < 0.05) negatively correlated with TPC and RS contents. Dough firmness was positively correlated (p < 0.01) with pasta firmness, G’, G”, TPC, and DF contents. Pasta gumminess showed a negative correlation at p < 0.01 with G’, G”, and DF, while with RS the correlation was significant at p < 0.05. The elastic (G’) and viscous (G”) moduli were significantly (p < 0.01) correlated (p < 0.01) with TPC and DF contents.

4. Discussion

The rheological testing of pasta dough can give information about the interactions of wheat and GPF components and could predict dough behavior during handling and modelling. One of the advantages of using a small amplitude oscillatory shear test is that no damages on the structure occurs and that it provides information about the structural changes to the system. All the tested samples presented G’ > G”, suggesting the solid-like nature of the material, which was expected. The increase of HMT temperature, time, and moisture determined the increase of G’ and G” dynamic moduli probably as a result of the starch amylose and amylopectin chains reorganizations and/or interactions between phases during treatment [4]. Higher dough viscosity could be explained by the disulfide bonds formed by amino acids and starch structure reorganization [25]. During HMT, starch aggregates are formed which lead to changes of starch and gluten interactions [33]. Lazaridou et al. [34] also reported higher G’ and G” values for wheat-barley treated flour, probably due to the plasticization process that HMT promoted causing starch amorphous-glassy cell wall stiffening. Dynamic moduli of pasta dough increase revealed a structure reinforcement, similar findings being reported for vermicelli dough from sweet potato starch treated at moisture levels up to 30% [7]. On the other hand, G’ and G” moduli rise could be attributed also to the addition of GPF, a fiber-rich ingredient. This trend may be caused by the competition for water between gluten and GPF and/or to the high fiber content that can behave as filler in dough networks, a fact supported also by the significant (p < 0.01) correlations of DF content. Similar results were reported by Mironeasa et al. [19]. The interactions between flour mix components may be improved or inhibited by GPF presence, compounds such as organic acids causing dough strengthening and consequently increases of G’ and G” values [17]. Fanari et al. [35] revealed the dependence of dough rheological properties with the water content added in the system. Lindahl et al. [36] reported no significant differences of G’ values (>10,000 Pa at 1 Hz) between durum and common wheat dough, underlying at the same time the importance of water. Peressini et al. [37] reported G’ values between 43,000 and 145,700 Pa for durum wheat pasta dough enriched with different fibers.
Dough firmness increased as HMT temperature and GPF addition level increased. Lazaridou et al. [34] also reported higher firmness of dough made of treated wheat-barley flour, which indicated a stiffer dough related to the macromolecular rearrangements of flour molecules during HMT. The chemical composition of GPF could also be responsible for dough firmness increase, with the strong correlation with DF content (r = 0.51, p < 0.01) supporting this hypothesis. Polyphenols presence may possibly contribute to the viscoelastic characteristics of pasta dough. Mironeasa et al. [17] also reported higher firmness values with GPF addition level increase at particle size <180 μm.
The synergistic effect of HMT and GPF addition was observed on dry pasta luminosity. HMT caused an increase of L* with temperature and moisture level increase, which may be related to the modification of starch crystalline architecture which led to physicochemical property changes [38]. On the other hand, GPF decreased L* values as the addition level was higher due to its pigments and to the promotion of nonenzymatic browning reactions that would determine darker products. Similar observations were made by Aksoylu et al. [39] for grape seeds enriched biscuits. TPC from GPF may also have contributed to L* decrease, with a very strong correlation (r = −0.81, p < 0.01) being observed.
Pasta DF content was significantly increased (p < 0.01) as the HMT moisture and time and GPF level increased. There results may be related to the aggregate formation and amylose/amylopectin chain structure changes under heat energy and water molecule migrations, with similar results being reported by Zheng et al. [40]. Furthermore, starch may form complexes with other composite flour components such as lipids, proteins and polyphenols, intensifying the effects of aggregations, static, and hydrogen linkages [41]. In addition, GPF is a rich source of soluble and insoluble DF, which contributed significantly to the pasta DF content increase.
The polyphenolics content was negatively affected by HMT, but this decrease was countered by the addition of GPF, which resulted in a TPC increase. HMT may possibly cause bioactive compound damage at high temperatures. GPF is known to be a source of polyphenols such as malvidin-3-O-glucoside, peonidin-3-O-glucoside, cyanidin-3-O-glucoside, and catechin [42,43,44]. Our results are in agreement with those of Sant’Anna et al. [16], who reported higher TPC for fettuccini pasta enriched with grape pomace, and of Gaita et al. [12], who studied wheat pasta supplemented with grape peels.
Pasta texture is a good predictor of the sensory profile and represents a key factor in consumer acceptance. The increase of HMT temperature and duration determined a decrease in pasta firmness, which may be related to the denaturation of gluten proteins. Liu et al. [45] reported lower tapioca starch gel hardness, probably due to the interactions between phases that occur during HMT. Galvez and Resurreccion [46] stated that pasta should be neither too hard nor too soft. The interaction between moisture and GPF level factor significantly (p < 0.01) positively influenced pasta firmness. Tolve et al. [14] reported an increase in pasta firmness when grape pomace was incorporated. On the other hand, pasta firmness decrease may be related to GPF ability to bind water, similar to gluten proteins. Polyphenols may also contribute to pasta texture behavior as a result of interactions with other components, a fact supported by the positive correlation (r = 0.42, p < 0.01) between firmness and TPC. Our data were in agreement with those reported by Li et al. [47] for noodles with treated wheat flour, which presented a firmness of 3397.76 g. The gumminess parameter was significantly decreased (p < 0.01) by HMT conditions and GPF level increase. Chandla et al. [48] also obtained lower gumminess values for pasta made of HMT amaranth starch noodles. Using a small particle size of GPF (<180 μm) might have favorable effects on pasta texture by lowering gumminess values, similar to findings being reported by Chen et al. [49] for Chinese noodles with wheat bran addition.
RS is a fraction resistant to hydrolysis in the digestive system under the action of enzymes, having a physiological behavior similar to DF [50]. HMT and GPF addition significantly (p < 0.01) increased RS content of wheat pasta. Starch resistance to enzyme action could have been determined by the crystalline areas’ perfection and more dense amorphous areas caused by HMT [5]. Similar to our results, Wang et al. [5] observed that RS formation is directly proportional to the moisture content of the sample. The interactions between flour components, especially starch, lipids, and proteins, could possibly be responsible for the higher RS content, since proteins films could have been formed on starch surface and lead to difficult amylase attack [4]. In addition, the presence of polyphenols from GPF could have a decisive role in starch digestion. It was stated that polyphenols may interact with starch to form complexes through non-covalent linkages, which are not accessible for hydrolysis [51]. Furthermore, polyphenols may inhibit the digestive enzymes by means of proteins-polyphenols interactions [52]. Thus, the synergistic effects of HMT and GPF led to an improved functional value of pasta by increasing RS content.
The optimization of HMT regime and GPF level allowed the establishment of a formulation with maximum nutritional and functional benefits and with minimum quality impairment. Thus, at 87.56 °C with a moisture of 26.01% for 3 h and an addition level of 4.81% GPF, pasta presented high TPC content (11.36 mg/100 g) and RS content (2.80%). Chen et al. [4] reported an RS content of HMT wheat starch at 25% moisture of 2.64%. Nakov et al. [53] obtained a TPC value of 9.41 mg/100 g of cakes with 4% grape pomace powder.

5. Conclusions

HMT is a useful tool for physical modification of wheat flour that enhanced its nutritional and functional value. The synergistic effect of HMT and GPF addition resulted in high DF, TPC, and RS contents of pasta due to the intake of GPF and the starch and proteins modifications during treatment. Doug firmness and viscoelastic moduli increased with HMT temperature, time, moisture, and GPF level increases. Pasta firmness and gumminess lowering was proportional to HMT regime and GPF addition increase.
The optimal wheat flour HMT regime was found to be a temperature of 87.56 °C, a moisture content of 26.01%, and a time of 3 h. GPF can be incorporated at a quantity of 4.81% in order to achieve the best pasta quality with the most health benefits. These results could be helpful for the development of novel functional pasta by applying an easy, controllable process and by using an inexpensive fiber-rich ingredient like GPF. The data presented in this study could be helpful for further pasta processing automatization.

Author Contributions

Conceptualization, M.I. and S.M.; methodology, M.I., S.M. and A.B.; software, M.I.; validation, M.I., S.M. and A.B.; formal analysis, M.I.; investigation, M.I. and A.B.; resources, M.I., S.M. and A.B.; data curation, M.I.; writing—original draft preparation, M.I.; writing—review and editing, M.I. and S.M.; visualization, M.I. and S.M.; supervision, S.M. All authors have read and agreed to the published version of the manuscript.

Funding

This work was supported by the Romania National Council for Higher Education Funding, CNFIS, project number CNFIS-FDI-2021-0357.

Institutional Review Board Statement

Not applicable.

Informed Consent Statement

Not applicable.

Data Availability Statement

Not applicable.

Conflicts of Interest

The authors declare no conflict of interest.

References

  1. Borcean, I. Durum Wheat: Domestic Production, not Import. Available online: https://www.revista-ferma.ro/articole/agronomie/graul-durum-productie-autohtona-nu-import (accessed on 23 February 2021).
  2. Collar, C.; Armero, E. Functional and Thermal Behaviours of Heat-Moisture-Treated Starch-Rich Wheat-Based Blended Matrices: Impact of Treatment of Non-wheat Flours. Food Bioprocess Technol. 2019, 12, 599–612. [Google Scholar] [CrossRef] [Green Version]
  3. Iuga, M.; Mironeasa, S. A review of the hydrothermal treatments impact on starch based systems properties. Crit. Rev. Food Sci. Nutr. 2020, 60, 3890–3915. [Google Scholar] [CrossRef] [PubMed]
  4. Chen, X.; He, X.; Fu, X.; Huang, Q. In vitro digestion and physicochemical properties of wheat starch/flour modified by heat-moisture treatment. J. Cereal Sci. 2015, 63, 109–115. [Google Scholar] [CrossRef]
  5. Wang, H.; Zhang, B.; Chen, L.; Li, X. Understanding the structure and digestibility of heat-moisture treated starch. Int. J. Biol. Macromol. 2016, 88, 1–8. [Google Scholar] [CrossRef] [PubMed]
  6. Zavareze, E.D.R.; Dias, A.R.G. Impact of heat-moisture treatment and annealing in starches: A review. Carbohydr. Polym. 2011, 83, 317–328. [Google Scholar] [CrossRef]
  7. Liao, L.; Liu, H.; Gan, Z.; Wu, W. Structural properties of sweet potato starch and its vermicelli quality as affected by heat-moisture treatment. Int. J. Food Prop. 2019, 22, 1122–1133. [Google Scholar] [CrossRef] [Green Version]
  8. Iuga, M.; Mironeasa, C.; Mironeasa, S. Oscillatory Rheology and Creep-Recovery Behaviour of Grape Seed-Wheat Flour Dough: Effect of Grape Seed Particle Size, Variety and Addition Level. Bull. Univ. Agric. Sci. Veter. Med. Cluj Napoca. Food Sci. Technol. 2019, 76, 40–51. [Google Scholar] [CrossRef] [Green Version]
  9. Yu, J.; Ahmedna, M. Functional components of grape pomace: Their composition, biological properties and potential applications. Int. J. Food Sci. Technol. 2013, 48, 221–237. [Google Scholar] [CrossRef]
  10. Deng, Q.; Penner, M.H.; Zhao, Y. Chemical composition of dietary fiber and polyphenols of five different varieties of wine grape pomace skins. Food Res. Int. 2011, 44, 2712–2720. [Google Scholar] [CrossRef]
  11. Iuga, M.; Ropciuc, S.; Mironeasa, S. Antioxidant Activity and Total Phenolic Content of Grape Seeds and Peels from Romanian Varieties. Food Environ. Saf. J. 2017, 16, 276–282. [Google Scholar]
  12. Gaita, C.; Alexa, E.; Moigradean, D.; Filomena, C.; Poiana, M.-A. Designing of high value-added pasta formulas by incorporation of grape pomace skins. Rom. Biotechnol. Lett. 2020, 25, 1607–1614. [Google Scholar] [CrossRef]
  13. Savla, H.; Yardi, V. Development of Gluten-Free Pasta (Sevaiya) Using Grape Pomace and Assessing its Quality And Acceptability. Int. Proc. Chem. Biol. Environ. Eng. 2016, 95, 44–49. [Google Scholar] [CrossRef]
  14. Tolve, R.; Pasini, G.; Vignale, F.; Favati, F.; Simonato, B. Effect of Grape Pomace Addition on the Technological, Sensory, and Nutritional Properties of Durum Wheat Pasta. Foods 2020, 9, 354. [Google Scholar] [CrossRef] [PubMed] [Green Version]
  15. Gaceu, L.; Gruia, R.; Oprea, O.B. Researches Regarding the Superior Valorisation of By-Products From The Winery Industry, and the Obtaining of Bakery Products. Ann. Acad. Rom. Sci. Ser. Agric. Silvic. Vet. Med. Sci. 2020, 9, 25–36. [Google Scholar]
  16. Sant’Anna, V.; Christiano, F.D.P.; Marczak, L.D.F.; Tessaro, I.C.; Thys, R.C.S. The effect of the incorporation of grape marc powder in fettuccini pasta properties. LWT Food Sci. Technol. 2014, 58, 497–501. [Google Scholar] [CrossRef] [Green Version]
  17. Mironeasa, S.; Iuga, M.; Zaharia, D.; Mironeasa, C. Rheological Analysis of Wheat Flour Dough as Influenced by Grape Peels of Different Particle Sizes and Addition Levels. Food Bioprocess Technol. 2019, 12, 228–245. [Google Scholar] [CrossRef]
  18. Fanari, F.; Desogus, F.; Scano, E.A.; Carboni, G.; Grosso, M. The effect of the relative amount of ingredients on the rheological properties of semolina doughs. Sustainability 2020, 12, 2705. [Google Scholar] [CrossRef] [Green Version]
  19. Mironeasa, S.; Iuga, M.; Zaharia, D.; Mironeasa, C. Optimization of grape peels particle size and flour substitution in white wheat flour dough. Sci. Study Res. Chem. Chem. Eng. Biotechnol. Food Ind. 2019, 20, 29–42. [Google Scholar]
  20. Aghamirzaei, M.; Peighambardoust, S.H.; Azadmard-Damirchi, S.; Majzoobi, M. Effects of grape seed powder as a functional ingredient on flour physicochemical characteristics and dough rheological properties. J. Agric. Sci. Technol. 2015, 17, 365–373. [Google Scholar]
  21. Serna-Saldívar, S.O. Cereal Grains Laboratory Reference and Procedures Manual; CRC Press: Boca Raton, FL, USA, 2012; ISBN 9781466555631. [Google Scholar]
  22. Sicignano, A.; Di Monaco, R.; Masi, P.; Cavella, S. From raw material to dish: Pasta quality step by step. J. Sci. Food Agric. 2015, 95, 2579–2587. [Google Scholar] [CrossRef]
  23. Ciccoritti, R.; Scalfati, G.; Cammerata, A.; Sgrulletta, D. Variations in content and extractability of durum wheat (Triticum turgidum L. var durum) arabinoxylans associated with genetic and environmental factors. Int. J. Mol. Sci. 2011, 12, 4536–4549. [Google Scholar] [CrossRef] [PubMed] [Green Version]
  24. Hoover, R. The impact of heat-moisture treatment on molecular structures and properties of starches isolated from different botanical sources. Crit. Rev. Food Sci. Nutr. 2010, 50, 835–847. [Google Scholar] [CrossRef] [PubMed]
  25. Collar, C.; Armero, E. Value-added of heat moisture treated mixed flours in wheat-based matrices: A functional and nutritional approach. Food Bioprocess Technol. 2018, 11, 1536–1551. [Google Scholar] [CrossRef] [Green Version]
  26. Bergman, C.; Gualberto, D.; Weber, C. Development of a high-temperature-dried soft wheat pasta supplemented with cowpea (Vigna unguiculata (L) Walp)—Cooking quality, color, and sensory evaluation. Cereal Chem. 1994, 71, 523–527. [Google Scholar]
  27. Marchetti, L.; Cardós, M.; Campaña, L.; Ferrero, C. Effect of glutens of different quality on dough characteristics and breadmaking performance. LWT Food Sci. Technol. 2012, 46, 224–231. [Google Scholar] [CrossRef]
  28. Ungureanu-Iuga, M.; Dimian, M.; Mironeasa, S. Development and quality evaluation of gluten-free pasta with grape peels and whey powders. LWT Food Sci. Technol. 2020, 130, 1–9. [Google Scholar] [CrossRef]
  29. Troccoli, A.; Borrelli, G.M.; De Vita, P.; Fares, C.; Di Fonzo, N. Durum wheat quality: A multidisciplinary concept. J. Cereal Sci. 2000, 32, 99–113. [Google Scholar] [CrossRef]
  30. Melilli, M.G.; Pagliaro, A.; Scandurra, S.; Gentile, C.; Di Stefano, V. Omega-3 rich foods: Durum wheat spaghetti fortified with Portulaca oleracea. Food Biosci. 2020, 37, 100730. [Google Scholar] [CrossRef]
  31. Banga, J.R.; Balsa-Canto, E.; Moles, C.G.; Alonso, A.A. Improving food processing using modern optimization methods. Trends Food Sci. Technol. 2003, 14, 131–144. [Google Scholar] [CrossRef]
  32. Fanari, F.; Desogus, F.; Scano, E.A.; Carboni, G.; Grosso, M. The rheological properties of semolina doughs: Influence of the relative amount of ingredients. Chem. Eng. Trans. 2019, 76, 703–708. [Google Scholar] [CrossRef]
  33. Mann, J.; Schiedt, B.; Baumann, A.; Conde-Petit, B.; Vilgis, T.A. Effect of heat treatment on wheat dough rheology and wheat protein solubility. Food Sci. Technol. Int. 2014, 20, 341–351. [Google Scholar] [CrossRef]
  34. Lazaridou, A.; Marinopoulou, A.; Biliaderis, C.G. Impact of flour particle size and hydrothermal treatment on dough rheology and quality of barley rusks. Food Hydrocoll. 2019, 87, 561–569. [Google Scholar] [CrossRef]
  35. Fanari, F.; Carboni, G.; Grosso, M.; Desogus, F. Thermal properties of semolina doughs with different relative amount of ingredients. Sustainability 2020, 12, 2235. [Google Scholar] [CrossRef] [Green Version]
  36. Lindahl, L.; Eliasson, A.C. A comparison of some rheological properties of durum and wheat flour doughs. Cereal Chem. 1992, 69, 30–34. [Google Scholar]
  37. Peressini, D.; Cavarape, A.; Brennan, M.A.; Gao, J.; Brennan, C.S. Viscoelastic properties of durum wheat doughs enriched with soluble dietary fibres in relation to pasta-making performance and glycaemic response of spaghetti. Food Hydrocoll. 2020, 102, 105613. [Google Scholar] [CrossRef]
  38. Chavez-Murillo, C.E.; Orona-Padilla, J.L.; de la Rosa Millan, J. Physicochemical, functional properties and ATR-FTIR digestion analysis of thermally treated starches isolated from black and bayo beans. Starch/Staerke 2019, 71, 1–25. [Google Scholar] [CrossRef]
  39. Aksoylu, Z.; Çağindi, Ö.; Köse, E. Effects of blueberry, grape seed powder and poppy seed incorporation on physicochemical and sensory properties of biscuit. J. Food Qual. 2015, 38, 164–174. [Google Scholar] [CrossRef]
  40. Zheng, B.; Zhong, S.; Tang, Y.; Chen, L. Understanding the nutritional functions of thermally-processed whole grain highland barley in vitro and in vivo. Food Chem. 2020, 310, 125979. [Google Scholar] [CrossRef] [PubMed]
  41. Wang, H.; Liu, Y.; Chen, L.; Li, X.; Wang, J.; Xie, F. Insights into the multi-scale structure and digestibility of heat-moisture treated rice starch. Food Chem. 2018, 242, 323–329. [Google Scholar] [CrossRef] [Green Version]
  42. Biniari, K.; Gerogiannis, O.; Daskalakis, I.; Bouza, D.; Stavrakaki, M. Study of some qualitative and quantitative characters of the grapes of indigenous Greek grapevine varieties (Vitis vinifera L.) using HPLC and spectrophotometric analyses. Not. Bot. Horti Agrobot. Cluj-Napoca 2018, 46, 97–106. [Google Scholar] [CrossRef]
  43. Iuga, M.; Mironeasa, S. Potential of grape byproducts as functional ingredients in baked goods and pasta. Compr. Rev. Food Sci. Food Saf. 2020, 19, 2473–2505. [Google Scholar] [CrossRef]
  44. Mironeasa, S. Valorisation of Secondary Products from Wine Making; Publishing House Performantica: Iasi, Romania, 2017; p. 56. [Google Scholar]
  45. Liu, Y.F.; Laohasongkram, K.; Chaiwanichsiri, S. Effects of Heat-Moisture Treatment on Molecular Interactions and Physicochemical Properties of Tapioca Starch. MOJ Food Process. Technol. 2016, 3, 304–311. [Google Scholar] [CrossRef] [Green Version]
  46. Galvez, F.C.F.; Resurreccion, A.V.A. Reliability of the Focus Group Technique in Determining the Quality Characteristics of Mungbean [Vigna Radiata (L.) Wilczec] Noodles. J. Sens. Stud. 1992, 7, 315–326. [Google Scholar] [CrossRef]
  47. Li, M.; Liu, C.; Zheng, X.; Li, L.; Bian, K. Physicochemical properties of wheat flour modified by heat-moisture treatment and their effects on noodles making quality. J. Food Process. Preserv. 2020, 44, 1–9. [Google Scholar] [CrossRef]
  48. Chandla, N.K.; Saxena, D.C.; Singh, S. Processing and evaluation of heat moisture treated (HMT) amaranth starch noodles; An inclusive comparison with corn starch noodles. J. Cereal Sci. 2017, 75, 306–313. [Google Scholar] [CrossRef]
  49. Chen, J.S.; Fei, M.J.; Shi, C.L.; Tian, J.C.; Sun, C.L.; Zhang, H.; Ma, Z.; Dong, H.X. Effect of particle size and addition level of wheat bran on quality of dry white Chinese noodles. J. Cereal Sci. 2011, 53, 217–224. [Google Scholar] [CrossRef]
  50. Barros, J.H.T.; Telis, V.R.N.; Taboga, S.; Franco, C.M.L. Resistant starch: Effect on rheology, quality, and staling rate of white wheat bread. J. Food Sci. Technol. 2018, 55, 4578–4588. [Google Scholar] [CrossRef] [PubMed] [Green Version]
  51. Rocchetti, G.; Giuberti, G.; Busconi, M.; Marocco, A.; Trevisan, M.; Lucini, L. Pigmented sorghum polyphenols as potential inhibitors of starch digestibility: An in vitro study combining starch digestion and untargeted metabolomics. Food Chem. 2020, 312, 126077. [Google Scholar] [CrossRef]
  52. McDougall, G.J.; Shpiro, F.; Dobson, P.; Smith, P.; Blake, A.; Stewart, D. Different Polyphenolic Components of Soft Fruits Inhibit α-Amylase and α-Glucosidase. J. Agric. Food Chem. 2005, 53, 2760–2766. [Google Scholar] [CrossRef]
  53. Nakov, G.; Brandolini, A.; Hidalgo, A.; Ivanova, N.; Stamatovska, V.; Dimov, I. Effect of grape pomace powder addition on chemical, nutritional and technological properties of cakes. LWT 2020, 134, 109950. [Google Scholar] [CrossRef]
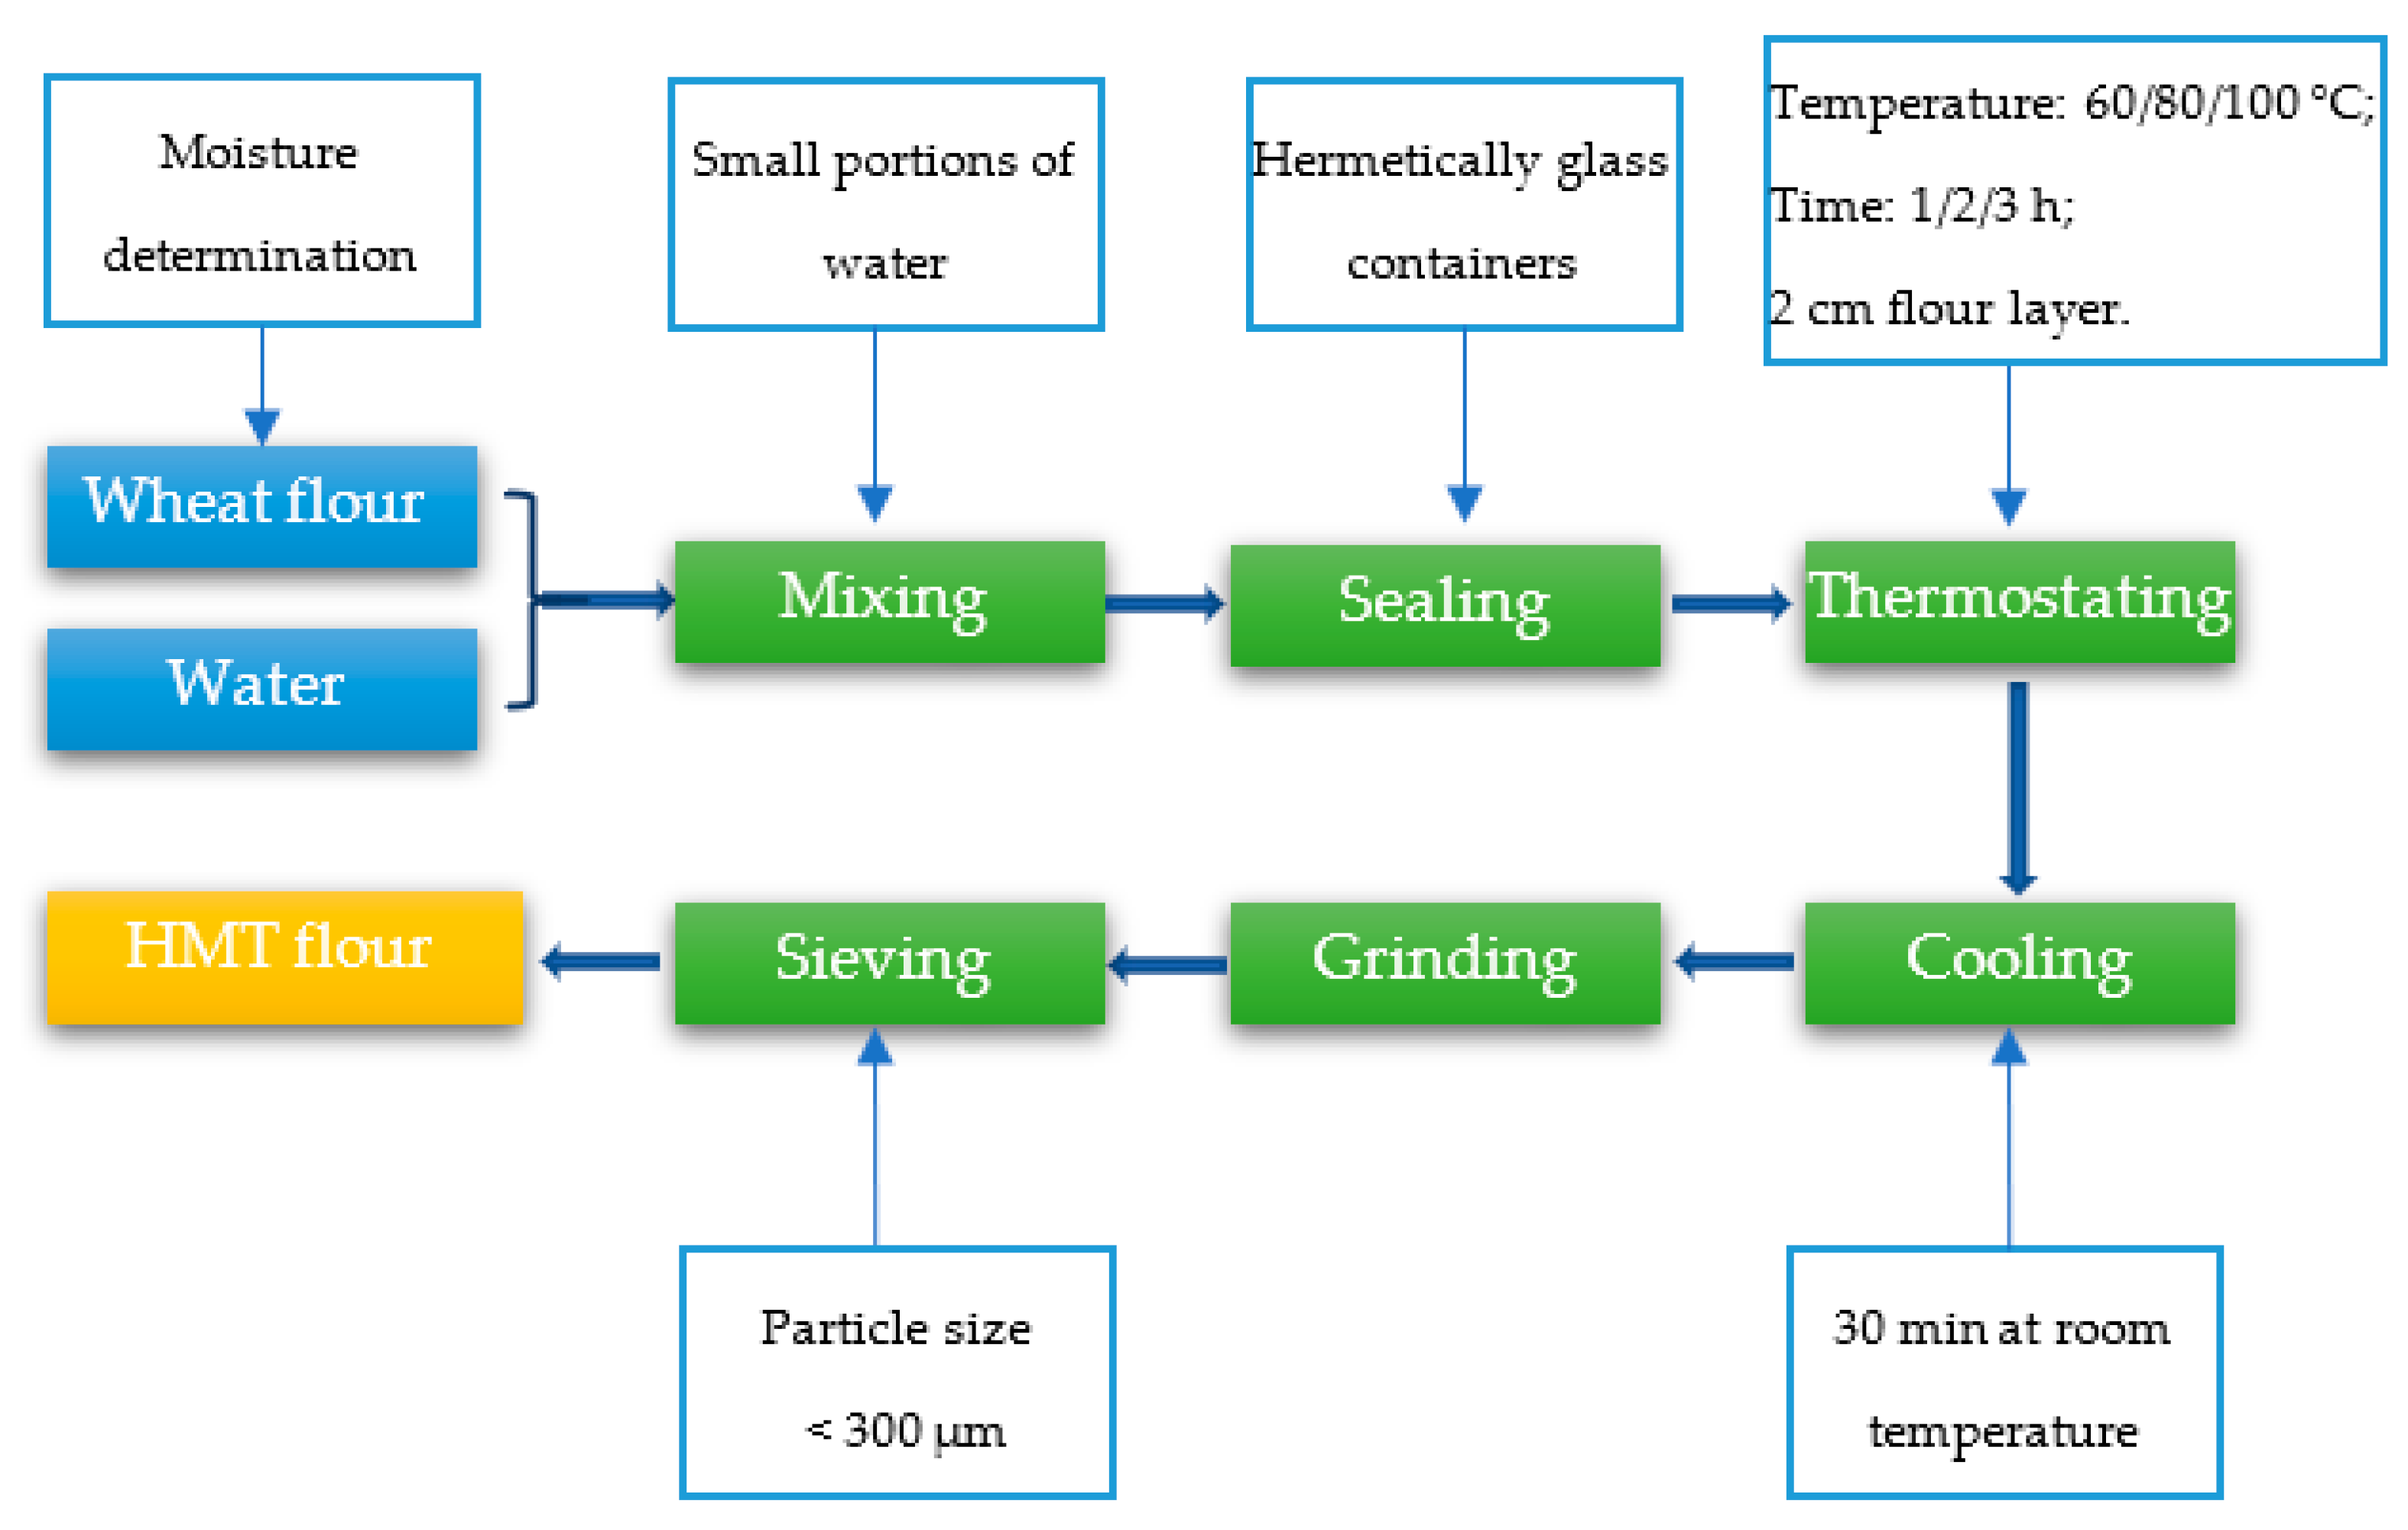
Figure 1. Heat moisture treatment (HMT) graphical representation.
Applsci 11 05403 g001
Figure 2. Three-dimensional response surface plots presenting the synergistic effects of factors on dough elastic G’ (a,b) and viscous G” (c,d) moduli.
Applsci 11 05403 g002
Figure 3. Three-dimensional response surface plots presenting the synergistic effects of factors: GPF level–temperature (a) and moisture-time (b) on dough firmness.
Applsci 11 05403 g003
Figure 4. Three-dimensional response surface plots presenting the synergistic effects of factors: GPF level–temperature (a) and moisture-time (b) on dry pasta luminosity (L*).
Applsci 11 05403 g004
Figure 5. Three-dimensional response surface plots presenting the synergistic effects of factors: GPF level–temperature (a) and moisture-time (b) on dietary fiber content (DF).
Applsci 11 05403 g005
Figure 6. Three-dimensional response surface plots presenting the synergistic effects of factors: GPF level–temperature (a) and moisture-time (b) on total polyphenolics content (TPC).
Applsci 11 05403 g006
Figure 7. Three-dimensional response surface plots presenting the synergistic effects of factors: GPF level–temperature (a) and moisture-time (b) on pasta firmness.
Applsci 11 05403 g007
Figure 8. Three-dimensional response surface plots presenting the synergistic effects of factors: GPF level–temperature (a) and moisture-time (b) on pasta gumminess.
Applsci 11 05403 g008
Figure 9. Three-dimensional response surface plots presenting the synergistic effects of factors: GPF level–temperature (a) and moisture-time (b) on pasta resistant starch (RS).
Applsci 11 05403 g009
Table 1. Codded vs. real values of the factors and values of the responses.
Exp. NoCoded Values of
Factors
Real Values of FactorsValues of the Responses
ABCDTemperature
(°C)
Time
(h)
Moisture (%)GPF Level (%)G’ (Pa)G” (Pa)Dough Firmness (g)L*RS
(%)
TPC
(mg GAE/
100 g)
Pasta Firmness (g)Pasta Gumminess (g)DF
(%)
1−1.00−1.00−1.00−1.0060.001.0014.001.0065,243.33 ± 4125.4921,620.00 ± 1230.492394.67 ± 80.6472.50 ± 0.201.35 ± 0.0310.40 ± 0.145582.33 ± 139.524582.05 ± 64,67 0.04 ± 0.02
2−1.00−1.00−1.001.0060.001.0014.006.00115,366.67 ± 6107.6536,690.00 ± 1839.592851.67 ± 98.2965.25 ± 0.141.75 ± 0.0212.85 ± 0.085077.00 ± 30.053979.43 ± 103.131.10 ± 0.00
3−1.00−1.001.00−1.0060.001.0030.001.0092,510.00 ± 4133.6328,150.00 ± 1192.642317.33 ± 39.8073.37 ± 0.192.21 ± 0.0310.42 ± 0.364769.00 ± 99.833702.50 ± 88.170.85 ± 0.05
4−1.00−1.001.001.0060.001.0030.006.0096,053.33 ± 7110.2929,543.33 ± 2363.902529.00 ± 87.5465.09 ± 0.862.39 ± 0.0414.38 ± 0.415532.67 ± 38.733475.66 ± 133.511.95 ± 0.05
5−1.000.000.000.0060.002.0022.003.5096,845.00 ± 985.0030,820.00 ± 750.002382.33 ± 85.6568.44 ± 0.402.36 ± 0.0611.70 ± 0.235646.67 ± 161.383571.40 ± 32.501.10 ± 0.00
6−1.001.00−1.00−1.0060.003.0014.001.0062,435.00 ± 2745.0020,715.00 ± 1025.002087.67 ± 43.8271.44 ± 0.291.69 ± 0.028.85 ± 0.085257.67 ± 149.313917.56 ± 188.130.10 ± 0.00
7−1.001.00−1.001.0060.003.0014.006.00110,300.00 ± 4500.0036,245.00 ± 1305.002973.67 ± 179.6263.42 ± 0.332.09 ± 0.0314.09 ± 0.354749.00 ± 209.163640.87 ± 114.961.35 ± 0.05
8−1.001.001.00−1.0060.003.0030.001.00111,300.00 ± 9139.4731,683.33 ± 2632.382593.67 ± 81.8674.33 ± 74.332.14 ± 0.0310.22 ± 0.185171.19 ± 41.563319.90 ± 78.631.10 ± 0.00
9−1.001.001.001.0060.003.0030.006.00123,733.33 ± 7958.8536,056.67 ± 2643.562830.00 ± 28.3568.60 ± 0.132.32 ± 0.0214.20 ± 0.245509.38 ± 256.633703.64 ± 230.562.20 ± 0.10
100.00−1.000.000.0080.001.0022.003.50179,900.00 ± 12,019.9848,253.33 ± 2805.542607.00 ± 181.3572.51 ± 0.071.41 ± 0.0411.83 ± 0.334690.00 ± 115.573439.52 ± 45.242.10 ± 0.00
110.000.00−1.000.0080.002.0014.003.5090,680.00 ± 6131.8629,120.00 ± 1993.662592.33 ± 125.0169.31 ± 0.211.30 ± 0.0112.21 ± 0.084569.00 ± 51.513826.95 ± 117.561.30 ± 0.10
120.000.000.00−1.0080.002.0022.001.00192,200.00 ± 6773.4846,030.00 ± 1203.372623.67 ± 70.7477.52 ± 0.151.35 ± 0.039.64 ± 0.054782.67 ± 192.733758.35 ± 194.281.65 ± 0.05
130.000.000.000.0080.002.0022.003.50171,123.33 ± 85,406.9749,411.17 ± 4023.583036.04 ± 148.8769.57 ± 1.581.40 ± 0.0212.60 ± 0.264471.00 ± 160.083478.30 ± 78.552.25 ± 0.04
140.000.000.001.0080.002.0022.006.00243,933.33 ± 7211.3359,853.33 ± 2311.543365.33 ± 116.9866.32 ± 0.041.46 ± 0.0112.70 ± 0.704676.67 ± 188.603260.48 ± 14.932.95 ± 0.15
150.000.001.000.0080.002.0030.003.50311,533.33 ± 18,779.3365,976.67 ± 4810.644694.33 ± 444.0873.20 ± 0.651.62 ± 0.0511.06 ± 0.224589.67 ± 257.413151.64 ± 173.892.15 ± 0.05
160.001.000.000.0080.003.0022.003.50259,600.00 ± 15,661.4258,203.33 ± 4250.843443.67 ± 110.2172.36 ± 0.511.58 ± 0.0111.00 ± 0.225504.00 ± 184.463438.89 ± 94.962.25 ± 0.05
171.00−1.00−1.00−1.00100.001.0014.001.00146,400.00 ± 13,596.6938,243.33 ± 3639.133697.67 ± 53.6177.52 ± 0.061.01 ± 0.009.73 ± 0.193750.33 ± 168.003913.92 ± 149.771.70 ± 0.00
181.00−1.00−1.001.00100.001.0014.006.00194,733.33 ± 6165.5050,006.67 ± 1664.523856.00 ± 131.6463.91 ± 0.371.30 ± 0.0213.67 ± 0.224415.67 ± 214.313599.77 ± 71.852.90 ± 0.10
191.00−1.001.00−1.00100.001.0030.001.00244,766.67 ± 5784.7541,600.00 ± 1398.716012.67 ± 374.6877.72 ± 0.181.84 ± 0.038.46 ± 0.384232.00 ± 118.443328.82 ± 152.721.80 ± 0.00
201.00−1.001.001.00100.001.0030.006.00345,150.00 ± 750.0057,360.00 ± 1120.006505.33 ± 104.5871.21 ± 0.151.87 ± 0.0212.24 ± 0.084699.33 ± 95.353229.02 ± 24.202.20 ± 0.10
211.000.000.000.00100.002.0022.003.5321,033.33 ± 11,834.8459,920.00 ± 2044.705869.00 ± 156.6073.53 ± 0.371.72 ± 0.027.72 ± 0.254225.00 ± 189.813413.43 ± 63.802.15 ± 0.25
221.001.00−1.00−1.00100.003.0014.001.00195,550.00 ± 8150.0038,915.00 ± 1865.005956.33 ± 50.8277.34 ± 0.131.39 ± 0.036.94 ± 0.034445.67 ± 105.703718.83 ± 166.232.20 ± 0.10
231.001.00−1.001.00100.003.0014.006.00343,300.00 ± 11,200.0063,195.00 ± 525.006502.67 ± 70.0171.28 ± 0.151.88 ± 0.049.99 ± 0.033405.33 ± 335.503451.07 ± 151.603.00 ± 0.10
241.001.001.00−1.00100.003.0030.001.00566,866.67 ± 23,071.7085,683.33 ± 3634.373522.33 ± 264.0874.43 ± 0.201.81 ± 0.017.04 ± 0.033598.33 ± 56.703365.23 ± 47.141.60 ± 0.10
251.001.001.001.00100.003.0030.006.00441,700.00 ± 42,785.6367,473.33 ± 6410.433423.33 ± 58.7171.53 ± 0.342.10 ± 0.0210.13 ± 0.203500.67 ± 47.172645.07 ± 67.372.90 ± 0.00
G’—elastic modulus, G”—viscous modulus, L*—luminosity, DF—dietary fiber, TPC—total polyphenolics content, RS—resistant starch.
Table 2. ANOVA results for quadratic model fitted to pasta dough parameters.
FactorG’ (Pa)G” (Pa)Dough Firmness (g)
Constant211,420.2151,275.413248.00
A106,984.07 **12,826.30 **1243.63 **
B40,814.54 **4816.85 **31.22
C56,089.17 **6043.15 **84.19
D18,722.13 **4654.63 **201.72 *
A × B36,110.73 **3710.00 **−66.21
A × C40,515.52 **3224.58 **−31.96
A × D3583.44−173.33−43.29
B × C17,204.90 *3233.33 **−607.21 **
B × D−7468.85−1125.8315.63
C × D−18,929.90 **−3957.92 **−75.37
A2−4938.95−6526.83 **807.01 **
B25871.891331.50−293.32
C2−12,771.45−4348.50324.68
D24188.551044.84−324.16
Model diagnostic
p-value<0.01<0.01<0.01
R20.930.860.76
Adj.-R20.910.830.71
A—temperature, B—time, C—moisture, D—GPF level, G’—elastic modulus, G”—viscous modulus, *—significant at p < 0.05, **—significant at p < 0.01.
Table 3. ANOVA results for quadratic model fitted to dry pasta parameters.
FactorL*DF (%)TPC (mg GAE/100 g)
Constant71.102.1111.52
A2.00 **0.59 **−1.18 **
B0.310.11 **−0.64 **
C0.97 **0.17 **−0.03
D−3.86 **0.53 **1.81 **
A × B0.160.02−0.58 **
A × C−0.25−0.30 **−0.34 **
A × D0.01−0.05 *−0.11
B × C−0.170.010.18
B × D0.81 **0.040.08
C × D0.72 **−0.030.01
A2−0.62−0.44 **−1.45 **
B20.820.110.25
C2−0.36−0.34 **0.47 *
D20.300.24 **0.01
Model diagnostic
p-value<0.01<0.01<0.01
R20.870.970.92
Adj.-R20.840.960.90
A—temperature, B—time, C—moisture, D—GPF level, L*—luminosity, DF—dietary fiber, TPC—total polyphenolics content, *—significant at p < 0.05, **—significant at p < 0.01.
Table 4. ANOVA results for quadratic model fitted to cooked pasta parameters.
FactorPasta Firmness (g)Pasta Gumminess (g)RS (%)
Constant4773.373454.781.49
A−612.37 **−179.33 **−0.19 **
B−89.28 *−113.87 **0.10 **
C19.46−261.61 **0.25 **
D−1.30−145.68 **0.13 **
A × B−117.10 *16.650.04 **
A × C−18.93−12.33−0.01
A × D−5.82−42.47−0.01
B × C−30.3640.29−0.10 **
B × D−168.72 **22.660.03 *
C × D178.78 **49.88−0.06 **
A261.6845.480.52 **
B2222.84−7.73−0.02
C2−294.82 *42.35−0.05
D2−144.4962.48−0.11 **
Model diagnostic
p-value<0.01<0.01<0.01
R20.790.790.96
Adj.-R20.750.740.95
A—temperature, B—time, C—moisture, D—GPF level, RS—resistant starch, *—significant at p < 0.05, **—significant at p < 0.01.
Table 5. Minimum, maximum, and optimal values of the variables.
VariableMinMaxOptimal
A—Temperature (°C)60.00100.0087.56
B—Time (h)1.003.003.00
C—Moisture (%)14.0030.0026.01
D—GPF level (%)1.006.004.81
G’ (Pa)59,690.00586,600.00355,471.01
G” (Pa)19,690.0089,870.0067,972.84
Dough firmness (g)2058.006622.003355.70
L*63.0677.9371.90
RS (%)1.012.431.69
TPC (mg GAE/100 g)6.9014.8511.36
Pasta firmness (g)3028.005798.004473.80
Pasta gumminess (g)2575.704649.913132.90
DF (%)0.023.102.80
G’—elastic modulus, G”—viscous modulus, L*—luminosity, DF—dietary fiber, TPC—total polyphenolics content, RS—resistant starch.
Table 6. Correlations between dough and pasta properties.
VariablesL*Dough Firmness (g)Pasta
Firmness (g)
Pasta Gumminess (g)G’ (Pa)G” (Pa)TPC (mg GAE/100 g)DF (%)RS (%)
L*1.000.32 **−0.31 *−0.020.26 *0.13−0.81 **−0.12−0.27 *
Dough firmness (g) 1.00−0.51 **−0.33 **0.54 **0.48 **−0.39 **0.51 **−0.09
Pasta firmness (g) 1.000.43 **−0.68 **−0.63 **0.42 **−0.49 **0.27 *
Pasta Gumminess (g) 1.00−0.64 **−0.64 **0.03−0.65 **−0.31 *
G’ (Pa) 1.000.95 **−0.41 **0.57 **−0.01
G” (Pa) 1.00−0.23 *0.68 **−0.11
TPC (mg GAE/100 g) 1.000.170.19
DF (%) 1.00−0.10
RS (%) 1.00
L*—luminosity, G’—elastic modulus, G”—viscous modulus, TPC—total polyphenolics content, DF—dietary fiber, RS—resistant starch, *—significant at p < 0.05, **—significant at p < 0.01.
Publisher’s Note: MDPI stays neutral with regard to jurisdictional claims in published maps and institutional affiliations.