
Adhesion Strength Change Analysis Based on the Application Surface Area Ratio of Spot-Bonded Tiles on Vertical Walls of High Humidity Facilities

 and
and
Abstract
:1. Introduction
2. Theoretical Discussion
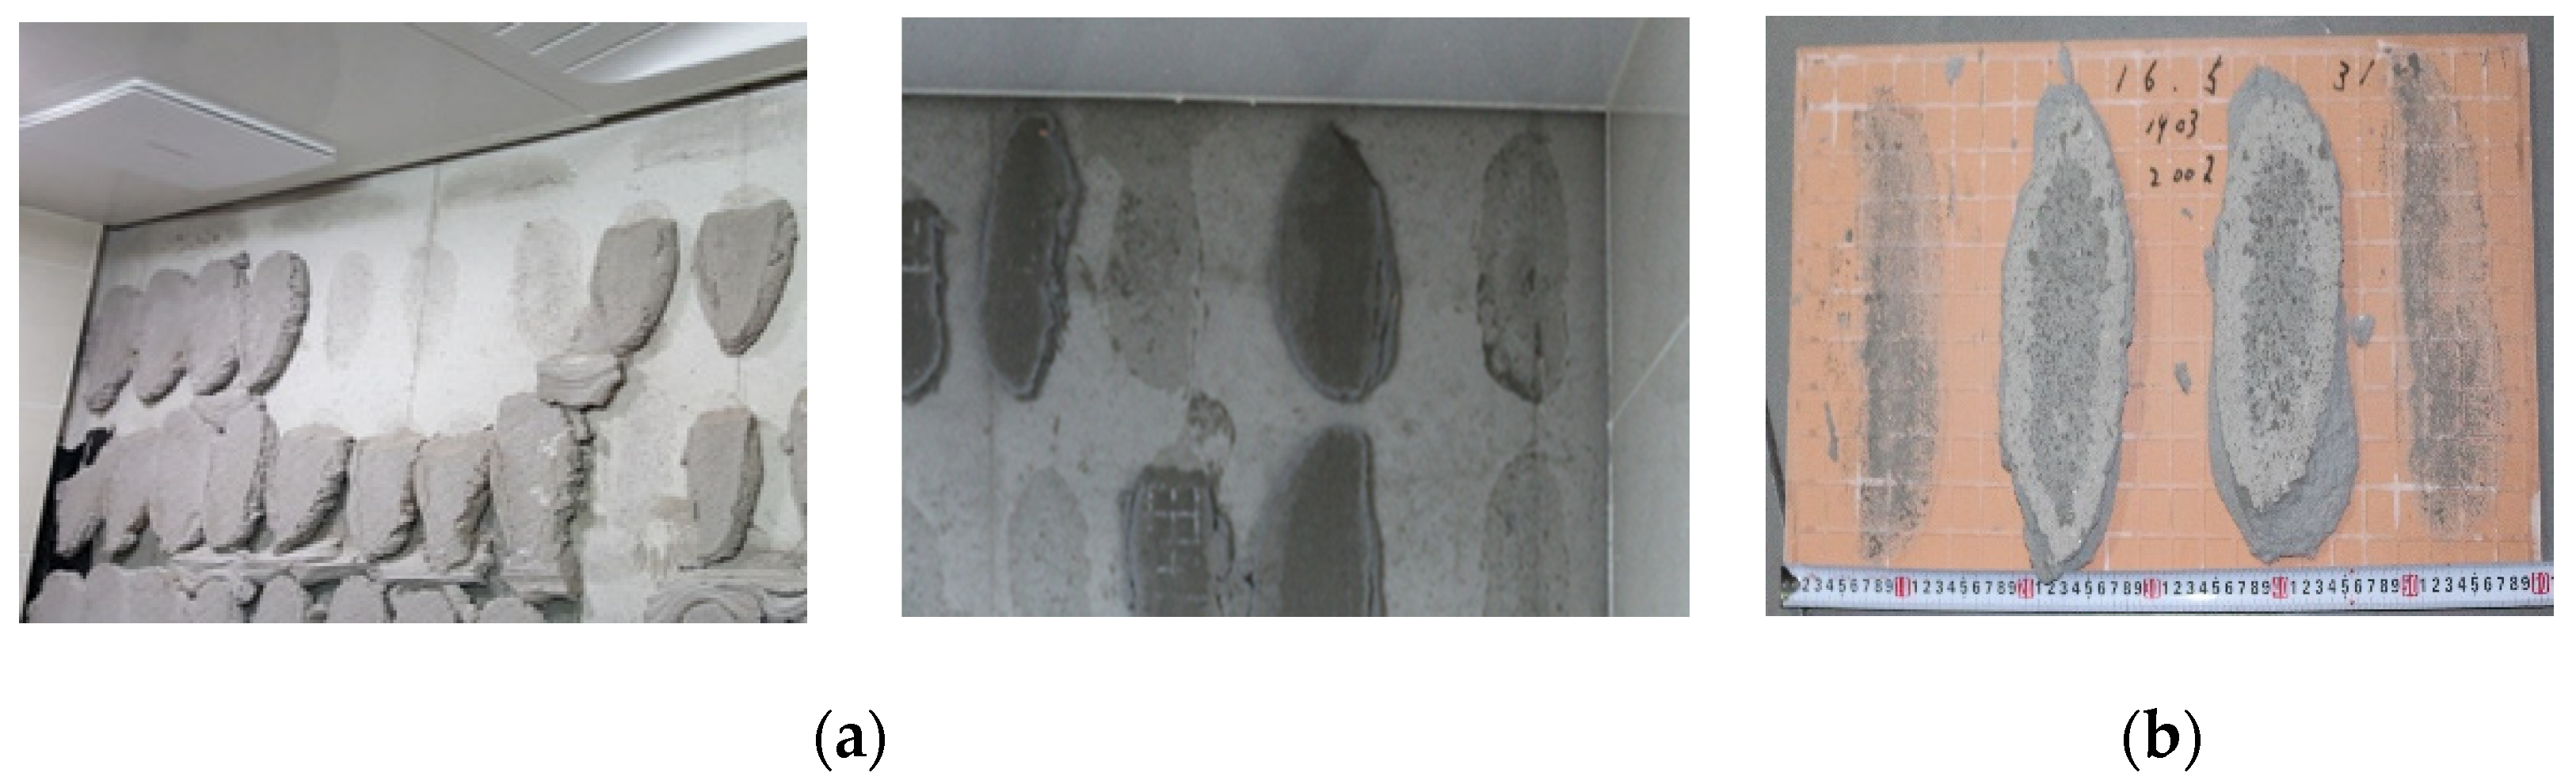
2.1. Background Research
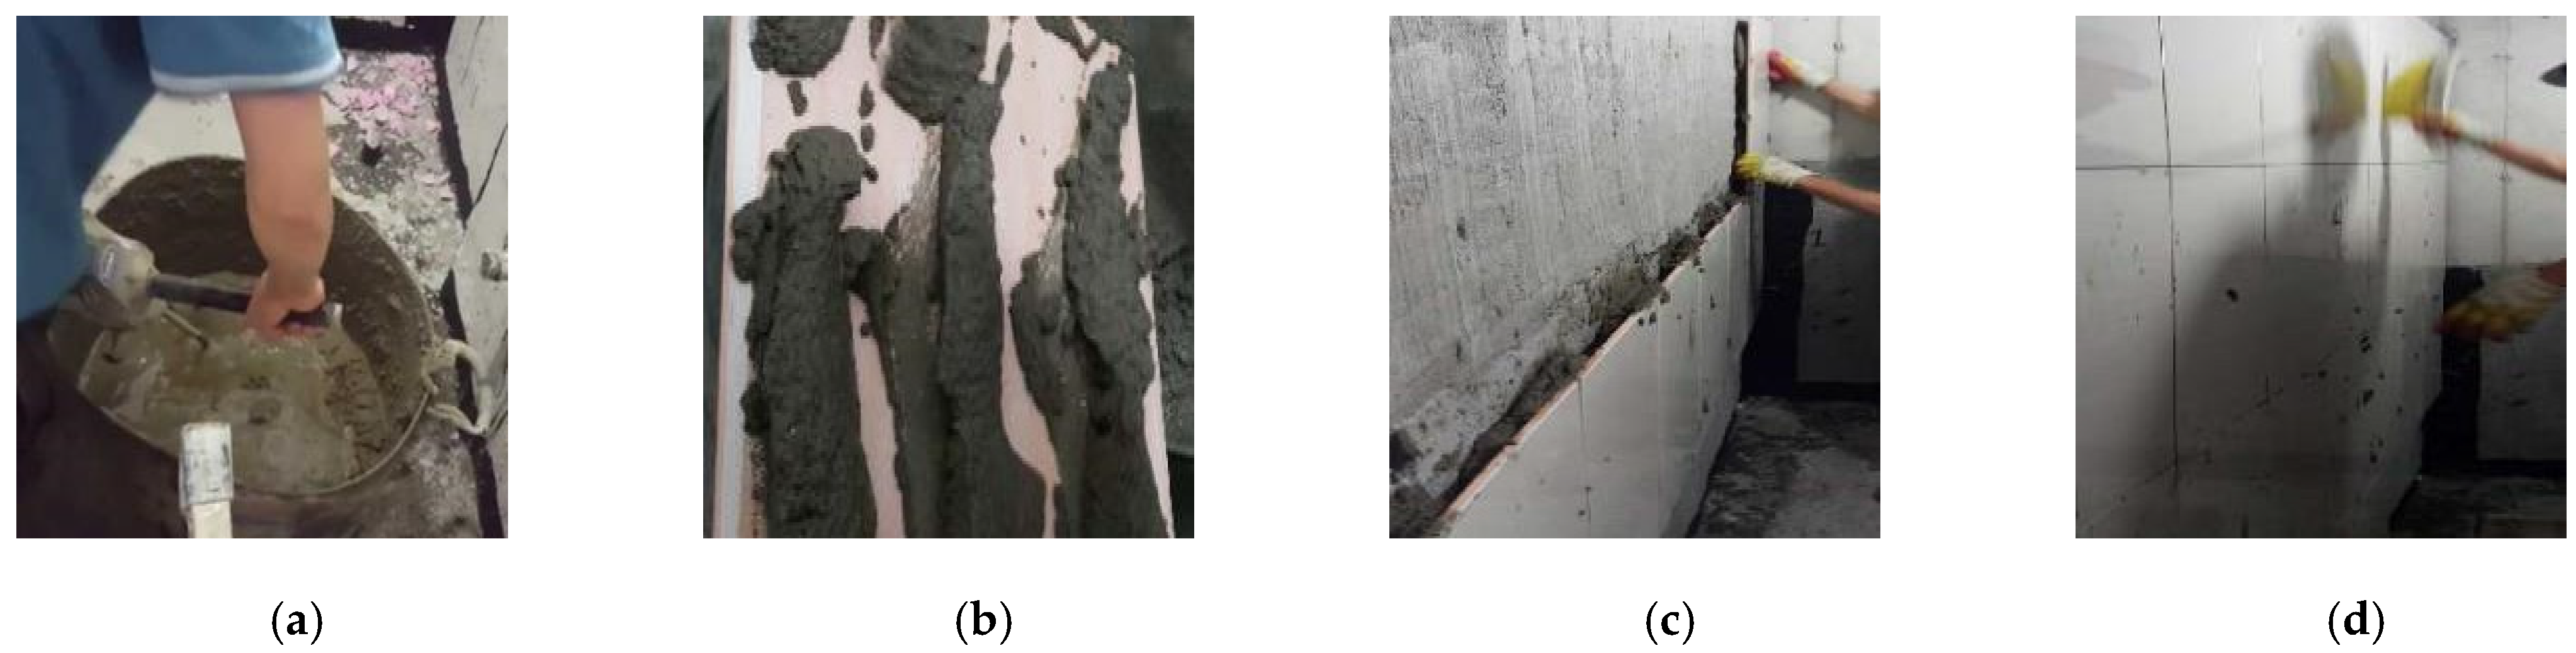
2.2. Tile Application Methods Comparison
3. Experimental Regime
3.1. Experimental Scope
3.2. Experimental Plan
3.2.1. Base Load Derivation
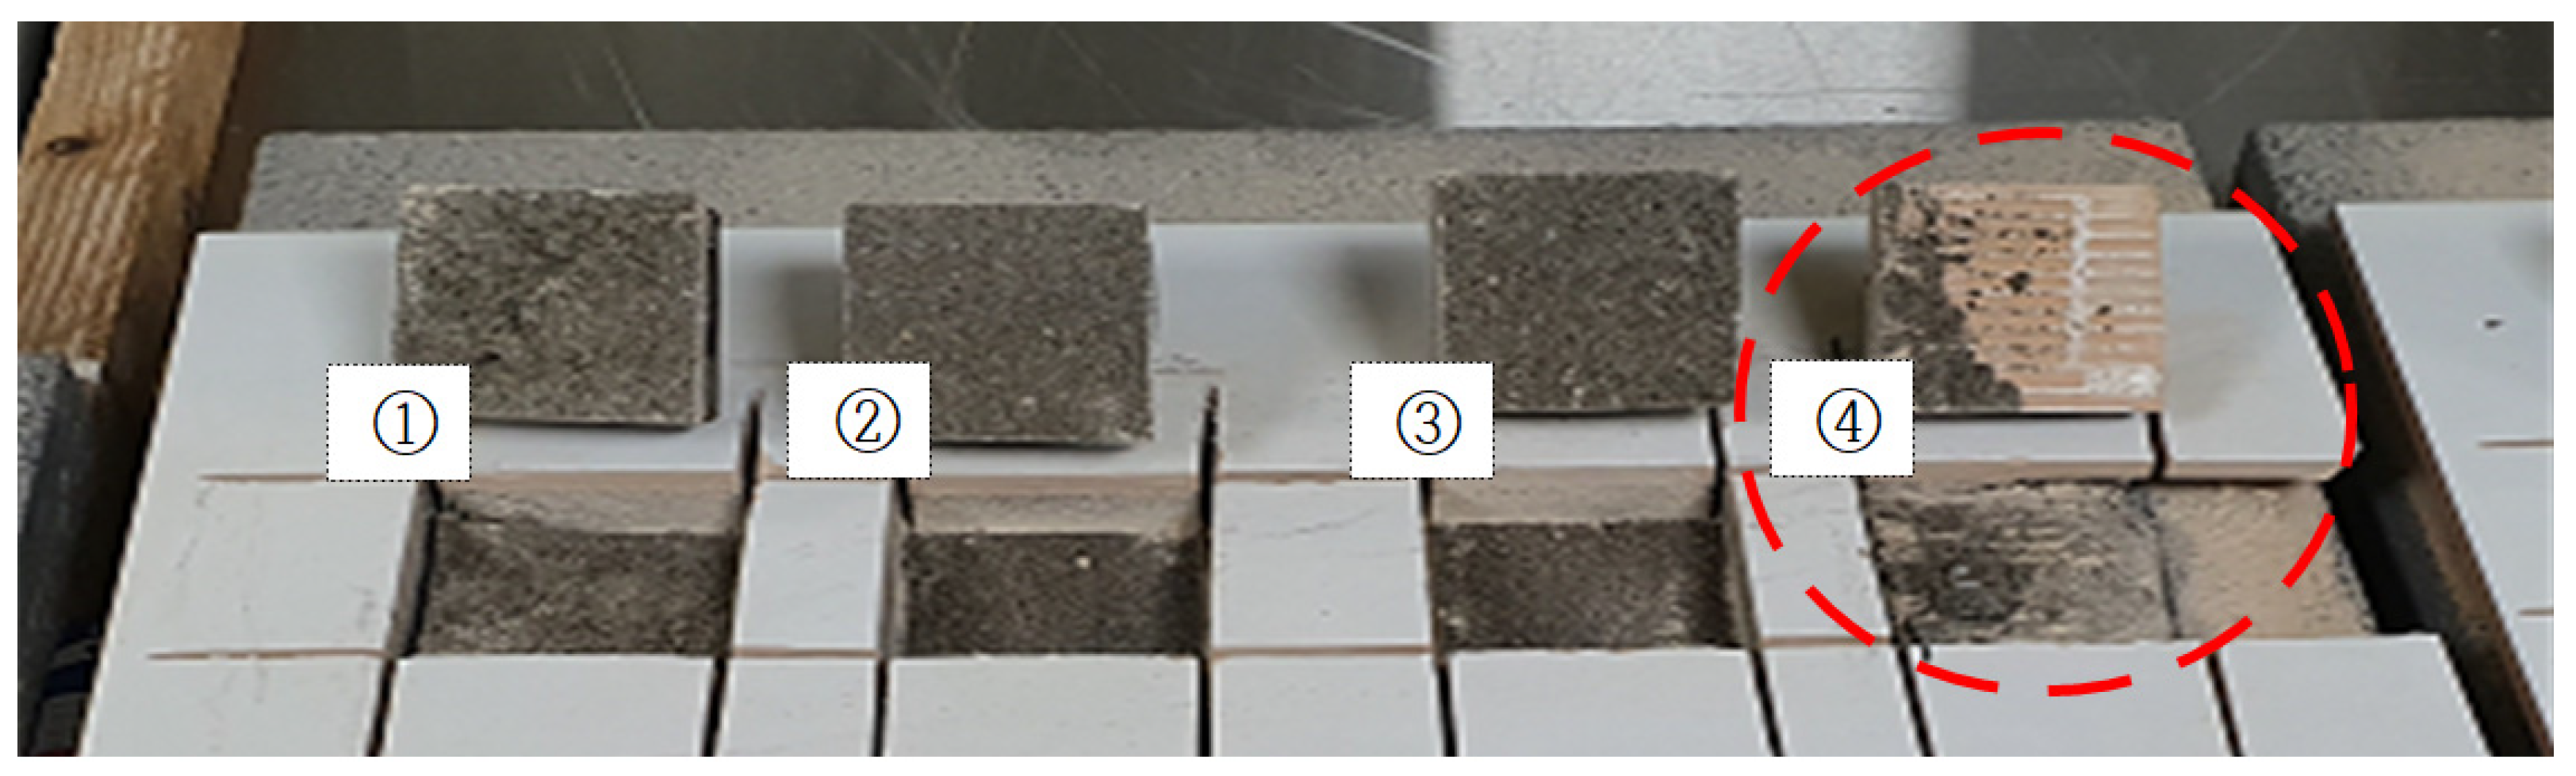
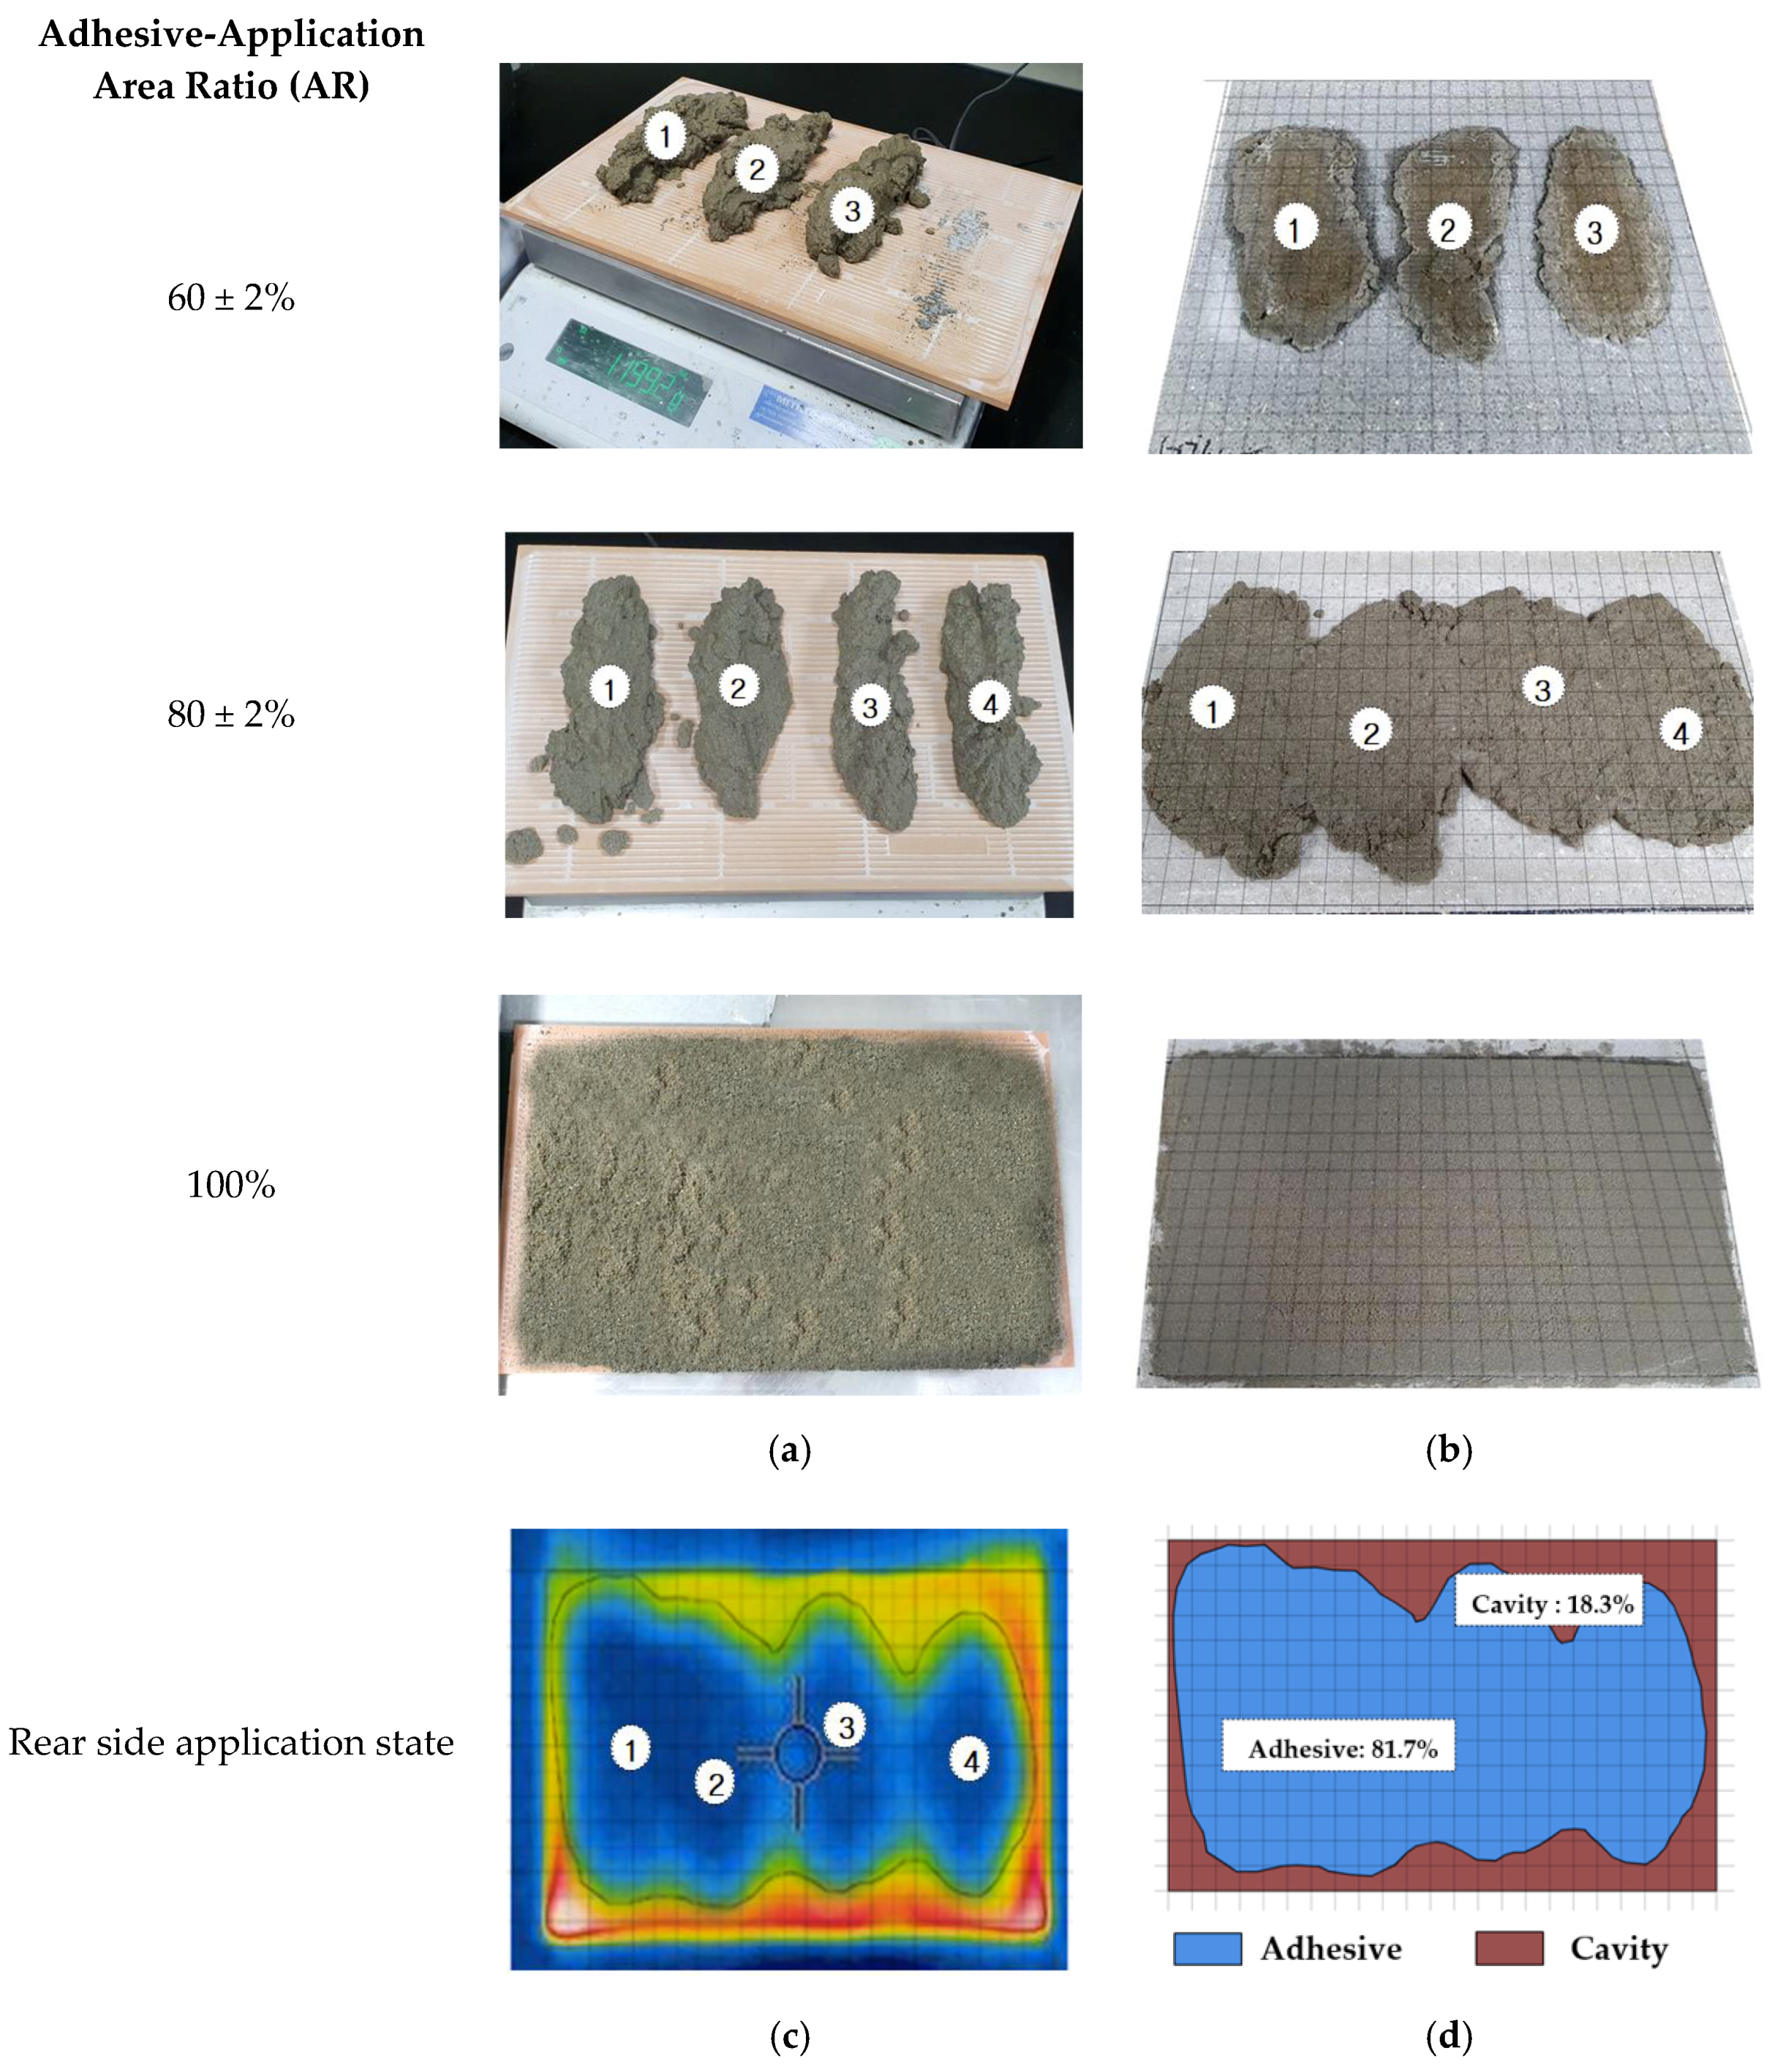
3.2.2. Method of Estimating the Adhesion Area of the Spot-Bonded Mortar
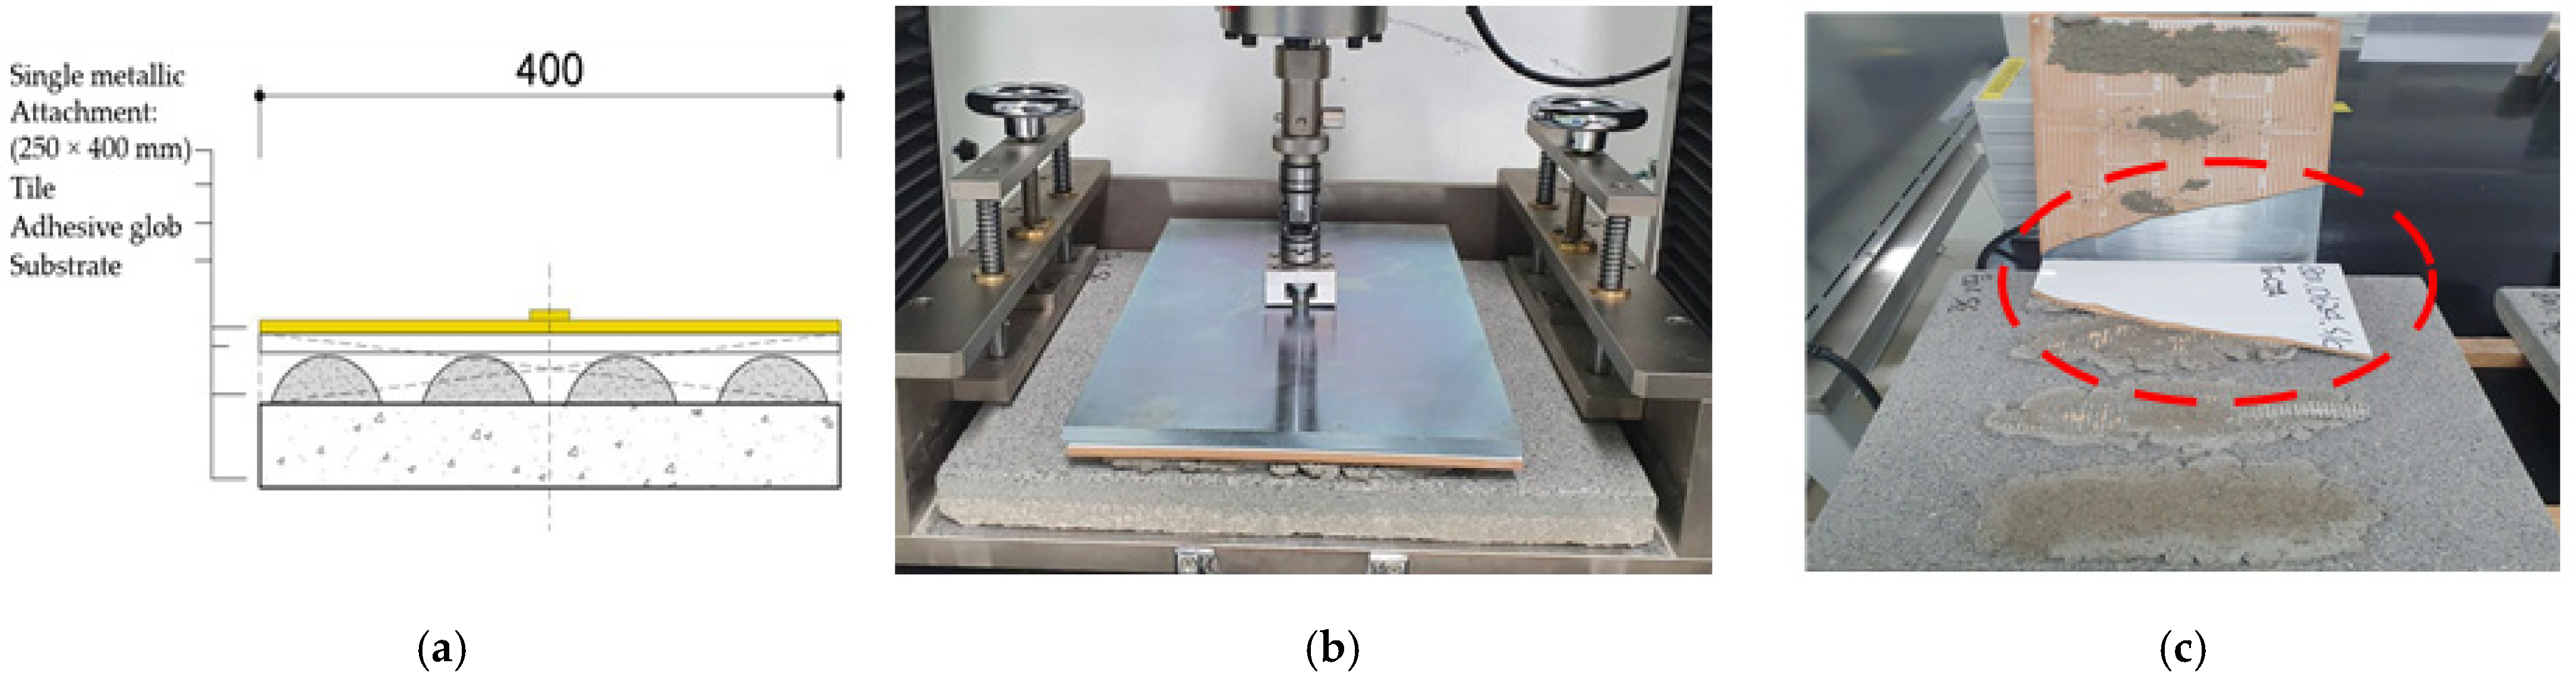
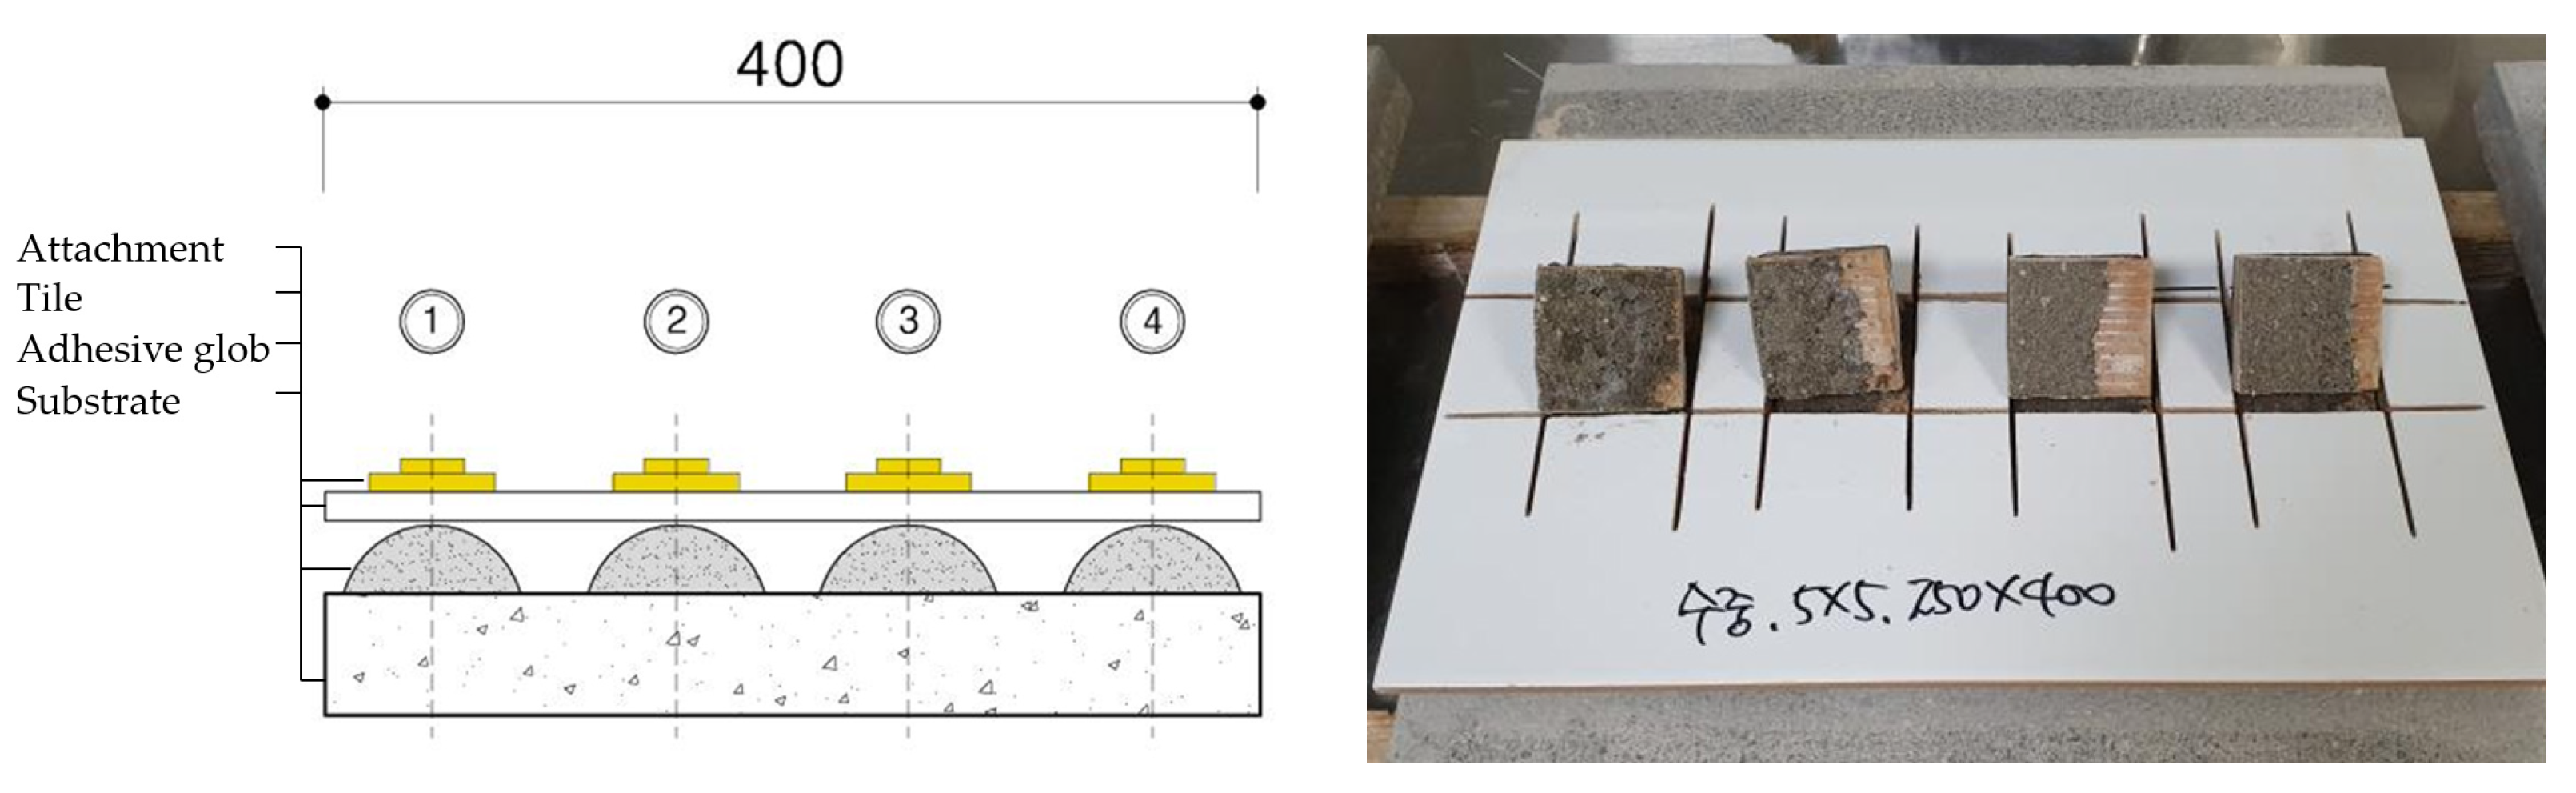
3.3. Adhesion Testing Method Preparation
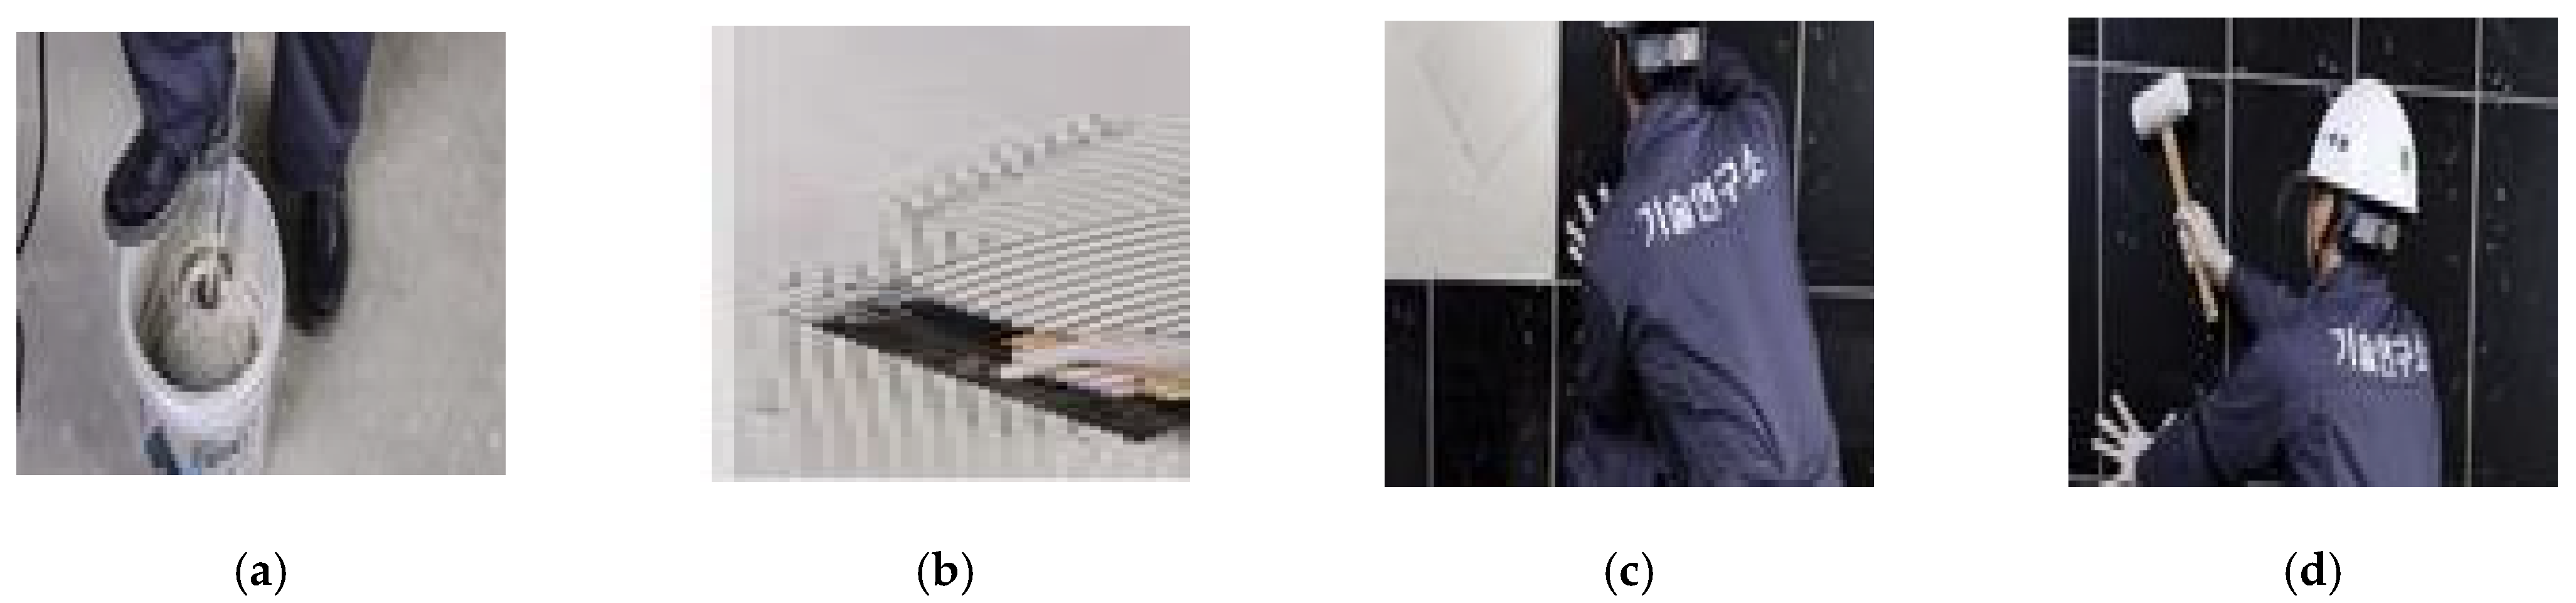
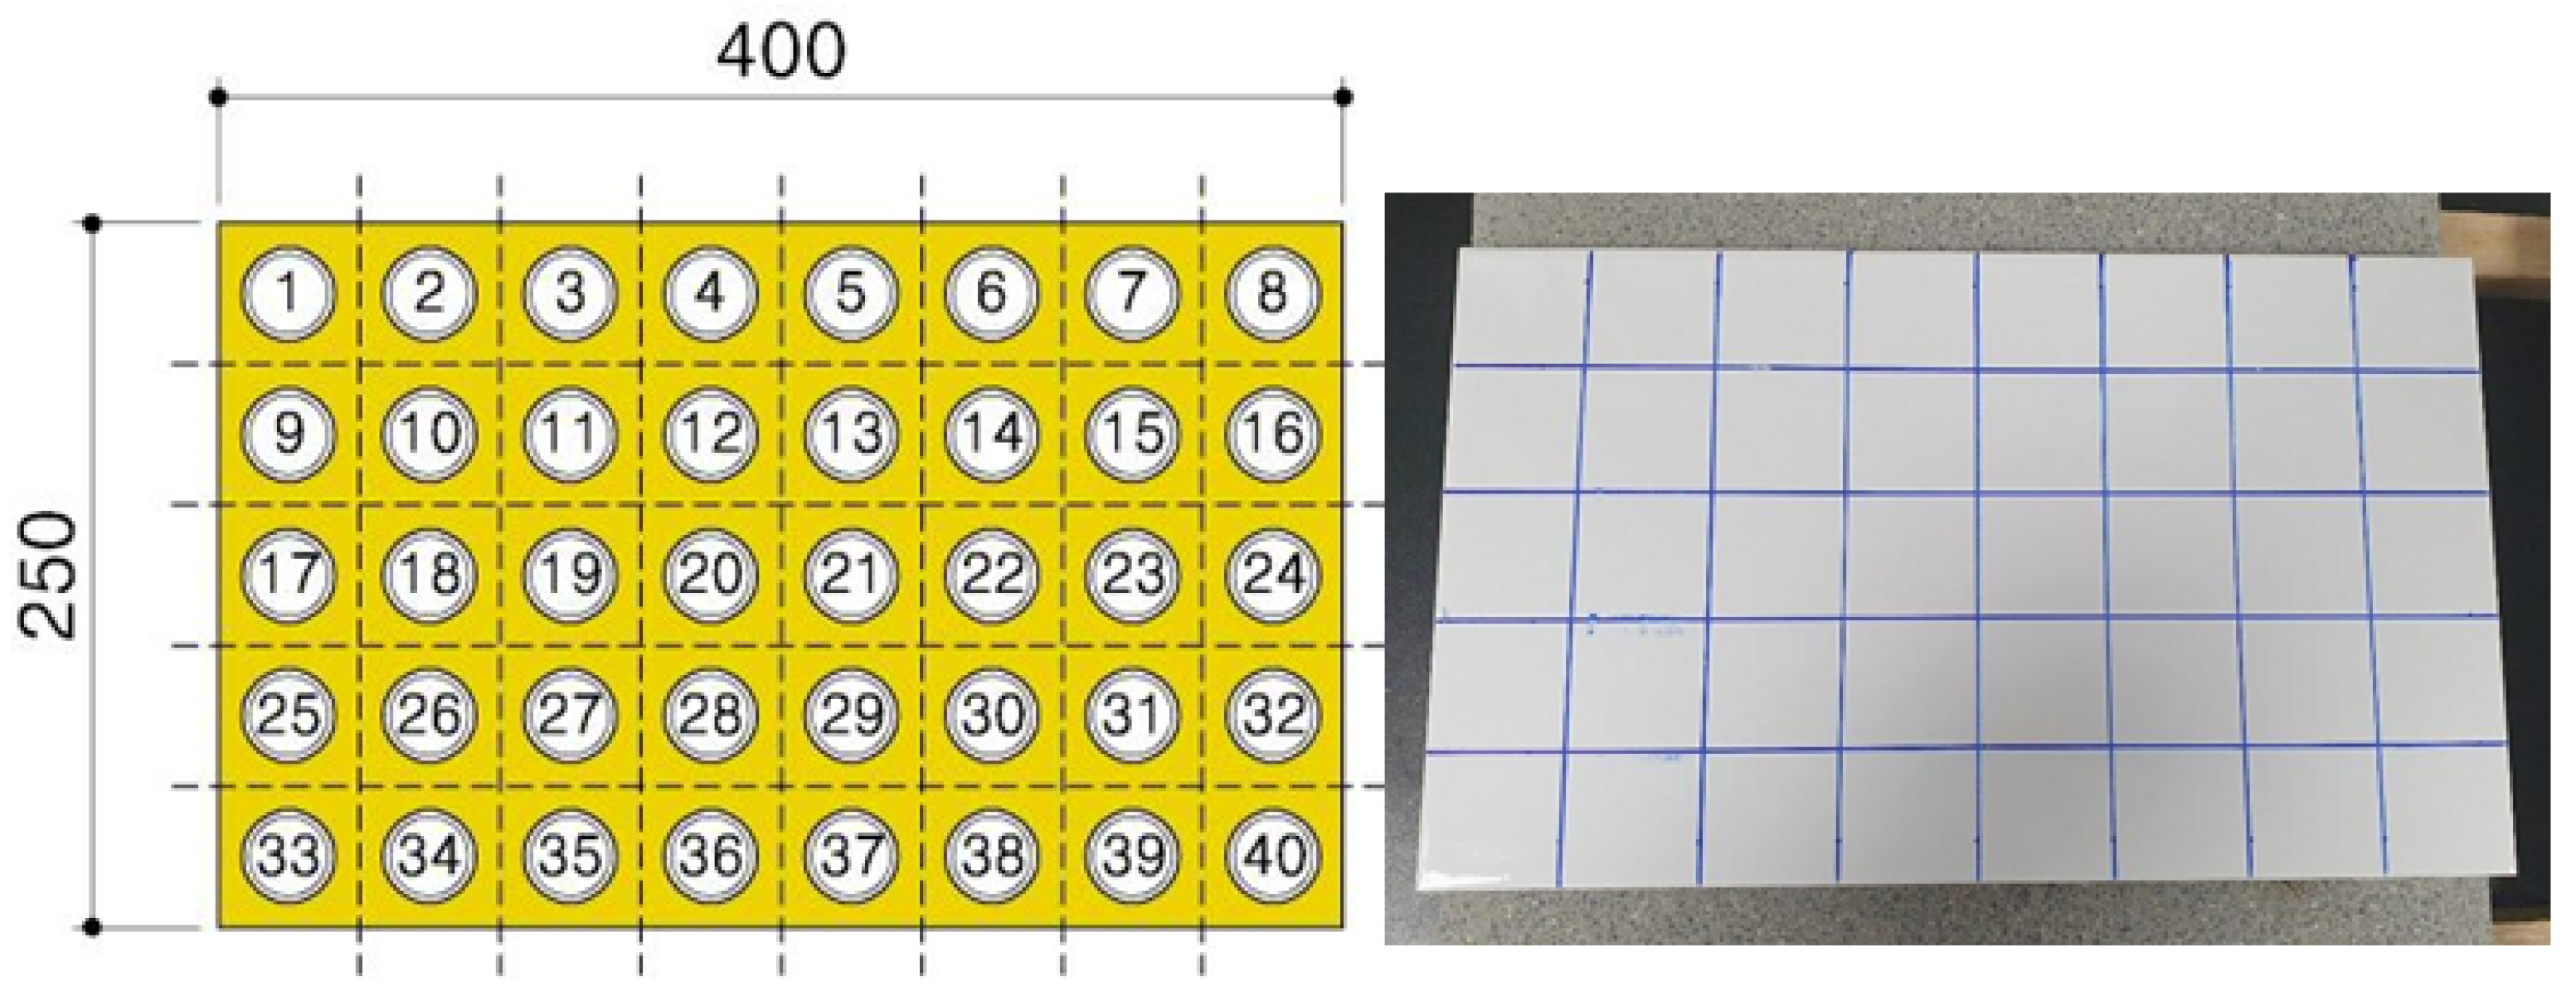
3.4. Specimen Preparation Method
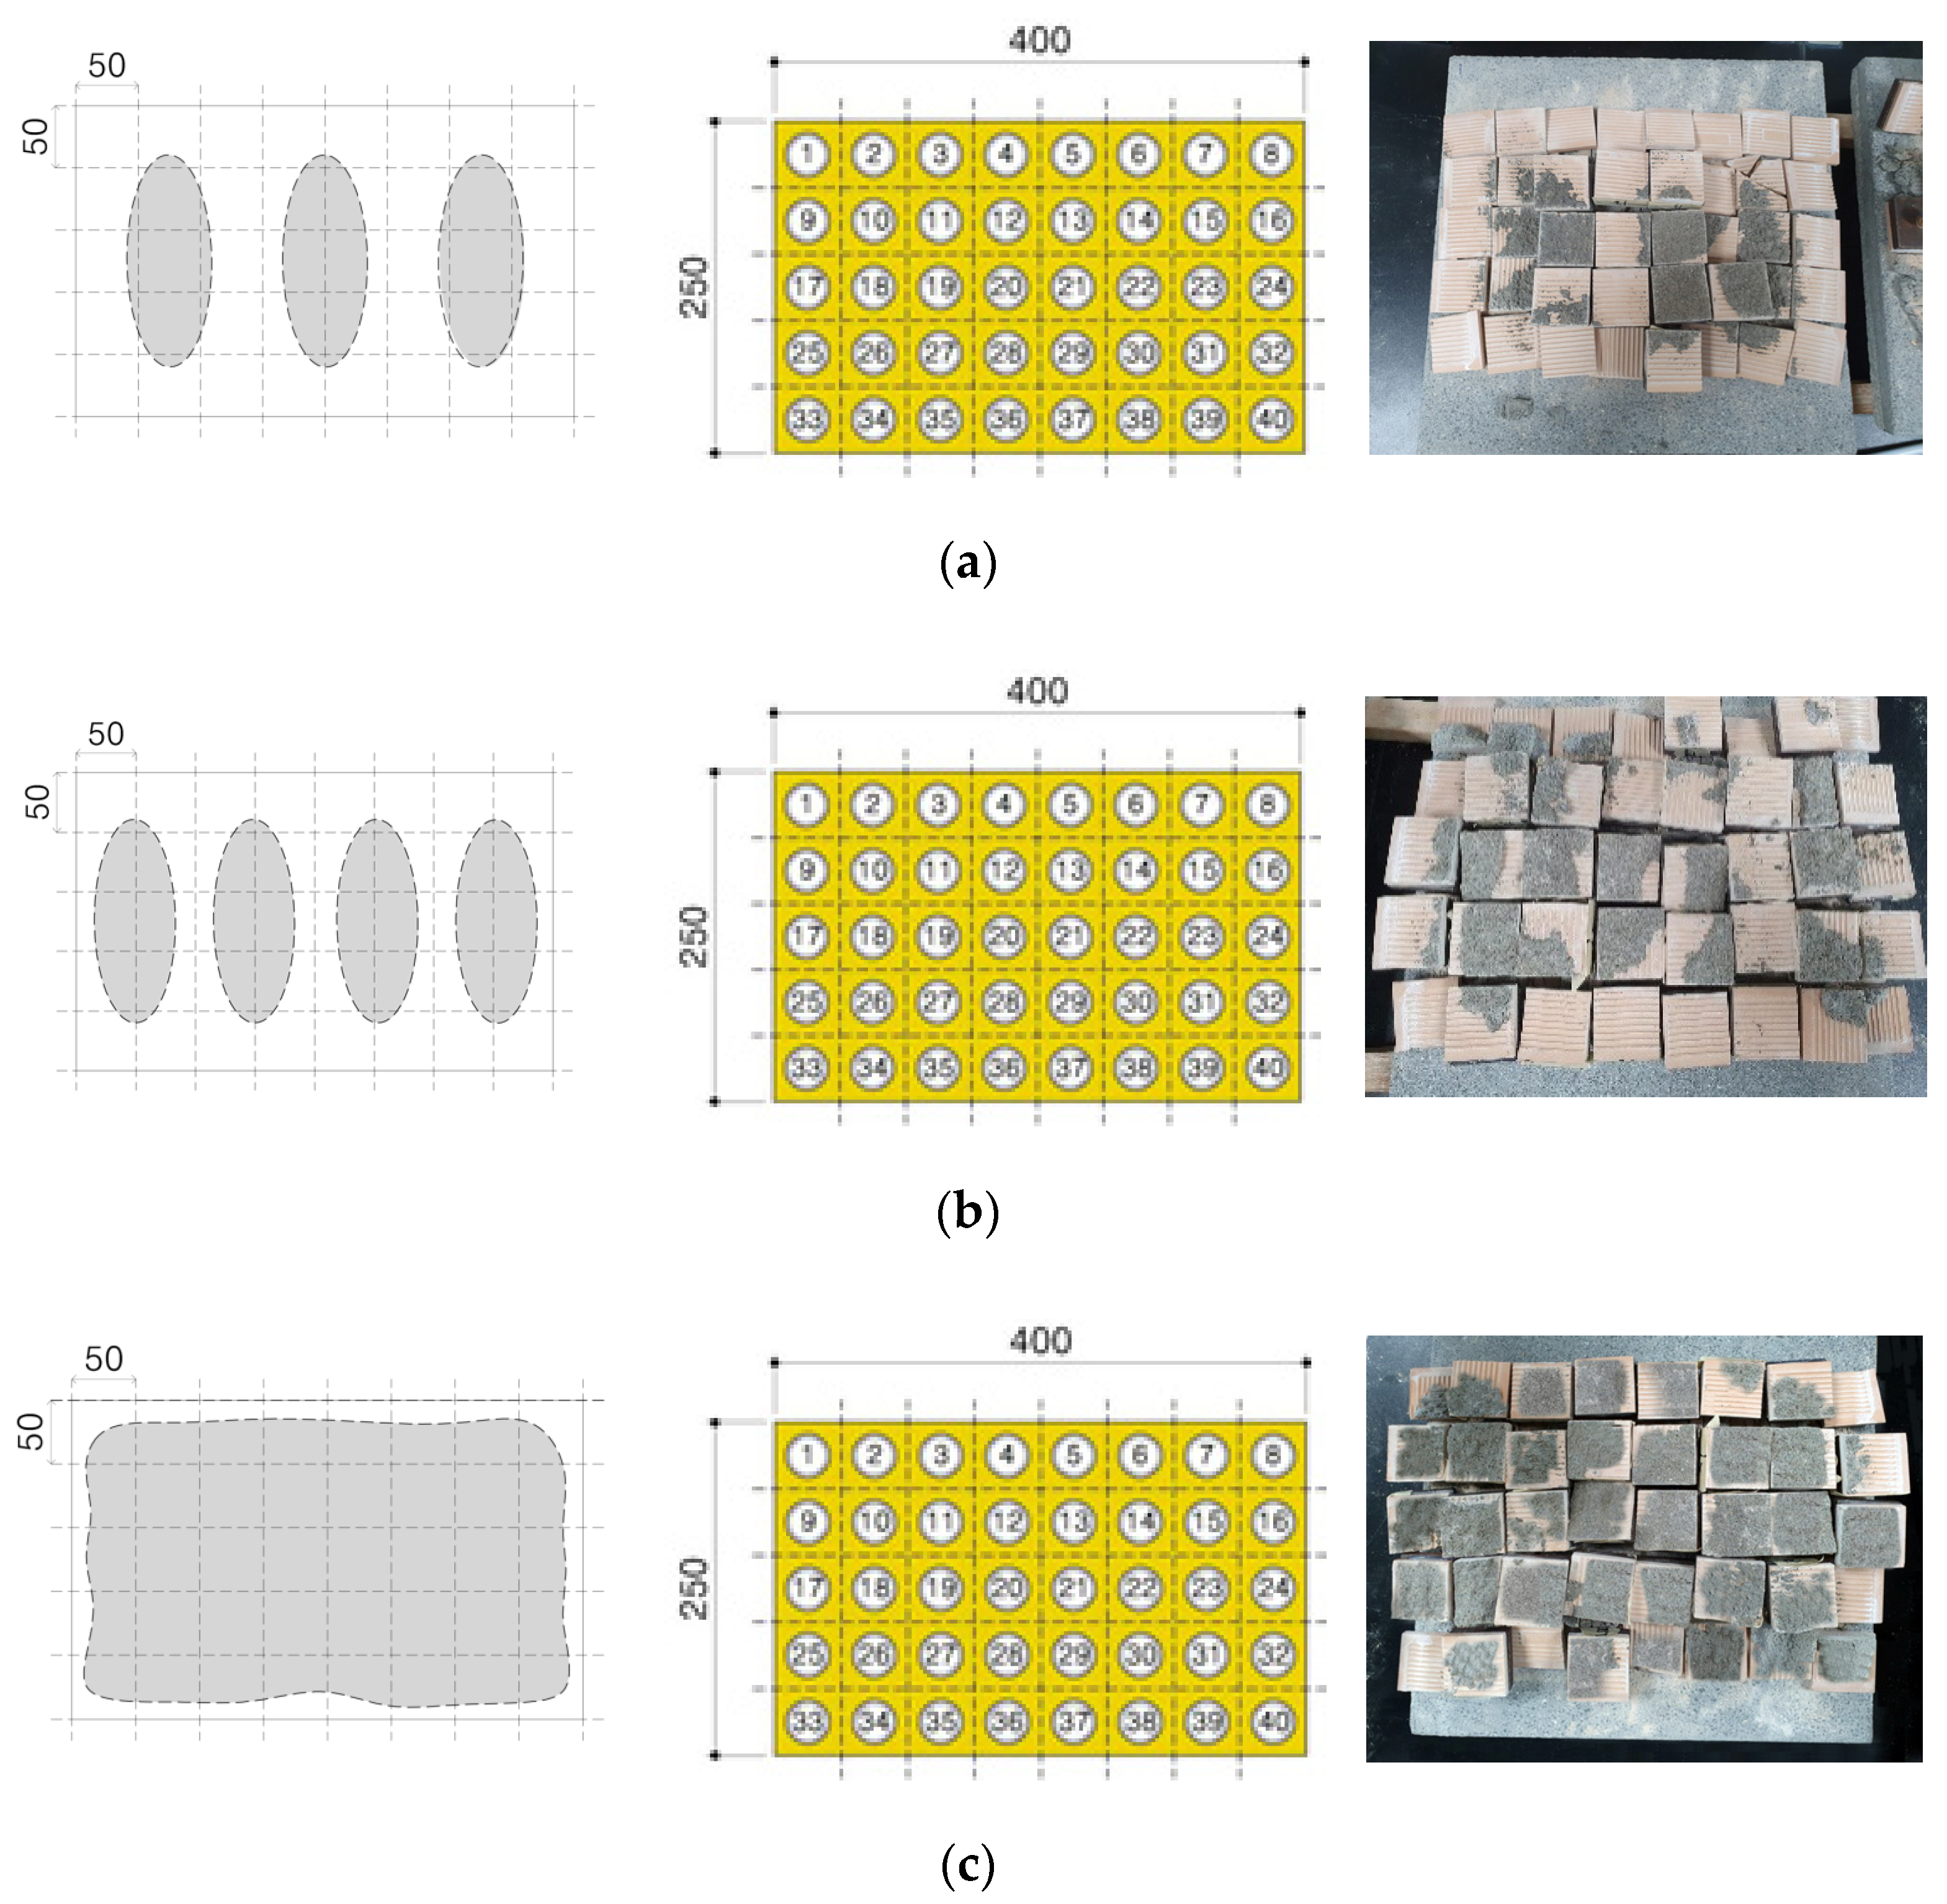
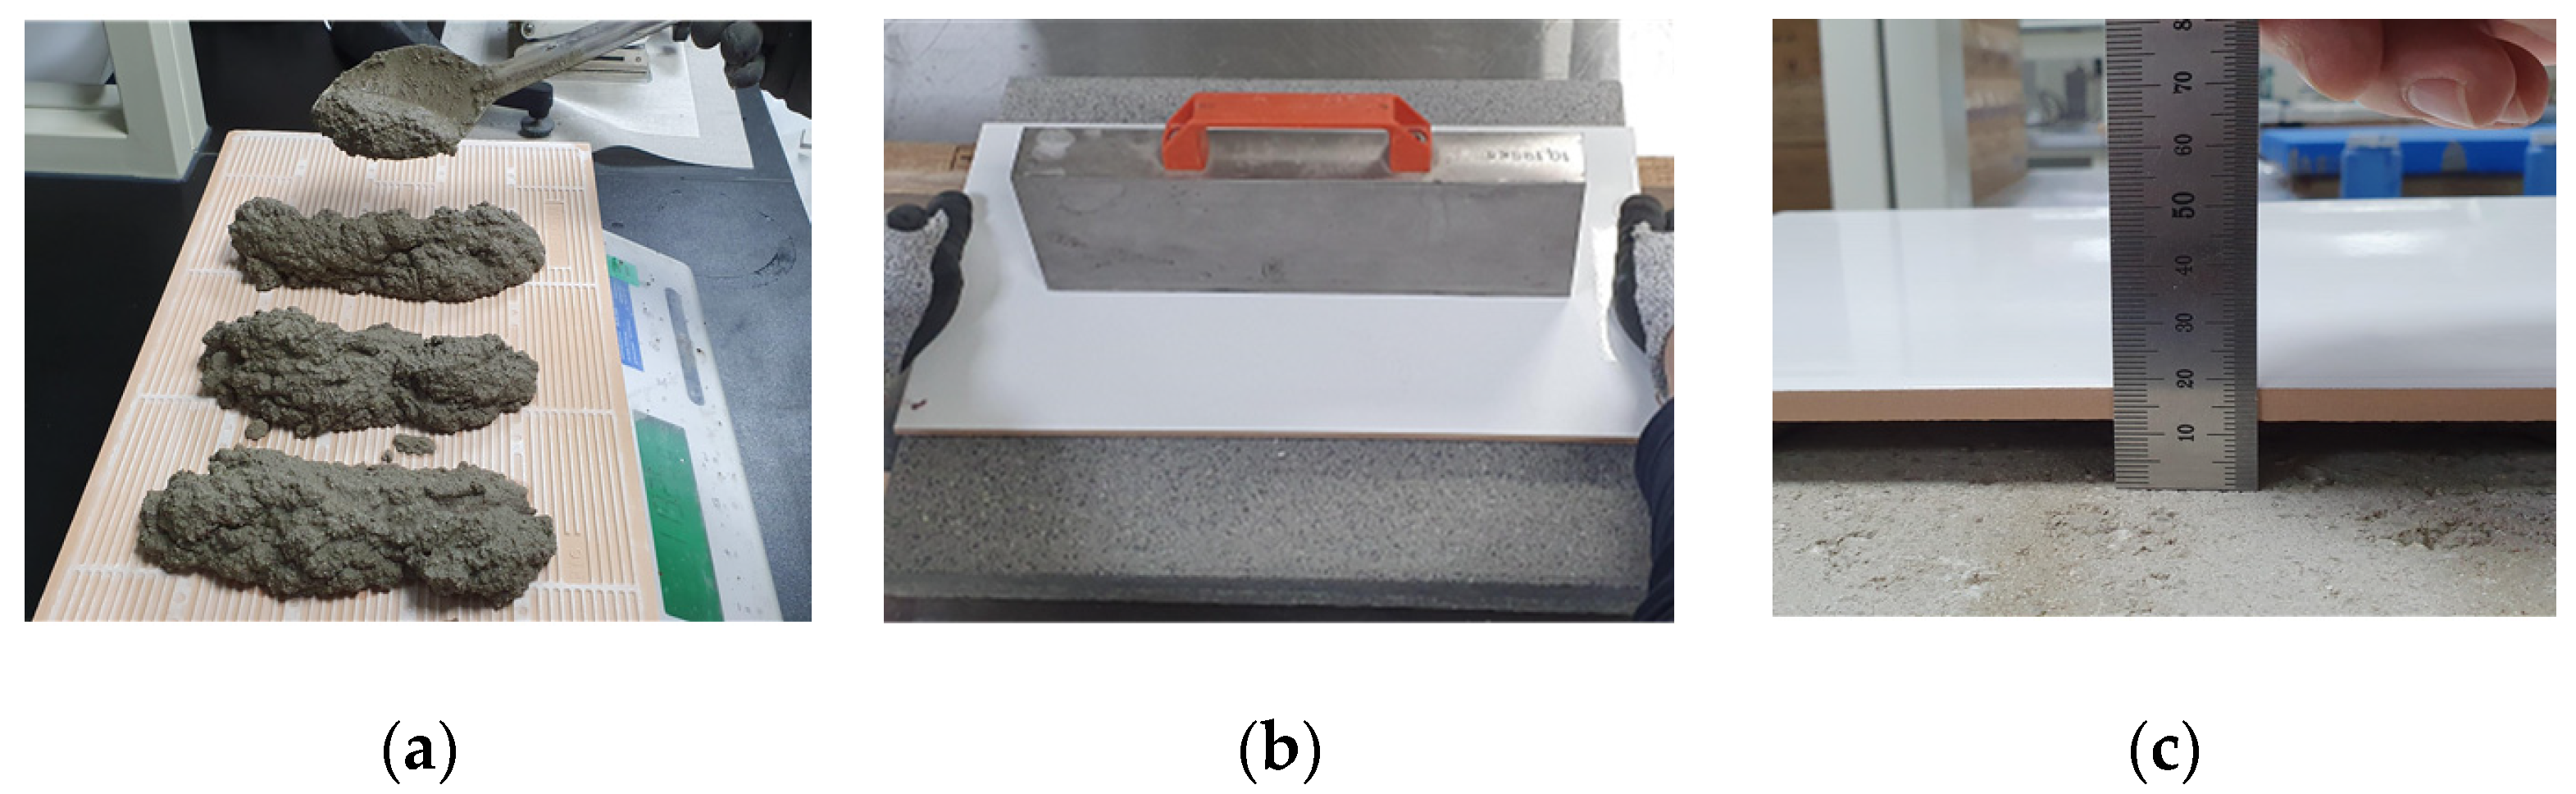
3.5. Adhesive Dispersion Based on Different AR Conditions
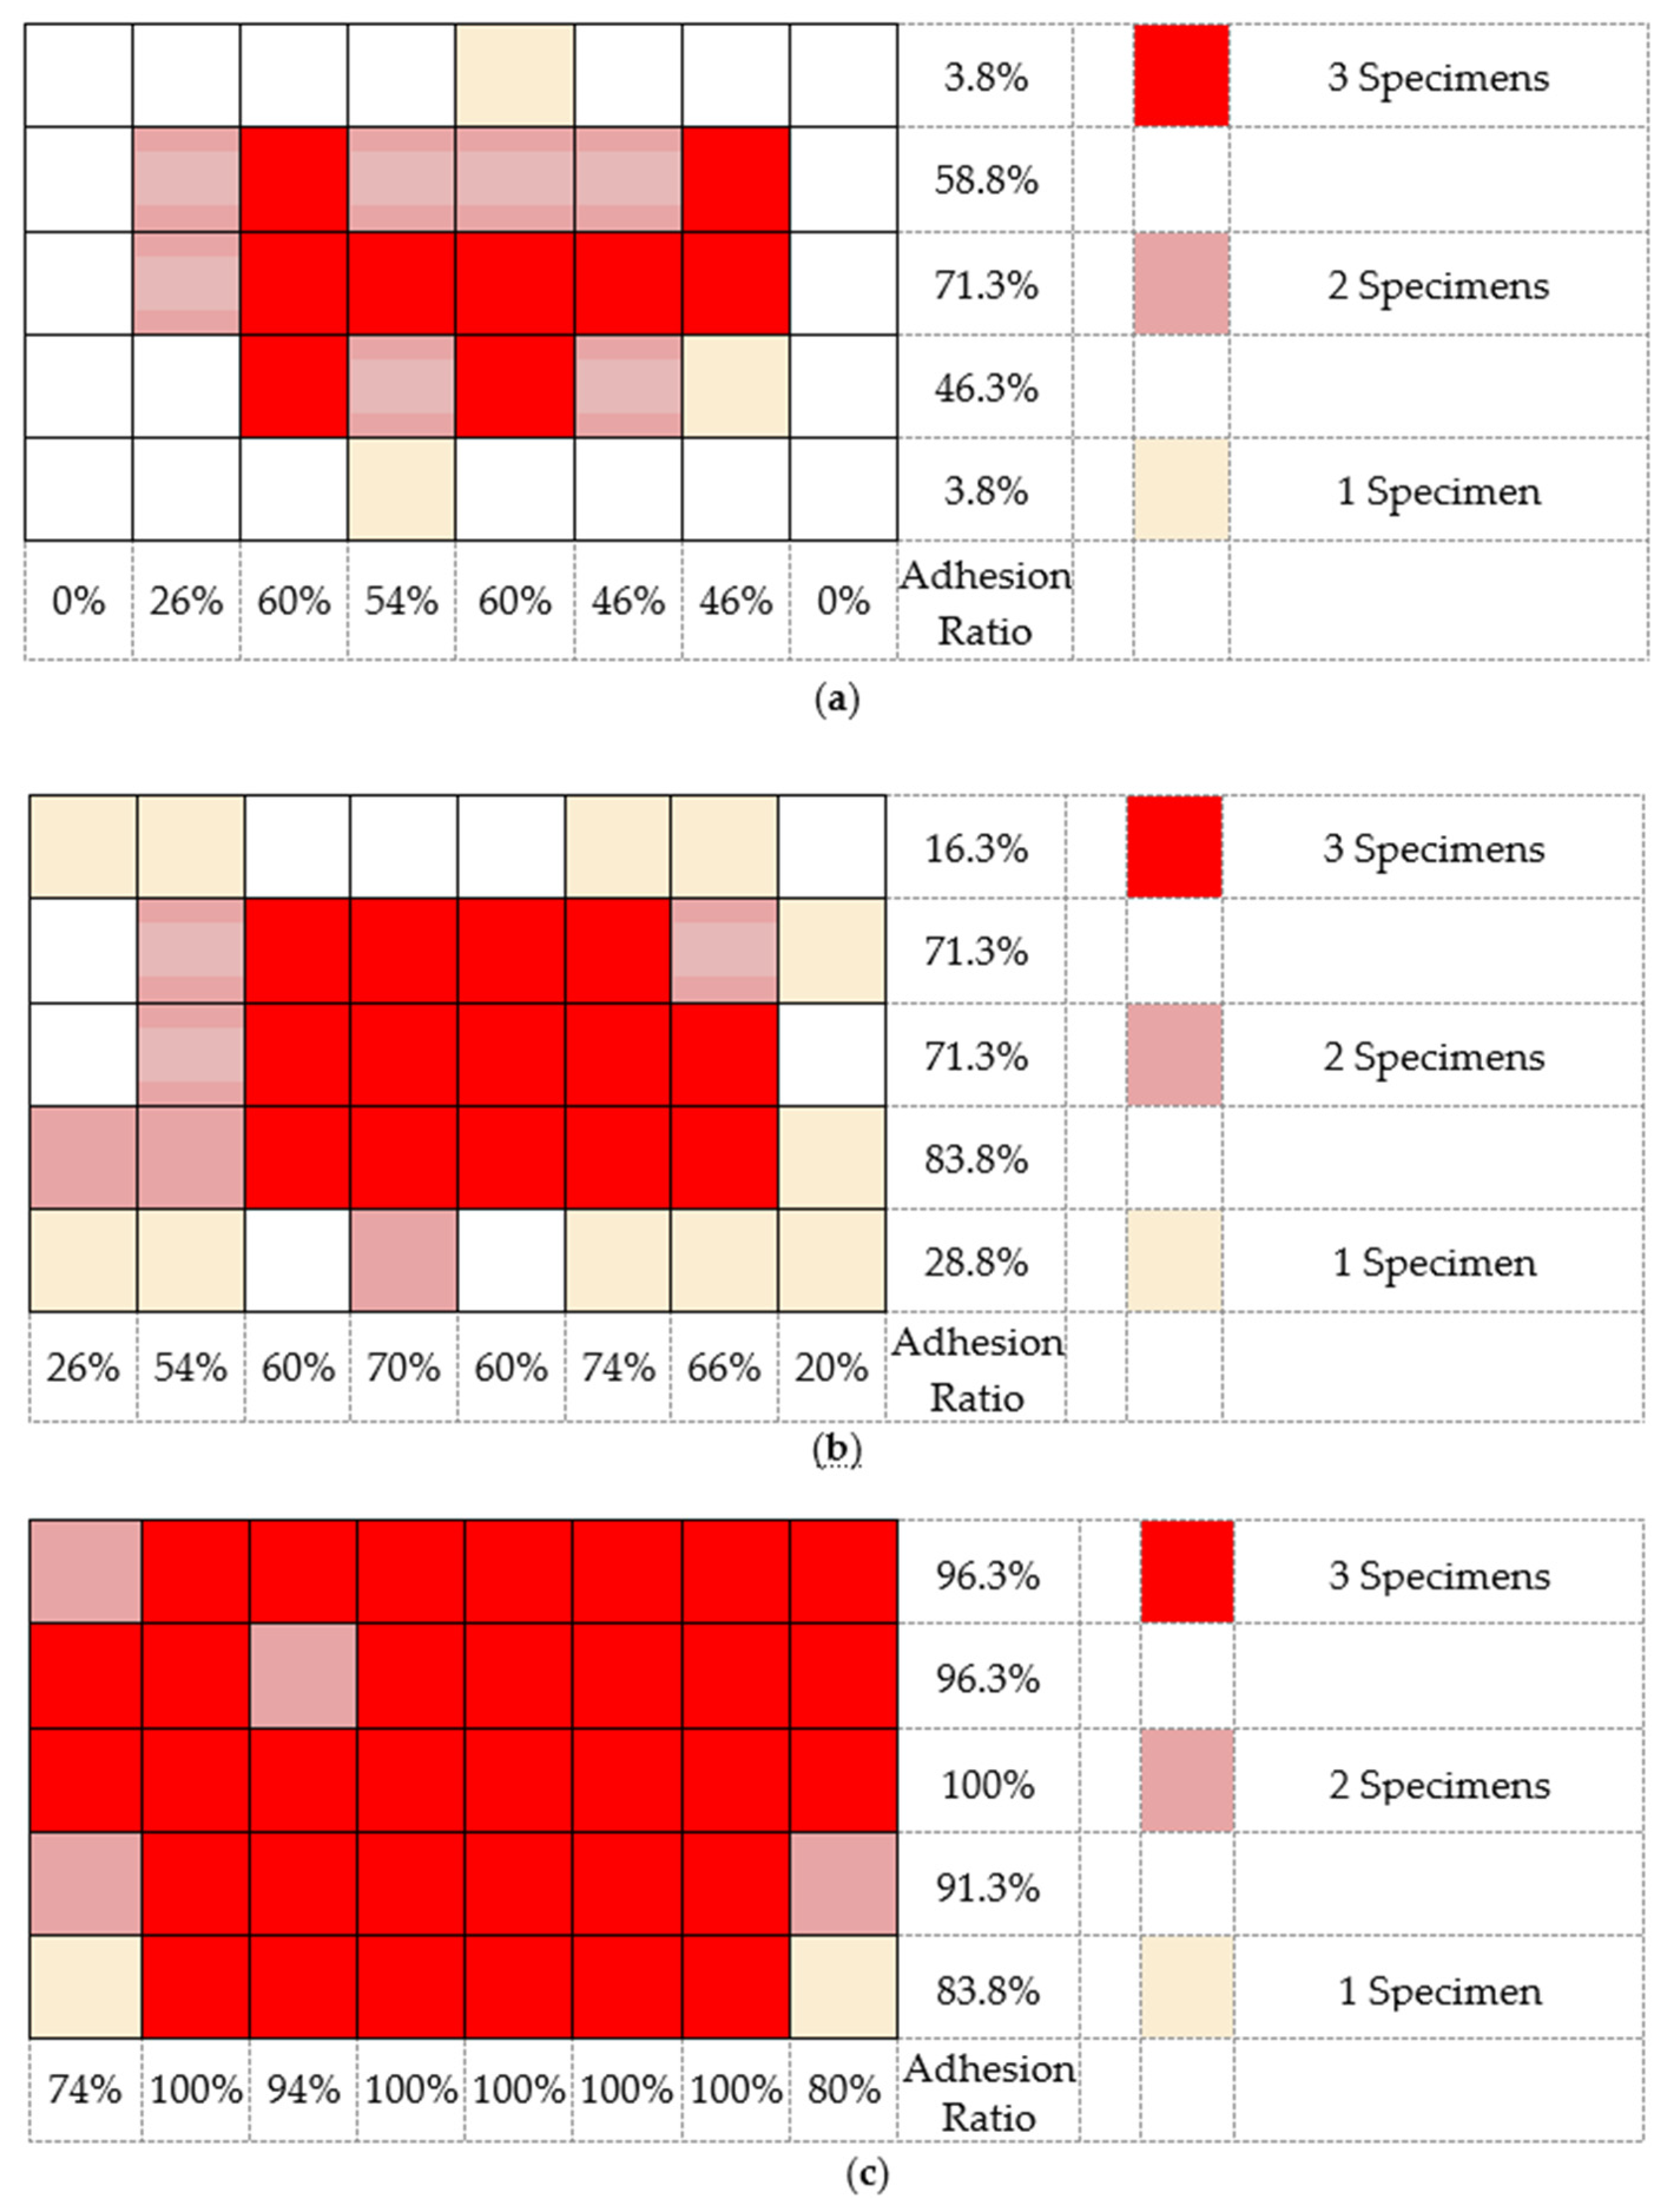
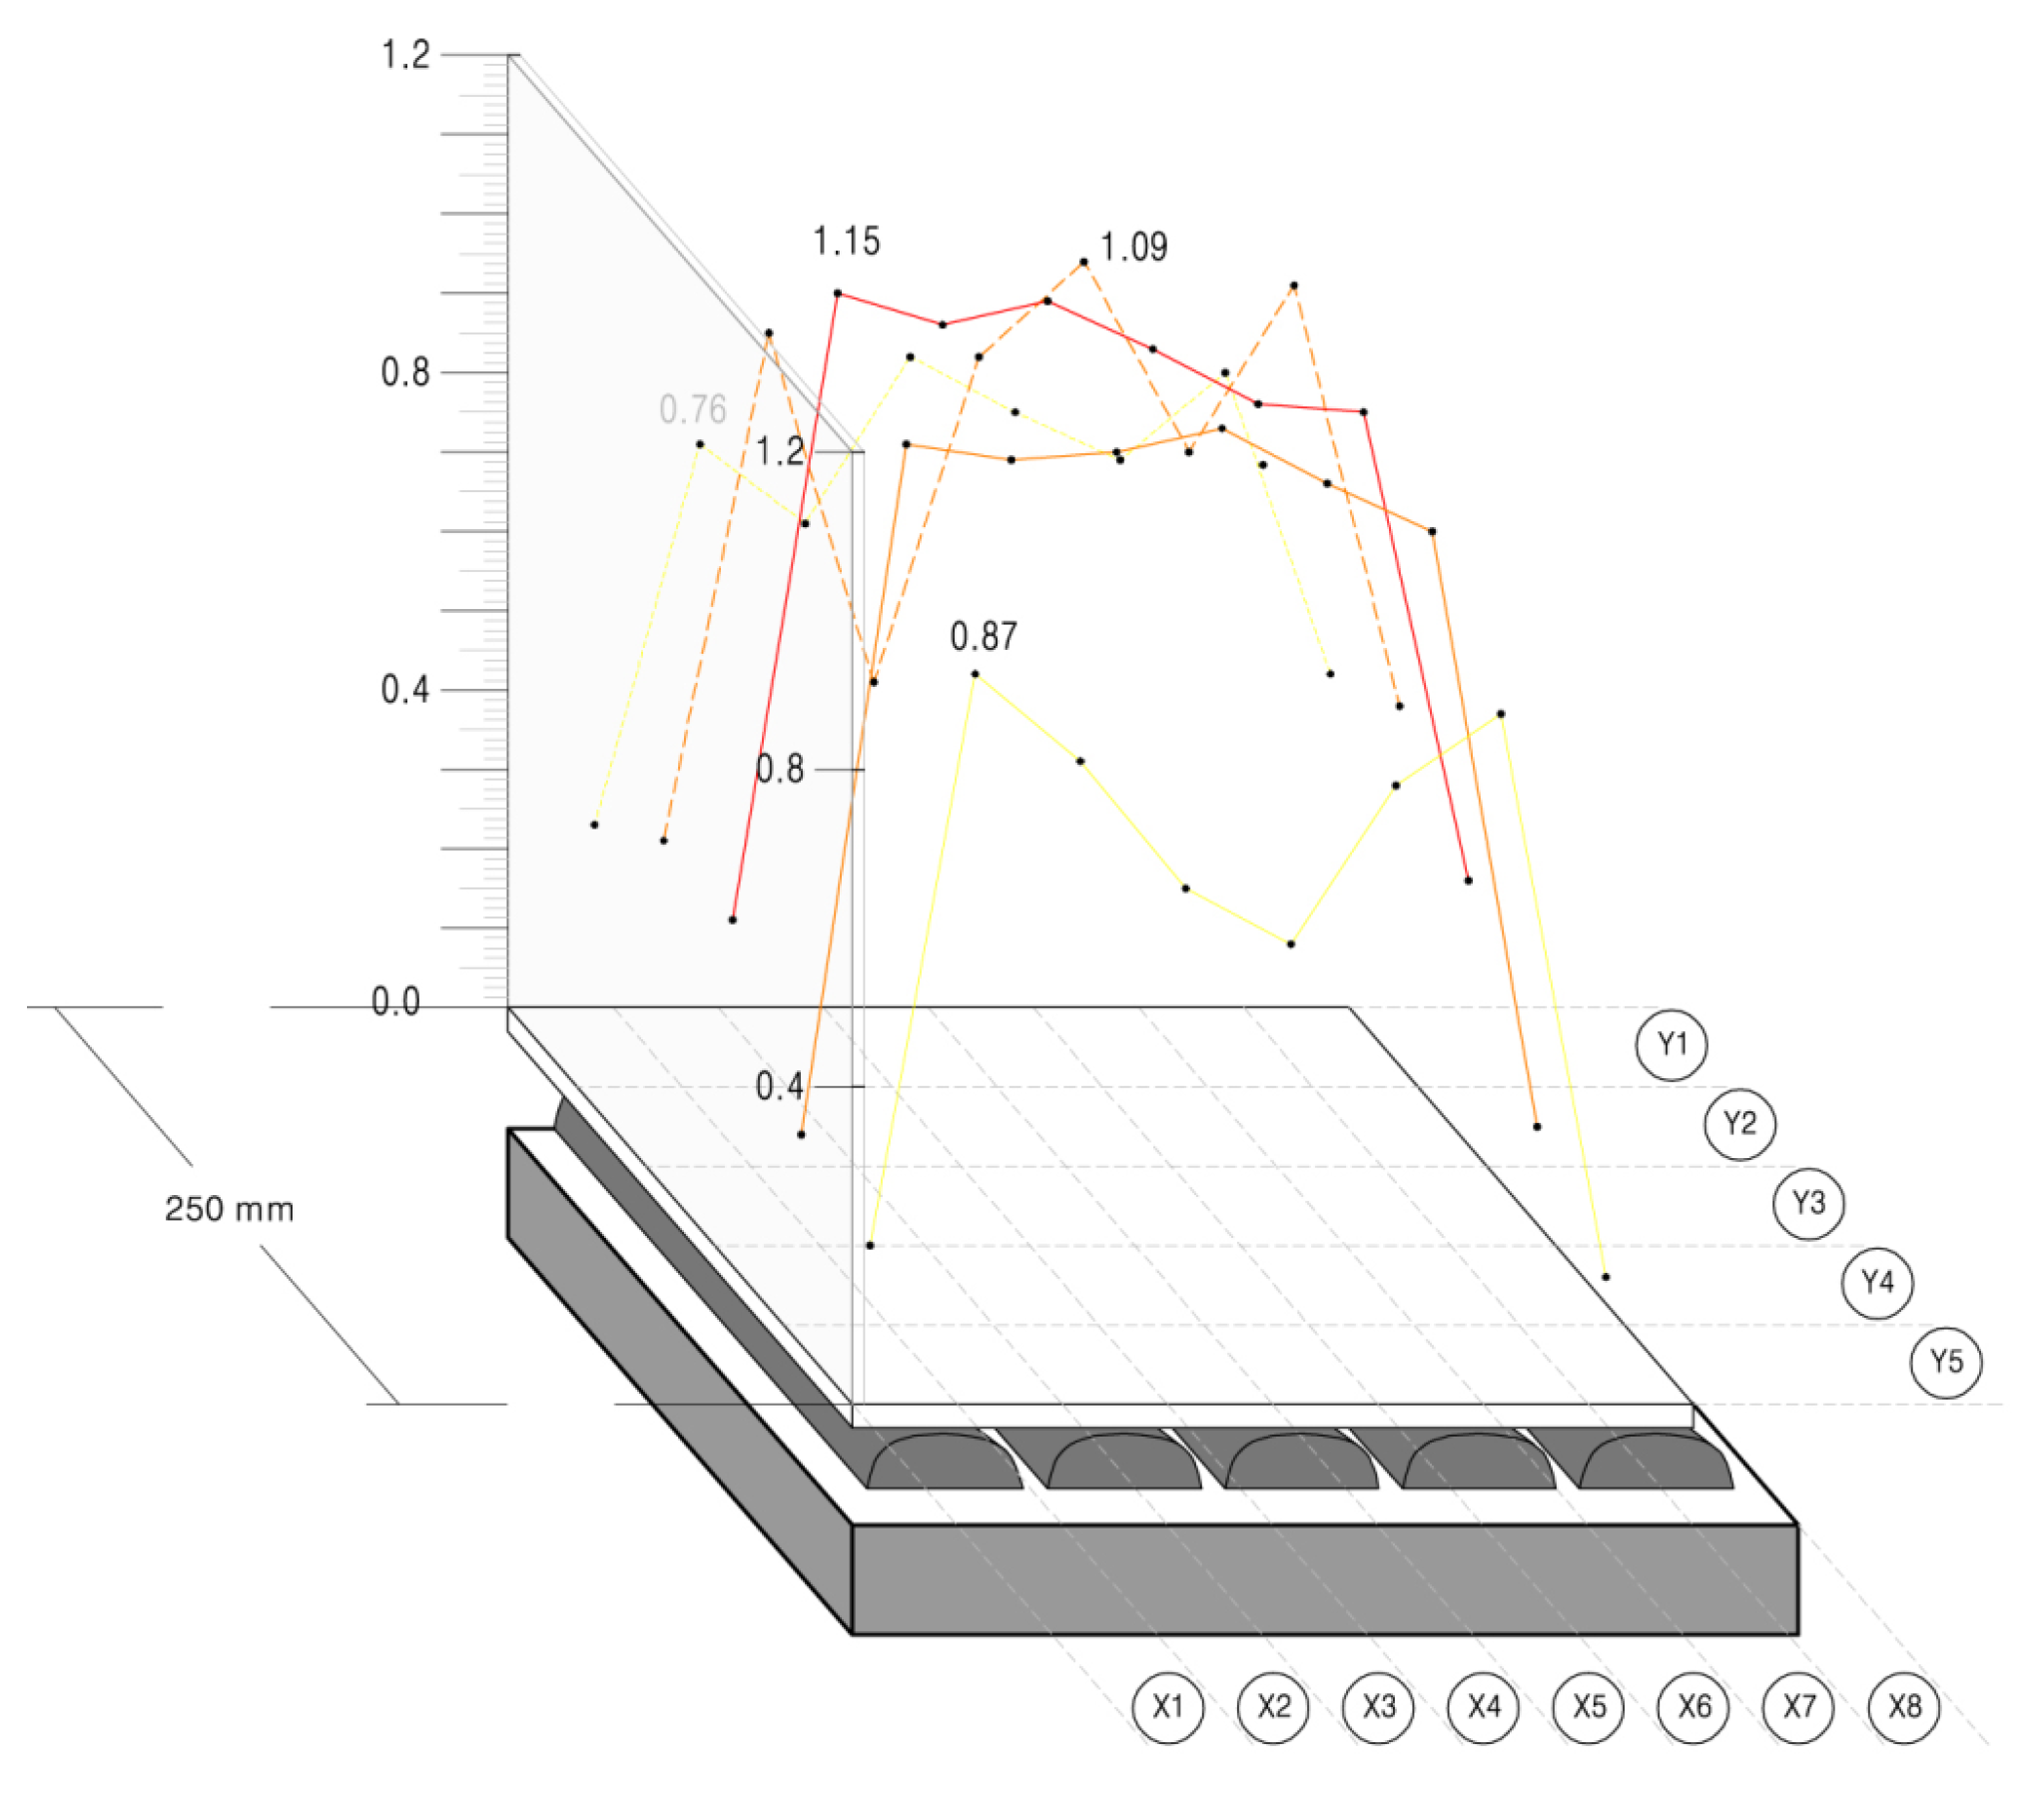
3.6. Analysis of Adhesion Strength by Adhesion Area
3.6.1. AR 60 ± 2% Specimen Results
3.6.2. AR 80 ± 2% Specimen Results
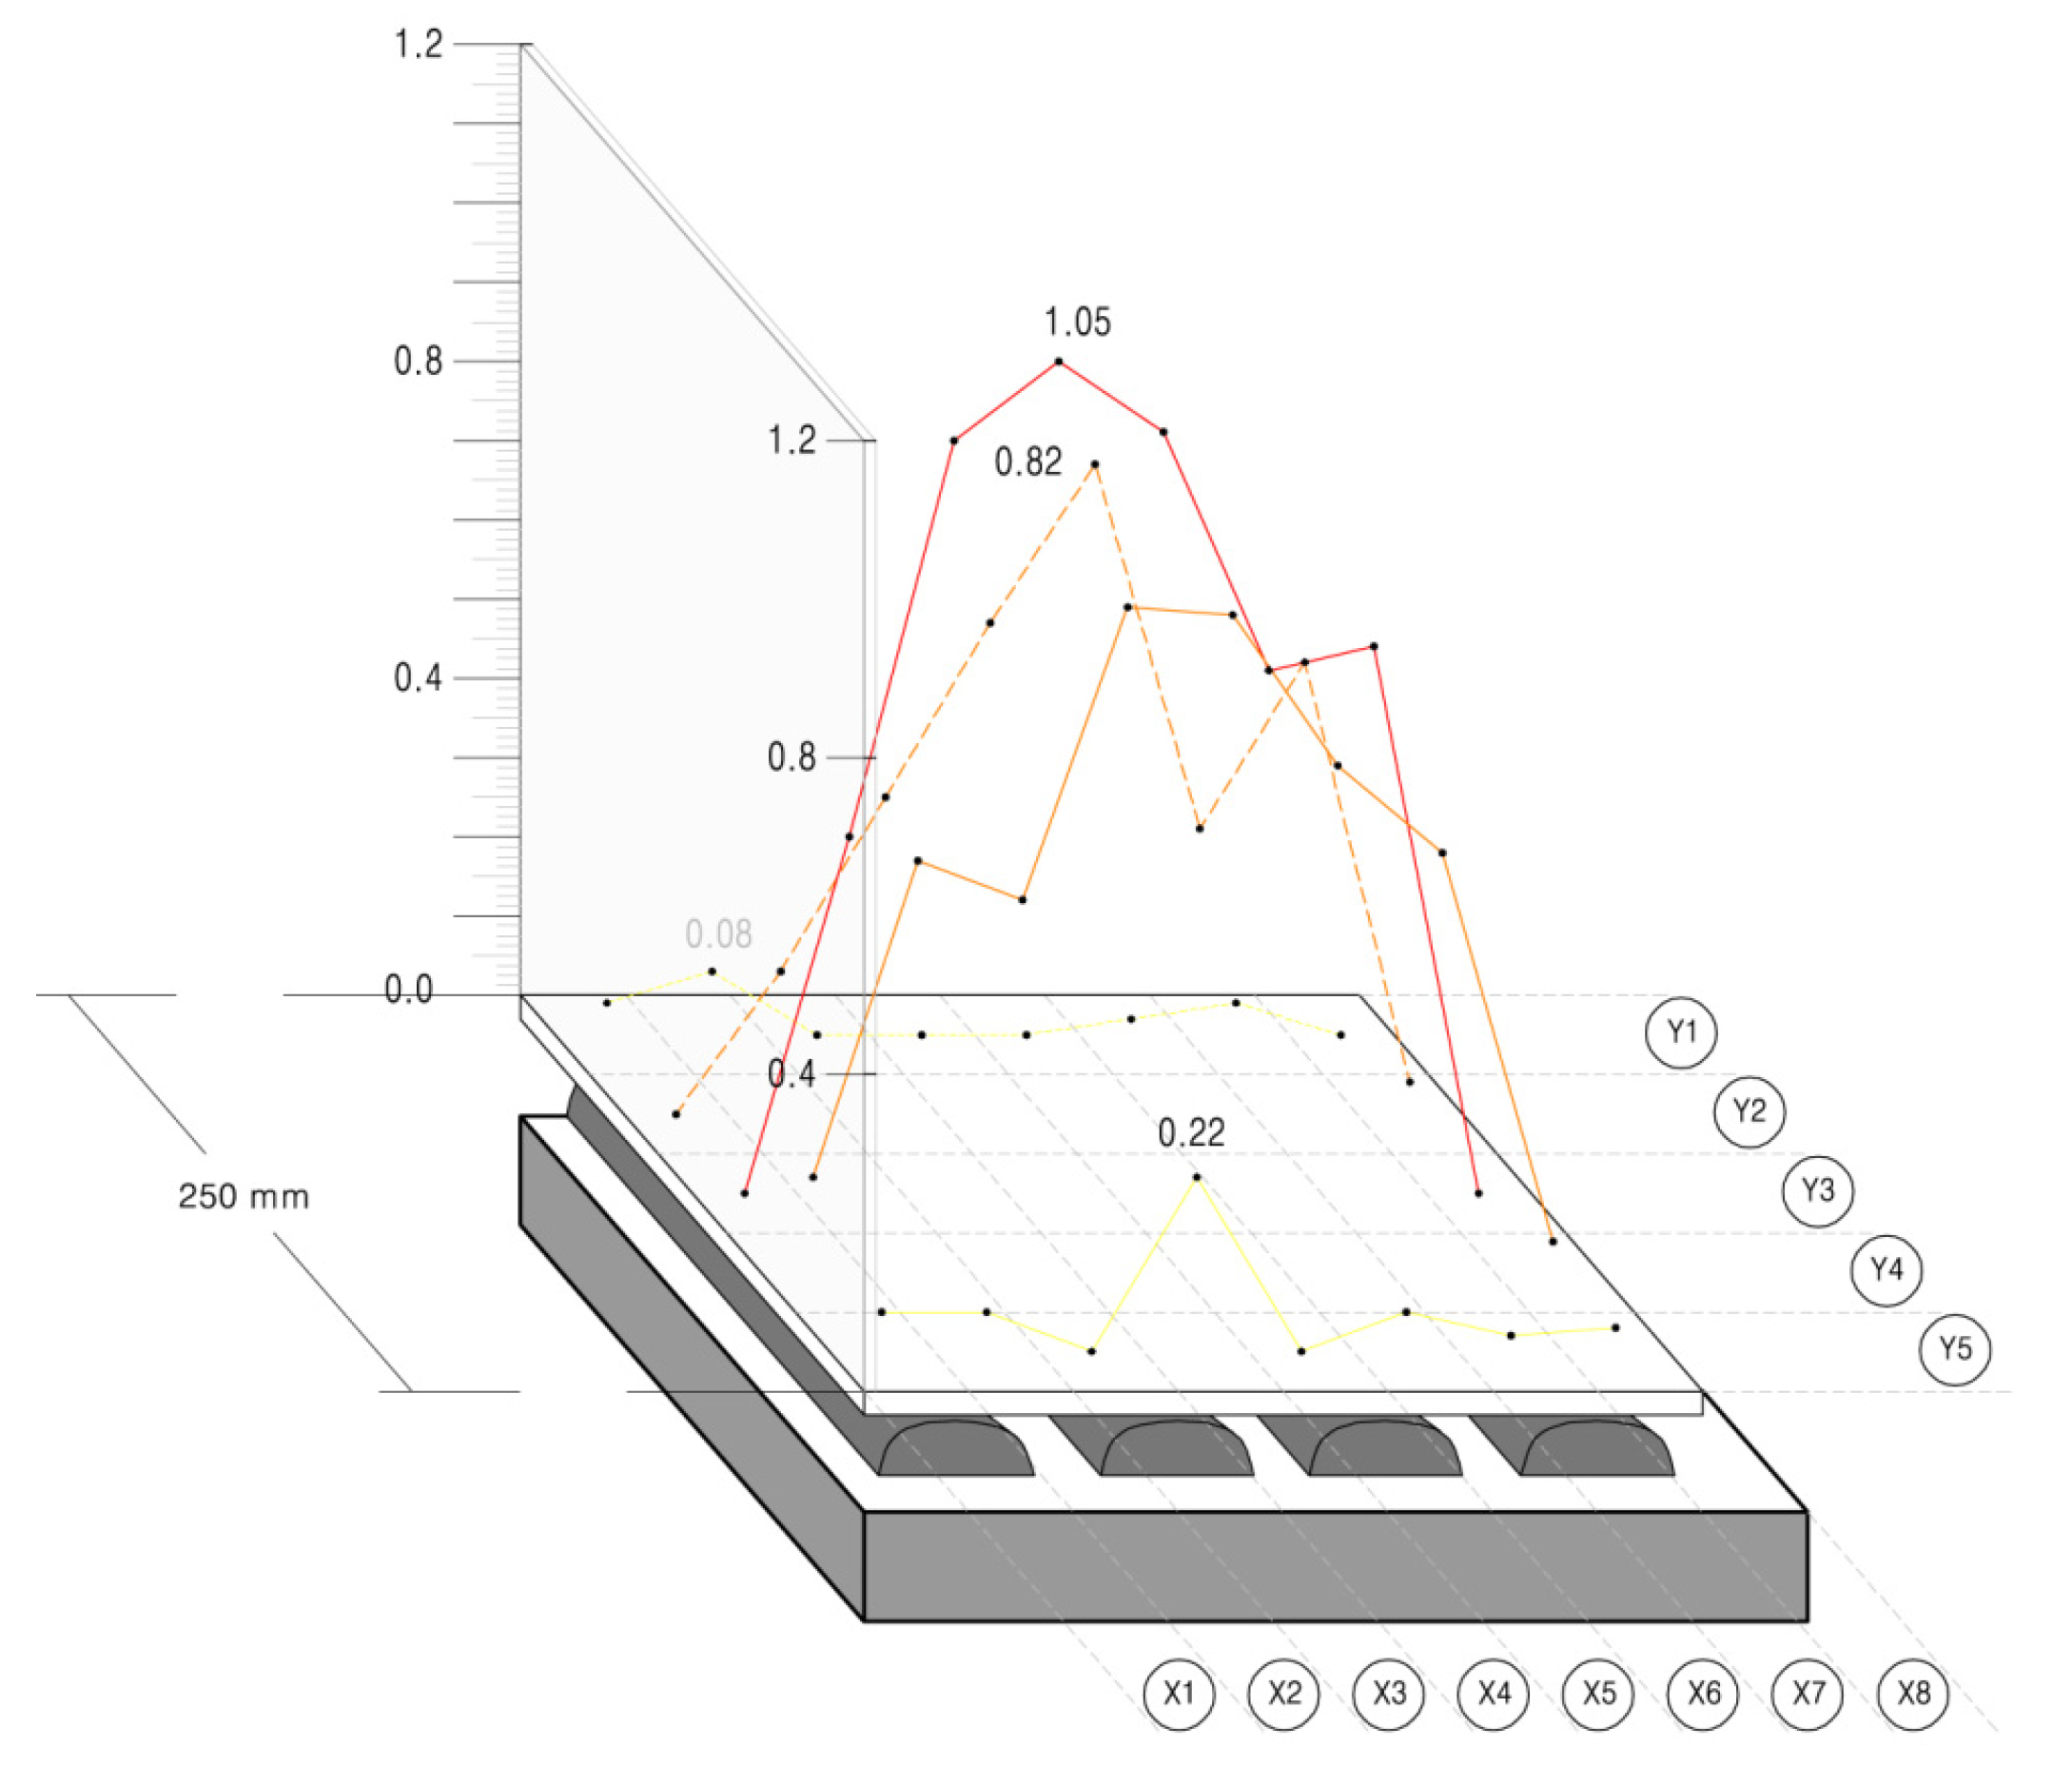
3.6.3. AR 100% Specimen Results
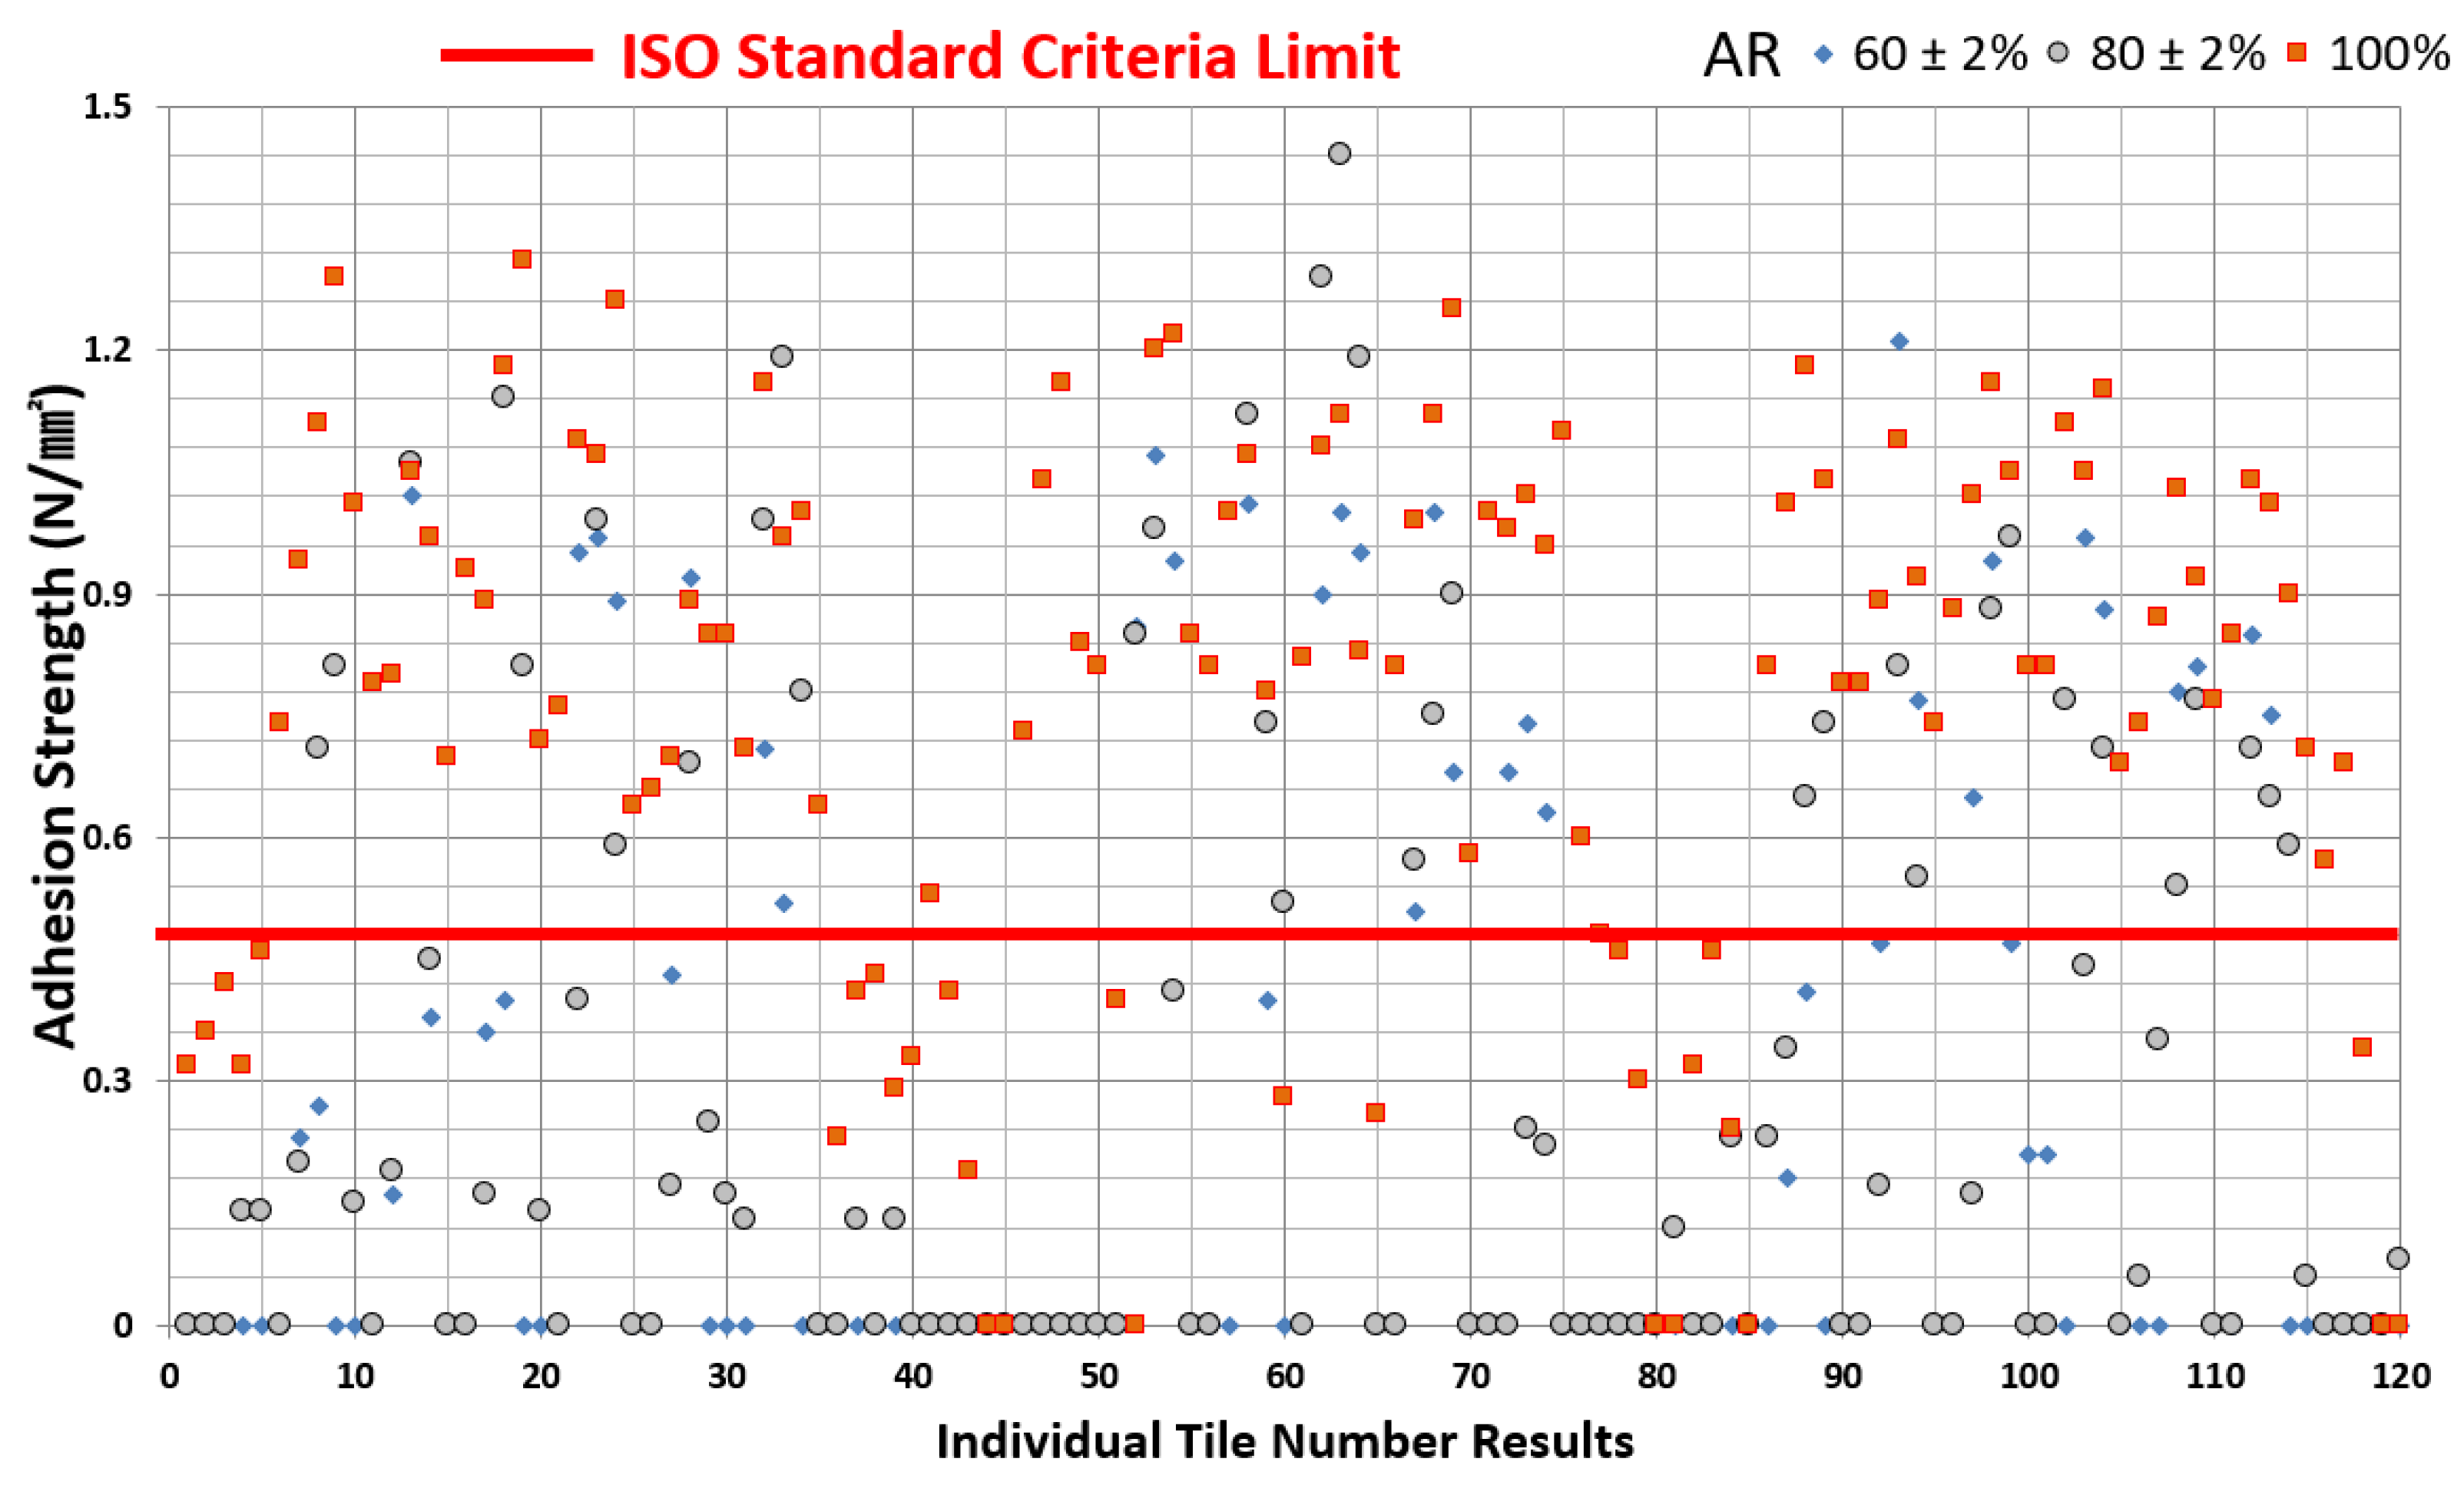
4. Experimental and Analysis Result
5. Conclusions
- (1)
- Through the ISO standard adhesion strength evaluation method it was confirmed that the spot-bonding method is also able to secure stable adhesion, but only in sections where the spot-bonding mortar was securely installed, leading to the hypothesis that, as long as a higher surface area application of the cementitious adhesive is achieved, a stable installation of the tile by spot-bonding can also be achieved.
- (2)
- By using a new evaluation method consisting of sectioning the tile into individual pieces across the entire tile surface, an adhesion strength evaluation in the spot-bonding method using large tiles was made possible by schematic mapping of the tile with high and concentrated adhesion strength. Through this schematic analysis of adhesion strength throughout the tile surface, the results confirmed that the adhesion strength of the tile cementitious adhesive surface ratio should be 100% in order to achieve adhesion strength of the tile above the standard regulation for approximately 80% of the tile area. Further investigation is required to assess different material types, different load conditions during tile pressing, and ambient conditions need to be conducted in the near future to establish a reliable data set on the tile spot-bonding installation method, but it is hoped, nonetheless, that the evaluation methodology proposed in this study is viable for continuous studies on this topic.
Author Contributions
Funding
Institutional Review Board Statement
Informed Consent Statement
Conflicts of Interest
Abbreviations
| AR | Adhesive-application area ratio |
| ISO | International Standard Organization |
| USP | Upper substrate part |
| UTM | Universal testing machine |
References
- Wetzel, A.; Zurbriggen, R.; Herwegh, M. Spatially Resolved Evolution of Adhesion Properties of Large Porcelain Tiles. Cem. Concr. Compos. 2010, 32, 327–338. [Google Scholar] [CrossRef]
- Silvestre, J.D.; de Brito, J. Ceramic Tiling Inspection system. Constr. Build. Mater. 2009, 23, 653–668. [Google Scholar] [CrossRef]
- Jung, G.T. Defect Type and Cause Analysis by Tile Defect Sampling in Residential House Bathrooms, Korea. Department of Construction Science for Housing and Urban Architecture Graduate School of Housing and City, Seoul National University of Science and Technology, Korea. 2018. Available online: http://www.riss.kr/link?id=T14767089 (accessed on 18 March 2021).
- Park, G.T. A Study on the Tile Demand Forecasting follow Changes in the Supply of Residential Building. Department of Business Administration, Graduate School of Business Administration, Chosun University, Korea. 2014. Available online: http://www.riss.kr/link?id=T13404155 (accessed on 18 March 2021).
- Kim, D.-H.; Lee, D.; Lee, H.-J.; Min, Y.-G.; Park, I.; Cho, H. Analysis of Importance by Defect Type in Apartment Construction. J. Korea Inst. Build. Constr. 2020, 20, 357–365. [Google Scholar]
- Kim, U.K. A Study on Defect Cause Analysis of Domestic Apartment Wet Construction. Department of Architectural Engineering, Graduate School of Construction Engineering and Industry, Kyonggi University, Korea. 2016. Available online: http://www.riss.kr/link?id=T14461875 (accessed on 19 March 2021).
- Jung, C.-S. An Experimental Study on the Bond Strength of Tile under Cold Weather. Architectural Engineering, Graduate School of Engineering, Konkuk University, Korea. 2011. Available online: http://www.riss.kr/link?id=T12268753 (accessed on 19 March 2021).
- Kim, J.D. A Study on the Property Analysis and Prevention for Drop-Out of Porcelain Tile. Department of Construction Management, Master of Graduate School of Engineering, Hanyang University, Korea. 2013. Available online: http://www.riss.kr/link?id=T13076261 (accessed on 22 March 2021).
- Lee, S.-Y. Evaluation of Tile Adhesive Characteristics by Injection of Bisphenol Epoxy Resin. Department of Architectural Engineering, Graduate School Chungnam National University, Korea. 2020. Available online: http://www.riss.kr/link?id=T15513096 (accessed on 22 March 2021).
- Chew, M.Y.L. The Study of Adhesion Failure of Wall Tiles. Build Environ. 1992, 27, 493–499. [Google Scholar] [CrossRef]
- Chew, M.Y.L. Factors Affecting Ceramic Tile Adhesion for External Cladding. Constr. Build. Mater. 1999, 13, 293–296. [Google Scholar] [CrossRef]
- Kim, W.S.; Park, H.G.; Park, B.G.; Jung, K.H.; Lee, Y.D.; Jung, S.J. An Experimental Study about Tile Exfoliation Properties and Member Strain Using The Tile Before-fixing Method. J. Korea Inst. Build. Constr. 2004, 4, 27–30. [Google Scholar]
- Winnefeld, F.; Kaufmann, J.; Hack, E.; Harzer, S.; Wetzel, A.; Zurbriggen, R. Moisture induced length changes of tile adhesive mortars and their impact on adhesion strength. Constr. Build. Mater. 2012, 30, 426–438. [Google Scholar] [CrossRef]
- Lopes, A.C.; Flores-Colen, I.; Silva, L. Variability of the Pull-off Technique for Adhesion Strength Evaluation on Ceramic Tile Claddings. J. Adhes. 2015, 91, 768–791. [Google Scholar] [CrossRef]
- Jenni, A.; Holzer, L.; Zurbriggen, R.; Herwegh, M. Influence of polymers on microstructure and adhesive strength of cementitious tile adhesive mortars. Cem. Concr. Res. 2005, 35, 35–50. [Google Scholar] [CrossRef]
- Mahaboonpachai, T.; Kuromiya, Y.; Matsumoto, T. Experimental investigation of adhesion failure of the interface between concrete and polymer-cement mortar in an external wall tile structure under a thermal load. Constr. Build. Mater. 2008, 22, 2001–2006. [Google Scholar] [CrossRef]
- Yoon, J.-S. A Study of Cause Anaysis of Building Defect and Precautions, Focused on Crack, Dew Condensation, Tile Drop Out. Korea Real Estate Acad. 2019, 77, 21–33. [Google Scholar] [CrossRef]
- ISO 13007-2, Ceramic Tiles-Grouts and Adhesives-Part 2: Test Methods for Adhesives; ISO: Geneva, Switzerland, 2013.
- ISO 13007-1, Ceramic Tiles-Grouts and Adhesives-Part 1: Terms, Definitions and Specifications for Adhesives; ISO: Geneva, Switzerland, 2014.
- Kim, B.S.; Seo, H.J.; Choi, E.G.; Lee, J.H.; Song, J.Y.; Oh, S.K. Tile Adhesion Strength Change Testing based on Different Concrete Additive Agent. In Proceedings of the Korean Institute of Building Construction Conference; The Korea Institute of Building Construction: Goyang, Korea, 2017; Volume 17. [Google Scholar]


| Items | Europe | U.S. | Asia (Korea and China) |
|---|---|---|---|
| Installation Method | Troweled adhesion method | Troweled adhesion method | Troweled adhesion and spot-bonding method (both) |
| Adhesive Material | Polymer | Polymer | Cement mortar, polymer (both) |
| Wall Type | Achieved smoothness from board, plastering, etc., and set tile | Achieve smoothness from 1st plastering and set tile | Apartment: board, plywood finish Wall type: after brick, masonry cement mortar tile bond setting on 1st plastered side |
| Related Standard | ISO 13007, EN 12004 | ANSI 108, EN 12004 | Requires more development to meet troweled-adhesion-method quality standard |
| Evaluation Standard | Bonding strength C1:0.5 N/mm2, C2:1.0 N/mm2 | Shearing strength 28d:1.03–2.76 MPa | Bonding strength 0.39–0.5 N/mm2 |
| Item | Spot-Bonding Method | Troweled Adhesion Method |
|---|---|---|
| Adhesive/Bonding Material | Cementitious adhesive (cement/mortar-based bonding material) | Dry mortar/adhesive application (polymer, acrylic, epoxy, etc.) |
| Installation Method | Mortar adhesive is applied to the rear side of the tile and, subsequently, installed on the wall | Adhesive is first applied to the wall, followed by the tile installation |
| Weight and Adhesive Thickness | 20–40 kg/m2 10–25 mm | 3–7 kg/m2 2–7 mm |
| Workability | 7–10 m2/day Experienced workers (technicians) required | 20–30 m2/day Generalized work level sufficient |
| Adhesion Strength | 0.4–0.6 N/mm2 | 1.5–4.0 N/mm2 |
| Concept Illustration | 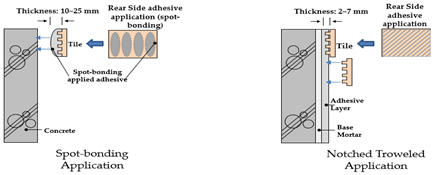 | |
| Relevant Nations | Korea, China, Southeast Asian Countries | Europe, U.S., etc. |
| Criteria | Detailed Content | Standard | |
|---|---|---|---|
| Materials | Adhesive for spot-bonding | General cementitious adhesive (ready-made) OPC 20%, sand 80%, additive 0.5% | ISO 13007-1 |
| Tile | Ceramic tile (250 × 400 mm) Absorptivity 13.2% Firing temperature: 1000–1200 °C Flexural strength 103.7 N/cm | ISO 10545-2 ISO 13007-2 | |
| Concrete substrate | Concrete 400 × 400 mm | ISO 13007-2 | |
| Evaluation | Specimen tile size | 250 × 400 mm | N/A |
| Adhesion strength | Plate (metallic disc) square (50 ± 1) mm side Test speed (250 ± 50) N/s Glue epoxide | ISO 13007-2 | |
| Spot-bonding interface surface area | 100%, 80 ± 2%, 60 ± 2% | N/A | |
| Curing condition | Cured for 28 days under standard ambient conditions (temperature 23 ± 2 °C, humidity 50 ± 5%) | ISO 13007-2 | |
| Criteria | Load (N)/(Pressure Applied Time (sec)) | ||||||
|---|---|---|---|---|---|---|---|
| Male A | Male B | Male C | Male D | Average | |||
| Age | 20 s | 40 s | 30 s | 20 s | |||
| Height | 170 cm | 174 cm | 183 cm | 175 cm | |||
| Weight | 85 kg | 70 kg | 70 kg | 78 kg | |||
| Upper | 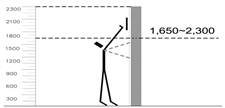 | 56/(6 sec) | 67/(5 sec) | 61/(6 sec) | 74/(6 sec) | 64.5/(5.5 sec) | |
| Middle | 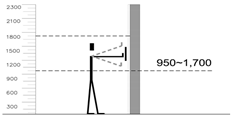 | 115/(8 sec) | 107/(8 sec) | 118/(9 sec) | 127/(9 sec) | 116.8/(8.5 sec) | |
| Bottom |  | 75/(7 sec) | 84/(6 sec) | 91/(7 sec) | 83/(7 sec) | 83.3/(6.8 sec) | |
| Specimen Number | Adhesion Strength (N/mm2) | |||||
|---|---|---|---|---|---|---|
| No. 1 | No. 2 | No. 3 | No. 4 | No. 5 | Avg. | |
| 1 | 0.76 | 1.06 | 0.21 | 0.61 | 0.31 | 0.59 |
| 2 | 1.43 | 1.44 | 1.32 | 1.48 | 1.19 | 1.372 |
| 3 | 0.93 | 1.51 | 1.27 | 1.31 | 1.25 | 1.254 |
| 4 | 0.14 | 0.14 | 0.24 | 0.50 | 0.39 | 0.282 |
| Average | 0.82 | 1.04 | 0.76 | 0.98 | 0.79 | 0.878 |
| Tile Piece Adhesion Conditions | Adhesion Surface Ratio (AR) (%) | ||
|---|---|---|---|
| 60 ± 2 | 80 ± 2 | 100 | |
| Number of adhered tiles pieces (measurement is possible) | 19 (47.5%) | 31 (77.5%) | 40 (100%) |
| All 3 specimens with the same tile pieces | 9 (22.5%) | 14 (35%) | 34 (85%) |
| 2 specimens with the same tile pieces | 7 (17.5%) | 6 (15%) | 4 (10%) |
| Individual specimen tile pieces | 3 (7.5%) | 11 (27.5%) | 2 (5%) |
| Above standard (0.5) | 11 (27.5%) Adhesion ratio 57.9% | 13 (32.5%) Adhesion ratio 41.9% | 31 (77.5%) Adhesion ratio 77.5% |
| Specimen Number | Coordinates | x1 | x2 | x3 | x4 | x5 | x6 | x7 | x8 | Avg. | Results |
|---|---|---|---|---|---|---|---|---|---|---|---|
| 1st Specimen | y1 | 0.00 | 0.00 | 0.00 | 0.00 | 0.00 | 0.00 | 0.00 | 0.00 | 0.00 | Total Avg. 0.21 N/mm2 Pieces measured 14 |
| y2 | 0.00 | 0.23 | 0.16 | 0.36 | 0.95 | 0.43 | 0.71 | 0.00 | 0.36 | ||
| y3 | 0.00 | 0.27 | 1.02 | 0.40 | 0.97 | 0.92 | 0.52 | 0.00 | 0.51 | ||
| y4 | 0.00 | 0.00 | 0.38 | 0.00 | 0.89 | 0.00 | 0.00 | 0.00 | 0.16 | ||
| y5 | 0.00 | 0.00 | 0.00 | 0.00 | 0.00 | 0.00 | 0.00 | 0.00 | 0.00 | ||
| Avg. | 0.00 | 0.10 | 0.31 | 0.15 | 0.56 | 0.27 | 0.25 | 0.00 | 0.21 | ||
| 2nd Specimen | y1 | 0.00 | 0.00 | 0.00 | 0.00 | 0.00 | 0.00 | 0.00 | 0.00 | 0.00 | Total Avg. 0.28 N/mm2 Pieces measured 14 |
| y2 | 0.00 | 0.00 | 0.86 | 0.00 | 0.90 | 0.51 | 0.68 | 0.00 | 0.37 | ||
| y3 | 0.00 | 0.00 | 1.07 | 1.01 | 1.00 | 1.00 | 0.74 | 0.00 | 0.60 | ||
| y4 | 0.00 | 0.00 | 0.94 | 0.40 | 0.95 | 0.68 | 0.63 | 0.00 | 0.45 | ||
| y5 | 0.00 | 0.00 | 0.00 | 0.00 | 0.00 | 0.00 | 0.00 | 0.00 | 0.00 | ||
| Avg. | 0.00 | 0.00 | 0.57 | 0.28 | 0.57 | 0.44 | 0.41 | 0.00 | 0.28 | ||
| 3rd Specimen | y1 | 0.00 | 0.00 | 0.00 | 0.00 | 0.21 | 0.00 | 0.00 | 0.00 | 0.03 | Total Avg. 0.26 N/mm2 Pieces measured 16 |
| y2 | 0.00 | 0.18 | 0.47 | 0.65 | 0.00 | 0.00 | 0.85 | 0.00 | 0.27 | ||
| y3 | 0.00 | 0.41 | 1.21 | 0.94 | 0.97 | 0.78 | 0.75 | 0.00 | 0.63 | ||
| y4 | 0.00 | 0.00 | 0.77 | 0.47 | 0.88 | 0.81 | 0.00 | 0.00 | 0.37 | ||
| y5 | 0.00 | 0.00 | 0.00 | 0.21 | 0.00 | 0.00 | 0.00 | 0.00 | 0.03 | ||
| Avg. | 0.00 | 0.12 | 0.49 | 0.45 | 0.41 | 0.32 | 0.32 | 0.00 | 0.26 |
| Specimen Number | Coordinates | x1 | x2 | x3 | x4 | x5 | x6 | x7 | x8 | Avg. | Results |
|---|---|---|---|---|---|---|---|---|---|---|---|
| 1st Specimen | y1 | 0.00 | 0.00 | 0.00 | 0.00 | 0.00 | 0.00 | 0.13 | 0.00 | 0.02 | Total Avg. 0.32 N/mm2 26 Pieces measured |
| y2 | 0.00 | 0.20 | 0.19 | 0.16 | 0.40 | 0.17 | 0.99 | 0.13 | 0.28 | ||
| y3 | 0.00 | 0.71 | 1.06 | 1.14 | 0.99 | 0.69 | 1.19 | 0.00 | 0.72 | ||
| y4 | 0.14 | 0.81 | 0.45 | 0.81 | 0.59 | 0.25 | 0.78 | 0.13 | 0.50 | ||
| y5 | 0.14 | 0.15 | 0.00 | 0.14 | 0.00 | 0.16 | 0.00 | 0.00 | 0.07 | ||
| Avg. | 0.06 | 0.37 | 0.34 | 0.45 | 0.40 | 0.25 | 0.62 | 0.05 | 0.32 | ||
| 2nd Specimen | y1 | 0.00 | 0.00 | 0.00 | 0.00 | 0.00 | 0.00 | 0.00 | 0.00 | 0.00 | Total Avg. 0.32 N/mm2 15 Pieces Measured |
| y2 | 0.00 | 0.00 | 0.85 | 1.53 | 1.29 | 0.57 | 0.00 | 0.00 | 0.53 | ||
| y3 | 0.00 | 0.00 | 0.98 | 1.12 | 1.44 | 0.75 | 0.24 | 0.00 | 0.57 | ||
| y4 | 0.00 | 0.00 | 0.41 | 0.74 | 1.19 | 0.90 | 0.22 | 0.00 | 0.43 | ||
| y5 | 0.00 | 0.00 | 0.00 | 0.52 | 0.00 | 0.00 | 0.00 | 0.00 | 0.07 | ||
| Avg. | 0.00 | 0.00 | 0.45 | 0.78 | 0.78 | 0.44 | 0.09 | 0.00 | 0.32 | ||
| 3rd Specimen | y1 | 0.12 | 0.23 | 0.00 | 0.00 | 0.00 | 0.06 | 0.00 | 0.00 | 0.05 | Total Avg. 0.29 N/mm2 24 Pieces Measured |
| y2 | 0.00 | 0.34 | 0.17 | 0.16 | 0.77 | 0.35 | 0.71 | 0.00 | 0.31 | ||
| y3 | 0.00 | 0.65 | 0.81 | 0.88 | 0.44 | 0.54 | 0.65 | 0.00 | 0.50 | ||
| y4 | 0.23 | 0.74 | 0.55 | 0.97 | 0.71 | 0.77 | 0.59 | 0.00 | 0.57 | ||
| y5 | 0.00 | 0.00 | 0.00 | 0.00 | 0.00 | 0.00 | 0.06 | 0.08 | 0.02 | ||
| Avg. | 0.07 | 0.39 | 0.31 | 0.40 | 0.38 | 0.34 | 0.40 | 0.02 | 0.29 |
| Specimen Number | Coordinates | x1 | x2 | x3 | x4 | x5 | x6 | x7 | x8 | Avg. | Result |
|---|---|---|---|---|---|---|---|---|---|---|---|
| 1st Specimen | y1 | 0.32 | 0.74 | 0.79 | 0.93 | 0.76 | 0.66 | 0.71 | 0.23 | 0.64 | Total Avg. 0.78 N/mm2 40 Pieces Measured |
| y2 | 0.36 | 0.94 | 0.80 | 0.89 | 1.09 | 0.70 | 1.16 | 0.41 | 0.79 | ||
| y3 | 0.42 | 1.11 | 1.05 | 1.18 | 1.07 | 0.89 | 0.97 | 0.43 | 0.89 | ||
| y4 | 0.32 | 1.29 | 0.97 | 1.31 | 1.26 | 0.85 | 1.00 | 0.29 | 0.91 | ||
| y5 | 0.46 | 1.01 | 0.70 | 0.72 | 0.64 | 0.85 | 0.64 | 0.33 | 0.67 | ||
| Avg. | 0.38 | 1.02 | 0.86 | 1.01 | 0.96 | 0.79 | 0.90 | 0.34 | 0.78 | ||
| 2nd Specimen | y1 | 0.53 | 0.73 | 0.40 | 0.81 | 0.82 | 0.81 | 1.00 | 0.60 | 0.71 | Total Avg. 0.73 N/mm2 36 Pieces Measured |
| y2 | 0.41 | 1.04 | 0.00 | 1.00 | 1.08 | 0.99 | 0.98 | 0.48 | 0.75 | ||
| y3 | 0.19 | 1.16 | 1.20 | 1.07 | 1.12 | 1.12 | 1.02 | 0.46 | 0.92 | ||
| y4 | 0.00 | 0.84 | 1.22 | 0.78 | 0.83 | 1.25 | 0.96 | 0.30 | 0.77 | ||
| y5 | 0.00 | 0.81 | 0.85 | 0.28 | 0.26 | 0.58 | 1.10 | 0.00 | 0.49 | ||
| Avg. | 0.23 | 0.92 | 0.73 | 0.79 | 0.82 | 0.95 | 1.01 | 0.37 | 0.73 | ||
| 3rd Specimen | y1 | 0.00 | 0.81 | 0.79 | 0.88 | 0.81 | 0.74 | 0.85 | 0.57 | 0.68 | Total Avg. 0.76 N/mm2 36 Pieces Measured |
| y2 | 0.32 | 1.01 | 0.89 | 1.02 | 1.11 | 0.87 | 1.04 | 0.69 | 0.87 | ||
| y3 | 0.46 | 1.18 | 1.09 | 1.16 | 1.05 | 1.03 | 1.01 | 0.34 | 0.92 | ||
| y4 | 0.24 | 1.04 | 0.92 | 1.05 | 1.15 | 0.92 | 0.9 | 0.00 | 0.78 | ||
| y5 | 0.00 | 0.79 | 0.74 | 0.81 | 0.69 | 0.77 | 0.71 | 0.00 | 0.56 | ||
| Avg. | 0.20 | 0.97 | 0.89 | 0.98 | 0.96 | 0.87 | 0.90 | 0.32 | 0.76 |
| AR Conditions | AR 60 ± 2% | AR 80 ± 2% | AR 100% | ||||||
|---|---|---|---|---|---|---|---|---|---|
| Items | No. 1 | No. 2 | No. 3 | No. 1 | No. 2 | No. 3 | No. 1 | No. 2 | No. 3 |
| Overall average adhesion strength (N/mm2) | 0.21 | 0.28 | 0.26 | 0.32 | 0.32 | 0.29 | 0.78 | 0.73 | 0.76 |
| Stable adhesion pieces (Numbers (%)) | 14 (35%) | 14 (35%) | 16 (40%) | 26 (65%) | 15 (37.5%) | 24 (60%) | 40 (100%) | 36 (90%) | 36 (90%) |
| Avg. adhesion strength of the stable adhesion pieces | 0.59 | 0.81 | 0.66 | 0.49 | 0.88 | 0.48 | 0.78 | 0.85 | 0.85 |
| Pieces that meet the ISO standard (0.5) or above | 7 (17.5%) | 13 (32.5%) | 10 (25%) | 11 (27%) | 12 (30%) | 13 (32.5%) | 30 (75%) | 28 (70%) | 32 (80%) |
| Entire tile/stable adhesion pieces ratio (%) | 50% | 92.9% | 62.5% | 42.3% | 80% | 54.2% | 75% | 77.8% | 88.9% |
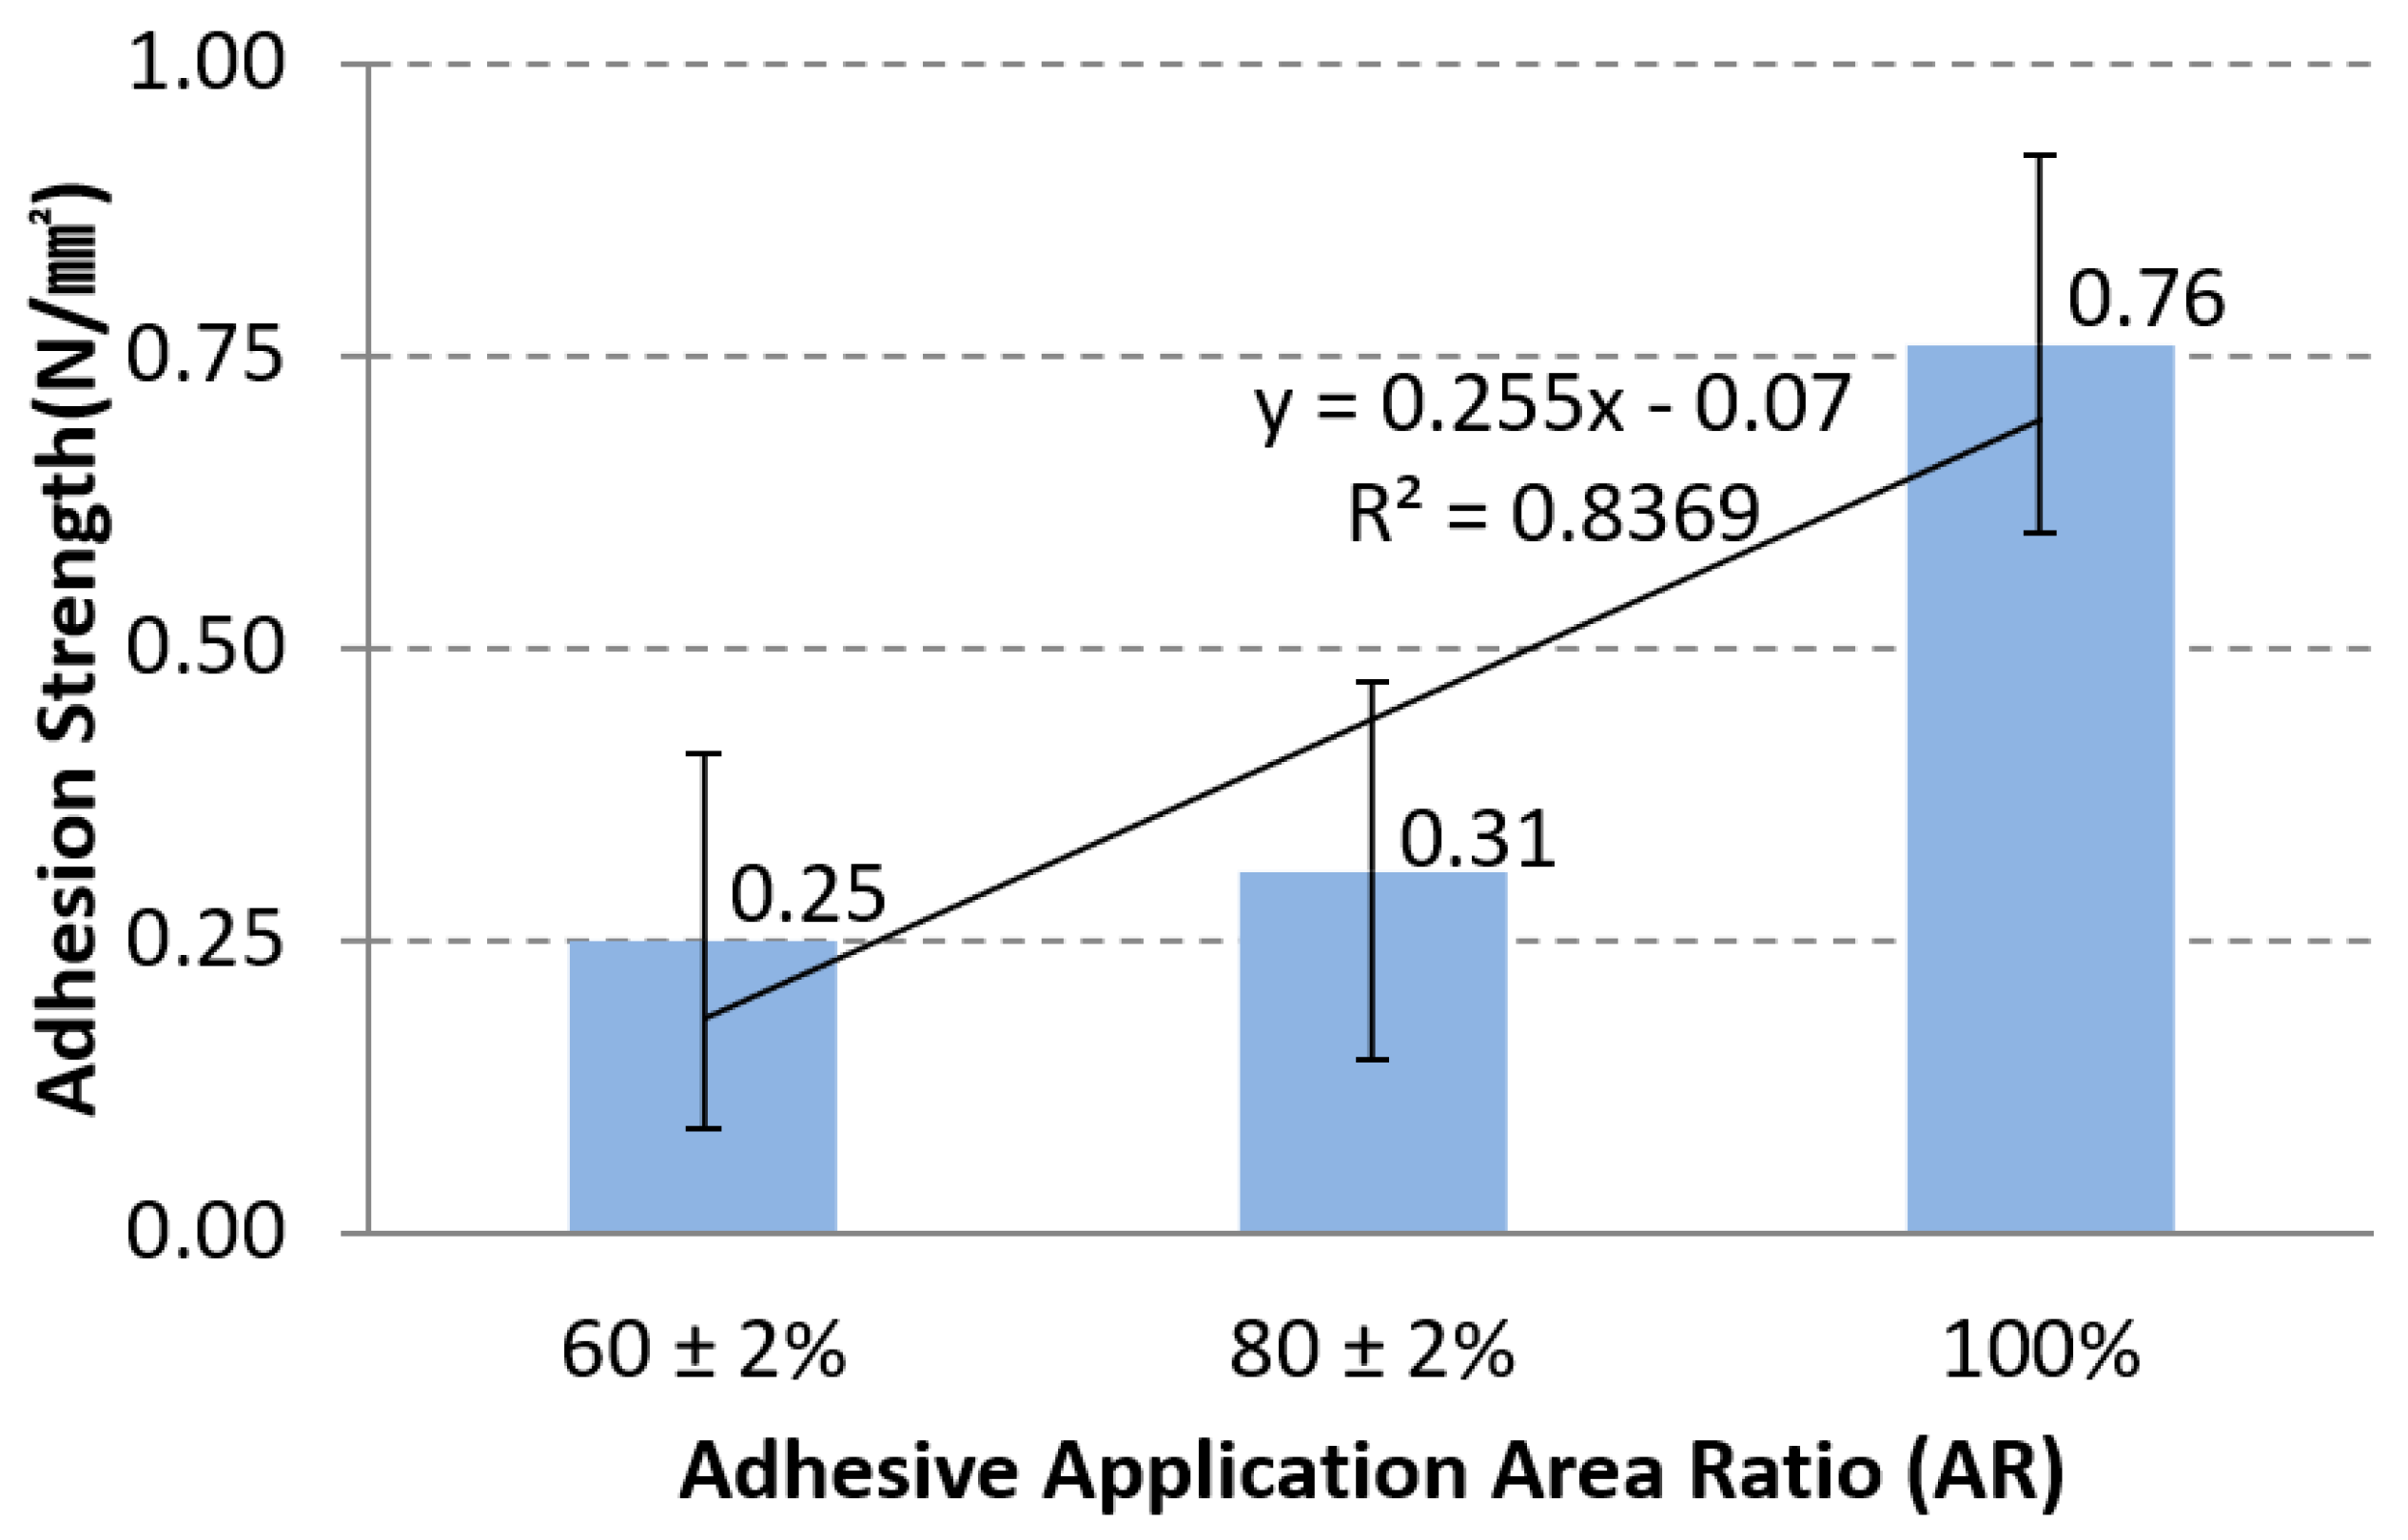
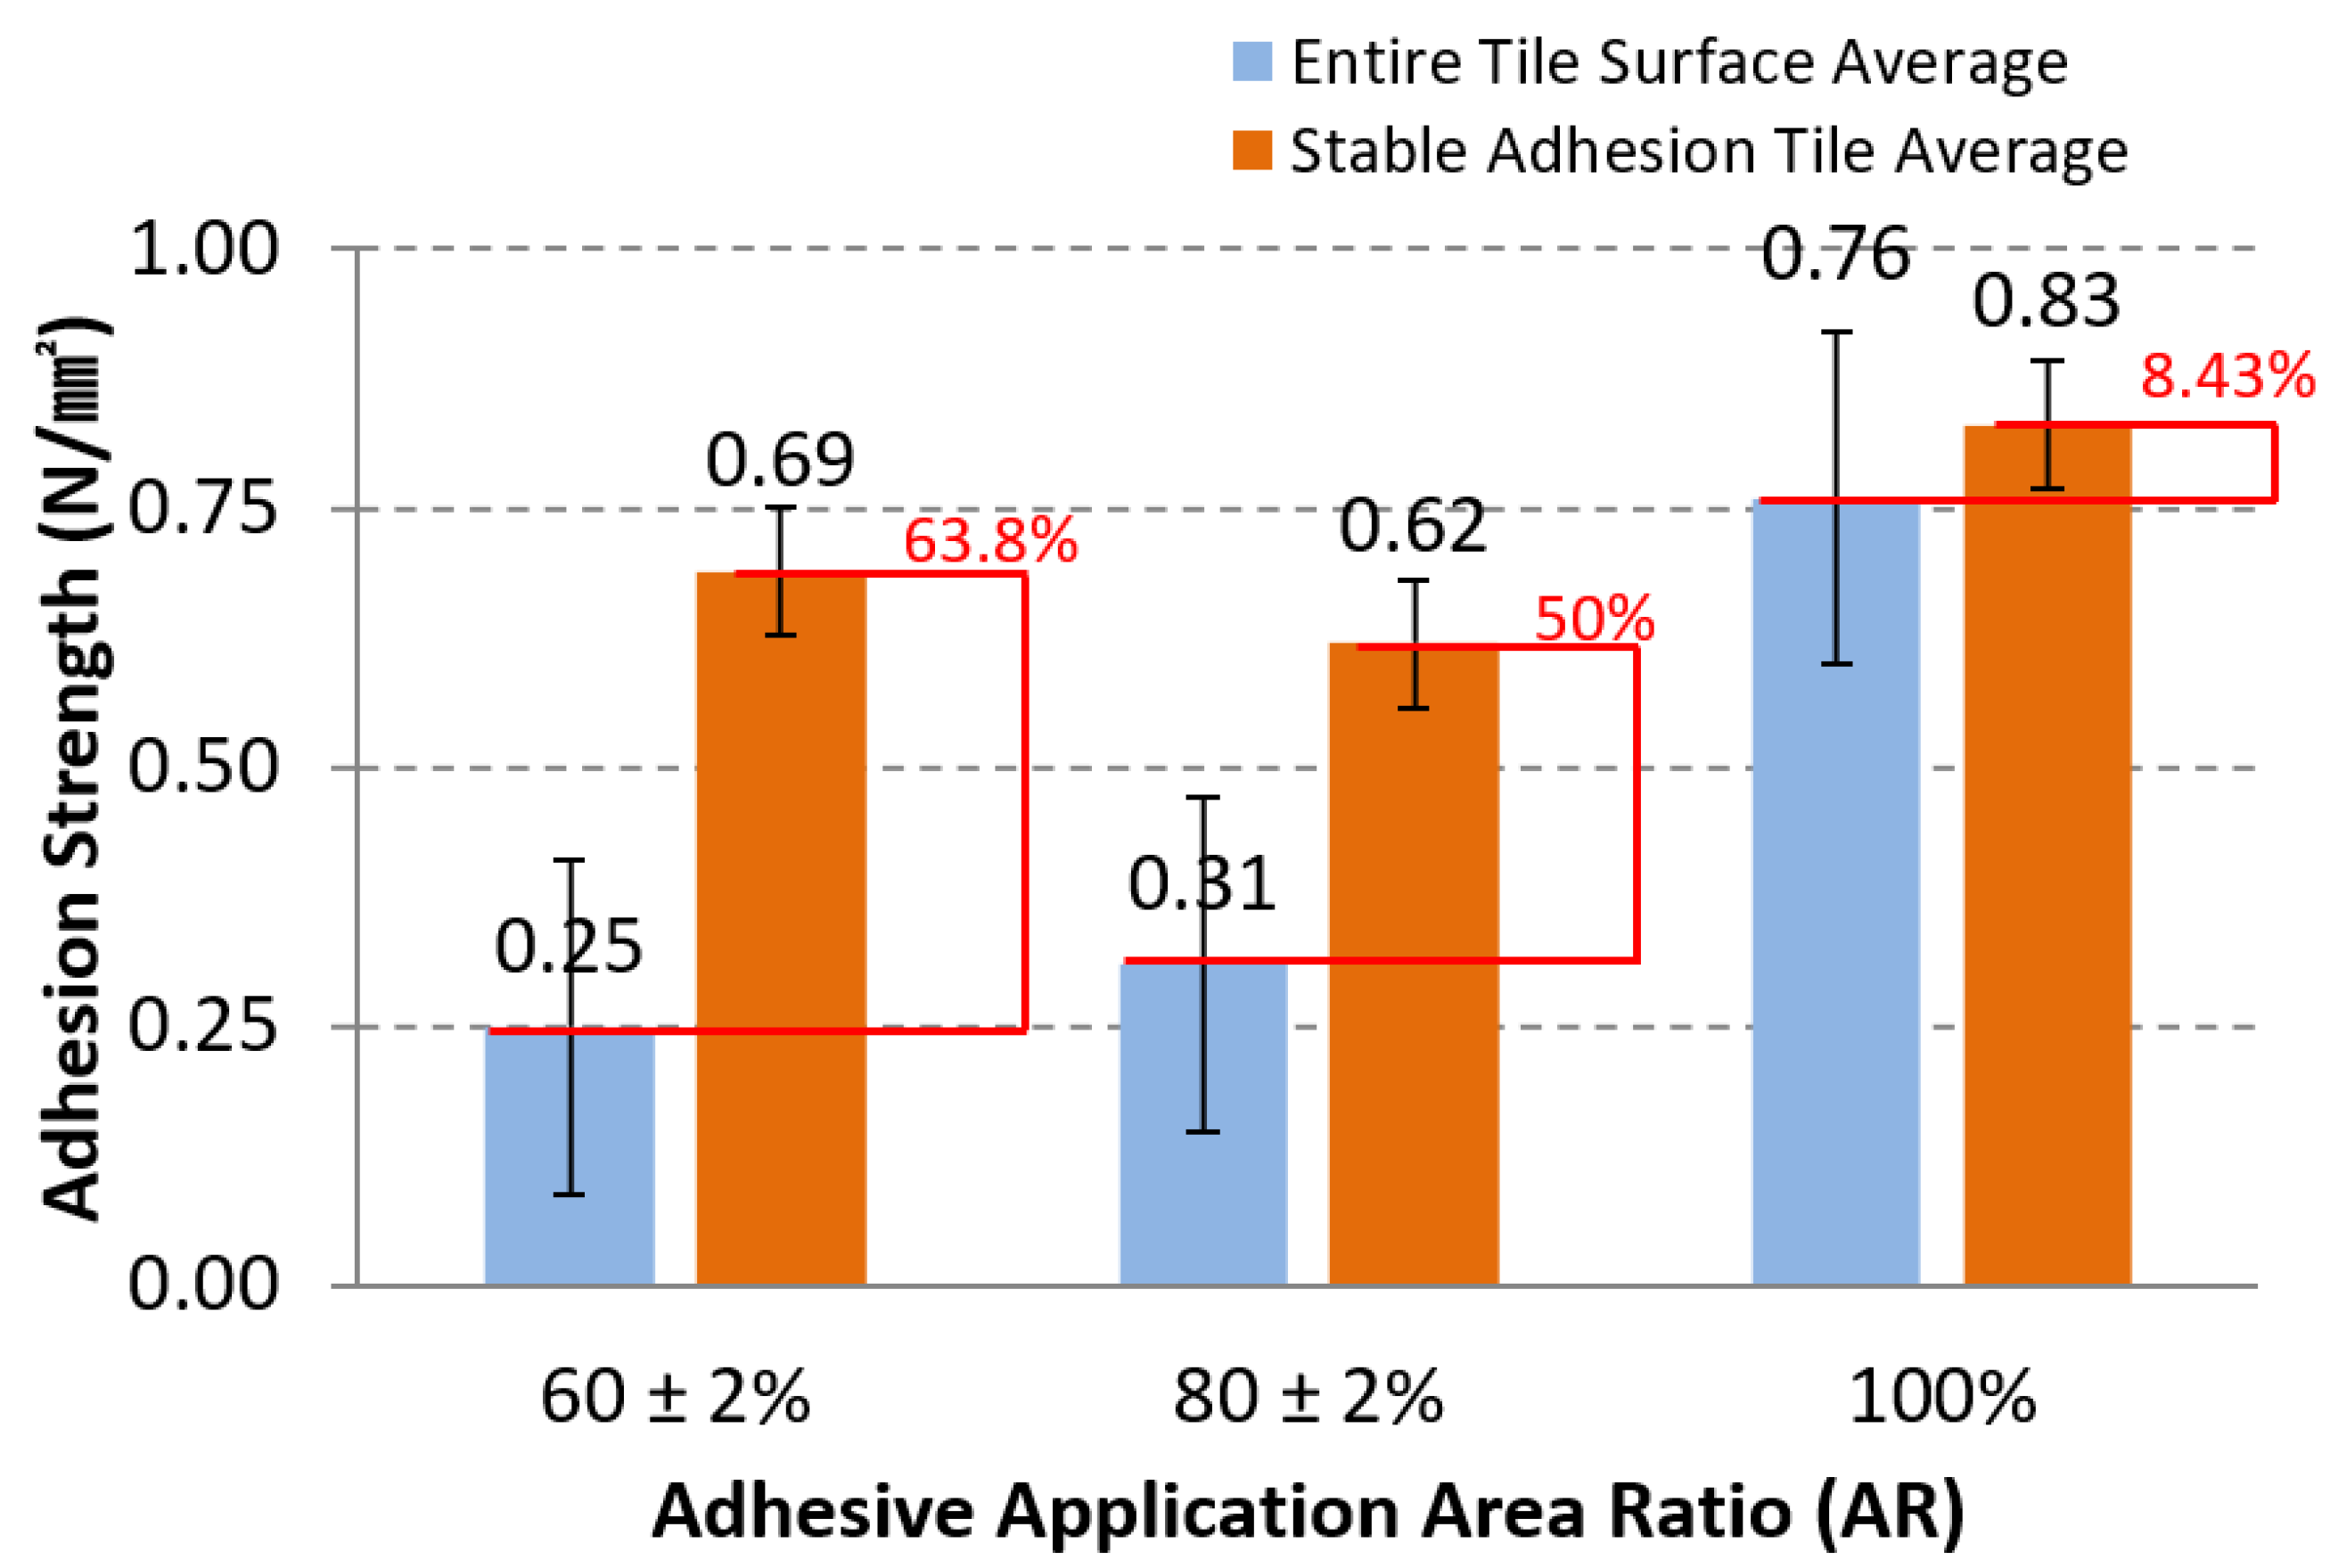
| AR Conditions | Results (Average) | ||
|---|---|---|---|
| 60 ± 2% | 80 ± 2% | 100% | |
| 40 tile pieces adhesion strength average | 0.25 N/mm2 | 0.31 N/mm2 | 0.76 N/mm2 |
| Fully adhered pieces | 14.7 (36.7%) | 21.7 (54.2%) | 37.3 (93.3%) |
| Average adhesion strength of the fully adhered pieces | 0.69 N/mm2 | 0.61 N/mm2 | 0.83 N/mm2 |
| ISO standard (0.5) above | 10 (25%) | 12 (30%) | 30 (75%) |
| Entire tile/stable adhesion pieces ratio (%) | 68.5% | 58.8% | 80.6% |
Publisher’s Note: MDPI stays neutral with regard to jurisdictional claims in published maps and institutional affiliations. |
© 2021 by the authors. Licensee MDPI, Basel, Switzerland. This article is an open access article distributed under the terms and conditions of the Creative Commons Attribution (CC BY) license (https://creativecommons.org/licenses/by/4.0/).
Share and Cite
Lee, J.-h.; Kim, B.-s.; Oh, K.-h.; Jiang, B.; He, X.; Kim, B.-i.; Oh, S.-k. Adhesion Strength Change Analysis Based on the Application Surface Area Ratio of Spot-Bonded Tiles on Vertical Walls of High Humidity Facilities. Appl. Sci. 2021, 11, 5357. https://doi.org/10.3390/app11125357
Lee J-h, Kim B-s, Oh K-h, Jiang B, He X, Kim B-i, Oh S-k. Adhesion Strength Change Analysis Based on the Application Surface Area Ratio of Spot-Bonded Tiles on Vertical Walls of High Humidity Facilities. Applied Sciences. 2021; 11(12):5357. https://doi.org/10.3390/app11125357
Chicago/Turabian StyleLee, Jung-hun, Bum-soo Kim, Kyu-hwan Oh, Bo Jiang, Xingyang He, Byoung-il Kim, and Sang-keun Oh. 2021. "Adhesion Strength Change Analysis Based on the Application Surface Area Ratio of Spot-Bonded Tiles on Vertical Walls of High Humidity Facilities" Applied Sciences 11, no. 12: 5357. https://doi.org/10.3390/app11125357
APA StyleLee, J.-h., Kim, B.-s., Oh, K.-h., Jiang, B., He, X., Kim, B.-i., & Oh, S.-k. (2021). Adhesion Strength Change Analysis Based on the Application Surface Area Ratio of Spot-Bonded Tiles on Vertical Walls of High Humidity Facilities. Applied Sciences, 11(12), 5357. https://doi.org/10.3390/app11125357