Abstract
As the size and weight of blades increase with the recent trend toward larger wind turbines, it is important to ensure the structural integrity of the blades. For this reason, the blade consists of an upper and lower skin that receives the load directly, a shear web that supports the two skins, and a spar cap that connects the skin and the shear web. Loads generated during the operation of the wind turbine can cause debonding damage on the spar cap-shear web joints. This may change the structural stiffness of the blade and lead to a lack of integrity; therefore, it would be beneficial to be able to identify possible damage in advance. In this paper we present a model to identify debonding damage based on natural frequency. This was carried out by modeling 1105 different debonding damages, which were classified by configuration type, location, and length. After that, the natural frequencies, due to the debonding damage of the blades, were obtained through modal analysis using FE analysis. Finally, an artificial neural network was used to study the relationship between debonding damage and the natural frequencies.
1. Introduction
Wind turbine blades generate electrical energy by using the lift and drag of passing wind to rotate a structure connected to a generator shaft. The blade is composed of upper and lower skins that receive the wind energy, and a spar cap-shear web that increase the load resistance of, and prevent damage to, the skin [1,2]. To address the resulting increase in the weight of the blade’s structure, wind turbine components are generally manufactured using glass- and/or carbon-fiber-reinforced composites with high specific strengths and stiffnesses [3,4]. When these composite structures are connected, mechanical bonding methods such as riveting or bolting may not only increase weight but also the stress concentration and resulting premature failure. Therefore, an adhesive-based bonding method is used to make the connections between these composite structures [5]. Unfortunately, adhesive-based joints have a high likelihood of developing debonding damage that separates the joints between members due to defects or unconsidered factors in the design and manufacturing process, potentially causing the catastrophic failure of the wind turbine [6,7]. In particular, the joint between the spar cap-shear web, which supports the entire load applied to the blade, is considered to be an early and dominant failure site that can lead to significant damage [7,8,9]. It is therefore important to have a methodology to identify possible debonding damage in advance of premature failure at the joints between the blade spar cap-shear web.
There are many techniques to detect the damage in structures, including visual inspection, vibration analysis, ultrasound detection, thermal imaging, machine vision, and finite element analysis [10,11,12,13,14,15]. Among them, the detection of damage by measuring the vibration frequency of a structure is based on the theory that the natural frequency of a structure might change with the change in its stiffness owing to internal damage. For example, Awadallah et al. [12] proposed a damage detection technique using the natural frequency change of small wind turbine blades equipped with acceleration sensors. Furthermore, Wang et al. [13] predicted the damage of a blade using the vibration responses acquired from modal analysis of data obtained from a test of small wind turbine blades. As the vibration analysis technique can detect both external and internal damage, it is considered particularly appropriate for detecting damage to composite blades joined using adhesive bonding. Although it is reasonable that the natural frequency changes due to the damage of the blade, there are some issues in detecting damage using natural frequency; the first is that the debonding damage has various configurations (location, length, and single or multiple damages) and the second is that the sensitivity of natural frequency of damage is very low.
It should be noted that the natural frequency of a wind turbine blade changes in very complex ways depending on the various configurations of debonding damage. Thus, a more efficient analysis method is required to extract damage features from the change in natural frequency. One potential solution is an application of machine learning, which enhances the information-processing capacity of computer programs by training them with data and processing experiences [16,17]. For example, Joshuva et al. [18] suggested a machine learning-based damage-type classification technique for small wind turbine blades using their natural frequencies, and Helbing et al. [19] and Regan et al. [20] introduced a machine learning technique for identifying damage in wind turbines. However, these studies were limited to the external damage of small blades and did not consider the structural characteristics of large blades, such as their extreme length or use of a spar cap-shear web, or the various factors affecting debonding damage. It is, therefore, necessary to develop a systematic and highly reliable identification method for identifying internal debonding damage in composite blades considering the structural features and responses of large wind turbine blades.
The objective of this study is to develop the debonding damage identification model for the various types of debonding damage that could occur inside composite wind turbine blades using an artificial neural network (ANN), based on the natural frequency changes due to the debonding damage. To this end, the debonding damage configurations for a wind turbine composite blade were first defined by considering the damage variables (the damaged joint, the location, and damage length), then modeled using the finite element analysis software. A debonding damage map was then established by obtaining data describing the natural frequency change due to the debonding damage configurations in this model. Then, a principal component analysis (PCA) was conducted by comparing the natural frequency change rates for each damage configuration to inform the selection of a natural frequency that exhibits a large change rate due to debonding damage. Finally, an ANN-based damage identification model for various damage configurations in composite blades was implemented and demonstrated in MATLAB.
2. Development of Identification Procedure
This study developed and demonstrated a procedure for identifying debonding damage using an ANN on the changes in the natural frequency characteristics of a wind turbine blade, as shown in Figure 1. The procedure consists of (1) selecting the target blade and constructing a corresponding FE model, (2) defining the debonding damage configuration through selecting proper debonding damage variables, (3) constructing a debonding damage map using the natural frequency changes obtained through modal analysis, (4) selecting important key features using a preprocessing technique such as PCA, and (5) identifying debonding damage using an ANN. In this study, the authors employed the blades of the 5-MW class Sandia offshore wind turbine [21].
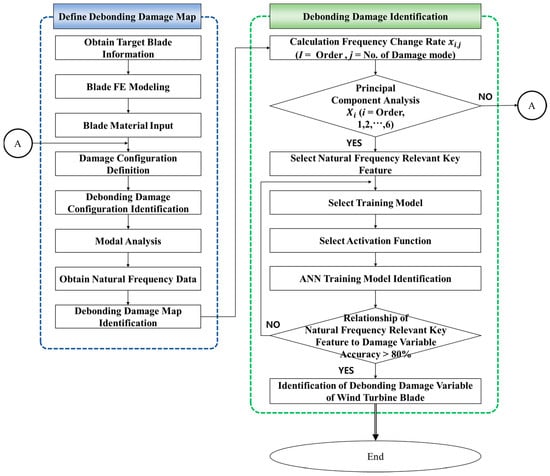
Figure 1.
Flow chart for identifying debonding damage in a wind turbine blade.
2.1. Defining the Debonding Damage Map
To construct a dataset (debonding damage map) for identifying debonding damage based on natural frequency change characteristics, the various natural frequencies corresponding to various debonding damage configurations were obtained by performing a series of modal analyses. To do so, the FE model shown in Figure 2 was constructed in the ABAQUS according to the Sandia report [21]. Here, the authors used the 4node S4R shell elements and their number of elements and nodes which were 92,234 and 94,709, respectively. The mechanical properties are summarized in Table 1.
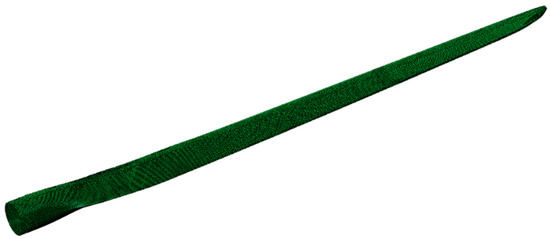
Figure 2.
Composite wind turbine blade model.

Table 1.
Mechanical properties.
In particular, to model debonding damage at the spar cap-shear web joints, the multi-point constraint (MPC) technique was applied to prevent stress concentrations and consider the joints’ structural behavior [22]. In addition, although there are numerous configurations of damage that can occur in blades composed of skin, a spar cap, and a shear web, a limited set of governing variables were selected in the study to realize a more efficient and less time-consuming analysis. As shown in Figure 3, the debonding damage configurations were defined by varying the single/multiple damages, start location, and length of debonding damage at the specific joint. The natural frequencies for each of these damage configurations were then obtained by performing modal analysis.
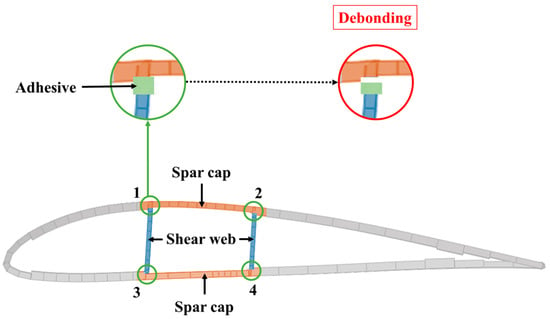
Figure 3.
Debonding damage at the spar cap-the shear web joints.
2.2. Key Features for Debonding Damage Identification
In this study, machine learning was applied to analyze the correlations between various damage configurations and the resulting changes in the natural frequency. Among the various machine learning techniques, the authors chose the ANN, which is advantageous for defining the relationship between data.
Damage identification using a debonding damage map based on various combinations of damage variables requires a great deal of data. Thus, the dataset is likely to include unnecessary components that do not have a significant effect on the actual results but would adversely affect the accuracy of the identification model. To address this problem, data were preprocessed using a normalizing technique that provides data uniformity by converting the degree of change in the measured data into a percentage. First, the natural frequency change of each configuration was determined by comparing the natural frequencies obtained through modal analysis of the first to the sixth of the model with debonding damage (based on the debonding damage map) with those of the model with no damage as follows:
where i and j are the mode of the natural frequency and the number of damage configurations, respectively. Hence, there are a total of 1105 configurations (undamaged configuration + 1104 damage configurations), and is the natural frequency change rate. The symbols of and are the natural frequency of undamaged blades and damaged blades, respectively.
Based on this natural frequency change rate, the authors selected the relevant key features of the natural frequencies, which exhibited a high correlation between damage variable and natural frequency as Equation (2). Here Equation (2) means the average natural frequency change rate for each natural frequency mode.
2.3. Artificial Neural Network for Debonding Damage Identification
An ANN has a single or multiple hidden layers and could represent the complicated relationships between the various inputs and outputs. For a single layer ANN, the output could be expressed using a weight function vector as follows
Here, x and y mean the input and output data, respectively. and b are the weight function and bias vector, respectively. The single-layer ANN is suitable to the classification model, and it is also well known that an ANN with a single hidden layer could approximate a damage localization using bispectral features [23]. There are, however, three complicated damage variables in this study: (1) damage length at a specific spar cap-shear web joint, (2) damage starting point at a specific spar cap-shear web joint, and (3) number of damage occurring in joints. Combining these damage variables leads us to a total of three damage configuration types: Type 1 means single damage at one joint, Configuration Type 2 is two damages at one joint, and Configuration Type 3 is single damage at each of two joints. Here, it is reasonable that the damage configuration in this study has a very high order of damage geometry nonlinearities, and then, the single-layer ANN could not approximate these damage geometry nonlinearities. To address this, the authors employed the double-layer ANN model which could represent the more complicated relationship as follows:
Once the data were preprocessed, the data were used as the input-layer data and the corresponding debonding damage configurations as the output-layer data in accordance with the ANN algorithm, as shown in Figure 4. Then, double layers that could express the various input and output relationships were generated and trained using these data patterns. The authors tried to minimize the errors by repeatedly updating weights through differentiation until the error converged to zero. Furthermore, to prevent overfitting due to excessive training using only a single learning model, which prevents proper identification when other data are input, the model was trained repeatedly without duplicating the training, testing, or verification data. Then, data overfitting was prevented using the cross-validation technique to select the appropriate relationships by taking the average of each evaluation index for the model.
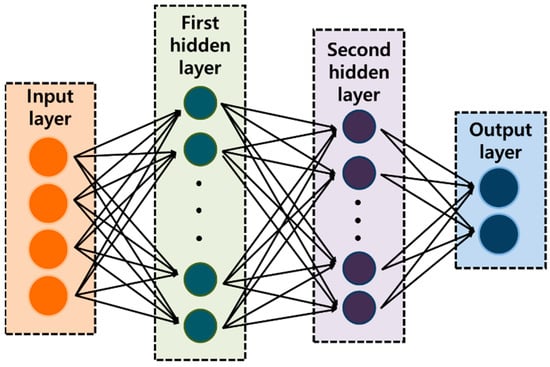
Figure 4.
ANN architecture for identification of debonding damage.
3. Results and Discussion
3.1. Definition of the Debonding Damage Map
As the accuracy of the proposed machine-learning-based identification model is considerably affected by the input data, appropriate relevant key features of natural frequencies should be chosen to reflect debonding damage. The natural frequency change rate is affected by the damage configuration according to the structural characteristics of the blade, and there are many different configurations. Therefore, at least 1000 sets of debonding damage configurations are required to build a debonding damage map for accurate and reliable identification.
This study accordingly developed the 1105 damage configurations defined in Table 2 according to damage variables such as single or multiple damages, damage start location, and damage length. Three damage configuration types were evaluated: Configuration Type 1 (Figure 5a) means single damage at one joint, Configuration Type 2 (Figure 5b) shows two damages at one joint, and Configuration Type 3 (Figure 5c) is single damage at each of two joints. The damage start locations were defined as 10 m, 22 m, and 34 m from the root, as shown in Figure 6. Finally, the damage length was increased from 2 m to 8 m in 2 m intervals, starting from the damage start location. In the configuration of the 10 m damage start location, the damage length extended from the root up to 18 m from the root, as shown in Figure 7. The longest length was selected to include the location at 30–35% of the total blade length from the root, where structural integrity is most lacking, and thus the maximum stress is experienced under extreme loads, as identified in a previous study [24]. The various blade damage configurations were then modeled using the MPC technique, and modal analyses were performed to obtain the resulting natural frequencies for the 1st to the 6th, as shown in Table 3.

Table 2.
Debonding damage configuration.
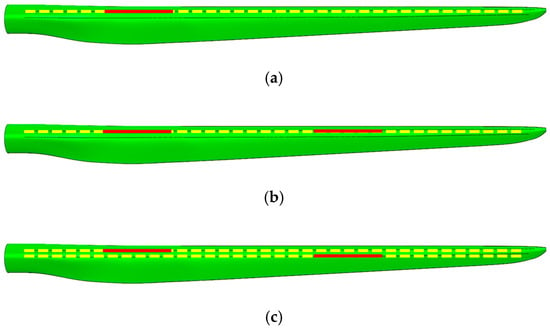
Figure 5.
Debonding damage: (a) Configuration type 1; (b) Configuration type 2; (c) Configuration type 3 (shown schematically).

Figure 6.
Debonding damage start location.
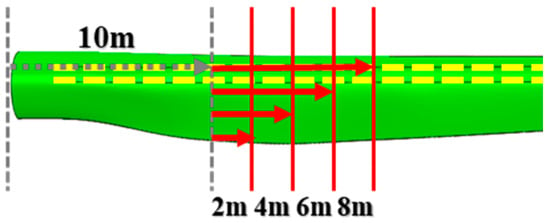
Figure 7.
Debonding damage length (shown for 10 m start location).

Table 3.
Debonding damage map.
3.2. Debonding Damage Identification
The natural frequencies of damaged blades (Dataset No. 2–Dataset No. 1105 in Table 3) were normalized by the natural frequencies of undamaged blades (Dataset No. 1 in Table 3) to have uniformity in the data defined in Section 3.1. The natural frequency change rate and the average for each natural frequency mode were accordingly determined, as shown in Table 4. The natural frequency of the 3rd, 5th, and the 6th, at which the change rate appears to be larger, were selected as relevant key features because they showed higher sensitivity on the damage configurations. Then, ANN-based machine learning analysis was performed to identify the correlations between these features and the damage variables and to define the identification model. Here, the natural frequencies of the 3rd, 5th, and the 6th for each of the damage configurations were applied as the input-layer data, and the debonding damage configurations were chosen as the output-layer data. In addition to this, 70% of the debonding damage configurations were used as the training data and 30% as the verification data.

Table 4.
Frequency change rates and averages.
The analysis results showed an overall damage identification accuracy of 84%, as shown in Figure 8. Here, the x-axis represents the predefined debonding damage variables for 1105 sets of debonding damage configurations defined for training and the y-axis represents the identified debonding damage variables obtained through the proposed ANN-based damage identification model. Here, the dotted line indicates the reference line of R = 1.0 and the solid line shows the regression line for the identification results by the ANN-based damage identification model. These results show that the proposed ANN-based damage identification model has a high accuracy of about 84%.
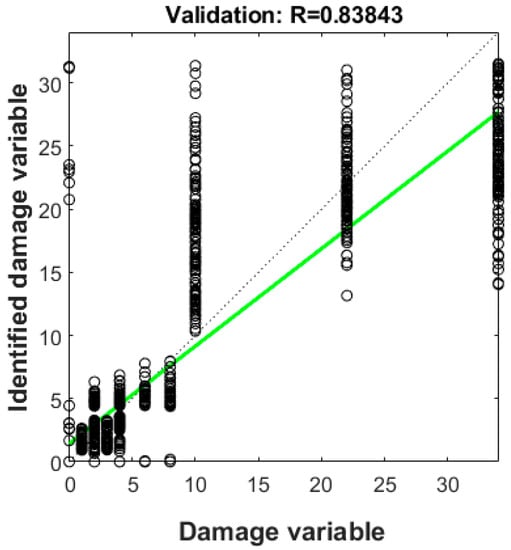
Figure 8.
Overall damage identification accuracy.
For further understanding of the results from the proposed model, a detailed analysis was conducted for each damage configuration type. Figure 9a indicates that the identification accuracy of Type 1 damage, with single damage at one joint, was quite high, at 97%. However, the reference (dotted line) and identified results obtained through the training data (solid line) do not match in all ranges because only 34 of the 773 training data contained Type 1 damage. Thus, it is difficult to assume that all the identified results are reliable because such a small number of damage configurations were used. Figure 9b indicates that the identification accuracy of Type 2 damage, with two damages at one joint, was even higher than for Type 1 at about 98%. Hence, the identified results by the proposed model for 134 of the training data were almost identical to the reference value. Figure 9c shows that despite being informed by the largest amount of training data (605 data), the identification accuracy of Type 3 (single damage at each of two joints) damage is 88%, which is the lowest of the three types of damage composition. Here, the overall accuracy of the ANN-based damage identification model presented in this study is governed by the damage configuration Type 3, where damage variables are the most complicated (single damage at each of two joints) and the number of training data is the largest (605 data).
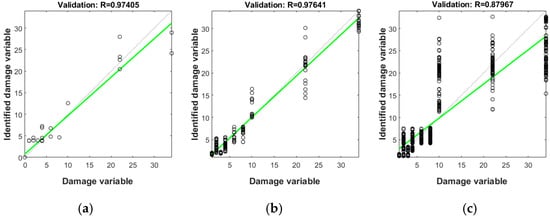
Figure 9.
Damage identification accuracy according to: (a) Type 1; (b) Type 2; (c) Type 3.
From the above results, it could be said that the damage identification model proposed in this paper could identify the debonding damage occurring in the composite blade spar cap-shear web joint with high accuracy. Additionally, to improve the accuracy of the debonding damage identification model, it is necessary to select proper damage variables that could express the debonding damage that may occur in the actual blade and to obtain appropriate training data for each variable.
4. Conclusions
This study proposed an ANN-based algorithm to identify the occurrence of debonding damage at the connection joints between the spar cap- shear web of composite wind turbine blades. The damage configuration type, damage start location, and damage length were chosen as representative damage variables, and 1105 damage configurations were defined using the representative damage variables. A finite element model was then constructed using the MPC technique to simulate these damage configurations, and the resulting natural frequencies were obtained by performing modal analyses. To increase the accuracy of the natural-frequency-based damage identification model, the natural frequency change rate and the average were calculated through principal component analysis, which are the key features of having a significant relationship with the damage variables. Finally, ANN-based machine learning was performed, and the results showed a damage identification accuracy of 84%. It is expected that the damage identification model proposed in this paper could identify any debonding damage occurring in the composite blade spar cap-shear web joints with a high degree of accuracy.
Author Contributions
Investigation, H.-G.K.; Software, H.-J.K.; Writing—original draft, Y.-J.J.; Writing—review&editing, K.-W.K. All authors have read and agreed to the published version of the manuscript.
Funding
This work was supported by the Korea Institute of Energy Technology Evaluation and Planning (KETEP) and the Ministry of Trade, Industry & Energy (MOTIE) of the Republic of Korea (No. 20173010024950) and by Korea Electric Power Corporation (Grant number: R20XO02-29).
Conflicts of Interest
The authors declare no conflict of interest.
References
- Joustra, J.; Flipsen, B.; Balkenende, R. Structural reuse of high end composite products: A design case study on wind turbine blades. Resour. Conserv. Recycl. 2021, 167, 105393. [Google Scholar] [CrossRef]
- Ju, S.H.; Huang, Y.C.; Huang, Y.Y. Study of optimal large-scale offshore wind turbines. Renew. Energy 2020, 154, 161–174. [Google Scholar] [CrossRef]
- Griffith, D.T.; Ashwill, T.D. The Sandia 100-Meter All-Glass Baseline Wind Turbine Blade: SNL100-00; Sandia National Laboratories: Albuquerque, NM, USA, 2011.
- Bagherpoor, T.; Xuemin, L. Structural optimization design of 2 MW composite wind turbine blade. Energy Procedia 2017, 105, 1226–1233. [Google Scholar] [CrossRef]
- Ji, Y.M.; Han, K.S. Fracture mechanics approach for failure of adhesive joints in wind turbine blades. Renew. Energy 2014, 65, 23–28. [Google Scholar] [CrossRef]
- Rafiee, R.; Hashemi-Taheri, M.R. Failure analysis of a composite wind turbine blade at the adhesive joint of the trailing edge. Eng. Fail. Anal. 2021, 121, 105148. [Google Scholar] [CrossRef]
- Yang, J.; Peng, C.; Xiao, J.; Zeng, J.; Xing, S.; Jin, J.; Deng, H. Structural investigation of composite wind turbine blade considering structural collapse in full-scale static tests. Compos. Struct. 2013, 97, 15–29. [Google Scholar] [CrossRef]
- Overgaard, L.C.T.; Lund, E. Structural collapse of a wind turbine blade. Part B: Progressive interlaminar failure models. Compos. A Appl. Sci. Manuf. 2010, 41, 271–283. [Google Scholar] [CrossRef]
- Zhang, L.; Guo, Y.; Wang, J.; Huang, X.; Wei, X.; Liu, W. Structural failure test of a 52.5 m wind turbine blade under combined loading. Eng. Fail. Anal. 2019, 103, 286–293. [Google Scholar] [CrossRef]
- Ciang, C.C.; Lee, J.R.; Bang, H.J. Structural health monitoring for a wind turbine system: A review of damage detection methods. Meas. Sci. Technol. 2008, 19, 121001. [Google Scholar] [CrossRef]
- Du, Y.; Zhou, S.; Jing, X.; Peng, Y.; Wu, H.; Kwok, N. Damage detection techniques for wind turbine blades: A review. Mech. Syst. Signal Process 2020, 141, 106445. [Google Scholar] [CrossRef]
- Awadallah, M.; El-Sinawi, A. Effect and detection of cracks on small wind turbine blade vibration using special Kriging analysis of spectral shifts. Measurement 2020, 151, 107076. [Google Scholar] [CrossRef]
- Wang, Y.; Liang, M.; Xiang, J. Damage detection method for wind turbine blades based on dynamics analysis and mode shape difference curvature information. Mech. Sys. Signal Process 2014, 48, 351–367. [Google Scholar] [CrossRef]
- Damiano, M.; Russo, A.; Sellitto, A.; Vecchio, E.; Stellato, T.; Riccio, A. Design of a composite wind turbine blade manufactured with the ONE SHOT BLADE® technology. Mater. Today Proc. 2021, 34, 103–105. [Google Scholar] [CrossRef]
- Sellitto, A.; Russo, A.; Riccio, A.; Damiano, M. Fibreglass wind turbine blades: Damage tolerant design and verification. AIP Conf. Proc. 2020, 2309, 020032. [Google Scholar]
- Chen, W.; Qiu, Y.; Feng, Y.; Li, Y.; Kusiak, A. Diagnosis of wind turbine faults with transfer learning algorithms. Renew. Energy 2021, 163, 2053–2067. [Google Scholar] [CrossRef]
- Zhao, Y.; Li, D.; Dong, A.; Kang, D.; Lv, Q.; Shang, L. Fault prediction and diagnosis of wind turbine generators using SCADA data. Energies 2017, 10, 1210. [Google Scholar] [CrossRef]
- Joshuva, A.; Sugumaran, V. A data driven approach for condition monitoring of wind turbine blade using vibration signals through best-first tree algorithm and functional trees algorithm: A comparative study. ISA Trans. 2017, 67, 160–172. [Google Scholar] [CrossRef] [PubMed]
- Helbing, G.; Ritter, M. Deep learning for fault detection in wind turbines. Renew. Sustain. Energy Rev. 2018, 98, 189–198. [Google Scholar] [CrossRef]
- Resor, B.R. Definition of a 5 MW/61.5 m Wind Turbine Blade Reference Model; Sandia National Lab.(SNL-NM): Albuquerque, NM, USA, 2013.
- Regan, T.; Beale, C.; Inalpolat, M. Wind turbine blade damage detection using supervised machine learning algorithms. J. Vibr. Acoust.-Trans. ASME 2017, 139, 061010. [Google Scholar] [CrossRef]
- Haselbach, P.U. An advanced structural trailing edge modelling method for wind turbine blades. Compos. Struct. 2017, 180, 521–530. [Google Scholar] [CrossRef]
- Civera, M.; Zanotti, F.; Surace, C. A novel approach to damage localization based on bispectral analysis and neural network. Smart Struct. Syst. 2017, 20, 669–682. [Google Scholar]
- Kim, H.G. Evaluation of Frequency Response Characteristics According to the Debonding Damage of Composite Blade for Wind Turbine. Master’s Thesis, Kunsan National University, Gunsan-si, Korea, 2018. [Google Scholar]
Publisher’s Note: MDPI stays neutral with regard to jurisdictional claims in published maps and institutional affiliations. |
© 2021 by the authors. Licensee MDPI, Basel, Switzerland. This article is an open access article distributed under the terms and conditions of the Creative Commons Attribution (CC BY) license (https://creativecommons.org/licenses/by/4.0/).