Article

The Study of the Surface Plasmon Polaritons at the Interface Separating Nanocomposite and Hypercrystal

1
Department of Electronic Systems, VILNIUS TECH, 10223 Vilnius, Lithuania
2
Aston Institute of Photonic Technologies, Aston University, Birmingham B4 7ET, UK
3
Semiconductor Physics Institute, Center for Physical Sciences and Technology, 02300 Vilnius, Lithuania
4
Peter the Great St. Petersburg Polytechnic University, 195251 St. Petersburg, Russia
*
Author to whom correspondence should be addressed.
Appl. Sci. 2021, 11(11), 5255; https://doi.org/10.3390/app11115255
Submission received: 7 May 2021 / Revised: 2 June 2021 / Accepted: 3 June 2021 / Published: 5 June 2021
(This article belongs to the Special Issue The Newest Research in Novel Materials)

Abstract

:
Surface plasmon polaritons (SPPs) propagating at the interfaces of composite media possess a number of fascinating properties not emerging in case of conventional SPPs, i.e., at metal-dielectric boundaries. We propose here a helpful algorithm giving rise for investigation of basic features of complex conductivity dependent SPPs at the interface separating nanocomposite and hypercrystal. The main goal of the work is to investigate dispersion of the SPPs propagating at the boundary separating two different media. Aiming to achieve the aforementioned goal that the effective Maxwell Garnett model is used. It is demonstrated that the SPPs dispersive properties are dramatically affected by the material conductivity. Correspondingly, the filling ratio of the nanoparticles in the composite and their dielectric properties also allow one to engineer characteristics of the SPPs. Having a deep insight into the conductivity dependent functions, we concluded, on their behavior for the case of hyperbolic regime and Dyakonov surface waves case. Our model gives rise for studying features of surface waves in the complex conductivity plane and provides more options to tune the fundamental features of SPPs at the boundaries correlated with composite media.

1. Introduction

During the last decades plasmonics attracted significant attention as the novel field pivoting the way for modern technologies, such as spectroscopy and sensing [1] and optical tweezers [2]. Surface plasmons (SPs) are introduced as the collective oscillations of the delocalized electrons presenting at metal-dielectric interfaces. SPs open the wide avenues to escape the diffraction limit of conventional optics [3] because of their capability to confine light in subwavelength dimensions with high efficiency. Doing so, the previous provides a fertile ground for a broad spectrum of applications ranging from surface enhanced spectroscopy [4], biomedical sensing [5] and solar cell photovoltaics [6] to optical antennas [7]. It is worthwhile noting that surface-plasmon-based circuits are established to bridge the disciplines of photonics and electronics at the nanoscale. The former allows to escape the current problems associated with the large size difference between the micrometer-scale bulky components of photonics and the nanometer-scale electronic chips.
The resonant oscillations of free electrons at the interface of nanocomposite media due to optical radiations give rise to surface plasmon polaritons (SPPs) [8]. The propagation of SPPs in nanocomposites has been extensively studied in [9,10,11]. Composite media with metal nanoparticles are of particular importance aiming to create nanostructured metal–insulator systems and novel approaches of manipulating light based on them. The emerge of transparent conductive oxides (TCOs) has attracted tremendous interest within the scientific community. These stand for as the alternative approach for plasmonics [12] in the near-infrared region. In contrary to noble metals, TCOs such as indium tin oxide (ITO) demonstrate a great tunability of their optical and electronic properties [13]. The former is possible via doping and electric bias. The construction and fabrication of ultra-compact electroabsorption modulators [14] and for the proposal of new multimode modulator architectures [15] has benefited from the option of actively switching between a low-loss dielectric regime and a high-absorption plasmonic regime.
In the present work, we discuss complex conductivity of the medium, which dramatically affects tunability of SPPs. The obtained results may have significant applications in storage and sensing devices. Herein, we provide a detailed study of SPPs characteristics at the interface separating a nanocomposite and hypercrystal. Engineering properties of the nanocomposite and that of hypercrystal, the SPPs properties are tuned significantly. We present a complete description of the SPPs dispersion relation with different controlling parameters. Our study is extended aiming to examine the complex conductivity dependent properties.

2. Materials and Methods

Herein, we deal with the plane boundary separating a nanocomposite (NC) semi-infinite layer, which fills the half-space x < 0 and adjacent to it, hypercrystal filling the half-space x > 0 (Figure 1). It should be stressed that the surface waves under consideration propagate along z axis. It is worthwhile noting that the structure under the study can be constructed by means of molecular beam epitaxy [16], chemical vapor deposition, atomic layer deposition and sacrificial etching [17]. The nanocomposite is presented as a non-conductive transparent matrix with a permittivity εn, in the volume of which regularly distributed semiconductor nanoparticles with permittivity εm. The frequency dependent dielectric function of the TCO based nanoparticles is of particular interest. An emergence of high-conducting metal being transparent has opened wide avenues recently. The issue has attracted lots of interest within the scientific community because of the metal being opaque for light. From the perspectives of the potential applications, transparent conducting metals described by high DC conductivity (σDC) are anticipated for optoelectronic devices, ranging from solar cells to electronic paper, touch screens and displays. Though, since σ D C = n e e 2 τ / m (with τ being relaxation time of the electron and m—electron mass) of a metal is associated with plasmon frequency ω p 2 = n e e 2 / ε 0 m through the free-electron density ne, a high-conducting metal (with a high ne) is certainly opaque for light because of its permittivity ε being typically very negatively affected by its high ωp. Conventional techniques to produce transparent conducting metals include the decrease of the ne, by utilizing transparent conducting oxides (TCOs). The parameters of the Drude–Lorentz approach for aluminum-doped zinc oxide (AZO), Ga-doped ZnO (GZO) and indium tin oxide (ITO) gained from experimental data [12] are presented in Table 1.
The dielectric function of metallic medium in the complex conductivity and frequency domain is written as [19]:
ε r ( σ , ω ) = 1 + ( χ + | σ | e i ϕ ω ε 0 )
where χ is the susceptibility of the system, | σ | is absolute value of complex conductivity and ϕ is its phase.
The dispersion relation of SPPs at a planar interface between the dielectric medium and metal forming a simple plasmonic structure in the complex conductivity and frequency domain is written as [20]:
k s p ( σ , ω ) = 2 π λ ε r ( σ , ω ) ε d ε r ( σ , ω ) + ε d
where εd is the permittivity of the host material. By making a step forward towards complex nanostructures, we made an assumption that the wavelength and the electromagnetic field penetration depth in the material are much larger that the size of inclusions suspended in a dielectric matrix. It is worthwhile mentioning that effective Maxwell Garnett model can be employed aiming to characterize the optical properties of the nanocomposite under consideration. The former approach is possible, if the interference effects of the inclusions are neglected and their volume fraction is as small as 1/3. Thus, one may apply the homogenization procedure and the effective complex permittivity of the nanocomposite can be expressed as follows
ε n c ( σ , ω ) = ε n [ 1 + f ( 1 f ) / 3 + ε n / ( ε m ( σ , ω ) ε n ) ]
where εn is the permittivity of the host material of the nanocomposite and f is the number of nanoparticles in the matrix.
Based on the effective medium approximation one may calculate the effective permittivities of the anisotropic nanowire metamaterial (hypercrystal) according to [21]:
ε ( σ , ω ) = ε d [ ε m ( σ , ω ) ( 1 + ρ ) + ε d ( 1 ρ ) ε m ( σ , ω ) ( 1 ρ ) + ε d ( 1 + ρ ) ]
ε | | ( σ , ω ) = ε m ( σ , ω ) ρ + ε d ( 1 ρ )
where εd is the permittivity of the host material, εm is the permittivity of the inclusions embedded into the host material and ρ is the metal filling fraction ratio, which is calculated as:
ρ = n a n o w i r e a r e a u n i t c e l l a r e a
The metal filling fraction (ρ) is calculated based on the values of the pore diameter (d) and spacing (S) (Figure 1b). By taking into account a perfect hexagonal structure, the equation [22,23] is applied as follows:
ρ = π d 2 2 3 S 2
Based on this assumption one may derive a dispersion relation for the surface modes propagating at the interface between two anisotropic media. It is of particular importance to obtain a single surface mode with the propagation constant [24] by calculating the tangential components of the electric and magnetic fields at the interface
β ( σ , ω ) = k ( ( ε | | ( σ , ω ) ε n c ( σ , ω ) ) ε ( σ , ω ) ε n c ( σ , ω ) ε ( σ , ω ) ε | | ( σ , ω ) ε n c 2 ( σ , ω ) ) 1 / 2
By substituting (3)–(5) in (8), one may result in the dispersion relation as follows:
β ( σ , ω ) = k ( ε n b ( σ , ω ) a ( σ , ω ) ( ε n a ( σ , ω ) + ε m ( σ , ω ) ρ ε d ( ρ 1 ) ) ( ε n 2 a ( σ , ω ) 2 + ( ε m ( σ , ω ) ρ ε d ( ρ 1 ) ) b ( σ , ω ) ε d ( ρ + 1 ) ε m ( σ , ω ) ( ρ 1 ) ) ( ε d ( ρ + 1 ) ε m ( σ , ω ) ( ρ 1 ) ) ) 1 / 2 a ( σ , ω ) = f f 3 + ε n ε n ε m ( σ , ω ) 1 3 1 ,   b ( σ , ω ) = ( ρ 1 ) ε d 2 ε m ( σ , ω ) ε d ( ρ + 1 ) .
It is worthwhile noting, that Equation (9) stand for as the analytical expression of the dispersion relations investigated in the frame of the present work.

3. Results

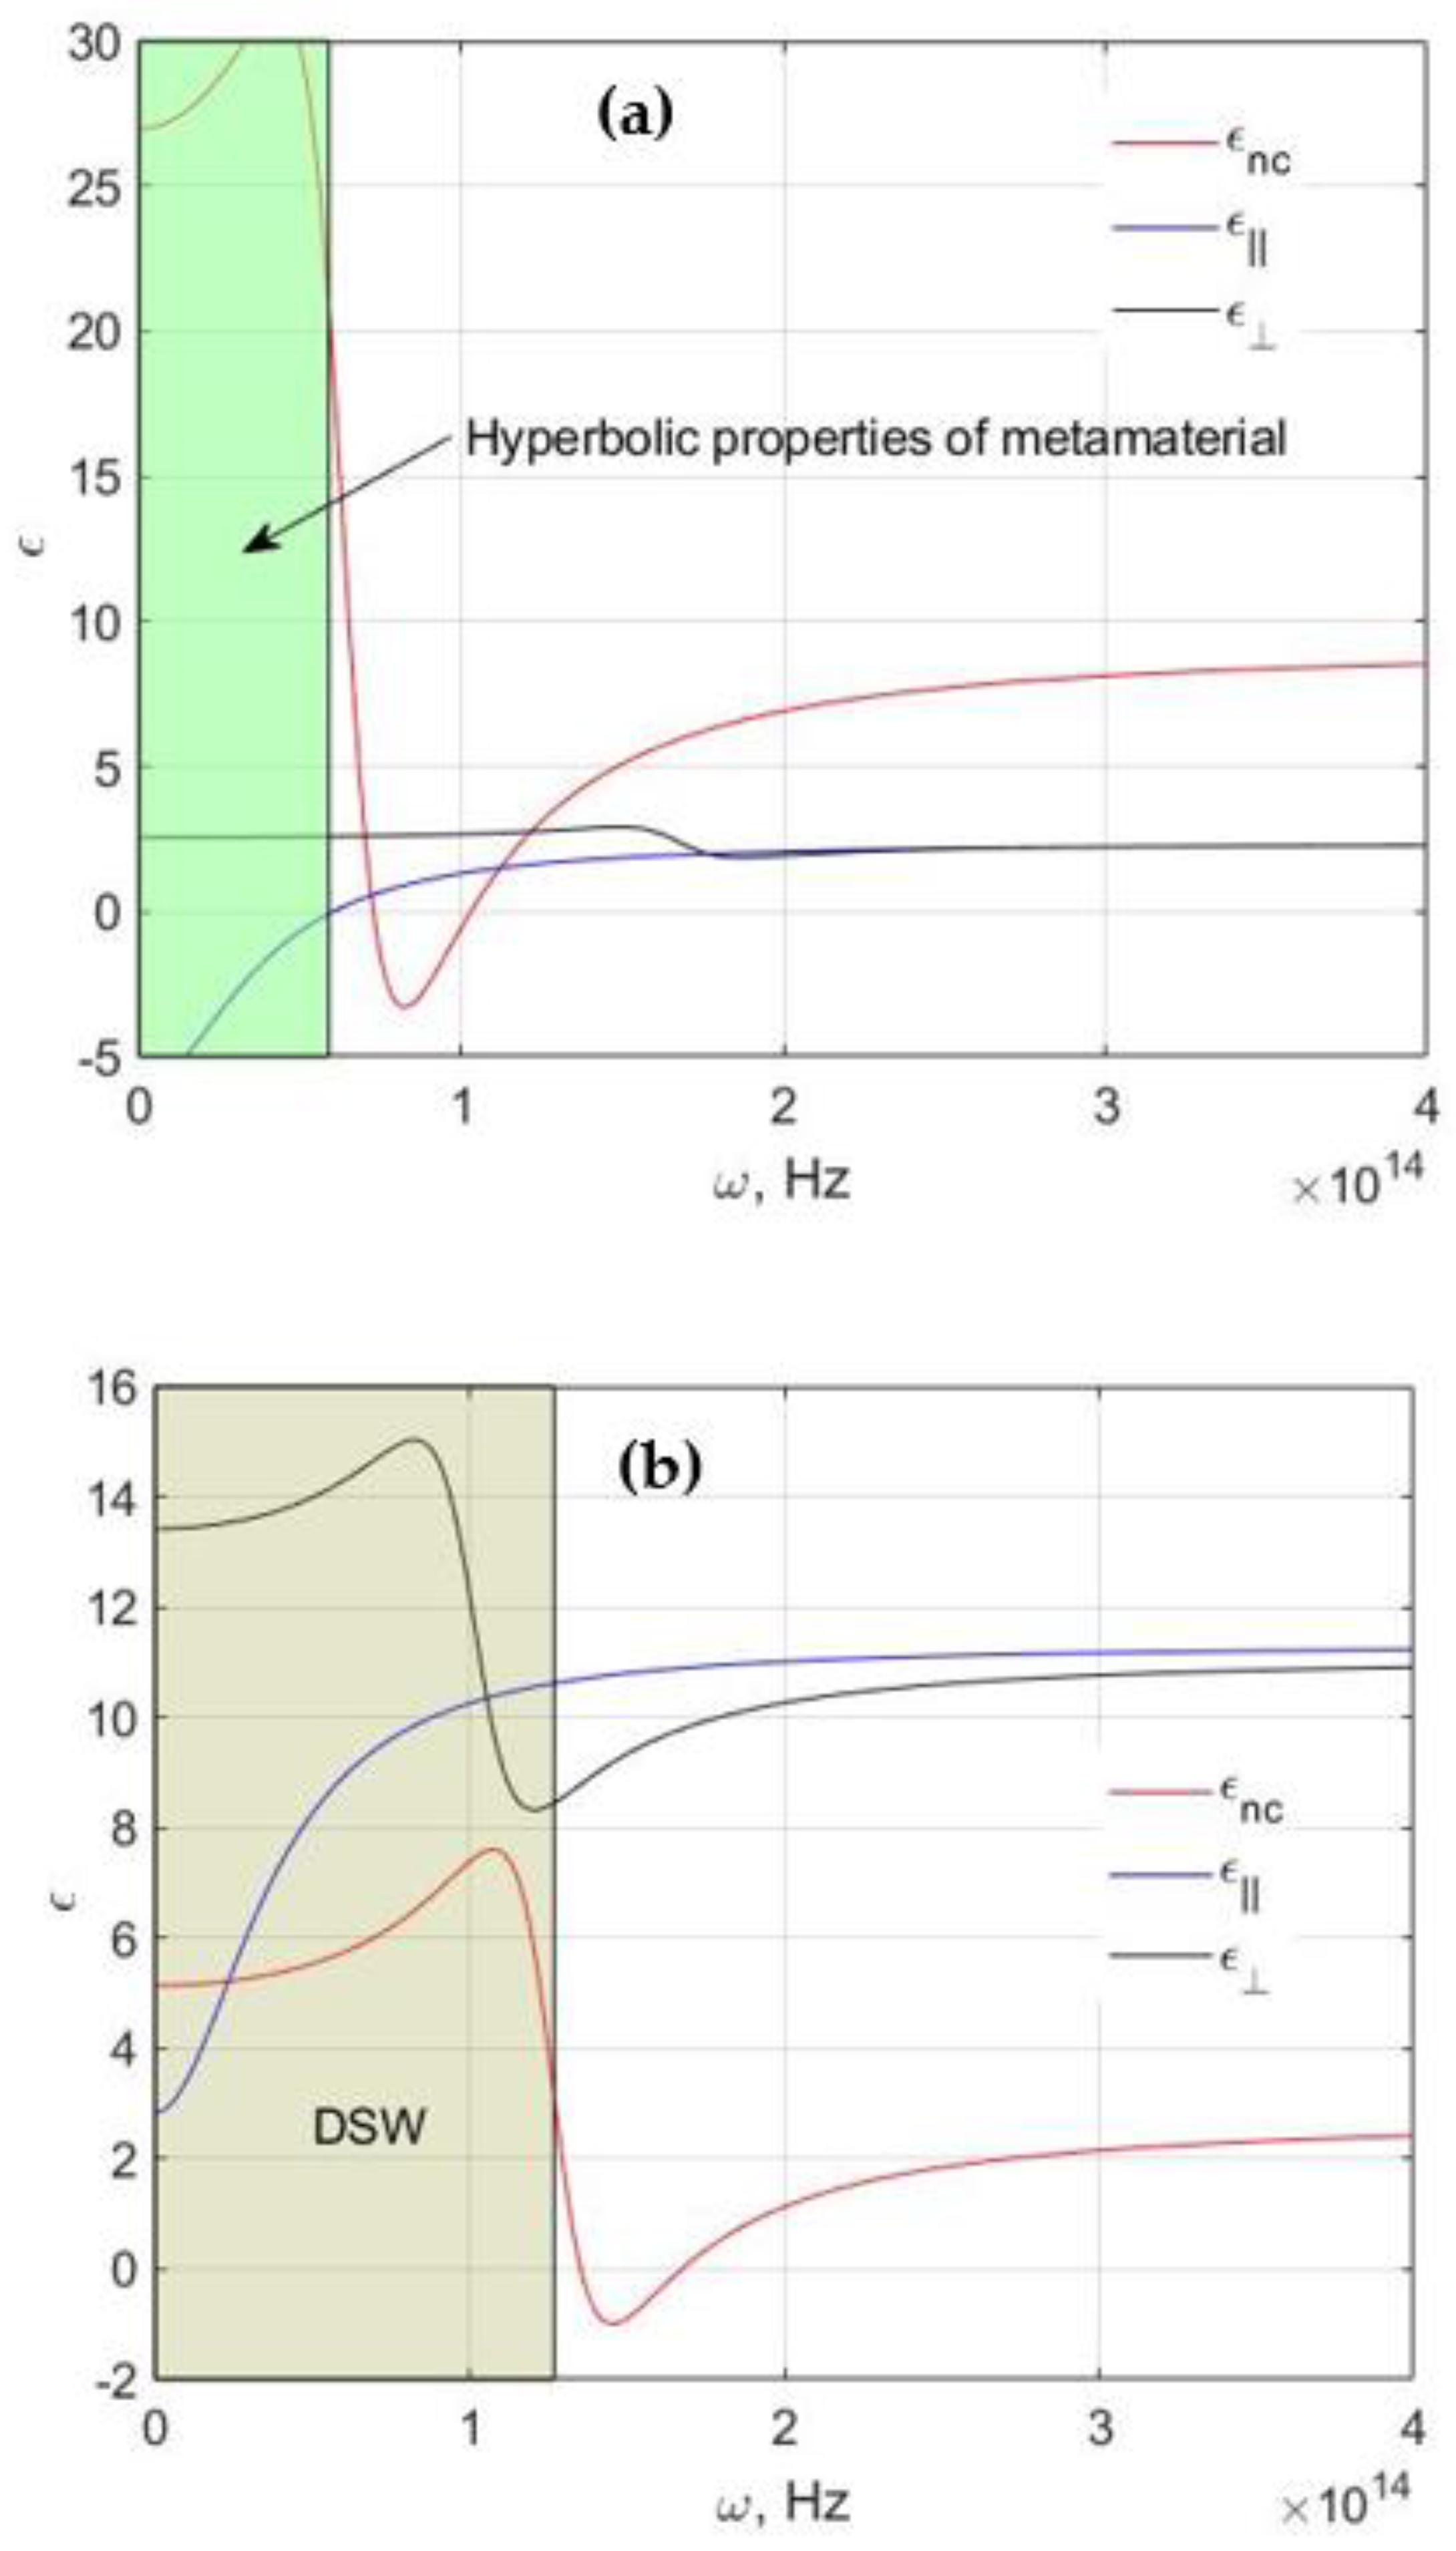
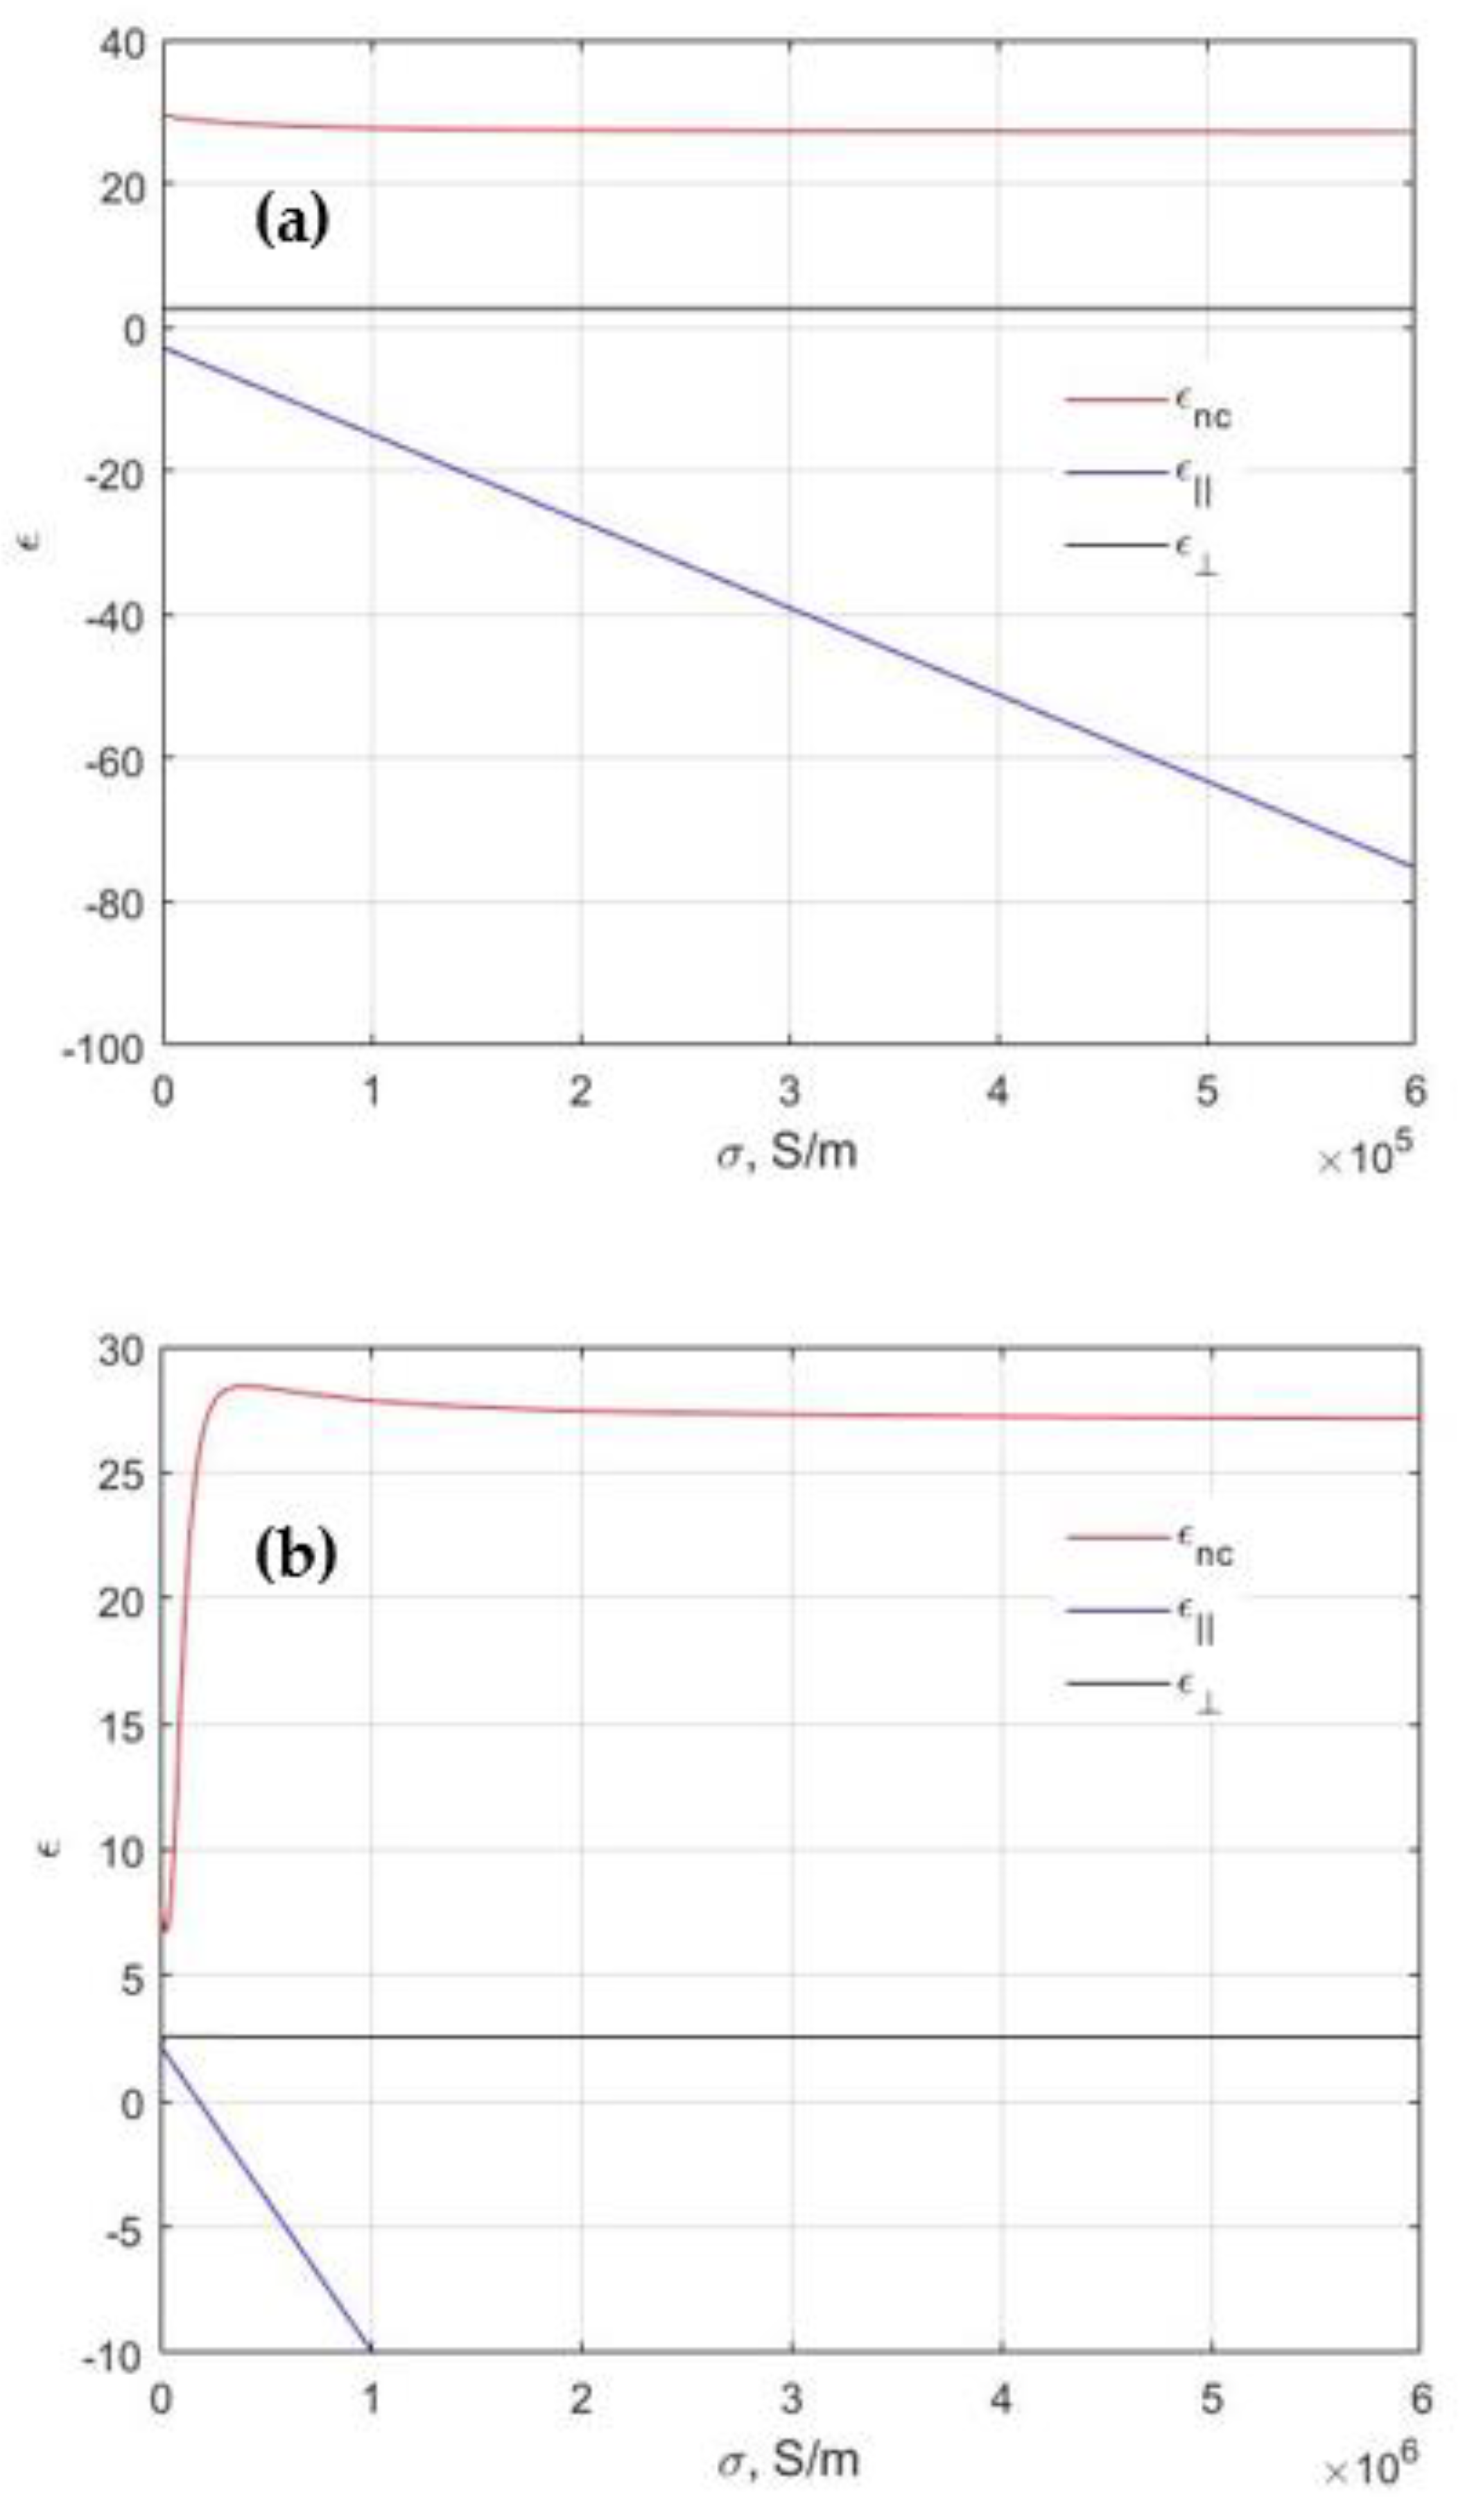
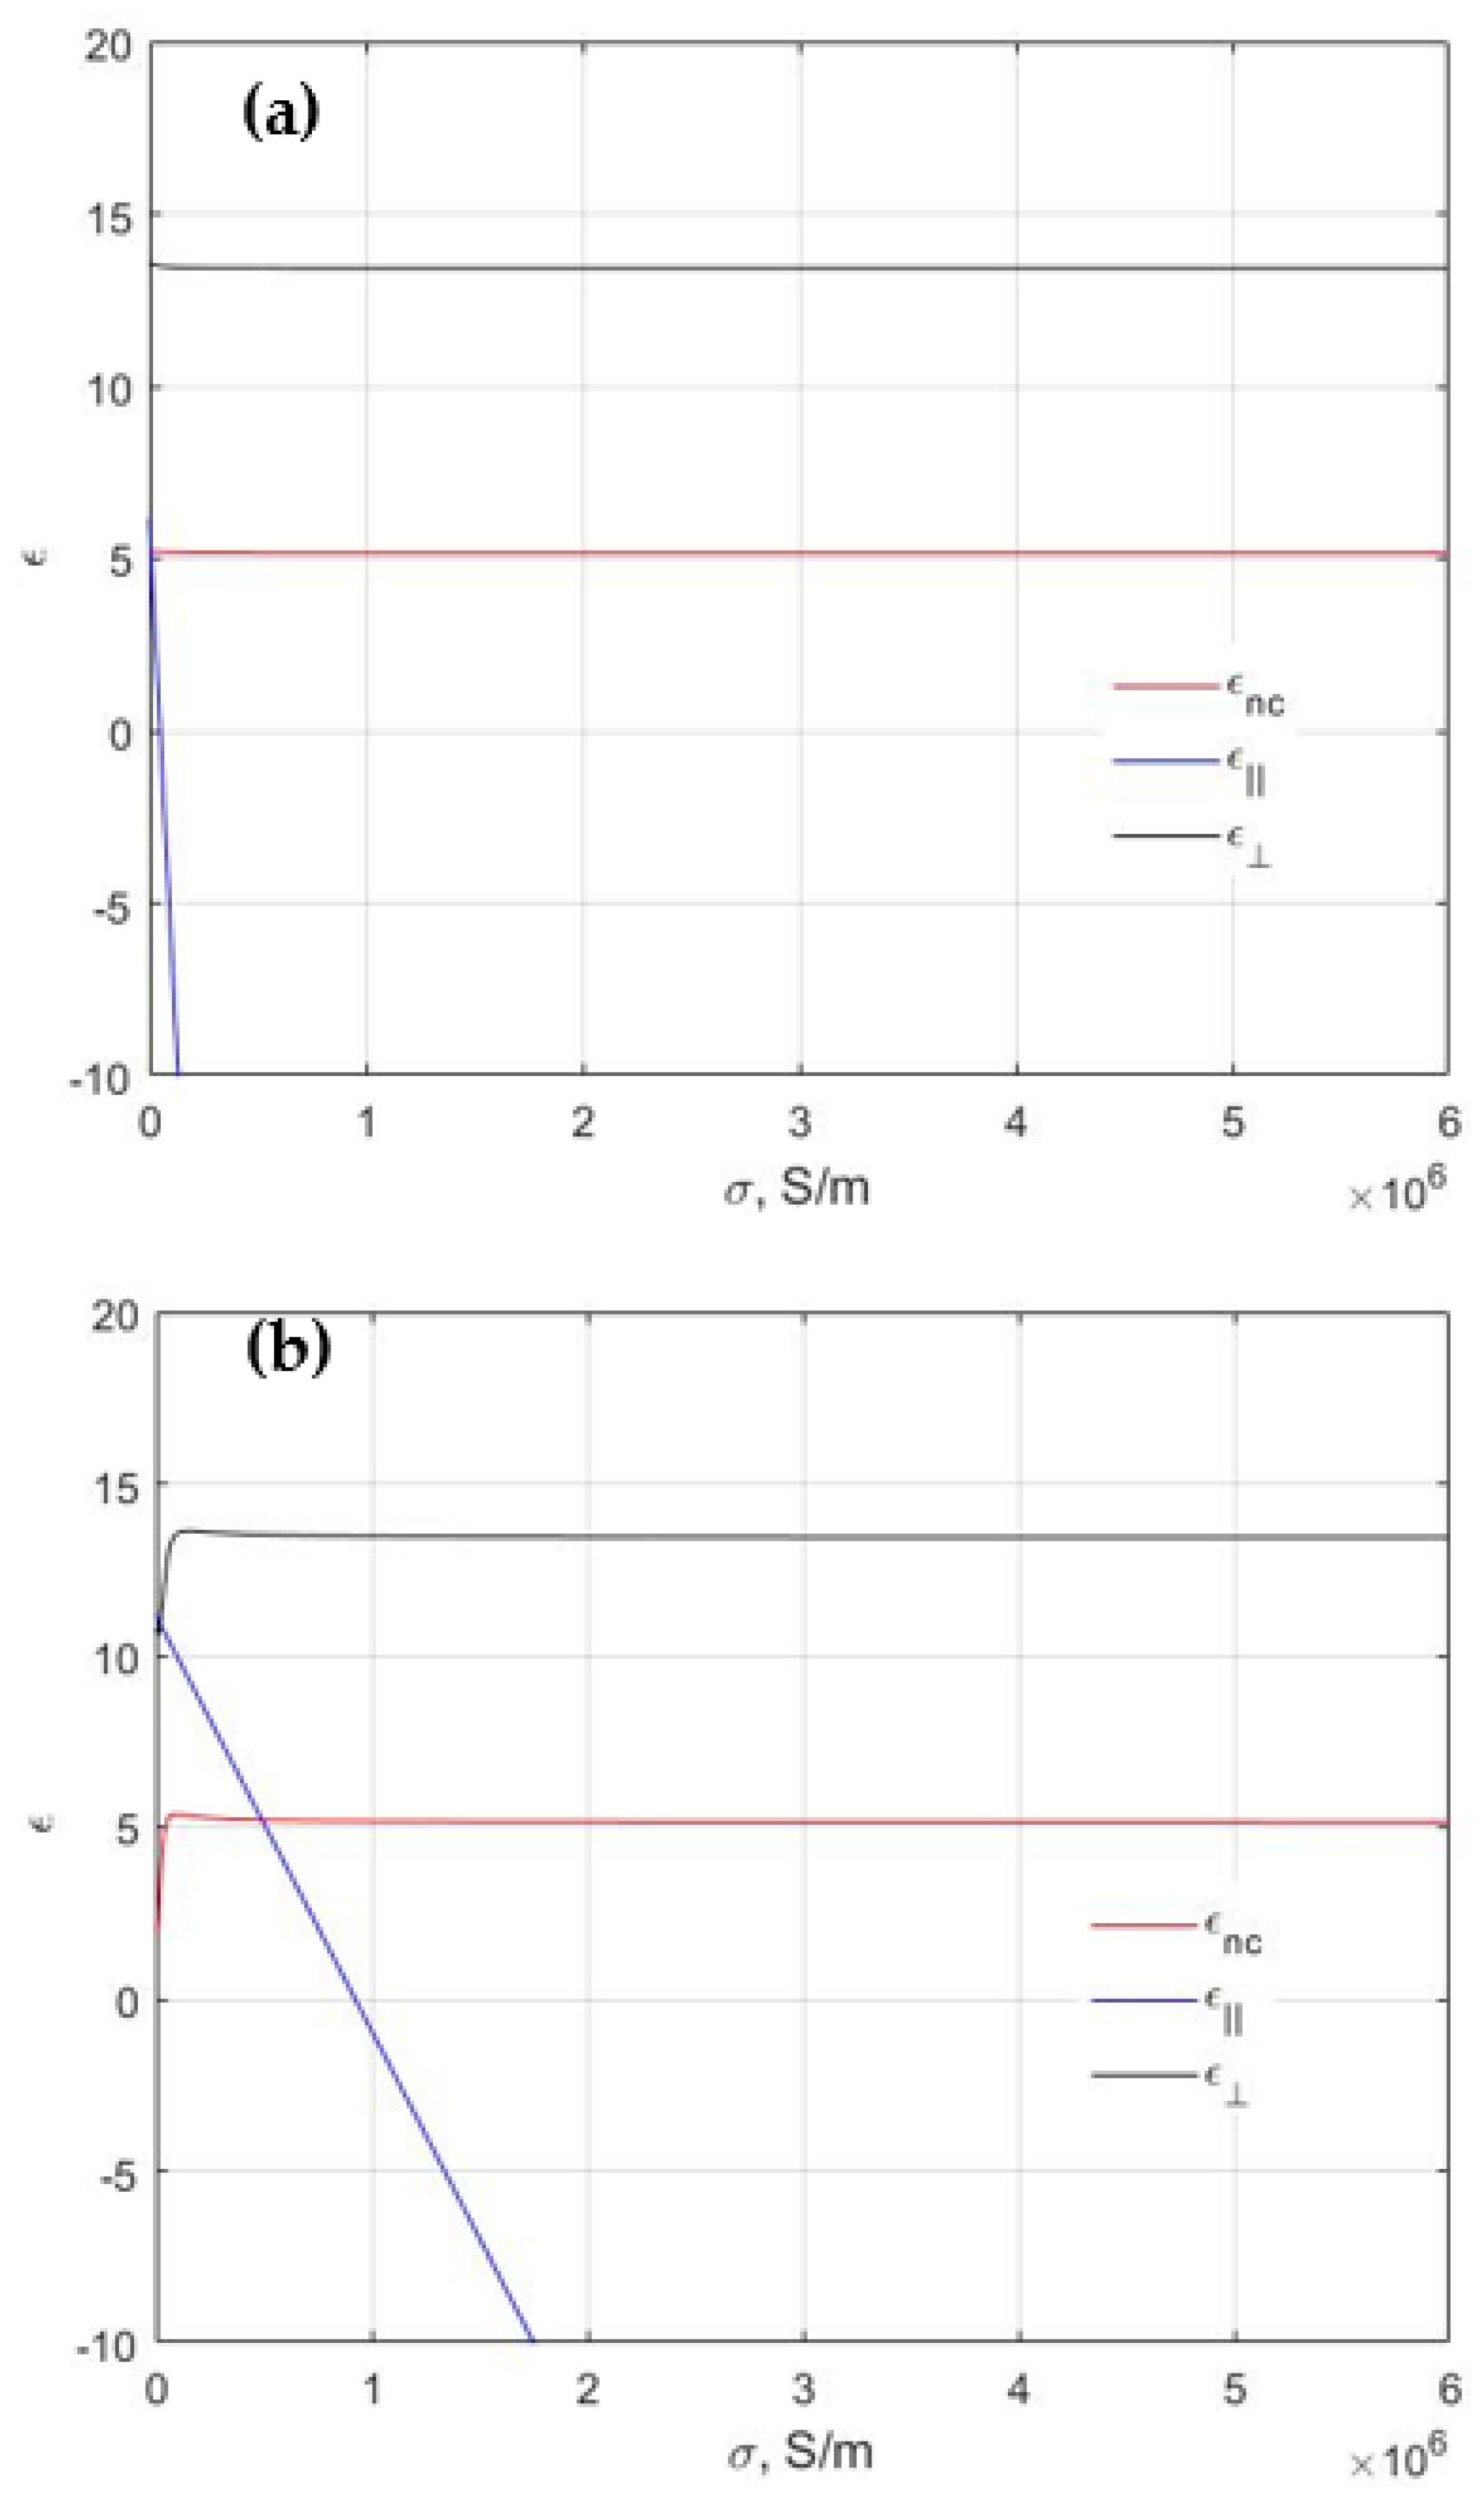
The propagation of SPPs at the boundary of nanocomposite and hypercrystal is investigated. The absolute value of complex conductivity | σ | varies from 0 to 6 × 10⁷ S/m. Herein, the permittivity components of a hypercrystal and nanocomposite versus frequency are studied numerically aiming to identify the frequency ranges of Dyakonov surface waves (DSWs) and SPP waves existence (Figure 2). In the frequency ranges below the frequency ω||0 [25] the semiconductor-dielectric metamaterial possesses hyperbolic properties. It is worthwhile noting that in this frequency range the presence of conventional surface plasmon polaritons waves with propagation parallel to the optical axis is feasible under specific conditions. One may conclude from Figure 2 that propagation of DSW is possible in case of ε n = 2.25 , ε d = 11.8 . It is worthwhile noting that the regime of DSW propagation takes place if ε | | ( ω ) , ε n c ( ω ) > 0 . To have a deeper insight into the problem, we investigated permittivity components versus conductivity. Doing so, in Figure 3 permittivity function is plotted if ω = 0.3 × 10¹⁴ Hz (Figure 3a) and ω = 3 × 10¹⁴ Hz (Figure 3b). The former allows us to investigate conductivity dependent permittivity functions for both regimes, i.e., hyperbolic and conventional. Moreover, we studied the phenomenon of conductivity dependent functions for the DSW regime (Figure 4a). Comparing Figure 3a and Figure 4a, one may conclude that ε n c ( σ ) > ε ( σ ) in case of the hyperbolic regime and ε n c ( σ ) < ε ( σ ) for DSW waves. Moreover, it is interesting to compare the conditions that are valid in case of hyperbolic and DSW regimes for both, i.e., frequency and conductivity dependent functions. Thus, it is seen in Figure 2a that hyperbolic properties of metamaterial are possible if ε n c ( ω ) , ε ( ω ) > 0 and ε | | ( ω ) < 0 . Dealing with the conductivity dependent functions, one may conclude that the same conditions are needed in other to obtain hyperbolic regime. On the contrary to the described case conditions for existence of DSW regime are different in two different planes, i.e., DSW is obtainable if ε n c ( ω ) , ε ( ω ) , ε | | ( ω ) > 0 and if ε n c ( σ ) , ε ( σ ) > 0 , ε | | ( σ ) < 0 .
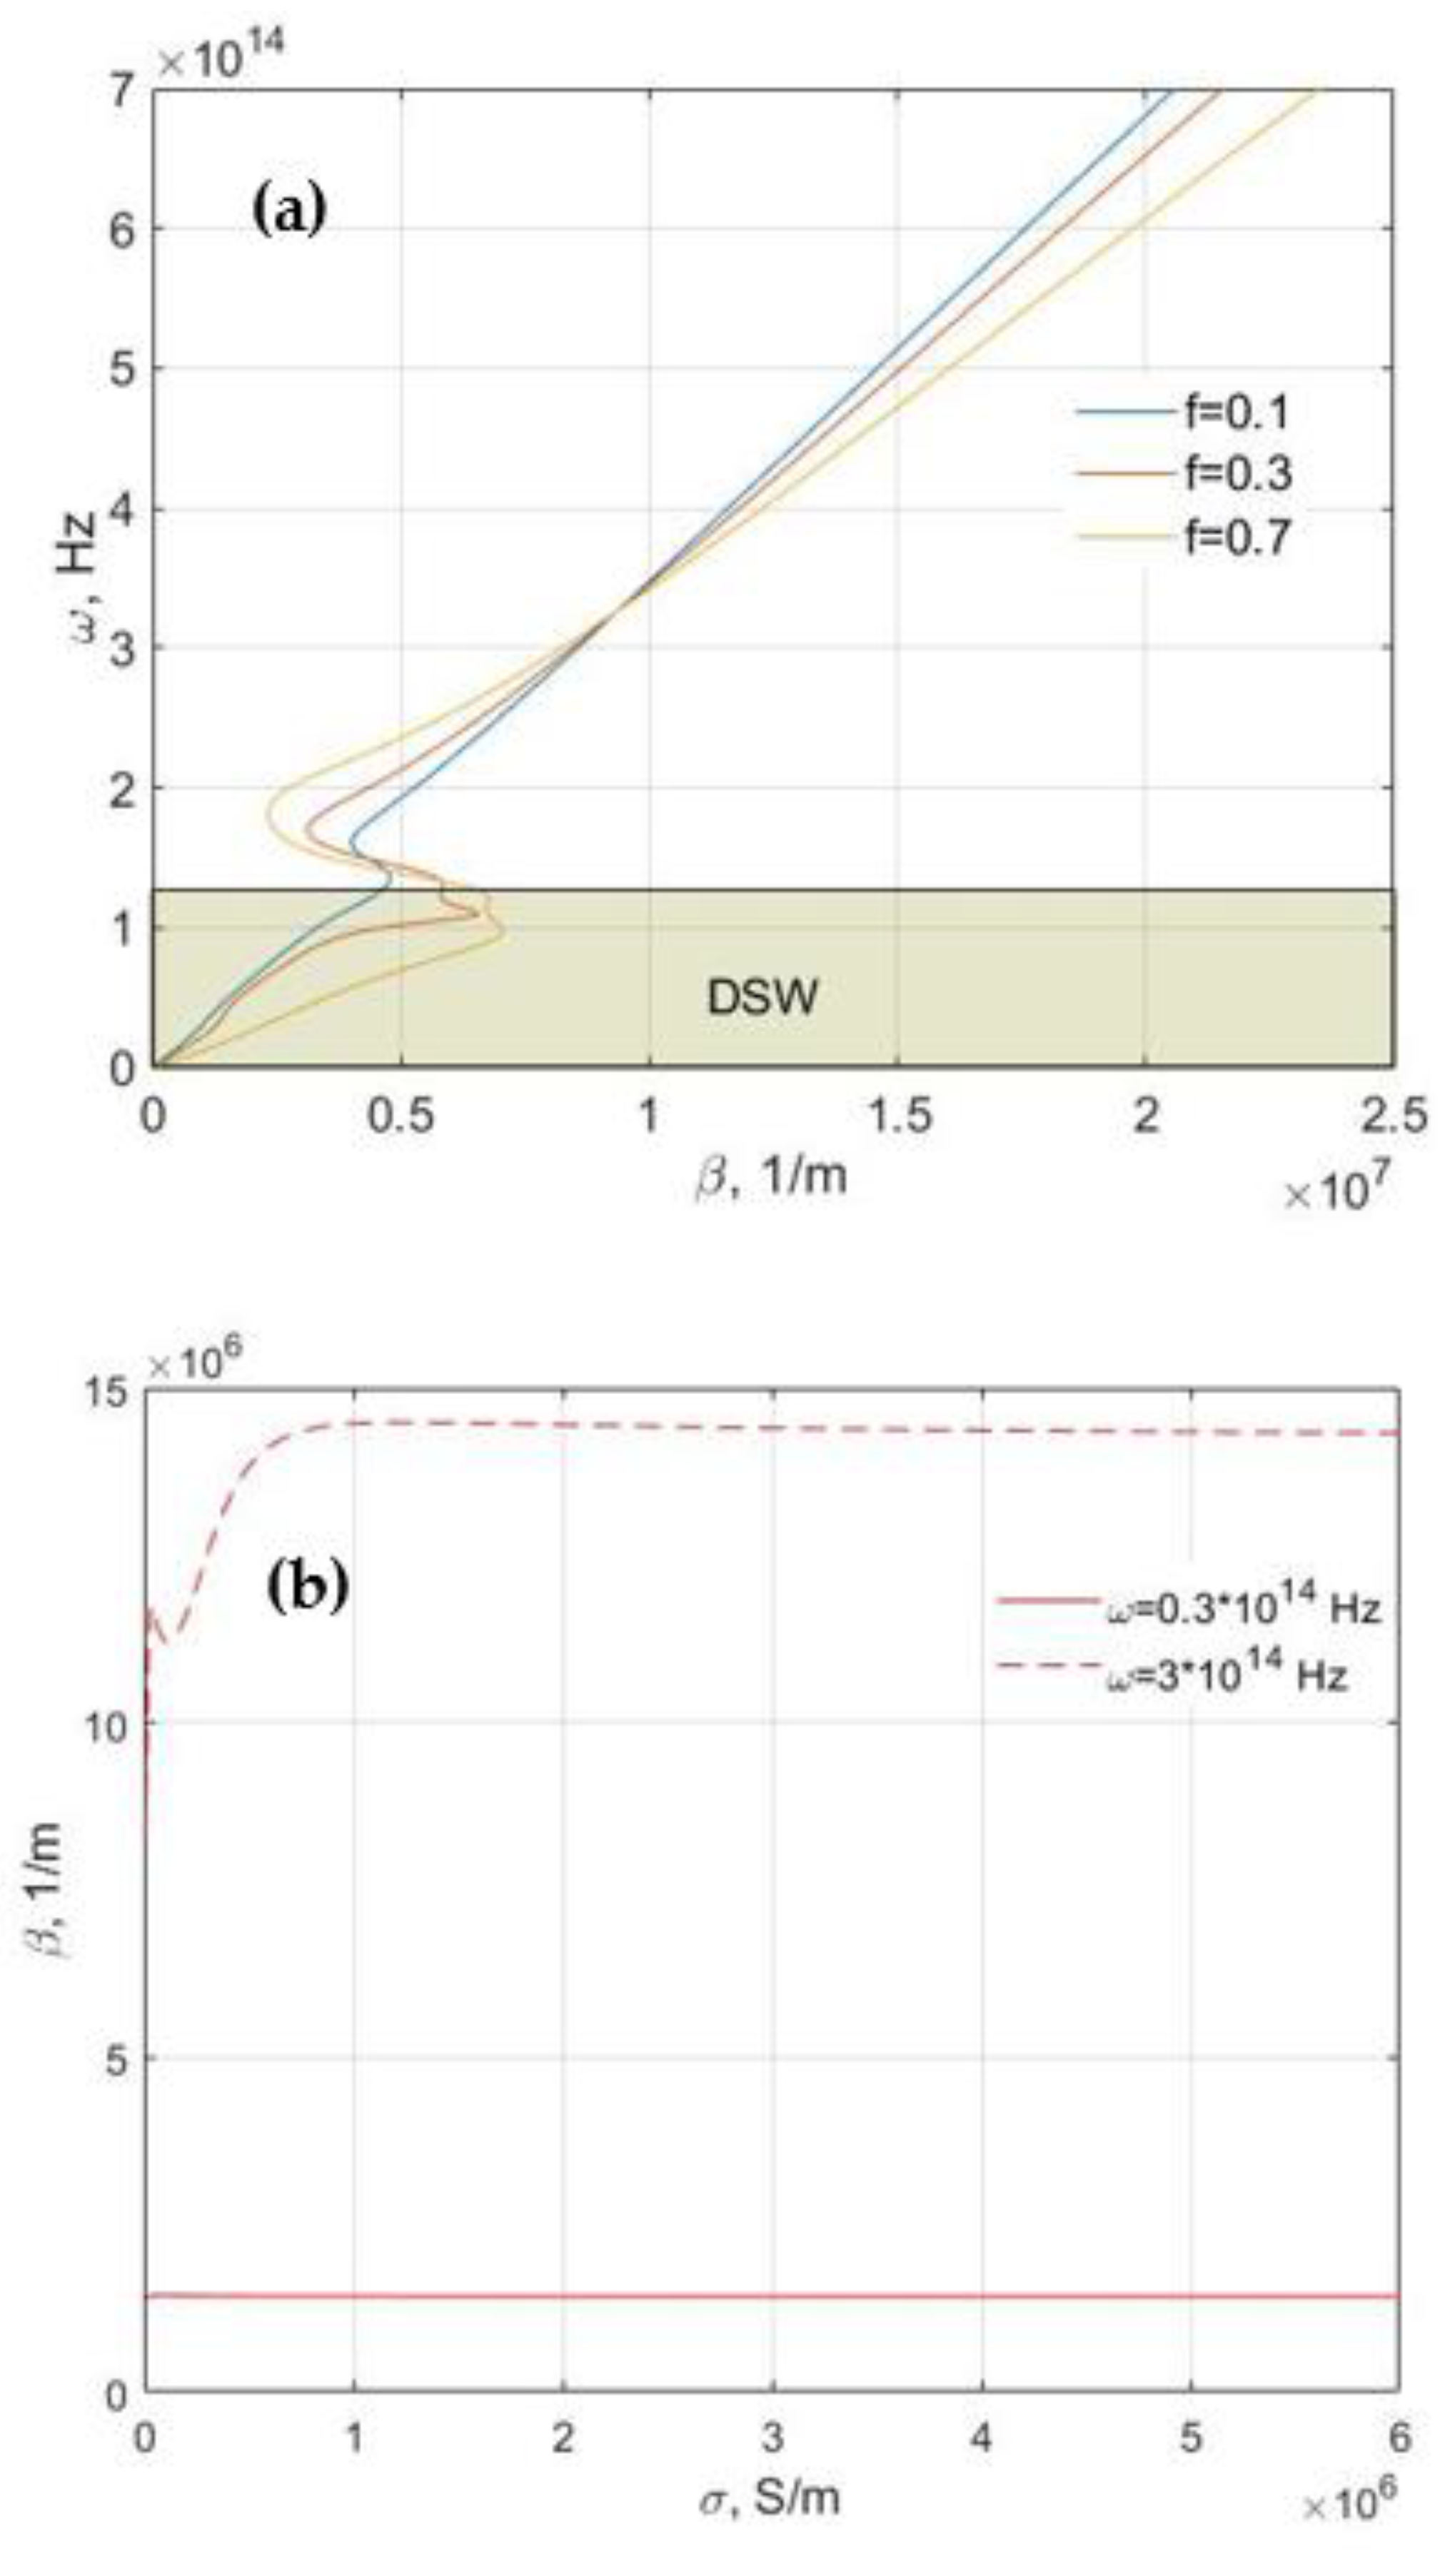
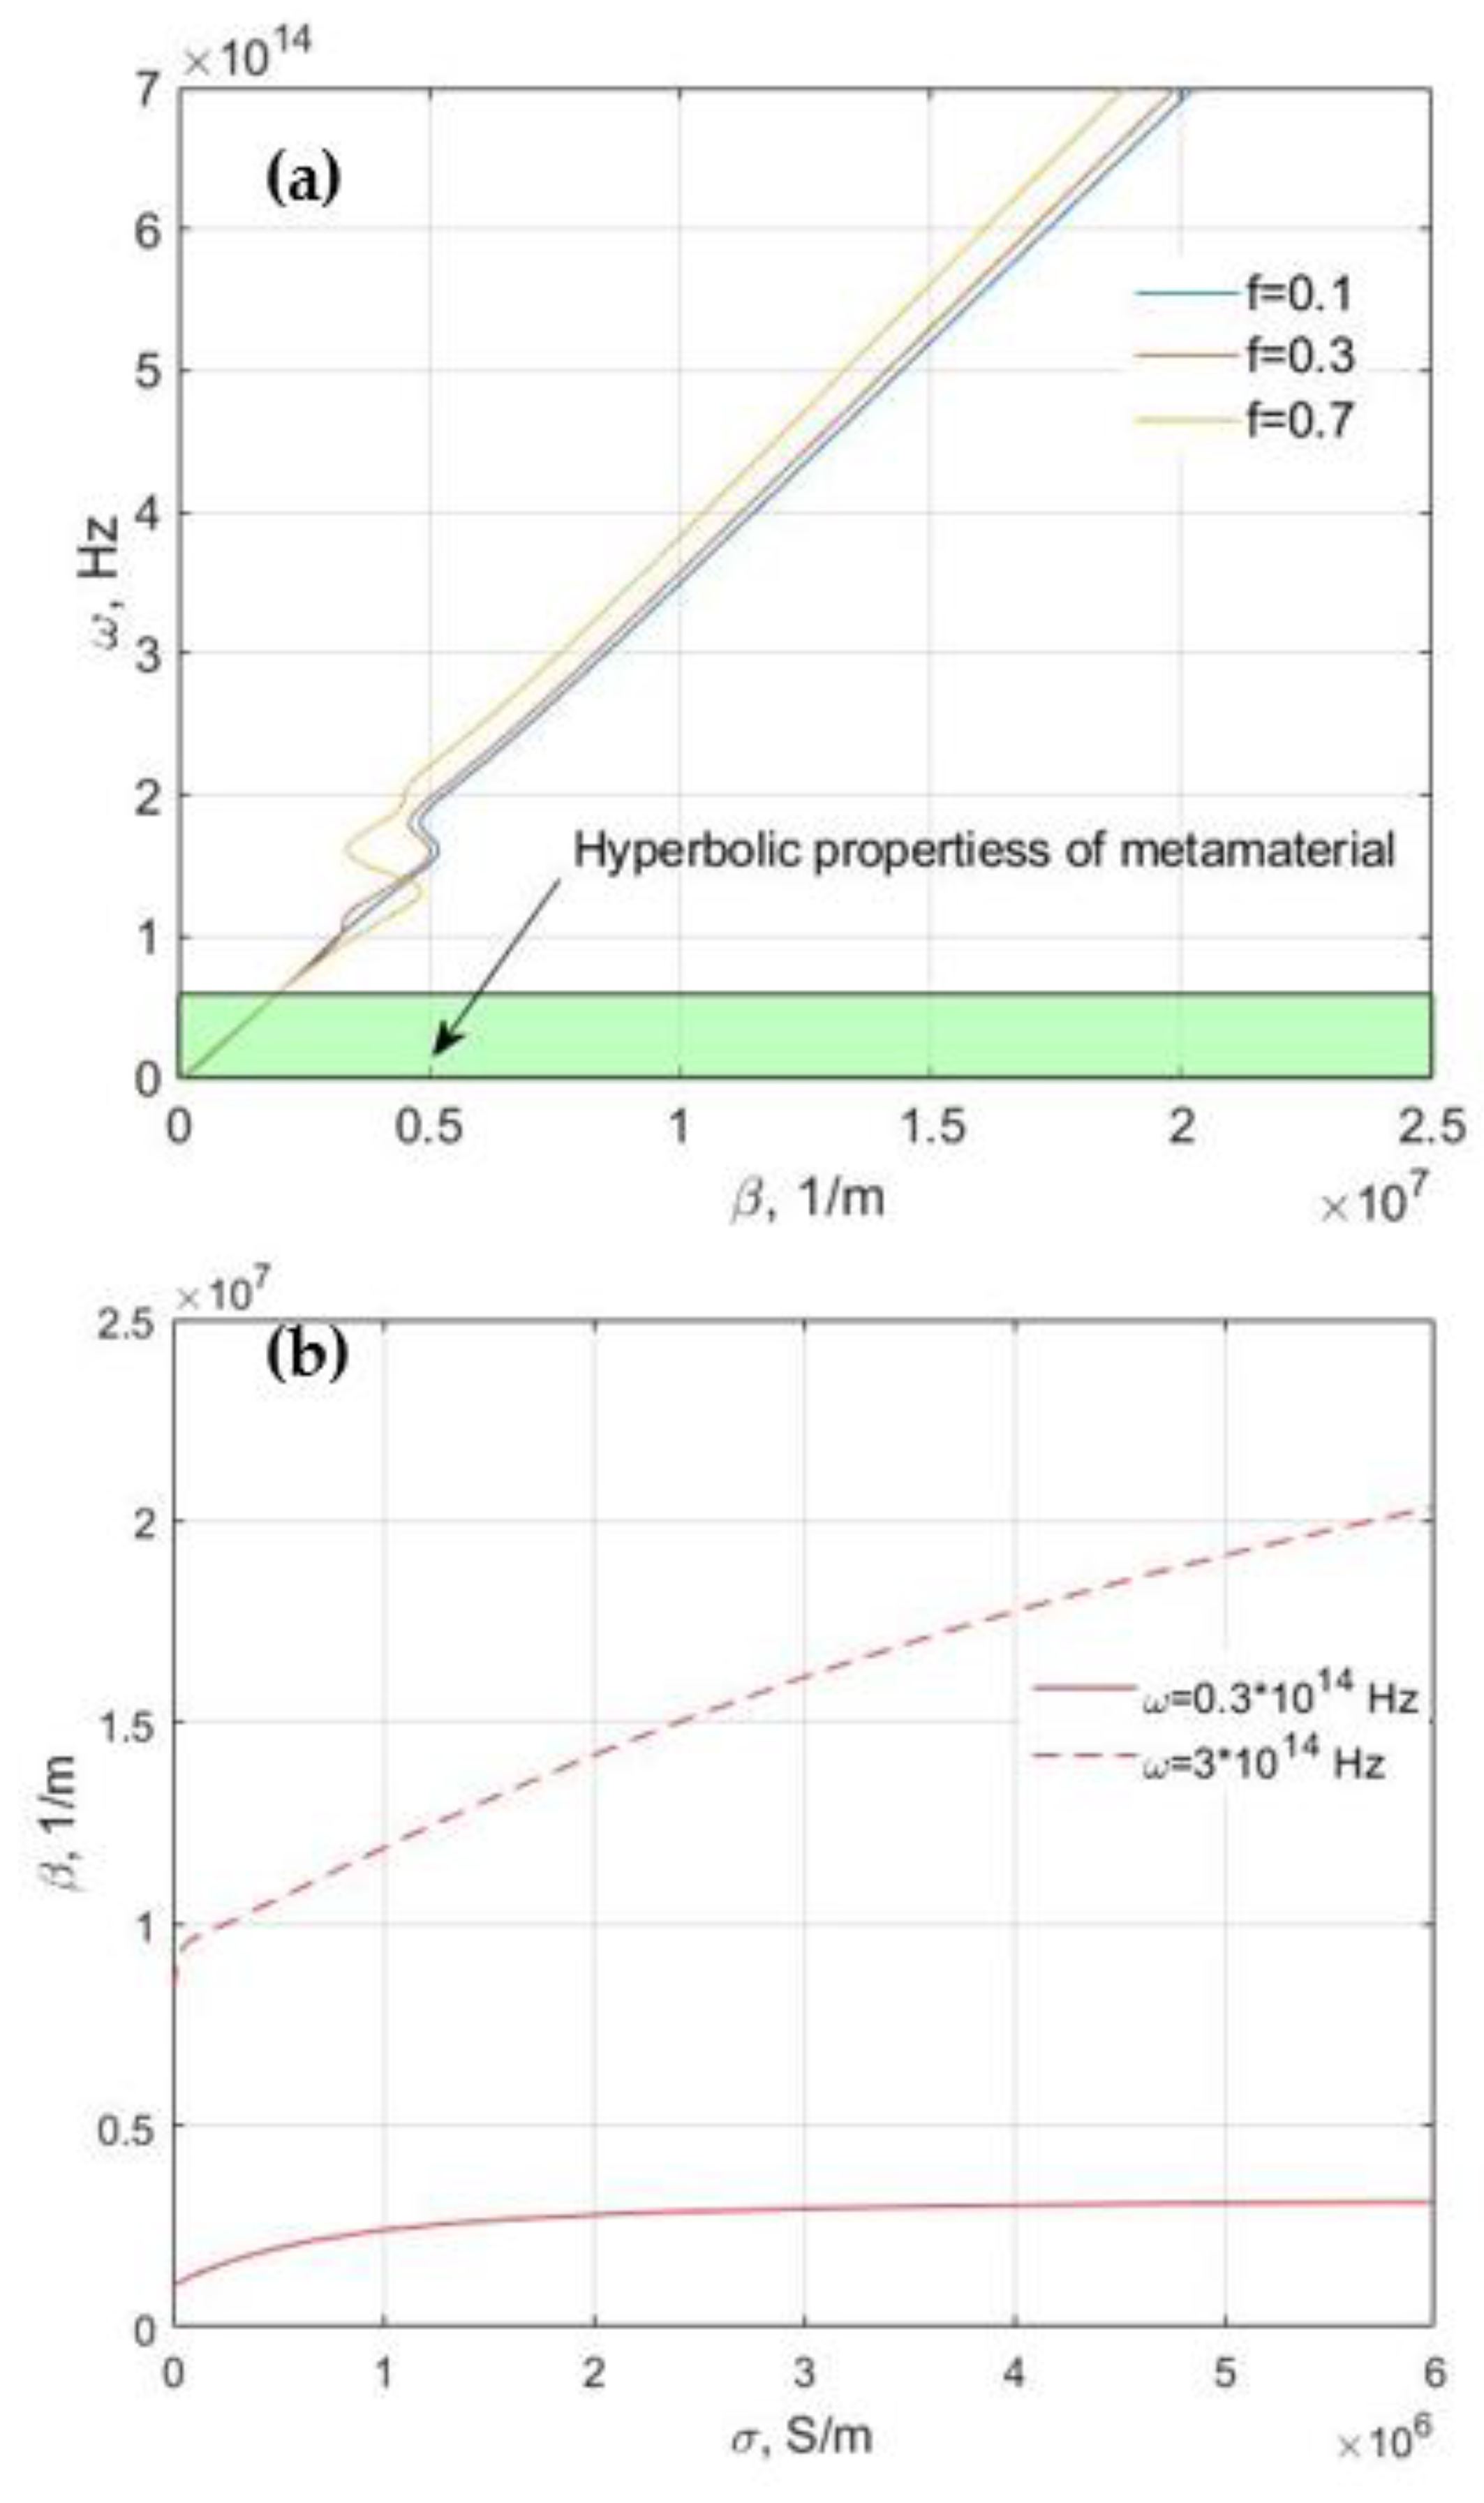
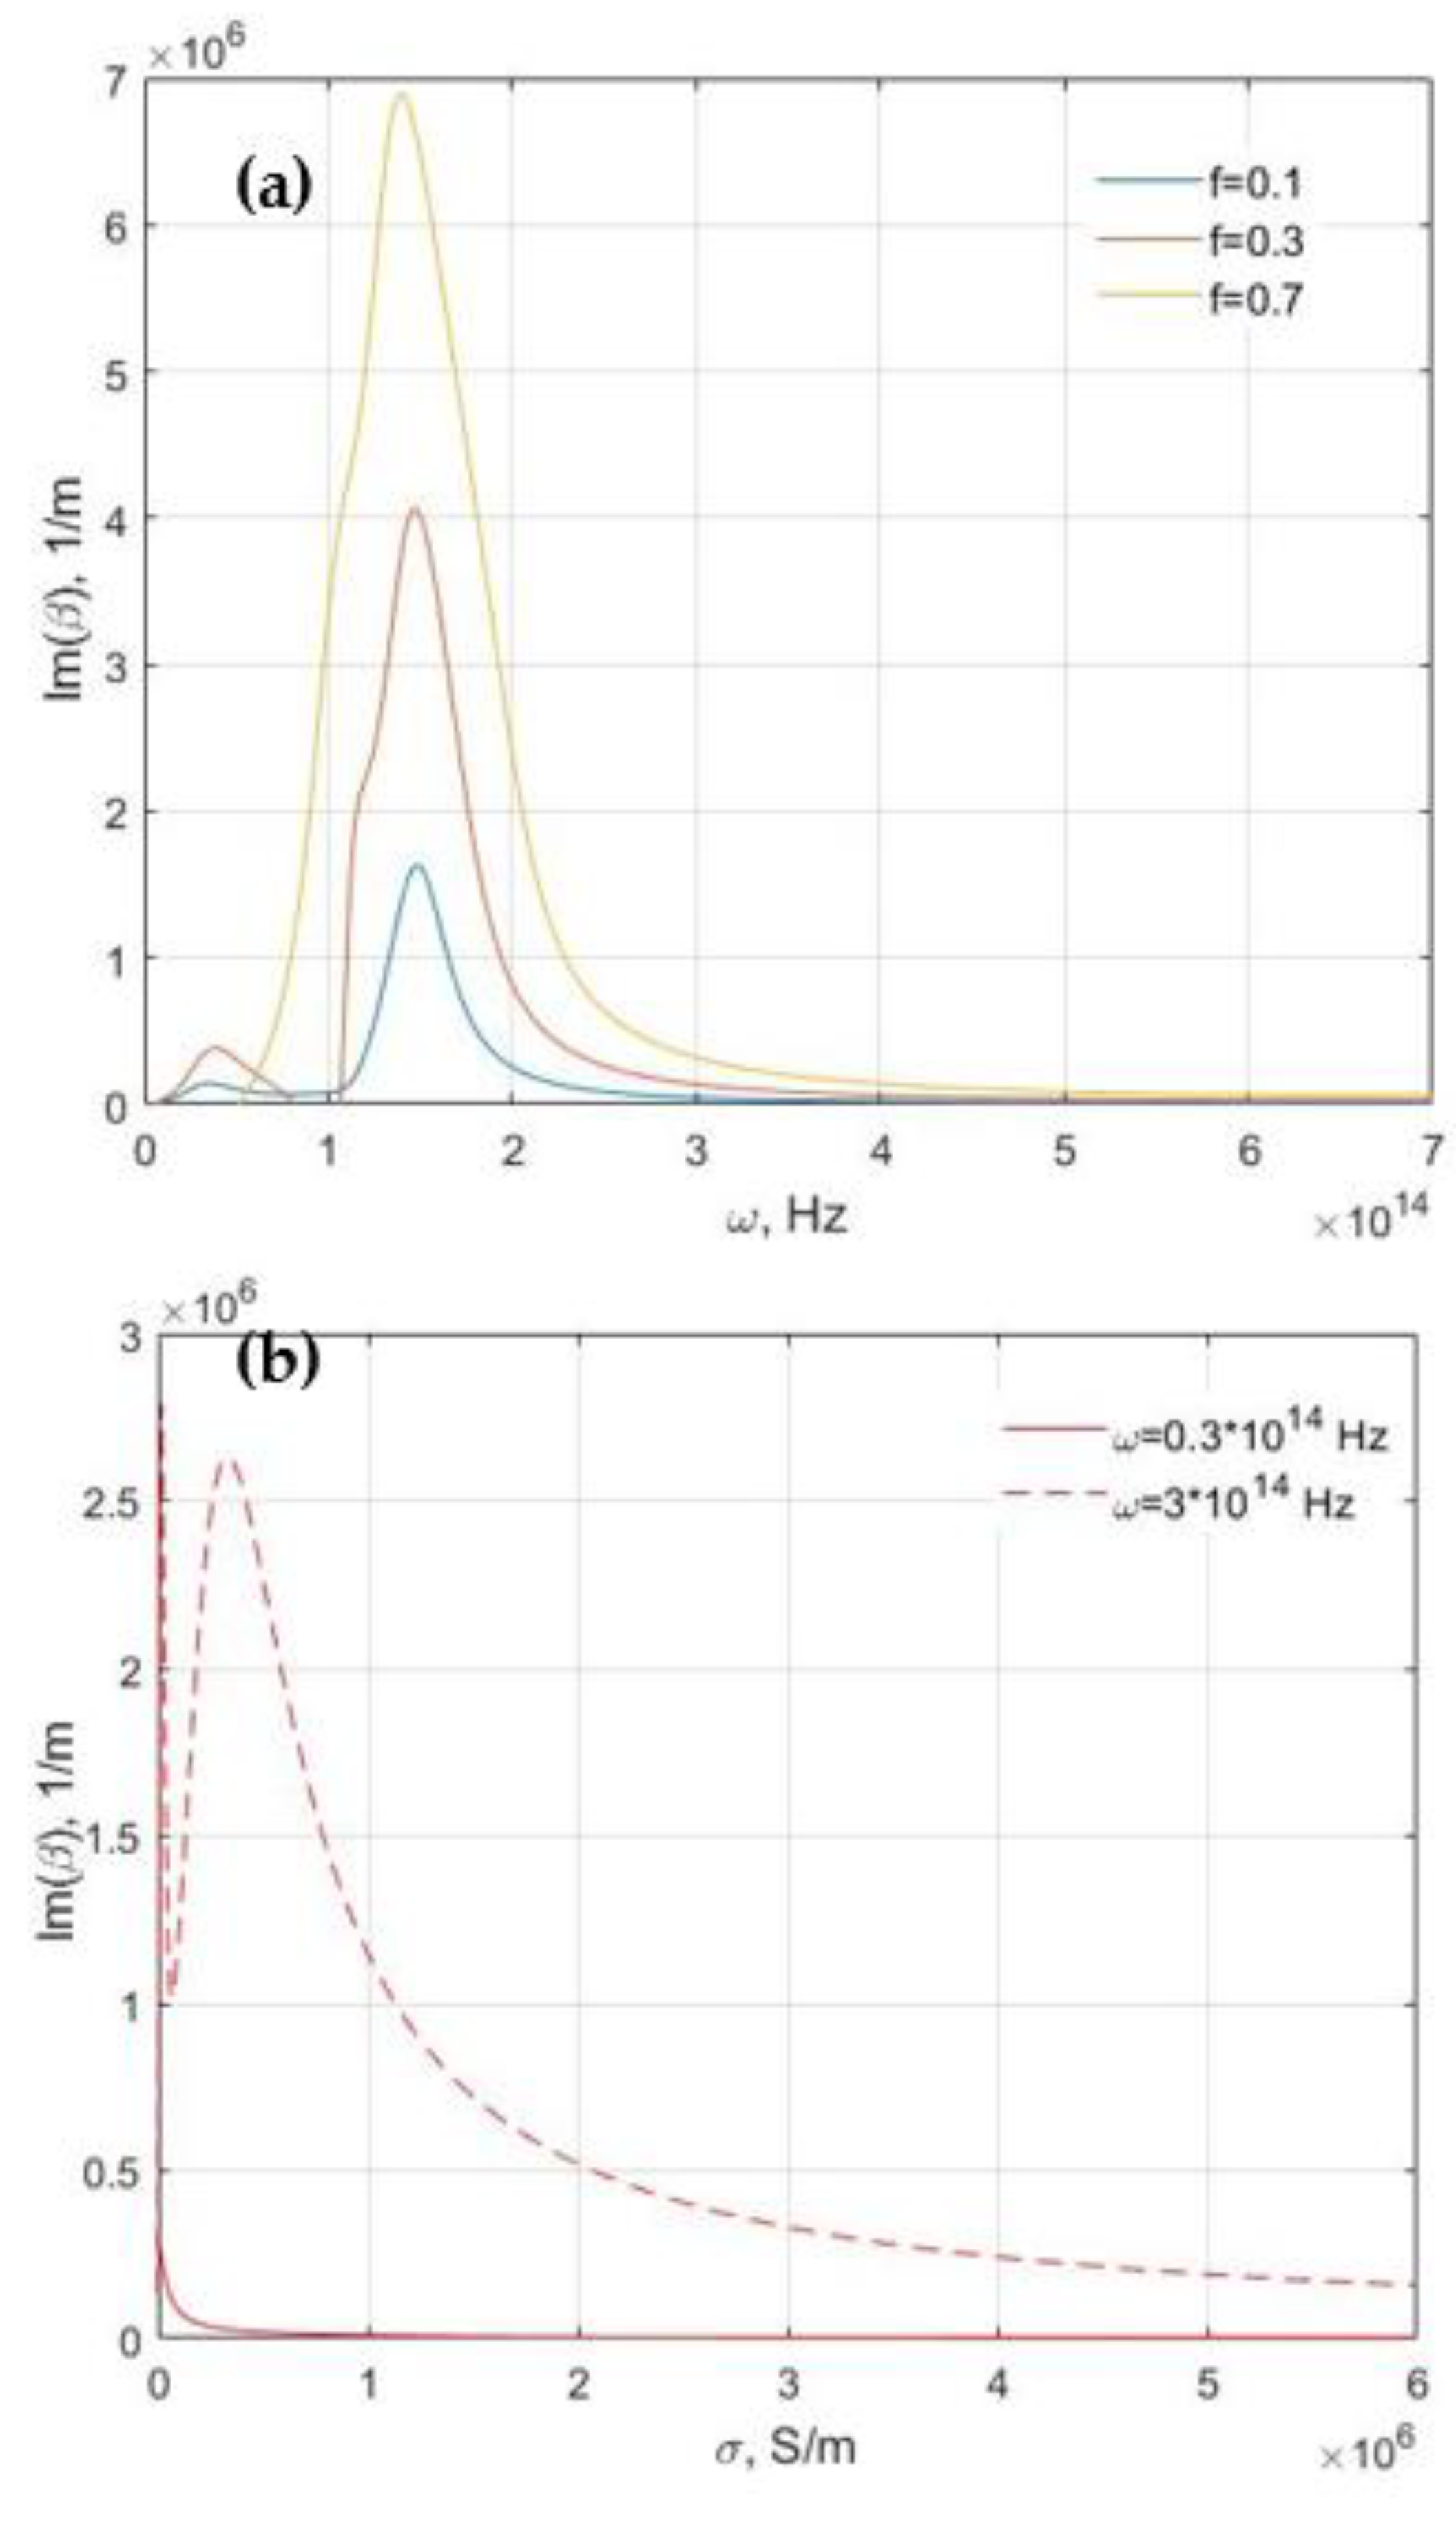
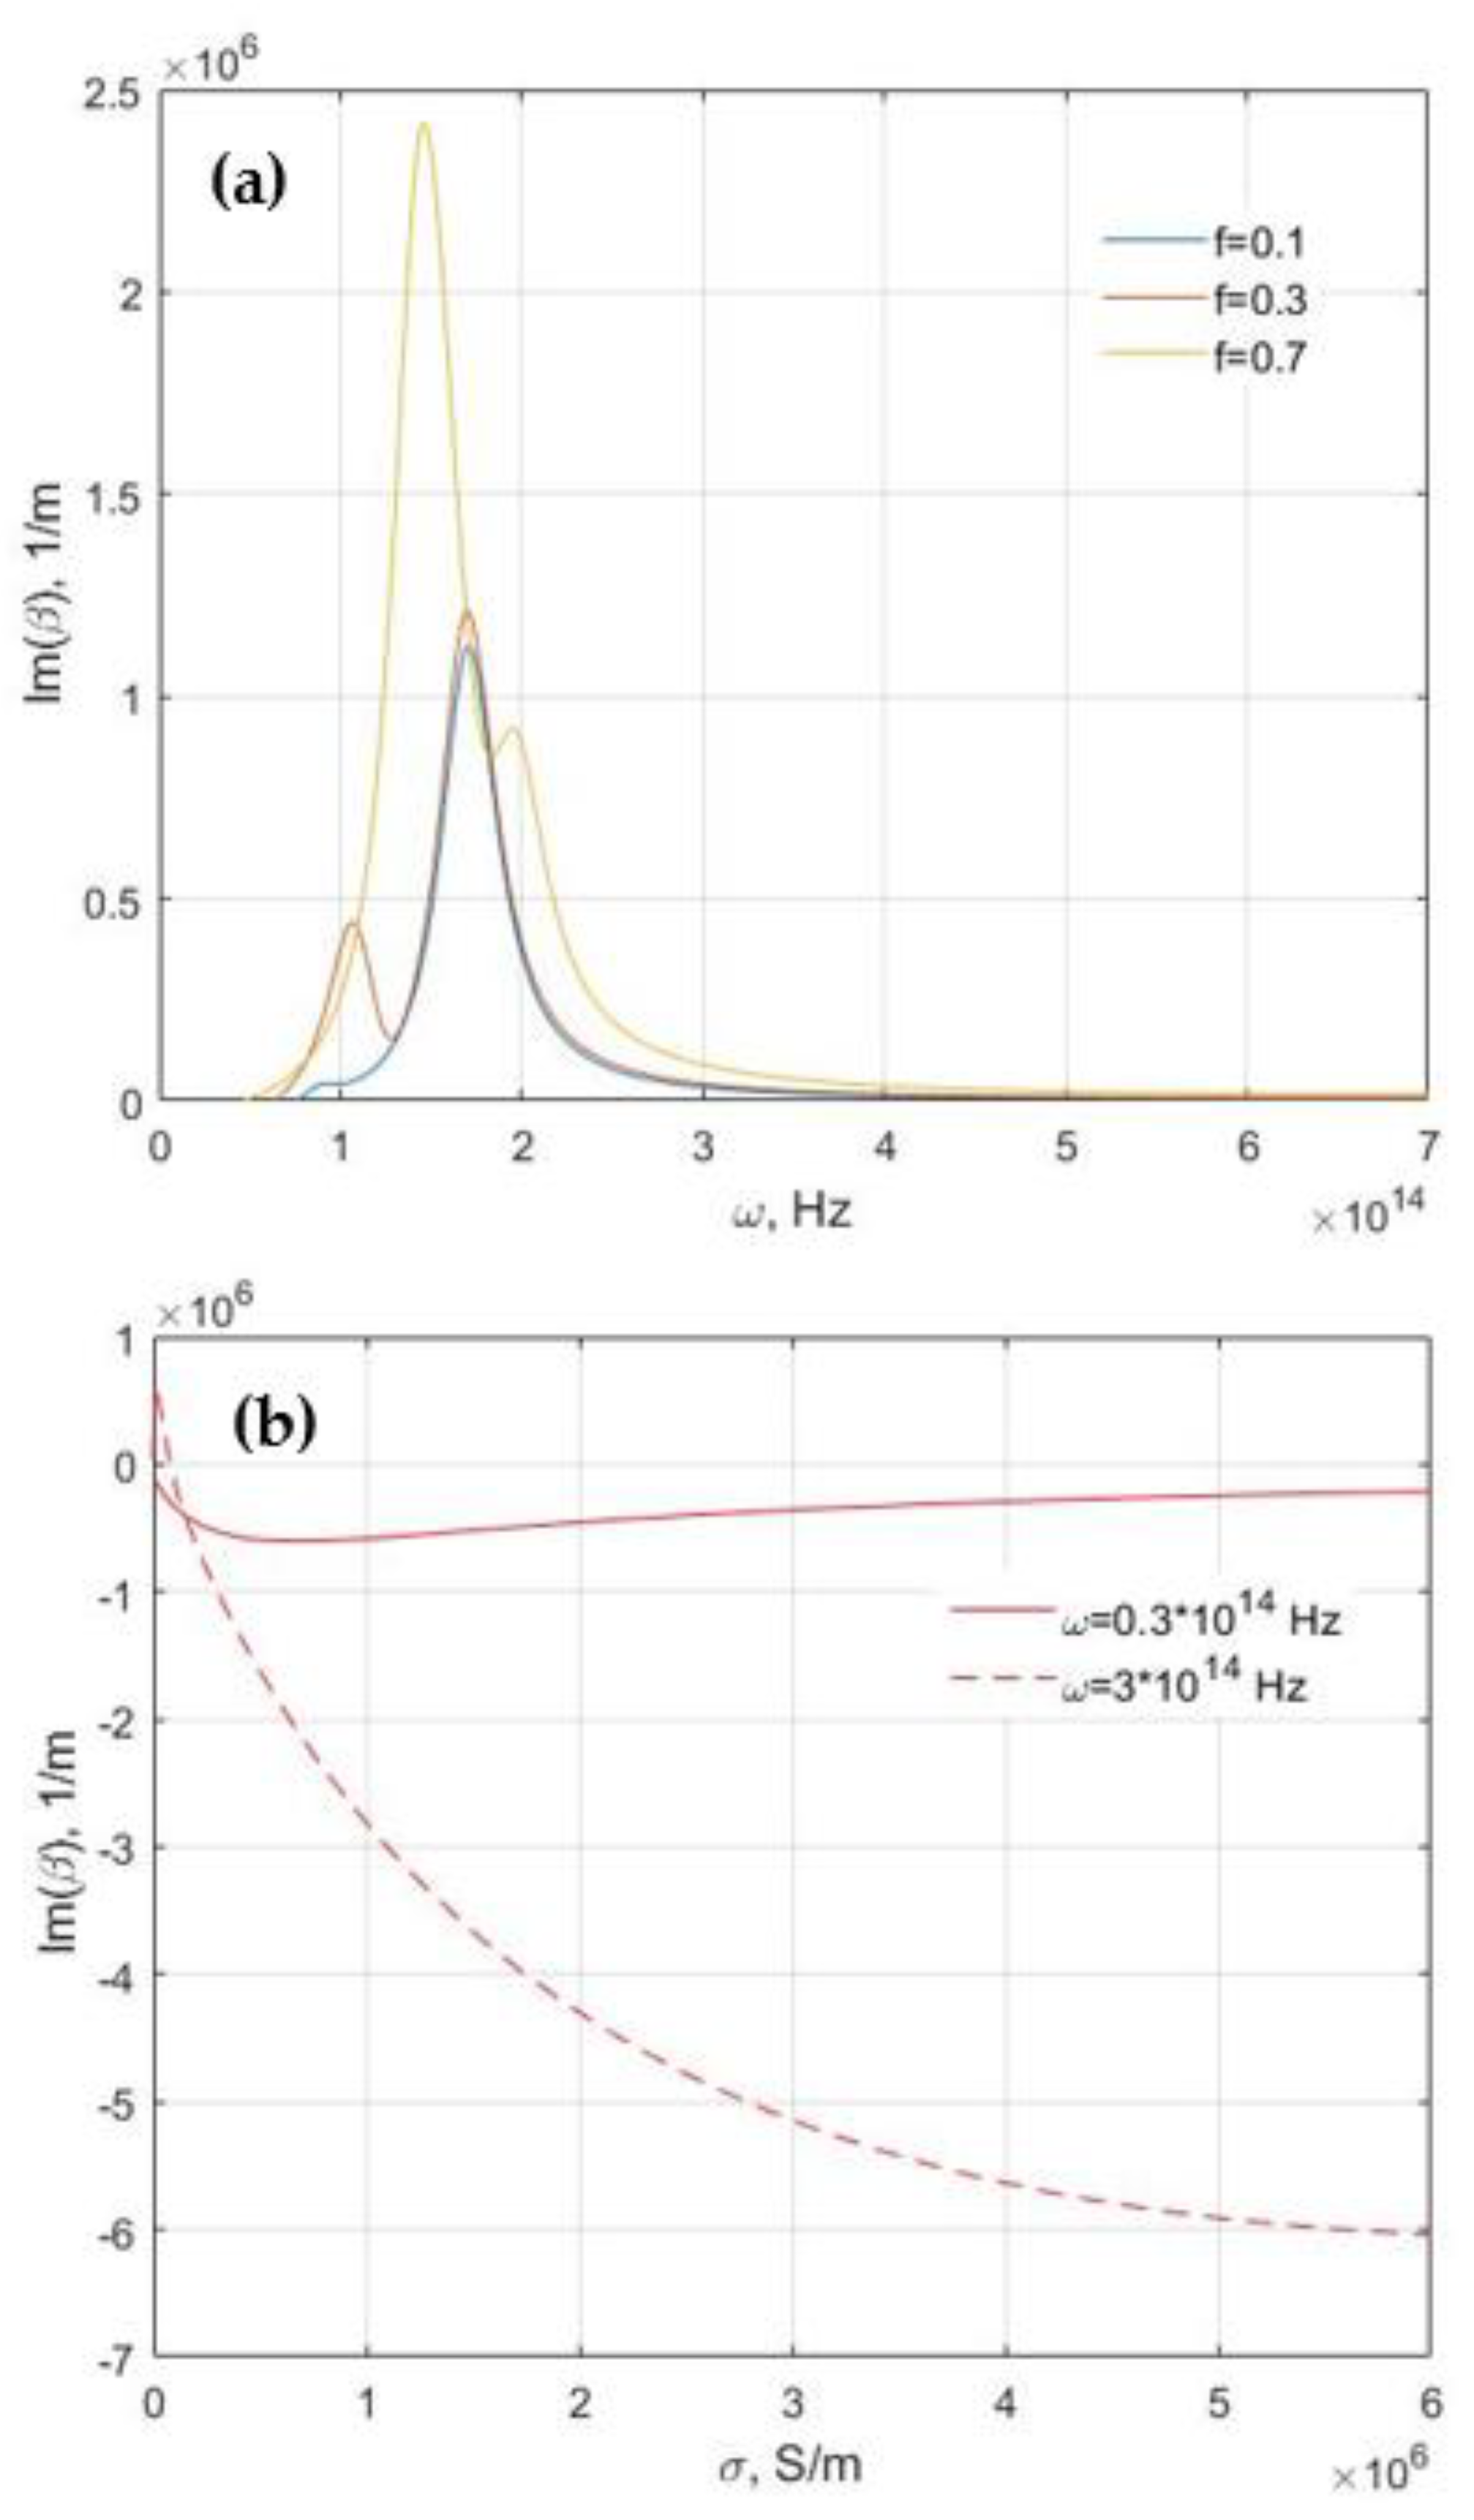
In Figure 5, Figure 6, Figure 7, Figure 8, Figure 9 and Figure 10 the plots are obtained for real and imaginary parts of the dispersion relation along with the transmittance characteristics. The real part of propagation constant is related to group velocity and the imaginary part is related to damping of SPPs. If Re(β) > k0 then SPPs propagate at the interface and if Re(β) < k0 then SPPs cannot propagate at the interface of two media. k0 = 2πω/c is the wave vector of the electromagnetic wave in free space. Here ω1 = 0.3 × 10¹⁴ Hz, ω2 = 0.3 × 10¹⁴ Hz and c = 3 × 10⁸ m/s, which gives k01 = 6.28 × 10⁵ 1/m and k02 = 6.28 × 10⁶ 1/m. The value of Re(β) varies from 0 to 15 × 106 1/m versus conductivity. The variations of Re(β) and Im(β) versus conductivity are shown in Figure 5, Figure 6, Figure 7, Figure 8, Figure 9 and Figure 10. The absolute value of complex conductivity strongly affects the SPPs propagation at the interface of two media. The real part of dispersion relation of SPPs increases with the absolute value of complex conductivity.
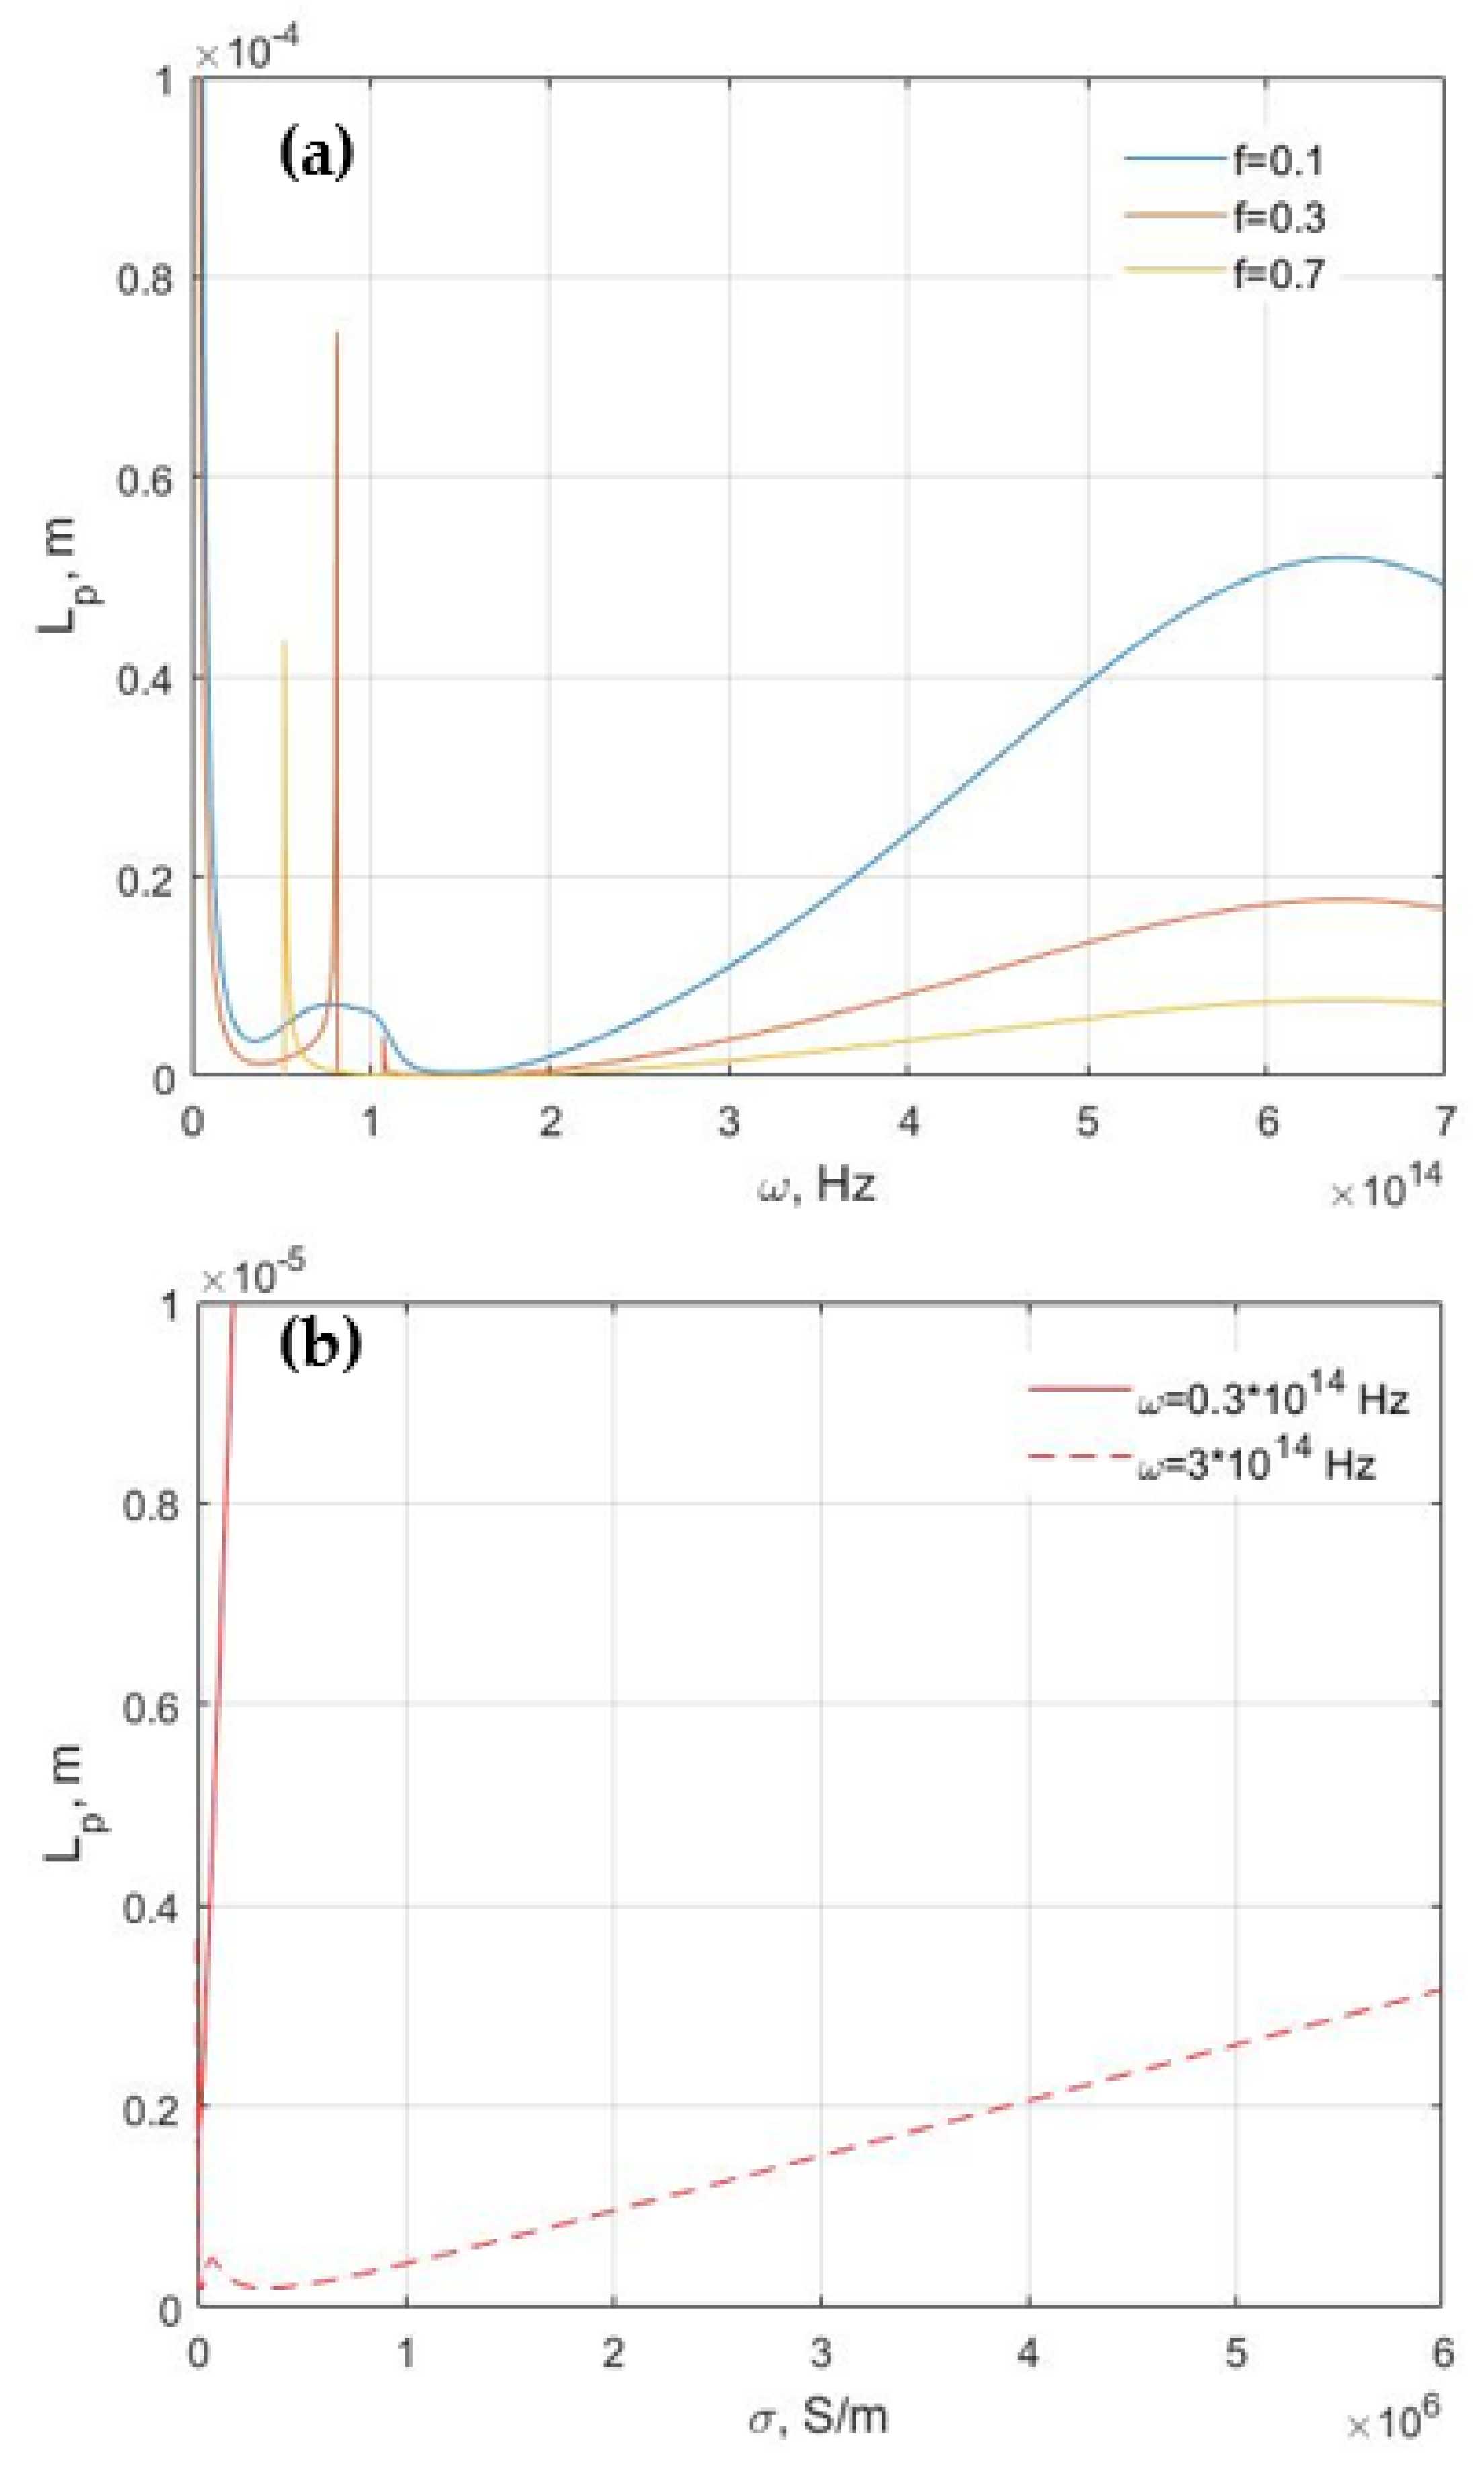
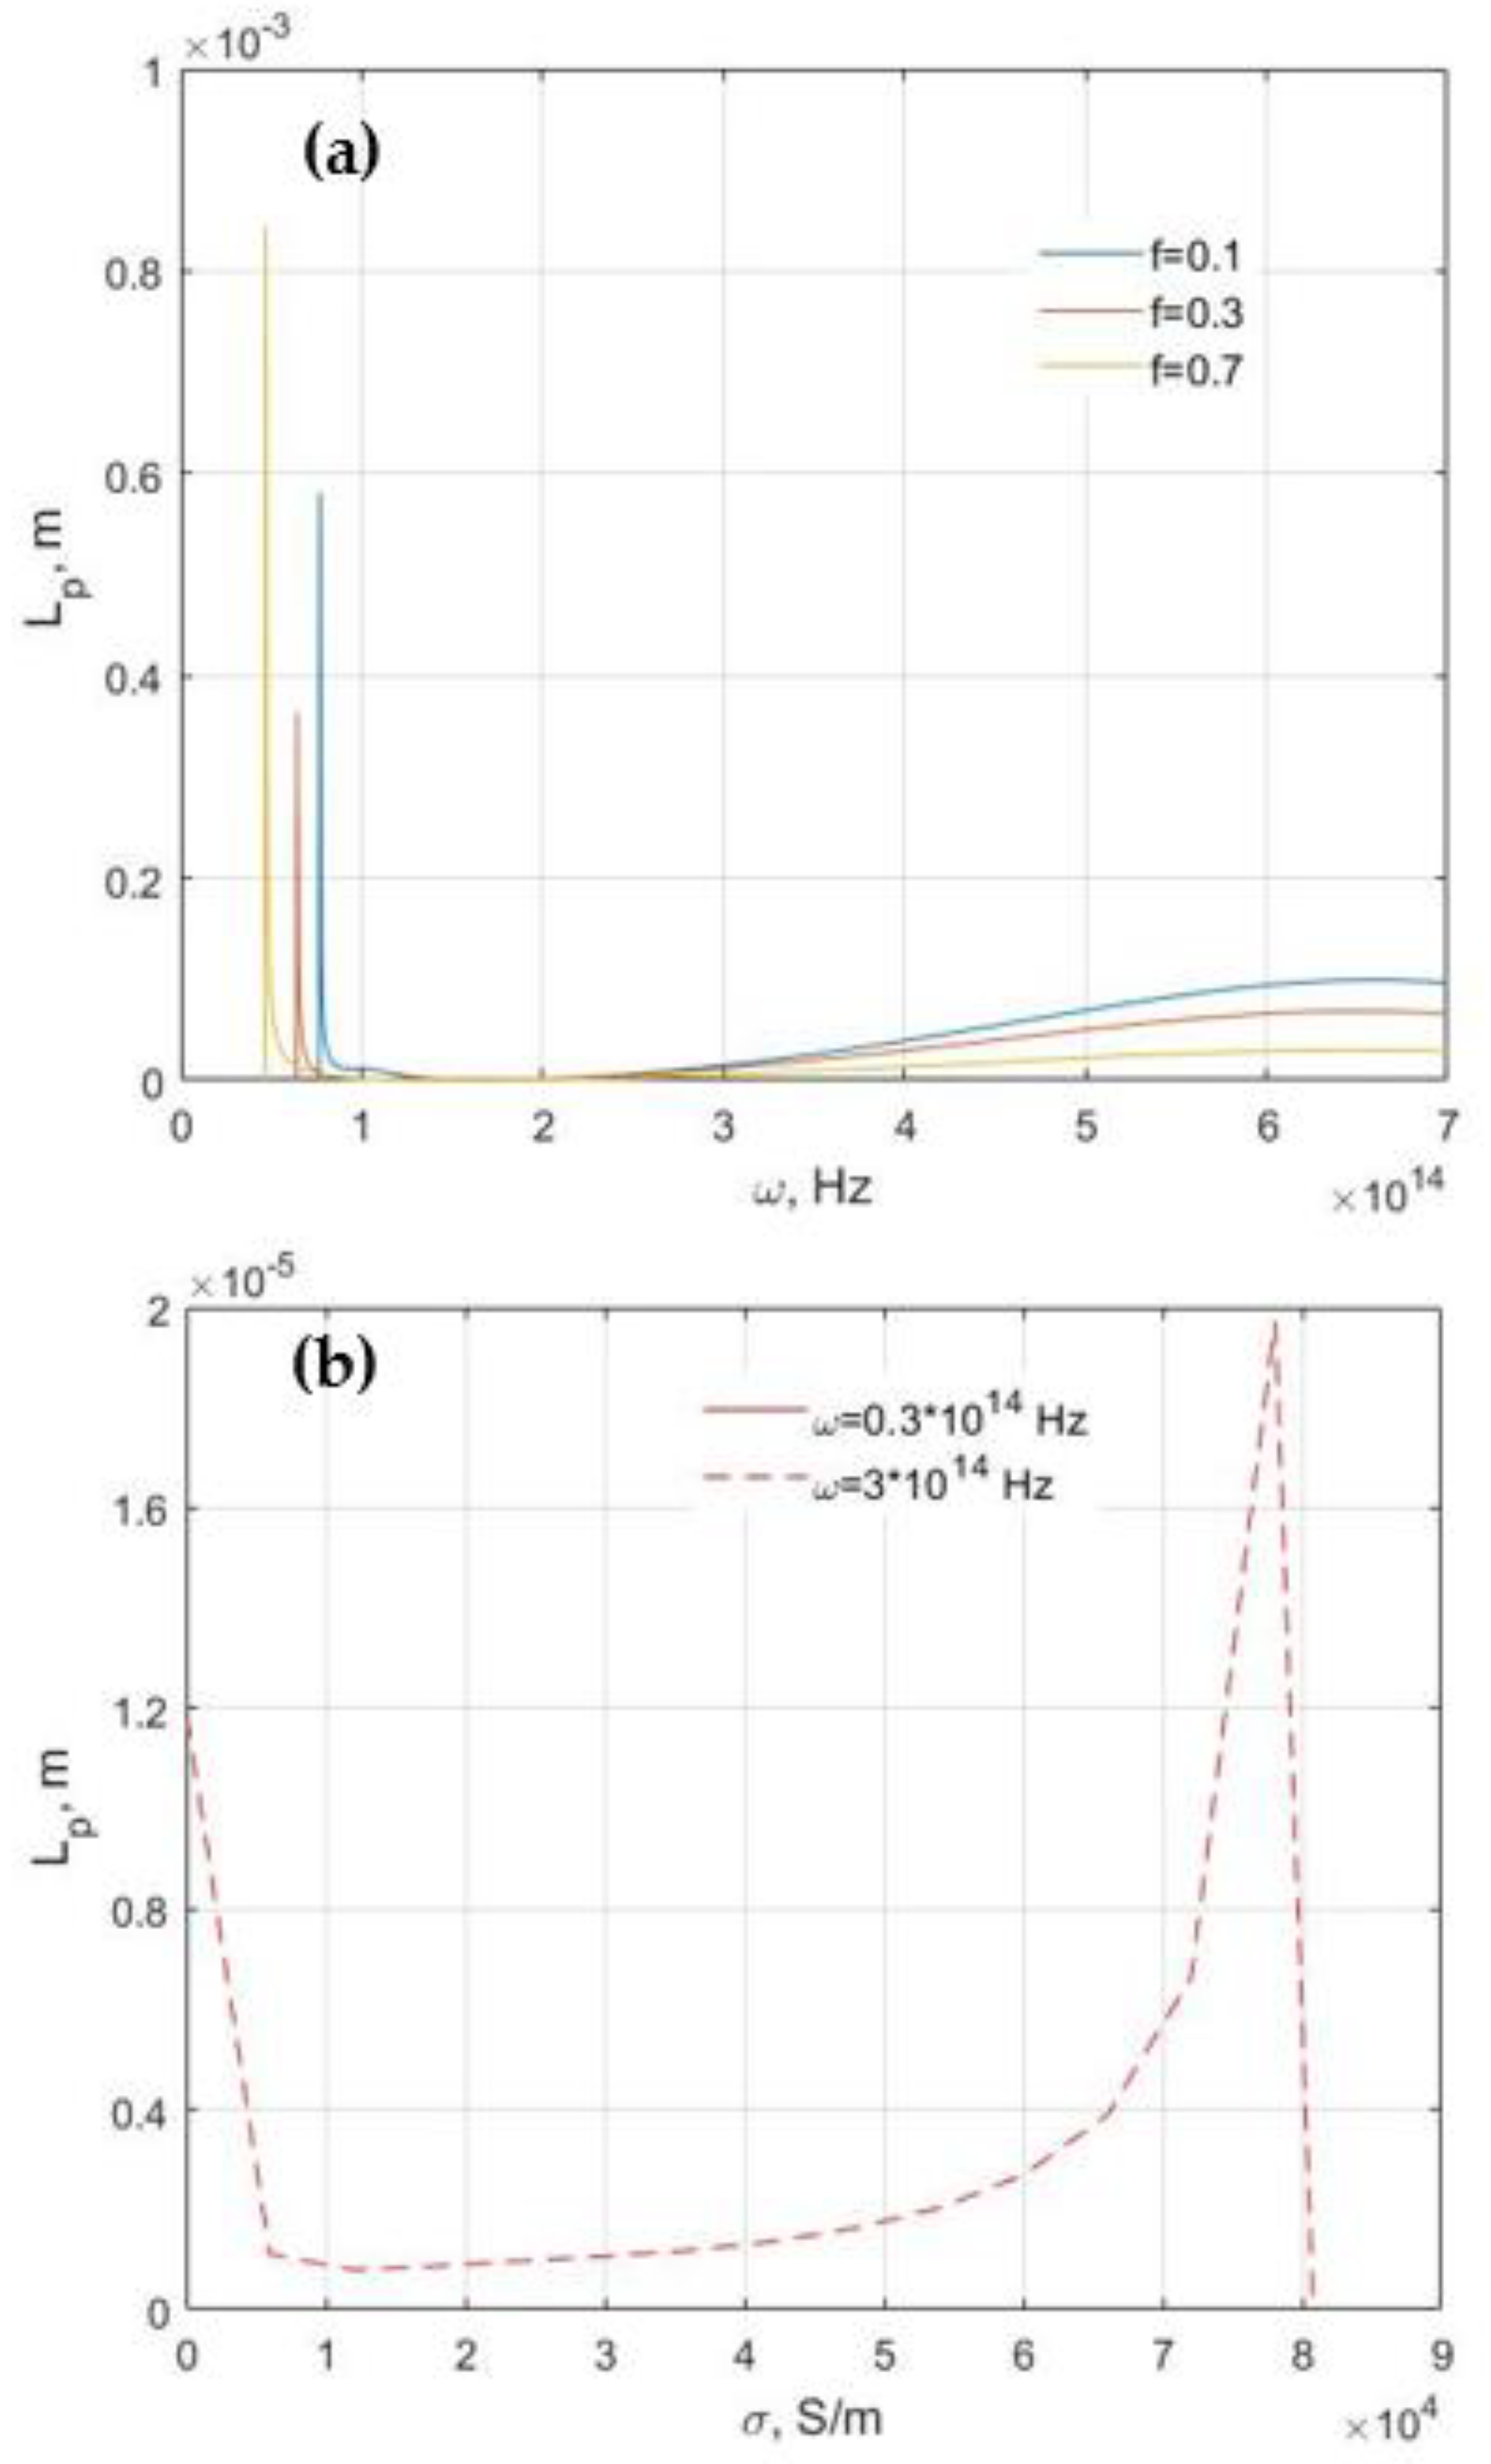
In Figure 9 and Figure 10 plots are obtained for the propagation length Lp of SPPs versus the absolute value of complex conductivity. The Im(β) is related to the propagation length Lp.

4. Conclusions

In conclusion, the SPPs properties were investigated versus conductivity at the interface of nanocomposite and hypercrystal. The amplitude of complex conductivity significantly influenced the SPPs propagation. The real part of SPPs dispersion relation was very large in comparison with the value of the free space wave-vector Re(β) > k0. It is worthwhile mentioning that propagation of SPPs was achieved at the interface with variation of complex conductivity. The conducted study allows one to conclude on the conditions of surface waves propagation in the complex conductivity plane. Thus, ε n c ( σ ) , ε ( σ ) > 0 and ε | | ( σ ) < 0 in the case of hyperbolic regime and ε n c ( σ ) , ε ( σ ) > 0 , ε | | ( σ ) < 0 for Dyakonov surface waves. The potential applications of this works are in the fields of the development of waveguides sources, near-field optics, surface-enhanced Raman spectroscopy, data storage, solar cells, chemical sensors and biosensors.

Author Contributions

Conceptualization, T.I. and T.G.; methodology, T.I.; software, T.G.; validation, T.G. and E.R.; formal analysis, E.R.; investigation, T.I.; resources, E.R.; data curation, T.G.; writing—original draft preparation, T.I.; writing—review and editing, T.G. and E.R.; visualization, T.I.; supervision, T.G.; project administration, E.R.; funding acquisition, T.G. and E.R. All authors have read and agreed to the published version of the manuscript.

Funding

This project has received funding from the European Union’s Horizon 2020 research and innovation program under the Marie Sklodowska Curie grant agreement No 713694 and from Engineering and Physical Sciences Research Council (EPSRC) (Grant No. EP/R024898/1). The work of E.U. Rafailov was partially funded by the Ministry of Science and Higher Education of the Russian Federation as part of World-class Research Center program: Advanced Digital Technologies (contract No. 075-15-2020-934 dated 17.11.2020).

Institutional Review Board Statement

Not applicable.

Informed Consent Statement

Not applicable.

Conflicts of Interest

The authors declare no conflict of interest.

References

  1. Kneipp, K. Surface-enhanced Raman scattering. Phys. Today 2007, 60, 40–45. [Google Scholar] [CrossRef] [Green Version]
  2. Juan, M.L.; Righini, M.; Quidant, R. Plasmon nanooptical tweezers. Nat. Photonics 2011, 5, 349. [Google Scholar] [CrossRef]
  3. Pendry, J.B. Negative refraction makes a perfect lens. Phys. Rev. Lett. 2000, 85, 3966–3969. [Google Scholar] [CrossRef] [PubMed]
  4. Luo, Y.; Aubry, A.; Pendry, J.B. Electromagnetic contribution to surface-enhanced Raman scattering from rough metal surfaces: A transformation optics approach. Phys. Rev. B Condens. Matter Mater. Phys. 2011, 83, 155422. [Google Scholar] [CrossRef] [Green Version]
  5. Li, J.; Ye, J.; Chen, C.; Hermans, L.; Verellen, N.; Ryken, J.; Jans, H.; Van Roy, W.; Moshchalkov, V.V.; Lagae, L.; et al. Biosensing using diffractively coupled plasmonic crystals: The figure of merit revisited. Adv. Opt. Mater. 2015, 3, 176–181. [Google Scholar] [CrossRef]
  6. Li, X.; Ren, X.; Xie, F.; Zhang, Y.; Xu, T.; Wei, B.; Choy, W.C.H. High-performance organic solar cells with broadband absorption enhancement and reliable reproducibility enabled by collective plasmonic effects. Adv. Opt. Mater. 2015, 3, 1220–1231. [Google Scholar] [CrossRef]
  7. Giannini, V.; Fernández-Domínguez, A.I.; Heck, S.C.; Maier, S.A. Plasmonic nanoantennas: Fundamentals and their use in controlling the radiative properties of nanoemitters. Chem. Rev. 2011, 111, 3888–3912. [Google Scholar] [CrossRef]
  8. Stiens, J.; Vounckx, R.; Veretennicoff, I. Slab plasmon polaritons and waveguide modes in four-layer resonant semiconductor waveguides. J. Appl. Phys. 1997, 81, 1–4. [Google Scholar] [CrossRef]
  9. Singh, M.R.; Racknor, C. Nonlinear energy transfer in quantum dot and metallic nanorod nanocomposites. J. Opt. Soc. Am. B 2015, 32, 2216–2222. [Google Scholar] [CrossRef]
  10. Singh, M.R.; Brassem, G.; Yastrebov, S. Enhancement of Radiative and Nonradiative Emission in Random Lasing Plasmonic Nanofibers. Annalen Physik 2021, 533, 2000558. [Google Scholar] [CrossRef]
  11. Singh, M.R. A Review of Many-Body Interactions in Linear and Nonlinear Plasmonic Nanohybrids. Symmetry 2021, 13, 445. [Google Scholar] [CrossRef]
  12. Naik, G.V.; Shalaev, V.M.; Boltasseva, A. Alternative plasmonic materials: Beyond gold and silver. Adv. Mater. 2013, 25, 3264–3294. [Google Scholar] [CrossRef]
  13. Feigenbaum, E.; Diest, K.; Atwater, H.A. Unity-Order Index Change in Transparent Conducting Oxides at Visible Frequencies. Nano Lett. 2010, 10, 2111. [Google Scholar] [CrossRef]
  14. Das, S.; Salandrino, A.; Wu, J.Z.; Hui, R. Near-infrared electro-optic modulator based on plasmonic graphene. Opt. Lett. 2015, 40, 1516. [Google Scholar] [CrossRef]
  15. Das, S.; Fardad, S.; Kim, I.; Rho, J.; Hui, R.; Salandrino, A. Nanophotonic modal dichroism: Mode-multiplexed modulators. Opt. Lett. 2016, 41, 4394. [Google Scholar] [CrossRef] [PubMed]
  16. Hoffman, A.; Alekseyev, L.; Howard, S.; Franz, K.; Wasserman, D.; Podolskiy, V.; Narimanov, E.; Sivco, D.; Gmachl, C. Negative refraction in semiconductor metamaterials. Nat. Mater. 2007, 6, 946–950. [Google Scholar] [CrossRef]
  17. Feng, J.; Chen, Y.; Blair, J.; Kurt, H.; Hao, R.; Citrin, D.S.; Summers, C.J.; Zhou, Z. Fabrication of annular photonic crystals by atomic layer deposition and sacrificial etching. J. Vac. Sci. Technol. B Microelectron. Nanometer Struct. 2009, 27, 568. [Google Scholar] [CrossRef]
  18. Peragut, F.; Cerutti, L.; Baranov, A.; Hugonin, J.P.; Taliercio, T.; de Wilde, Y.; Greffet, J.J. Hyperbolic metamaterials and surface plasmon polaritons. Optica 2017, 4, 1409–1415. [Google Scholar] [CrossRef]
  19. Ali, K.; Ullah, M.; Bacha, B.A.; Jabar, M.S.A. Complex conductivity-dependent two-dimensional atom microscopy. Eur. Phys. J. Plus 2019, 134, 618. [Google Scholar] [CrossRef]
  20. Khan, N.; Bacha, N.B.A.; Iqba, A.; Rahman, A.U.; Afaq, A. Gain-assisted superluminal propagation and rotary drag of photon and surface plasmon polaritons. Phys. Rev. A. 2017, 96, 013848. [Google Scholar] [CrossRef]
  21. Shekhar, P.; Atkinson, J.; Jacob, Z. Hyperbolic metamaterials: Fundamentals and applications. Nano Converg. 2014, 1, 14. [Google Scholar] [CrossRef] [PubMed] [Green Version]
  22. Starko-Bowes, R.; Atkinson, J.; Newman, W.; Hu, H.; Kallos, T.; Palikaras, G.; Fedosejevs, R.; Pramanik, S.; Jacob, Z. Optical characterization of Epsilon Near Zero, Epsilon Near Pole and hyperbolic response in nanowire metamaterials. J. Opt. Soc. Am. B 2015, 32, 2074–2080. [Google Scholar] [CrossRef] [Green Version]
  23. Gric, T.; Hess, O. Surface plasmon polaritons at the interface of two nanowire metamaterials. J. Opt. 2017, 19, 085101. [Google Scholar] [CrossRef]
  24. Iorsh, I.; Orlov, A.; Belov, P.; Kivshar, Y. Interface modes in nanostructured metal-dielectric metamaterials. Appl. Phys. Lett. 2011, 99, 151914. [Google Scholar] [CrossRef] [Green Version]
  25. Ioannidis, T.; Gric, T.; Rafailov, E. Controlling surface plasmon polaritons propagating at the interface of low-dimensional acoustic metamaterials. Waves Random Complex Media 2021, submitted. [Google Scholar]
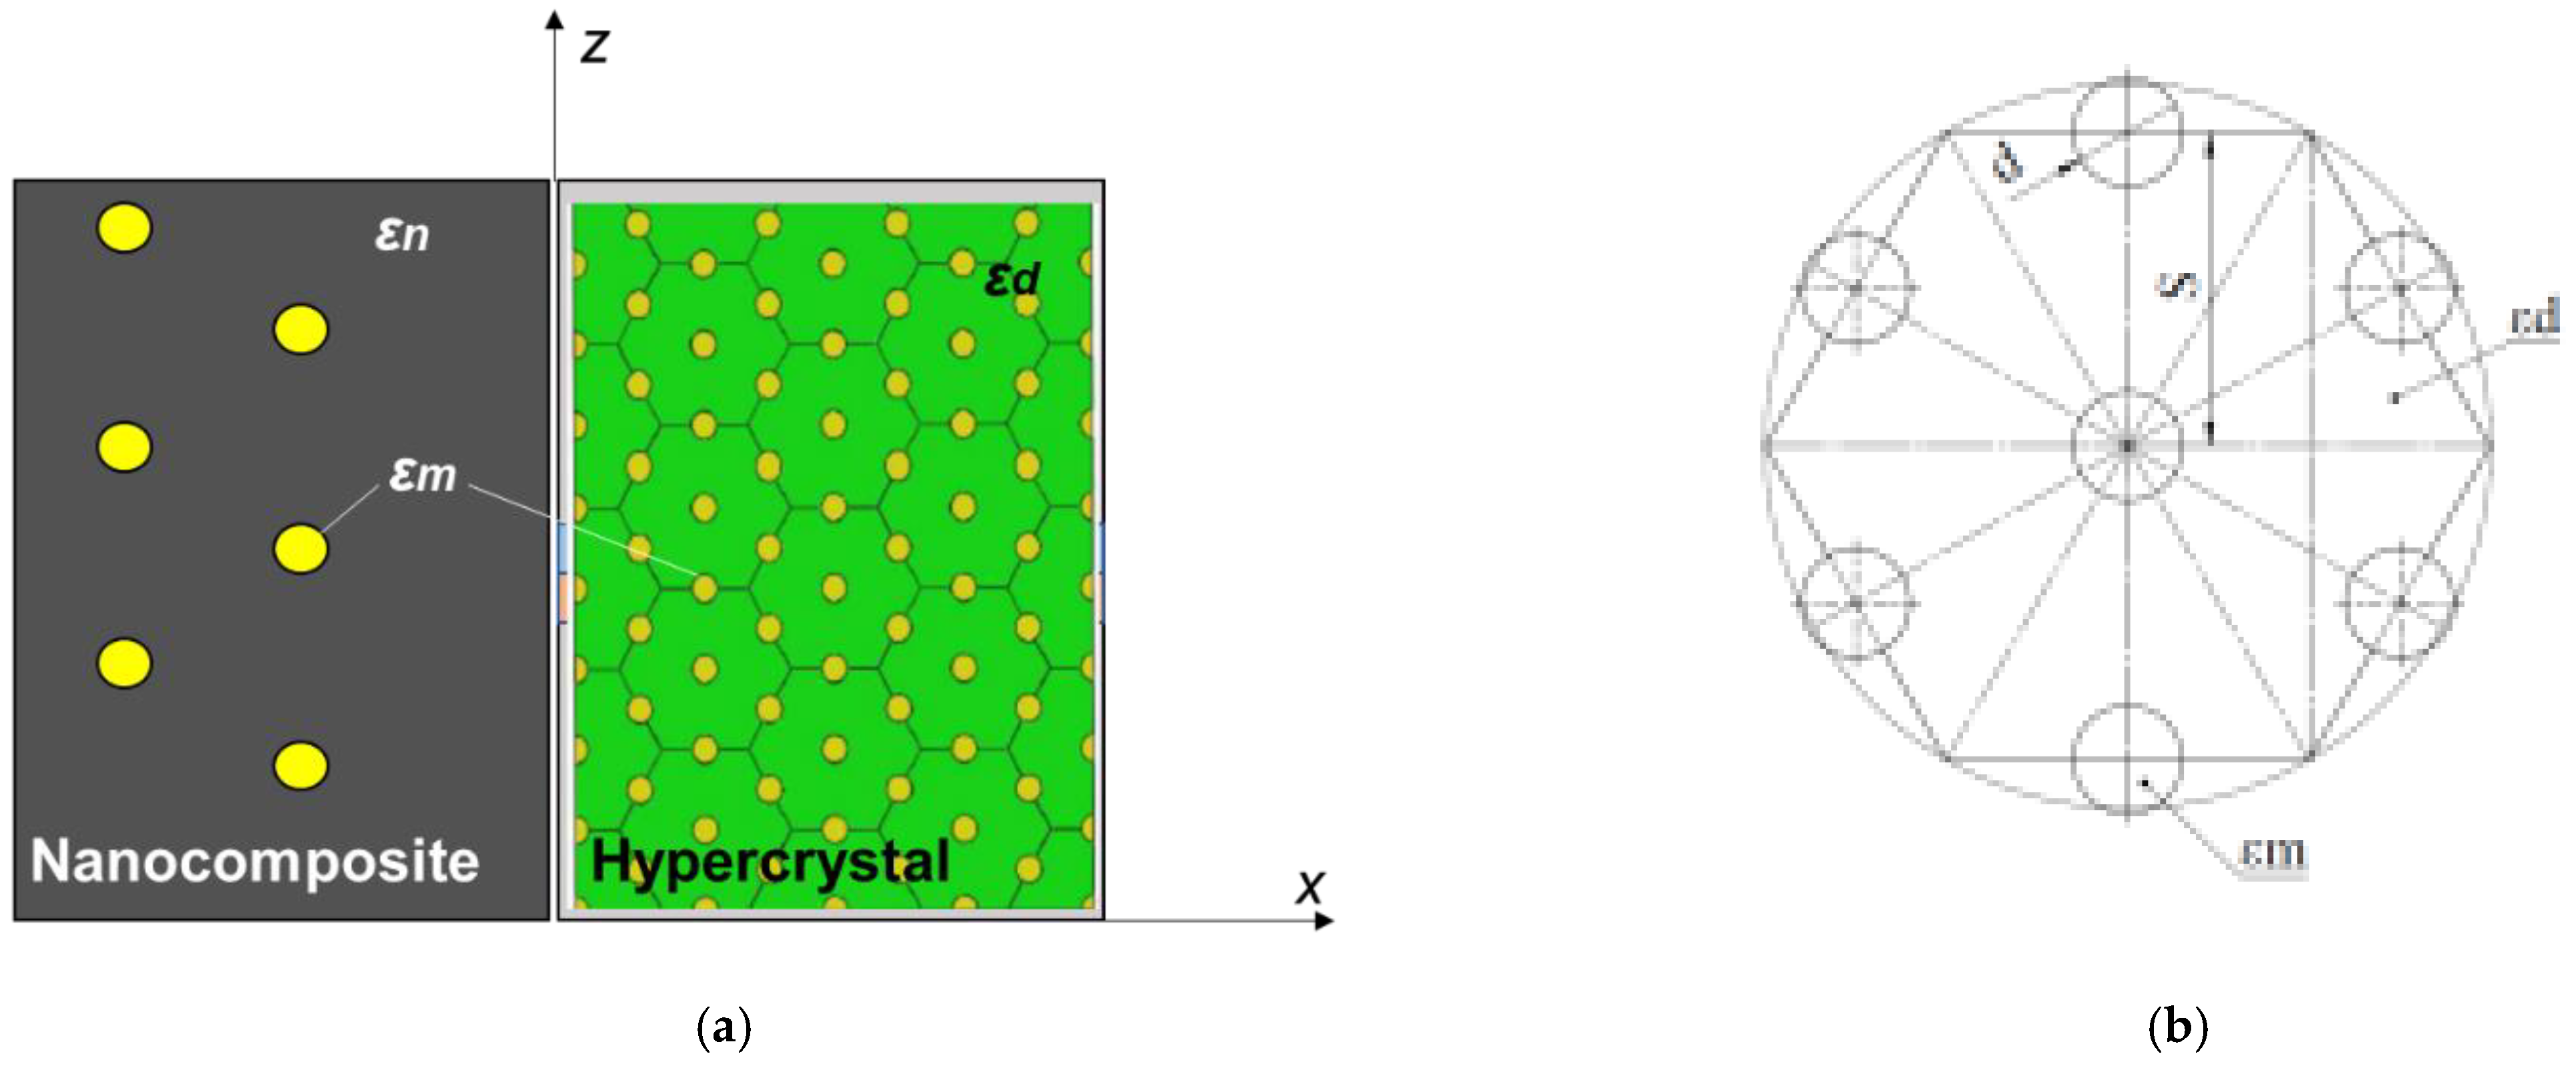
Figure 1. Schematic system under consideration, involving a semi-infinite hypercrystal (x > 0) and a nanocomposite with semiconductor inclusions (x < 0) (a) and metamaterial (hypercrystal) unit cell (b).
Applsci 11 05255 g001
Figure 2. Relative permittivity components of the nanocomposite and hypercrystal versus frequency. Herein, f = 0.3. (a), ε n = 11.8 , ε d = 2.25 ; (b) ε n = 2.25 , ε d = 11.8 . Herein ITO inclusions are employed in nanocomposite and hypercrystal.
Applsci 11 05255 g002
Figure 3. Relative permittivity components of the nanocomposite and hypercrystal versus conductivity. Herein, f = 0.3, ε n = 11.8 , ε d = 2.25 . Herein ITO inclusions are employed in nanocomposite and hypercrystal. (a) ω = 0.3 × 10¹⁴ Hz; (b) ω = 3 × 10¹⁴ Hz.
Applsci 11 05255 g003
Figure 4. Relative permittivity components of the nanocomposite and hypercrystal versus conductivity. Herein, f = 0.3, ε n = 2.25 , ε d = 11.8 . Herein ITO inclusions are employed in nanocomposite and hypercrystal. (a) ω = 0.3 × 10¹⁴ Hz; (b) ω = 3 × 10¹⁴ Hz.
Applsci 11 05255 g004
Figure 5. Solution of the dispersion equation versus frequency (a) and versus conductivity (b). ε n = 2.25 , ε d = 11.8 . Herein ITO inclusions are employed in nanocomposite and hypercrystal, f = 0.3 in (b).
Applsci 11 05255 g005
Figure 6. Solution of the dispersion equation versus frequency (a) and versus conductivity (b). ε n = 11.8 , ε d = 2.25 . Herein ITO inclusions are employed in nanocomposite and hypercrystal, f = 0.3 in (b).
Applsci 11 05255 g006
Figure 7. Dependence of imaginary part of propagation constant versus frequency for different filling factors (a) and versus conductivity for f = 0.3 (b). ε n = 2.25 , ε d = 11.8 . All the presented results are obtained for the ITO inclusions.
Applsci 11 05255 g007
Figure 8. Dependence of imaginary part of propagation constant versus frequency for different filling factors (a) and versus conductivity for f = 0.3 (b). ε n = 11.8 , ε d = 2.25 . All the presented results are obtained for the ITO inclusions.
Applsci 11 05255 g008
Figure 9. Dependence of propagation length versus frequency for different filling factors (a) and versus conductivity for f = 0.3 (b). ε n = 2.25 , ε d = 11.8 . All the presented results are obtained for the ITO inclusions.
Applsci 11 05255 g009
Figure 10. Dependence of propagation length versus frequency for different filling factors (a) and versus conductivity for f = 0.3 (b). ε n = 11.8 , ε d = 2.25 . All the presented results are obtained for the ITO inclusions.
Applsci 11 05255 g010
Table 1. Drude–Lorentz parameters of plasmonic materials obtained from experimental data. One may approximate the materials dielectric function by the complex dielectric function: ε T C O = ε b ω p 2 ω ( ω + i γ p ) + f 1 ω 1 2 ( ω 1 2 ω 2 i ω γ 1 ) , with the values of the parameters outlined in the table [18]. Here εb is the polarization response from the core electrons (background permittivity), ωp is the plasma frequency, γp is the Drude relaxation rate.
AZOGZOITOTiN (Deposited at 800 °C)TiN (Deposited at 500 °C)ZrN
εb3.543.233.534.862.493.47
ωp (eV)1.751.991.787.935.958.02
γp (eV)0.040.120.160.180.510.52
f10.510.390.393.292.042.45
ω1 (eV)4.294.054.214.223.955.48
γ1 (eV)0.100.090.092.032.491.74
Publisher’s Note: MDPI stays neutral with regard to jurisdictional claims in published maps and institutional affiliations.