Article

Multi-Hazard WebGIS Platform for Coastal Regions

1
National Laboratory for Civil Engineering, Avenida do Brasil 101, 1700-066 Lisbon, Portugal
2
Centre for Social Studies and Earth Sciences Department, Coimbra University, 3000-995 Coimbra, Portugal
3
Institute of Geography and Spatial Planning, University of Lisbon, 1600-276 Lisbon, Portugal
*
Author to whom correspondence should be addressed.
Appl. Sci. 2021, 11(11), 5253; https://doi.org/10.3390/app11115253
Submission received: 10 May 2021 / Revised: 2 June 2021 / Accepted: 3 June 2021 / Published: 5 June 2021
(This article belongs to the Special Issue Advances in Multihazard Science)

Abstract

:

Featured Application

Monitoring and forecasting platforms such as MOSAIC can support real-time response and alert, contribute to emergency assessment and risk management for multiple hazards in coastal regions, performing new safety comprehensive approaches for these areas.

Abstract

The combined action of waves, surges and tides can cause flooding, erosion and dune and structure overtopping in many coastal regions. Addressing emergency and risk management in these areas require a combination of targeted campaigns and real-time data that measure all phenomena at stake and can be used to develop comprehensive monitoring platforms. These monitoring platforms can support the development of prediction tools that address all hazards in an integrated way. Herein, we present a methodology focused on multi-hazard coastal alert and risk, and its implementation in a tailored WebGIS platform. The MOSAIC platform offers a one-stop-shop capacity to access in-situ and remote sensing data, and hydrodynamic and morphodynamic predictions, supported by numerical models: SCHISM and XBeach. Information is structured on a local observatory scale, with regional forcings available for the correct interpretation of local hazards effects. This implementation can be further applied and extended to other coastal zones. The MOSAIC platform also provides access to a detailed database of past hazardous events, organized along several risk indicators, for the western coast of Portugal. The combination of features in the platform provides a unique repository of hazard information to support end-users for both emergency and long term risk planning actions.

1. Introduction

Coastal zones are exposed to multiple hazards that are being exacerbated by climate change [1,2,3,4]. Flooding resulting from the combination of energetic wave conditions, storm surges and high spring-tide levels is one of the major hazards affecting coastal zones, whose impacts will increase in the future [5,6]. The type and extent of the impacts will depend on the territorial and morphological characteristics of the coast (e.g., wave overtopping of coastal structures and avalanche, overwash and breaching of dunes).
Coastal erosion generated by highly energetic events can result in the retreat of the coastline, increase of the runup and the overtopping discharge and consequently the increase of the impact of inundation. The concentration of people and assets along the coastline increases coastal vulnerability and contributes to very severe consequences of these natural events that are being exacerbated by climate change effects either through sea level rise or increasing storminess [7,8].
Emergency response and long-term planning of coastal interventions and occupation require a combination of real-time information (data and forecast results), aggregated along with the relevant key factors, and risk indicators that highlight the vulnerability of each coastal stretch to the combinations of hazards that lead to severe conditions. Computational frameworks and their associated interfaces have been developed over the last two decades to address flooding issues (e.g., [9,10,11]) or multi-hazard predictions. The Water Information Forecast framework-based platforms [12], dedicated to multiple hazards, are an example of the latter, addressing floods [12], oil spills [13], fecal contamination [14] and biogeochemical evolution due to anthropogenic and climate changes [15]. These types of instruments are at the core of nowadays support flood tools for coastal managers and civil protection agencies, gathering the relevant data and forecasts, and making them available in a user-friendly way (e.g., [16,17]).
However, several limitations remain in existing tools:
-
They are often dedicated to a specific site, developed around particular conditions and data streams. While frequently tailored to specific needs, their maintenance is complex and time-consuming, and often become obsolete, not resisting the advances of technology. Moreover, their application to similar systems is so time-consuming that development from scratch is commonly the solution undertaken for new deployments.
-
They are not designed to address multiple hazards and multiple sources of data. For systems subject to several flooding hazards sources, an integrated and individual analysis is required and the data that best fit this analysis needs to be included.
-
Technological constraints often hamper the usability of these platforms, making for instance the visualization and probing over the complex space- and time-varying information frequently too slow. Usually, inadequate and static designs prevent the adaptation to multiple uses (e.g., platforms tailored for management or for civil protection agencies have different requirements) and the necessary evolution to address new challenges (e.g., addressing the impact of a new construction in the area).
To address these challenges, a WebGIS multi-hazard platform, hereafter referred to as MOSAIC platform, named after the project that supported it, is presented here. It aims to support the implementation of an innovative flood risk management framework for coastal zones. The platform’s framework is supported by observatories that integrate real-time monitoring data, from both in-situ and remote sensors, and predictive numerical models addressing both coastal hydrodynamics and morphodynamics in order to predict wave overtopping of dunes and coastal structures. Additionally, a baseline from historical data at regional scale sets the scene for each coastal observatory, representing distinct coastal typologies, to efficiently support the flooding preparedness and response actions for emergency management needs, considering the singularities of a territory exposed to different hazards.
In order to characterize coastal elements, the concept of observatories allows the aggregation of data and the possibility to export the knowledge and tools to other coastal sites. The MOSAIC platform is the vehicle to convey the relevant information, aggregated in relevant indicators, but with the possibility to drill down to the level of individual sensor data or the model prediction maps at a specific time step and for a specific location. This platform is implemented in a complex, detailed data repository that manages both observations and model predictions. Distinct types of information, including time series, 2D results and remote sensing images from Sentinel satellites, are included, duly integrated according to their specific characteristics. Integration of sensor/data type is performed in a modular way that facilitates the integration of new sources of information. Thus, hazards can be analyzed in an integrated way (e.g., through inundation maps) or individually, through specific data streams targeted at measuring specific hazards (e.g., erosion mapping from altimetry from drone flights).
This paper is divided into three sections, besides this introduction. The framework for multi-hazard analysis is described first, including both modeling and monitoring methodologies. Next, the MOSAIC platform from both coastal engineering and computer science perspectives are described. Section 3 illustrates its application to an observatory in Portugal, demonstrating its value to address multi-hazard science in coastal regions. The paper closes with concluding remarks and directions for future research.

2. Materials and Methods

2.1. Multi-Hazard Framework for Flood and Erosion Risk in Coastal Zones

2.1.1. Methodology Description

The risk framework within the MOSAIC platform aims at predicting coastal flooding to support the emergency actions, accounting for all the relevant hazards and considering the specificities of each exposed territory [18]. This methodology addresses inundation and overtopping of dunes and coastal defense structures associated with energetic events that lead to extreme water levels and beach erosion.
The framework is anchored in the concept of observatories, adapted here to integrate both monitoring data, from in-situ and remote sources, and numerical models that address all relevant physical processes at stake. Unlike previous applications of the concept of observatories in the coastal analysis [15], the MOSAIC framework integrates both hydrodynamics and morphodynamic monitoring and predictions as the evolution of the topo-bathymetry during energetic events is fundamental for an accurate evaluation of flooding and overtopping in coastal regions.
The proposed methodology also integrates a downscaling approach both for model forcings and characterization of flooding impacts associated with the diversity of the exposed territory. The former is described in detail in the next section. Flooding impacts on coastal zones depend heavily on the territory occupation and its morphological characteristics. Taking the Portuguese coast as a demonstrator, a detailed analysis of past events was done at the regional level to provide the information for the classification of the coast in distinct coastal typologies [19]. Based on this regional-scale analysis, each coastal observatory in MOSAIC was defined and classified, which in turn defined both the monitoring and modeling approaches to be implemented for the risk assessment. The application of this framework is then materialized for the end-users through the WebGIS multi-hazard platform presented herein. This platform provides the relevant information, organized from regional to local observatory scales, allowing the user to examine regional analysis outputs or to drill down to the level of individual sensor data or the model prediction maps at a specific time step and for any location.

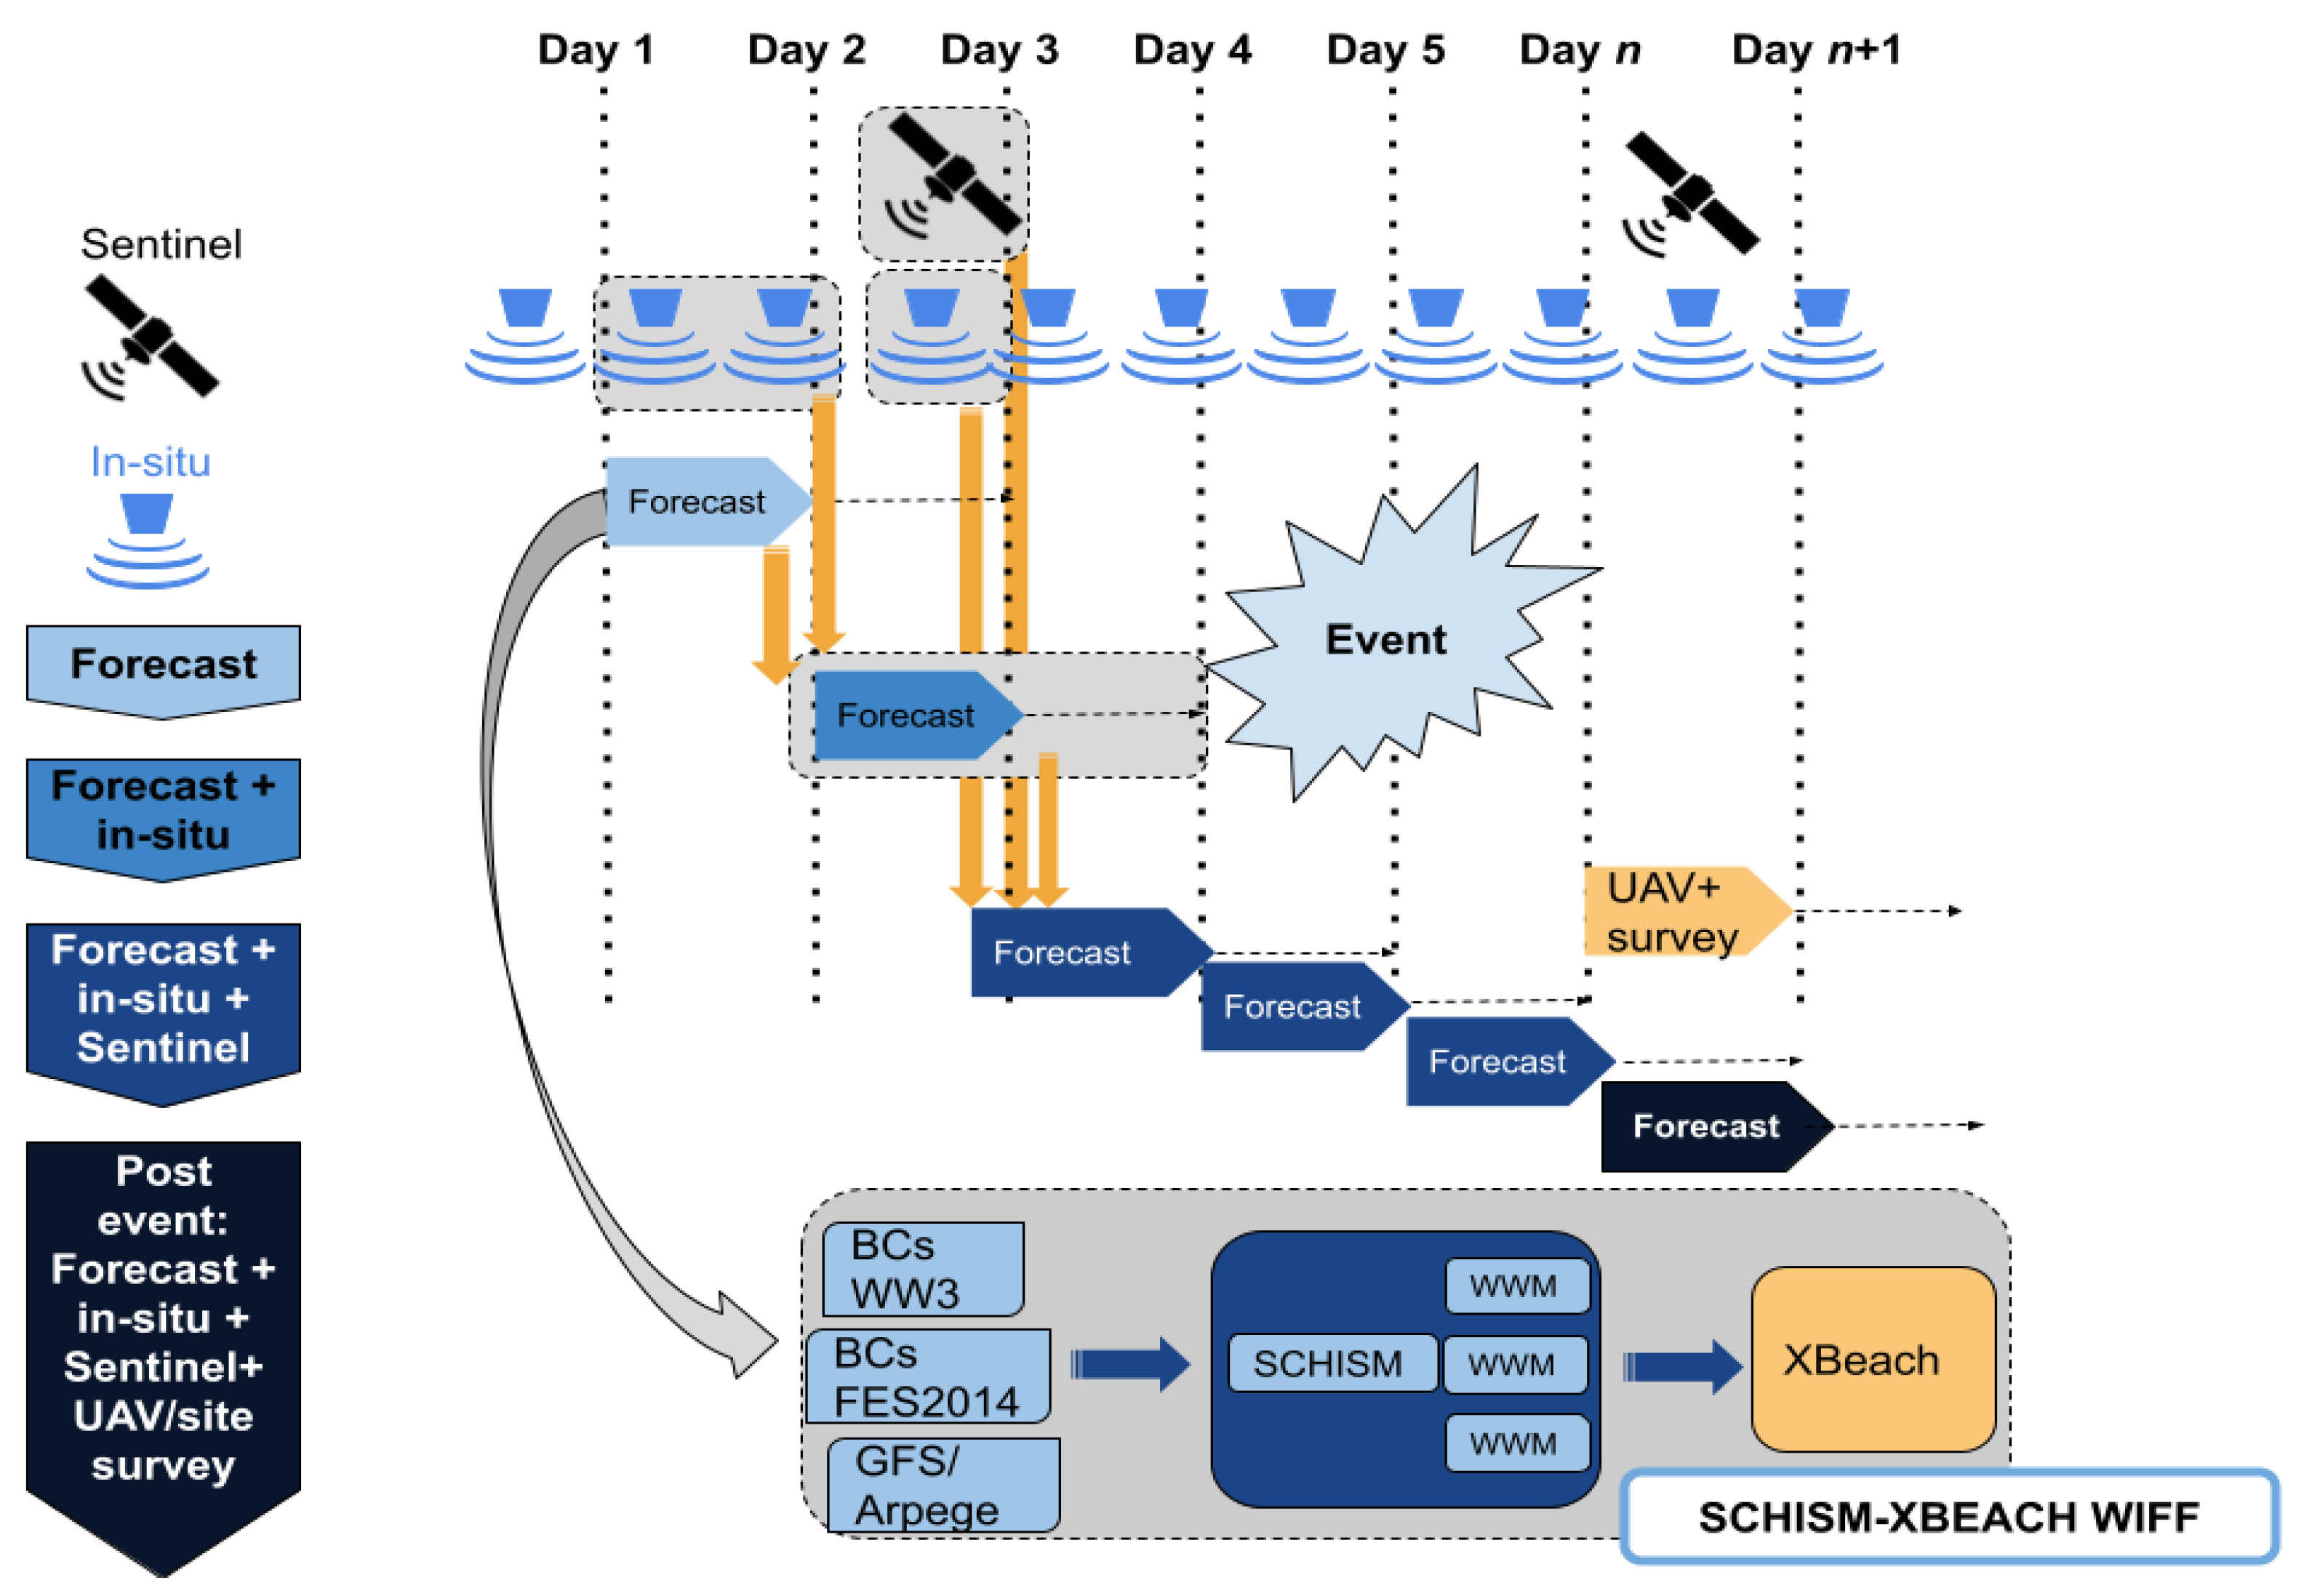
2.1.2. Modeling and Forecasting Infrastructure

For selected observatories, model predictions can be generated using the OPENCoastS forecast service [20]. This service can be used to forecast the circulation in any coastal area worldwide at the choice of the user, supported by the Water Information Forecast Framework (WIFF, [12,21]) and the European Open Science Cloud resources (https://www.eosc-hub.eu/ (accessed on 10 May 2021)). WIFF was expanded to address the prediction of multiple coastal hazards, including a real-time beach morphodynamic module, based on a combination of models: SCHISM [22] and XBeach [23].
The open-source modeling suite SCHISM solves the three-dimensional shallow water equations using unstructured grids [22]. Here, the SCHISM modelling system uses a single unstructured grid to discretize the horizontal space, in depth averaged (2DH) mode, with a two-way coupling between the circulation and wave modules. It provides the free-surface elevation and the 2D water velocity fields using finite-element and finite-volume schemes, and model WWM provides the wave parameters. SCHISM is a highly efficient, parallelized model, a fundamental property for forecast applications.
The open-source hydro-morphodynamic model XBeach [23] was originally developed to assess the natural coastal response to the time-varying storm and hurricane conditions. The main model highlight was to account for the variations of the surface elevation and of the short-wave energy at the wave group timescale. Compared to SCHISM, this still allows modeling the generation and/or propagation of infragravity waves (i.e., long-waves with periods greater than 25 s). By solving the non-stationary shallow water equations, the sediment transport equations, and the continuity equation for the bed update, it can model long-wave runup, dune erosion, overwashing and breaching. Since its original development, several improvements have been implemented in new releases and it can be applied in three different modes, stationary, surfbeat and non-hydrostatic, which account differently for infragravity waves and short-waves [24].
In the MOSAIC platform, XBeach is used in hydrostatic “surfbeat” mode. SCHISM and XBeach configurations run consecutively, with SCHISM providing the necessary boundary conditions to run XBeach. This nesting procedure enables running XBeach in a smaller domain, possibly with a higher resolution at the shoreline.
The SCHISM configuration was previously calibrated and validated based on historical data and a dedicated field campaign [25]. It was run over a single triangular grid composed of 49,684 nodes and 94,892 elements, with an edge length ranging from 2 km offshore to 20 m in the nearshore, harbor and river area. The field data were also used to evaluate the short-wave breaking and the representation of the infragravity wave component in the XBeach configuration. Both model configurations were then used in WIFF to produce daily predictions of circulation and morphodynamics.
In order to obtain boundary conditions at the local coastal scale, a chain of models is used to address the several spatial scales and processes to be solved. This approach is generic and can be applied to any coastal system. The specific forcing providers shown in Figure 1 (ARPEGE, GFS, FES2014) can be replaced by other providers (e.g., high resolution WRF forecasts).
The model workflow encompasses several steps (Figure 1), where each model is forced by outputs from the previous one, from the regional scale to the coastline. In the future, these predictions will be integrated with online field data to provide enhanced, assimilated forecasts.

2.1.3. Multi-Source Monitoring Framework

Evaluating the extent of inundation and overtopping during energetic events requires a combination of monitoring and prediction tools. Taking advantage of the results of the modeling and forecasting infrastructure and the availability of freely available field data, a monitoring framework for coastal inundation prediction was developed for application in multiple coastal typologies. This framework aims to gather information from multiple monitoring sources (e.g., conventional and low-cost fixed stations, remote sensing from satellites and unmanned aerial vehicle-UAV) and model-based forecast systems. The data are used sequentially, aiming to build a comprehensive timeline representation of coastal dynamics from a few days before to a few days after the emergency event.
Each source provides an added layer of information and a new source for global data reliability evaluation. This procedure will be conducted in continuous mode, in a similar fashion as forecasts systems are operated and hence building a database of data on coastal evolution, supported by the several monitoring sources.
The procedure is closely linked to the temporal window of interest and the availability of data sources during events (Figure 2). First, a complete set of information for a period of 48 h is built based on the application of the hydrodynamic and morphodynamic forecast models. Then, in-situ sensor data are assimilated using data fusion and data quality evaluation techniques [26]. The next step is to integrate processed near-real time Sentinel satellite data for inundation line detection, using the algorithms from the Worsica service (https://www.eosc-synergy.eu/thematic-services/worsica/ (accessed on 10 May 2021)), at the times these images are available. This integration will provide a new set of products, based on reliable remote sensing data assimilation. Finally, the spatial scale of satellite images may be insufficient for fine scale and short-lived coastal features. UAV surveys are executed after the events, targeting the most critical hotspots, defined by the faster dynamics areas.

2.2. The MOSAIC Multi-Hazard Platform

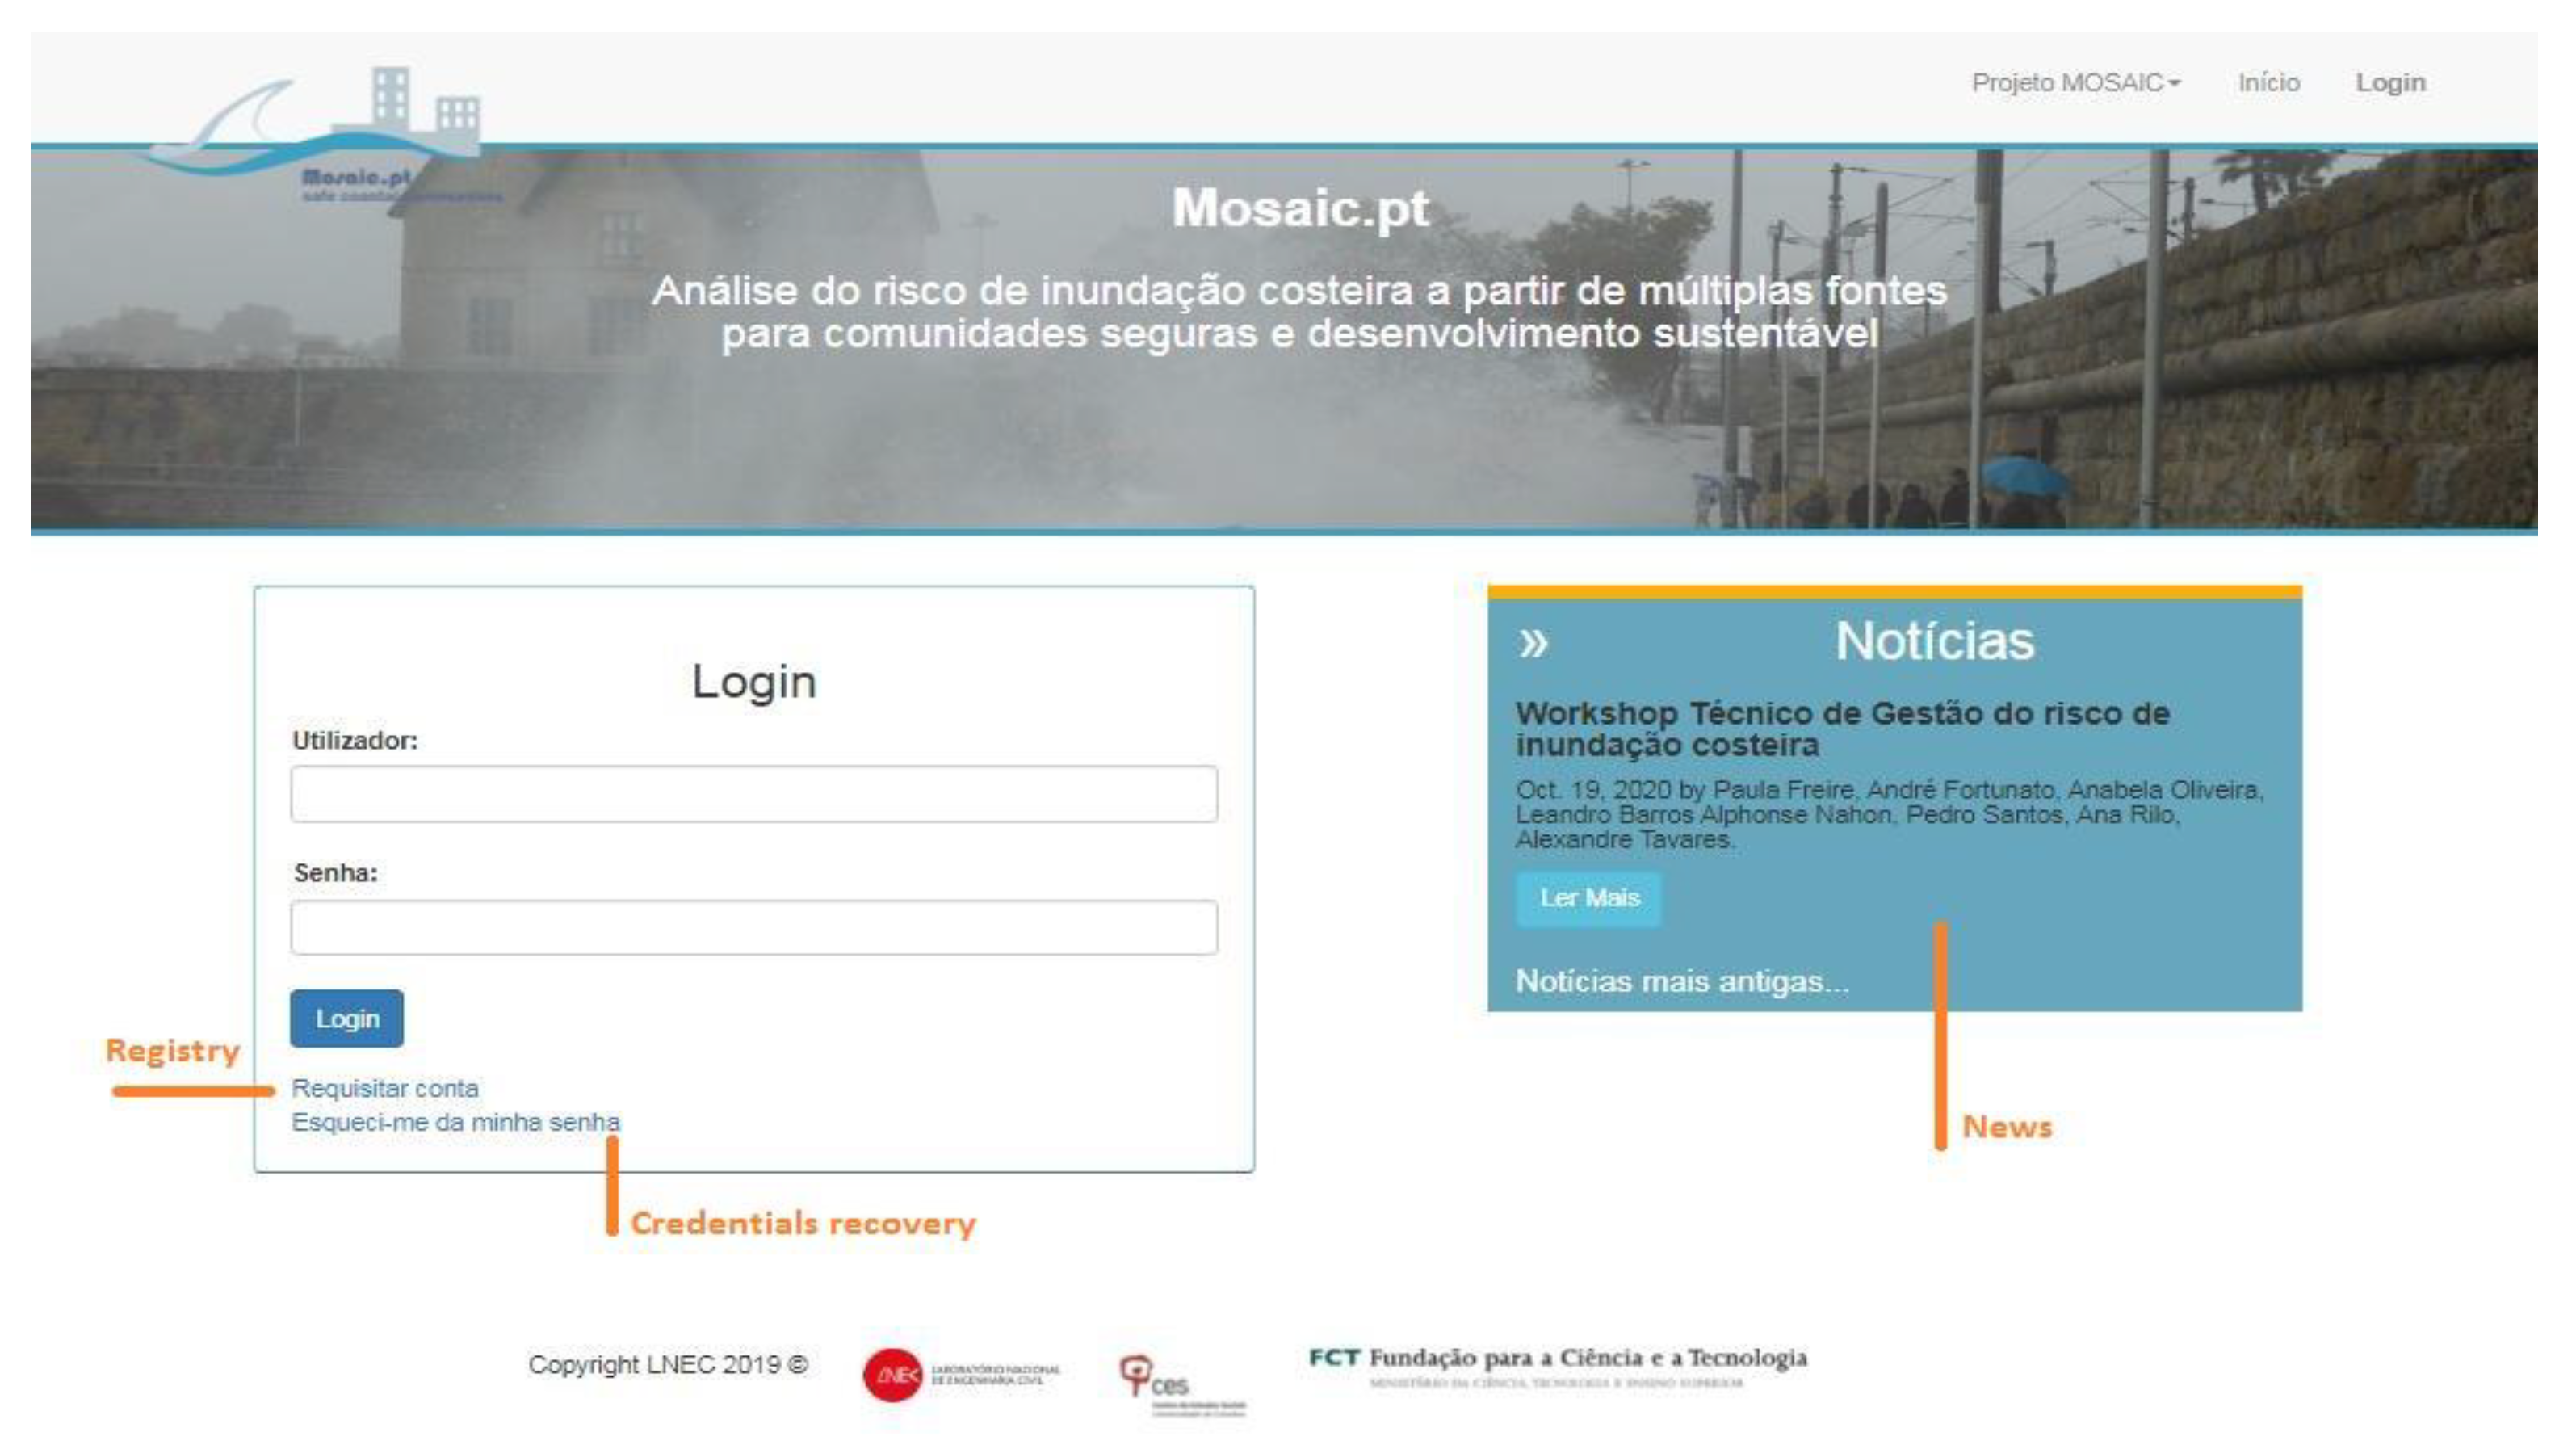
2.2.1. Concept and Main Implementation

The main goal of the WebGIS platform is to provide a reference, generic tool in support of flood risk assessment, demonstrated in the following section for the western Portuguese coastal zone. The western coast is characterized by energetic wave conditions, storm surges and high spring-tide levels that have historically translated into overtopping and flooding, as well as erosion and dismantling of sandy dune bodies and rocky cliffs [6]. End-users should have access to information and data on the platform in a user-friendly way, requiring only a device with an internet connection. Mainly developed as an operational platform for sharing results from the MOSAIC.pt project, the major focus of the platform is to guarantee a high degree of usability. Essentially, the final product was developed to fulfill the needs of the expected end-users.
The tool was also developed with modularity and reusability in mind. Therefore, some parts of the website, mostly connected to widgets (components of an interface, that enables a user to perform a function or access a service) and the use of prediction models, can be easily ported and reused on other platforms.
The interface starts by authenticating the user (Figure 3) using credentials that can be obtained by registration in the same site. The welcome interface also shares publicly the main news of the project.
After authentication, the frontend is organized in the following dashboards (Figure 4), structured in two categories—regional products (historical data of coastal flooding occurrences and regional hydrodynamic forcings) and local products (observatories):
-
Historical data of coastal flooding occurrences (histórico de eventos)—a statistical analysis of past events is presented here using WebGIS capabilities. In the demo below, this analysis is supported by data from newspapers;
-
Regional hydrodynamic forcings (forçamentos regionais)—forecasts results used to force the simulations of the observatories are shown here, for a rapid evaluation of hazardous events conditions. These forecasts are provided by external providers outside the MOSAIC project, which will allow for updates for better forcings in the future if needed. In the demo below, http://ariel.lnec.pt (accessed on 10 May 2021) is the forecast source;
-
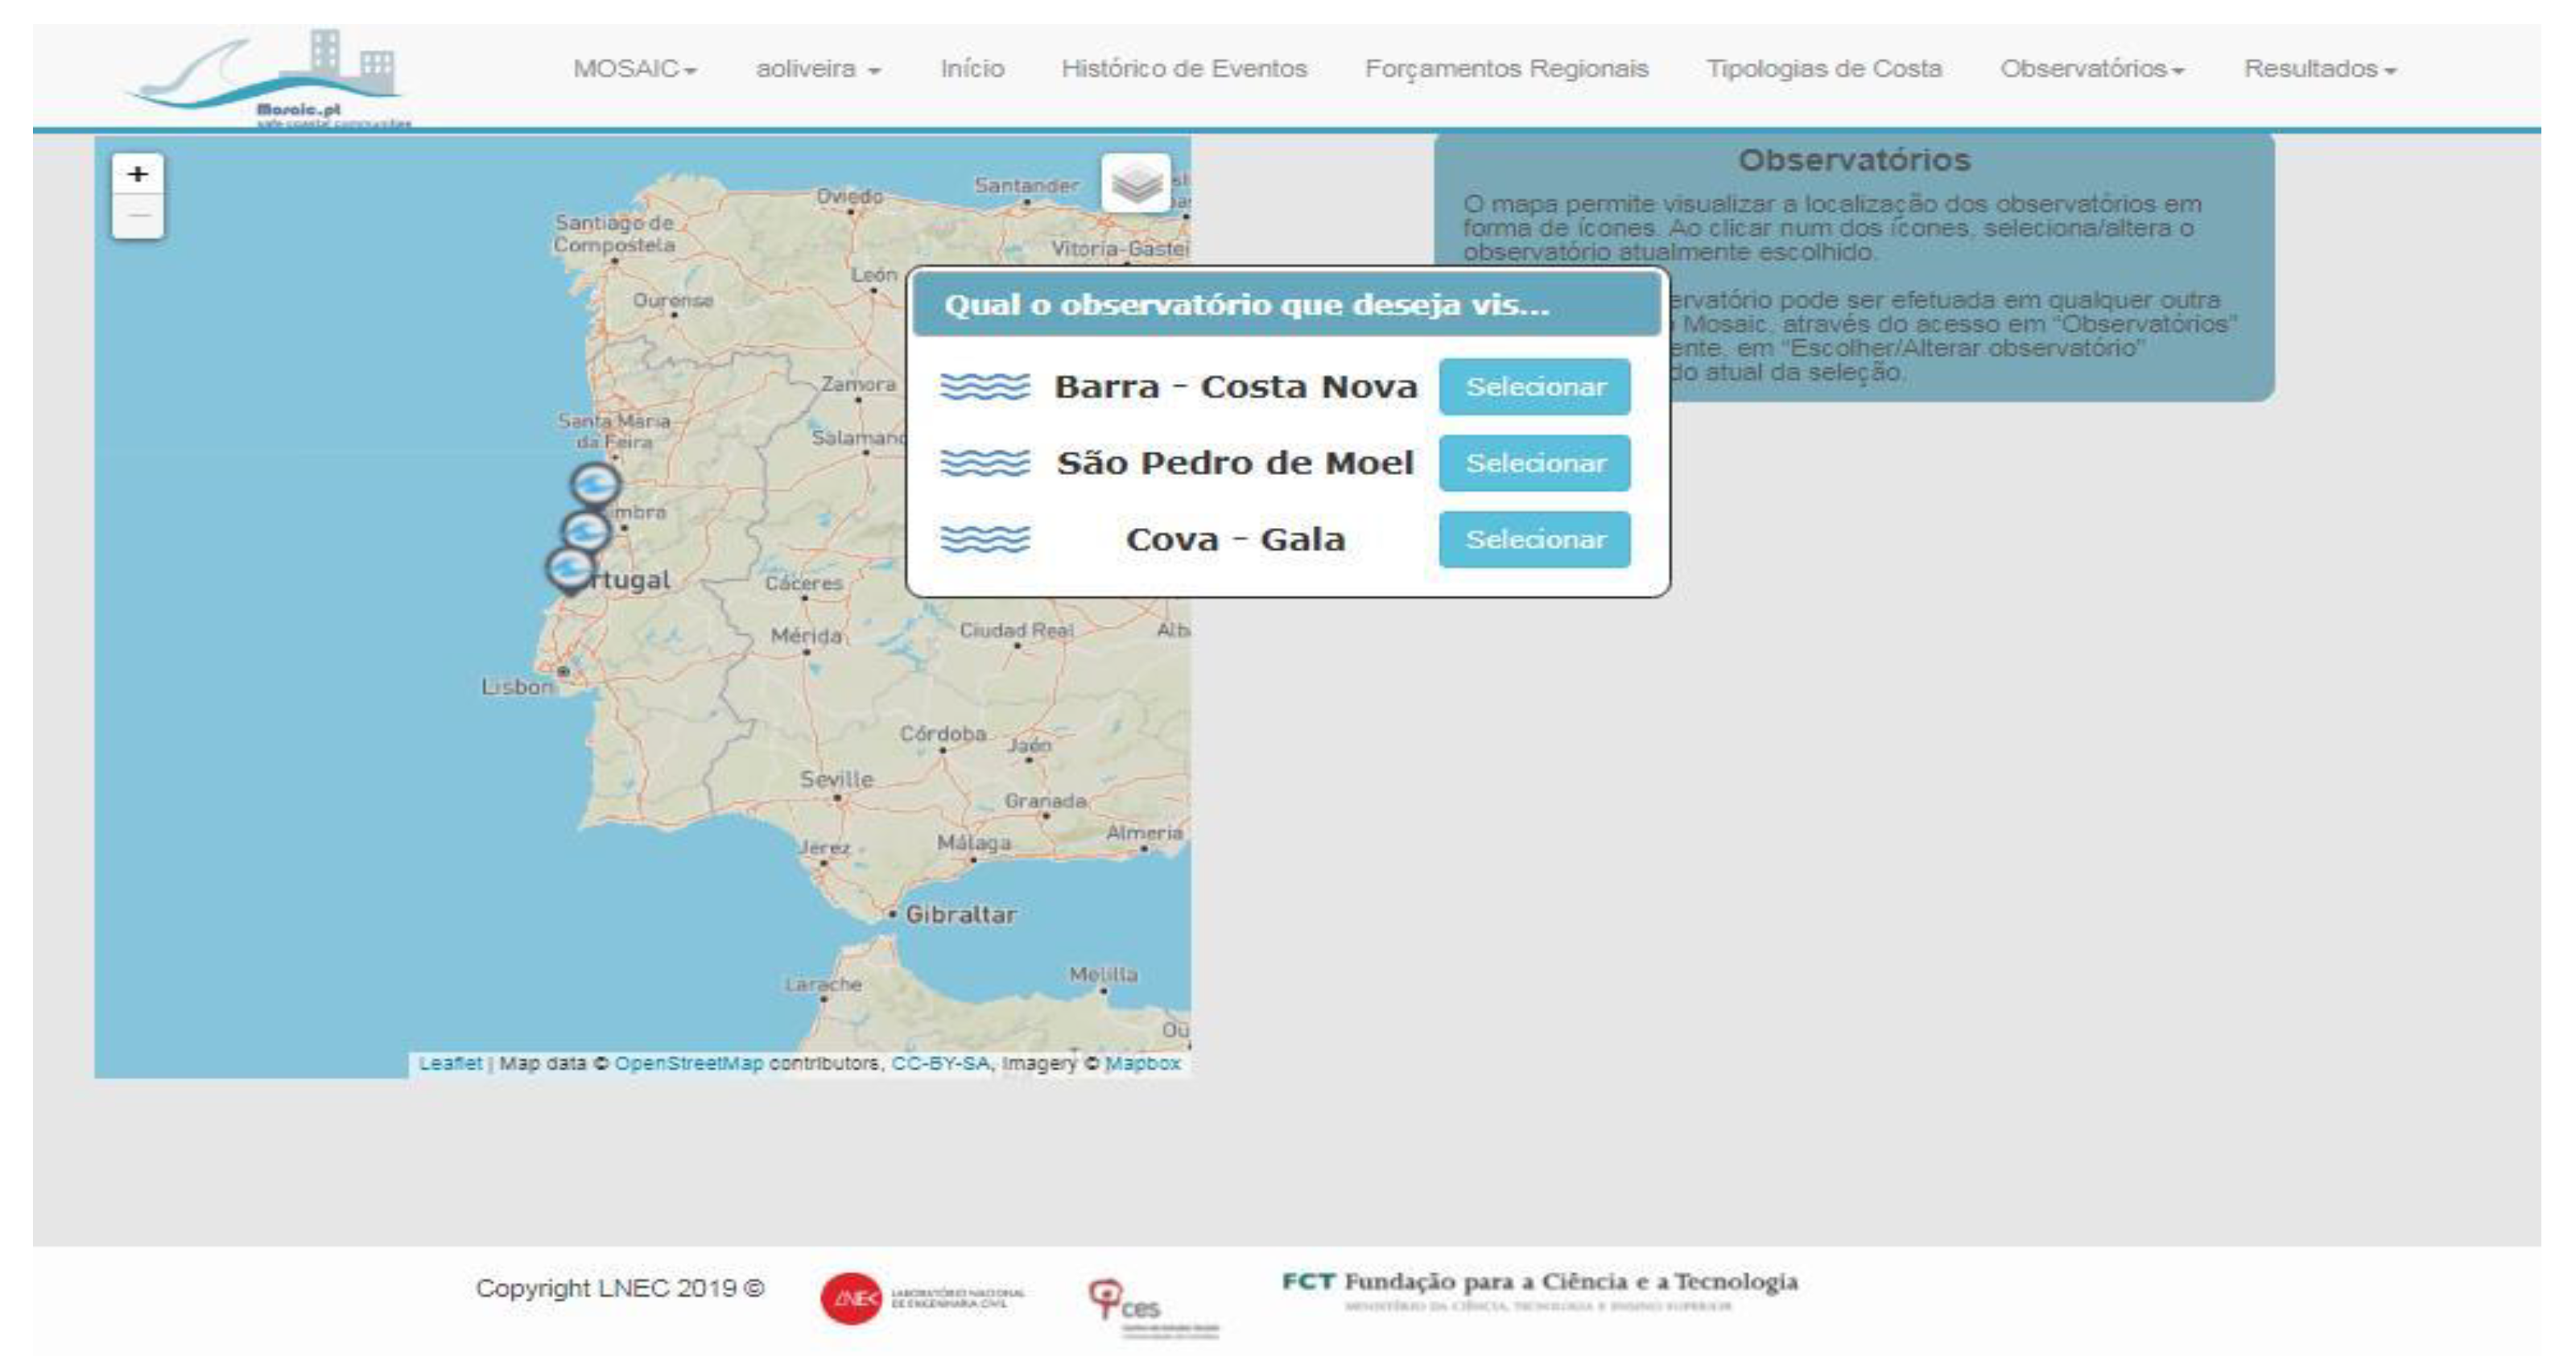
Observatories (observatórios)—selection of the observatory to unlock the access to the corresponding model predictions, data, and risk products. These products are available in the following tab outputs (resultados).

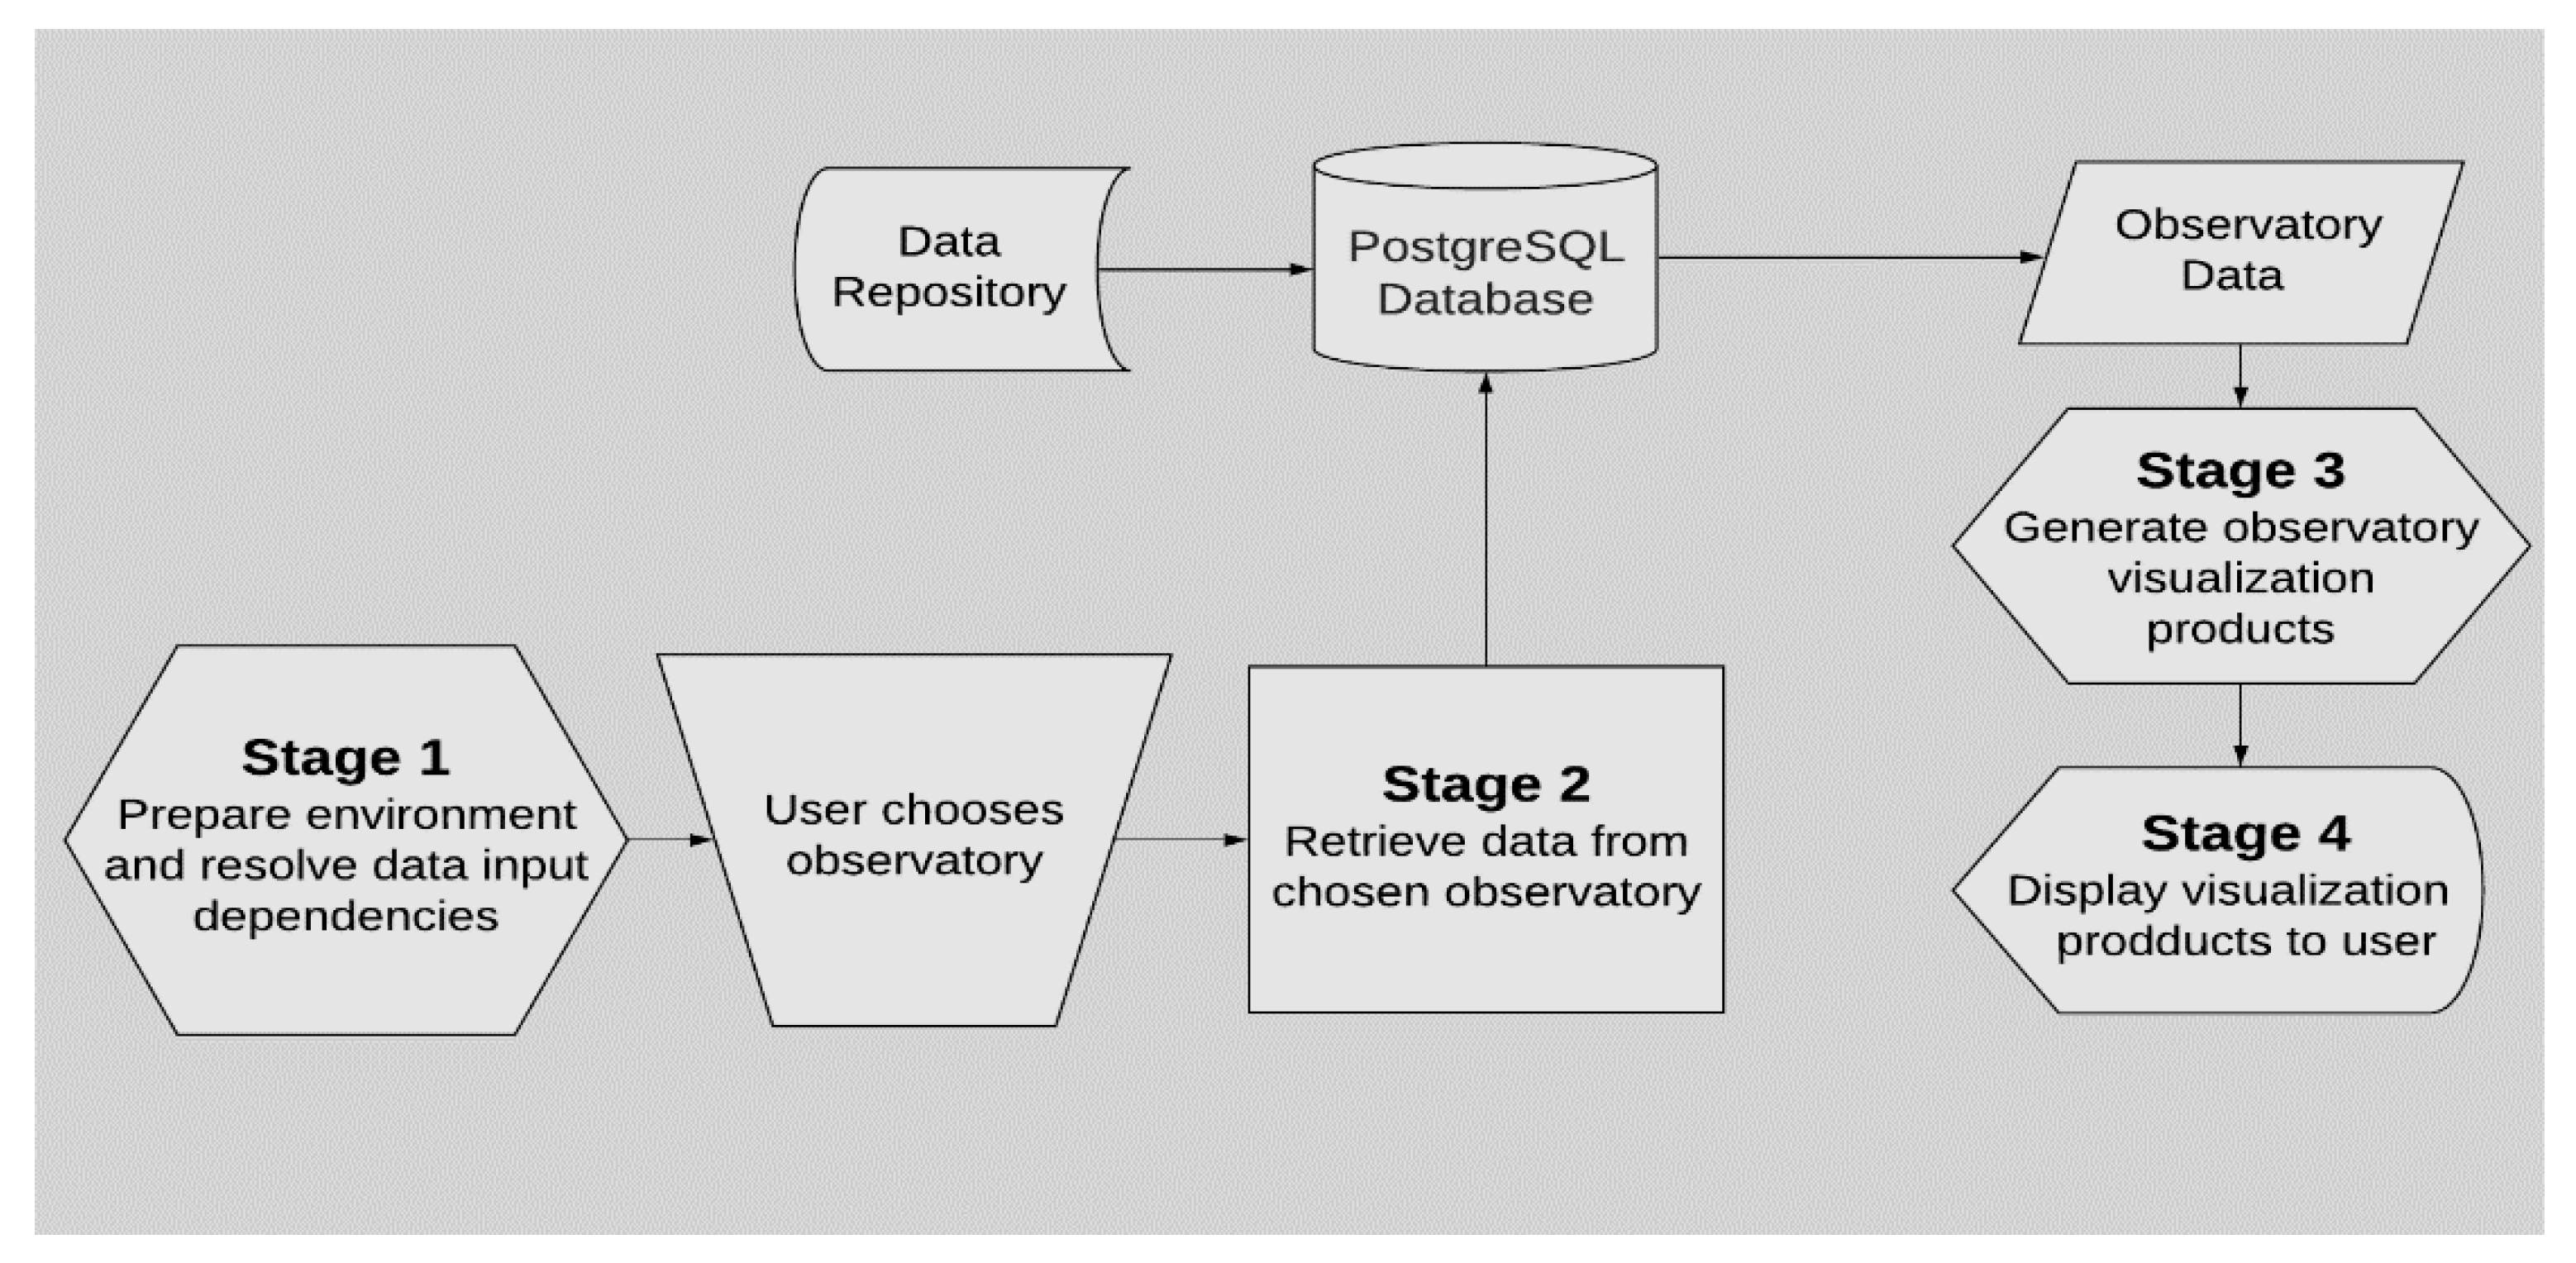
2.2.2. Platform Architecture

The web portal is developed in Django (https://www.djangoproject.com/ (accessed on 10 May 2021)), a Python-based free and open-source web framework. The interface consists of a frontend and a backend, with a shared repository for data upload, storage and sharing. The frontend handles the user interactions through HTML pages, and the backend processes the user requests (with PostgreSQL Database—https://www.postgresql.org/ (accessed on 10 May 2021)), similarly to [11]. It also resorts to external resources such as the e-service OPENCoastS and its WFS/WMS map server for the hydrodynamic SCHISM-WWM forecasts outputs, and LNEC’s water data repository for in-situ data.
The platform frontend interacts directly with the backend, acting as the main consumer of the operations performed in the backend to select the data requested by the user. The data is loaded based on the user interactions with the platform. Most of these actions are unlocked after the selection of an observatory.
Figure 5 represents the workflow and the consumption of resources that occurs within the MOSAIC platform in order to obtain a successful visualization.
When the user chooses an observatory, a numerical identifier is sent to the Django backend to be processed. This action triggers the unlocking of the results (resultados) tab, which remains inaccessible until the user chooses an observatory, as the results shown depend on the selected observatory.
The observatory can be altered both in the data visualization page and on all of the remaining sections of the interface. Clicking on Observatory (observatório) and then on Change observatory (alterar obs.) opens a pop-up that displays the list of available observatories (Figure 6). The user can then proceed to change the selected observatory. If this action is performed while on the data visualization page, the updated data for the newly chosen observatory is automatically loaded with the aid of an AJAX (asynchronous JavaScript and XML) request.
A small cache system was implemented to store both the last selected observatory and data variable. This is done through a combination of cookies and an AJAX request sent to the backend which carries both the numerical identifier of the observatory and a string that identifies the variable. Both are stored in the session data that are available via Django and the next time the user performs a login on MOSAIC, the data are pre-loaded into the interface.
Just like every portion of the website, the pop-up was created using a combination of HTML, CSS, Javascript with the aid of the Bootstrap (https://getbootstrap.com/ (accessed on 10 May 2021)) open-source CSS framework. The color scheme chosen for the website is based on multiple shades of blue. Different shades of blue are used to highlight and differentiate portions of a webpage.
Most pages within the interface are simple and straightforward, having only two to three elements. One of the elements corresponds to a text portion explaining the purpose of the page, while the remaining elements are where the users can interact and choose what they want to visualize on that page.
The process of visualizing data on the interface occurs in two parts. The first part consists of the users’ decision, where they choose the data they want to visualize which is transformed into a request sent to the portal backend. This request (corresponding to the second part of the process of visualizing data) is then processed in the backend, where the necessary filtering is performed, and the end result is then sent to the interface to be displayed.
The data published on the portal come from multiple sources. The database is built on the PostgreSQL relational database management system, similarly to [11]. The data are loaded through the use of Python scripts or by the connection that is created between the server and the data repository. Data and model predictions are stored in a data repository previously developed [18].

3. Showcasing the Results: Application to the Central West Portuguese Coast

In this section, the contents of the platform are illustrated using a demo at the Central West coast of Portugal.

3.1. Regional Products

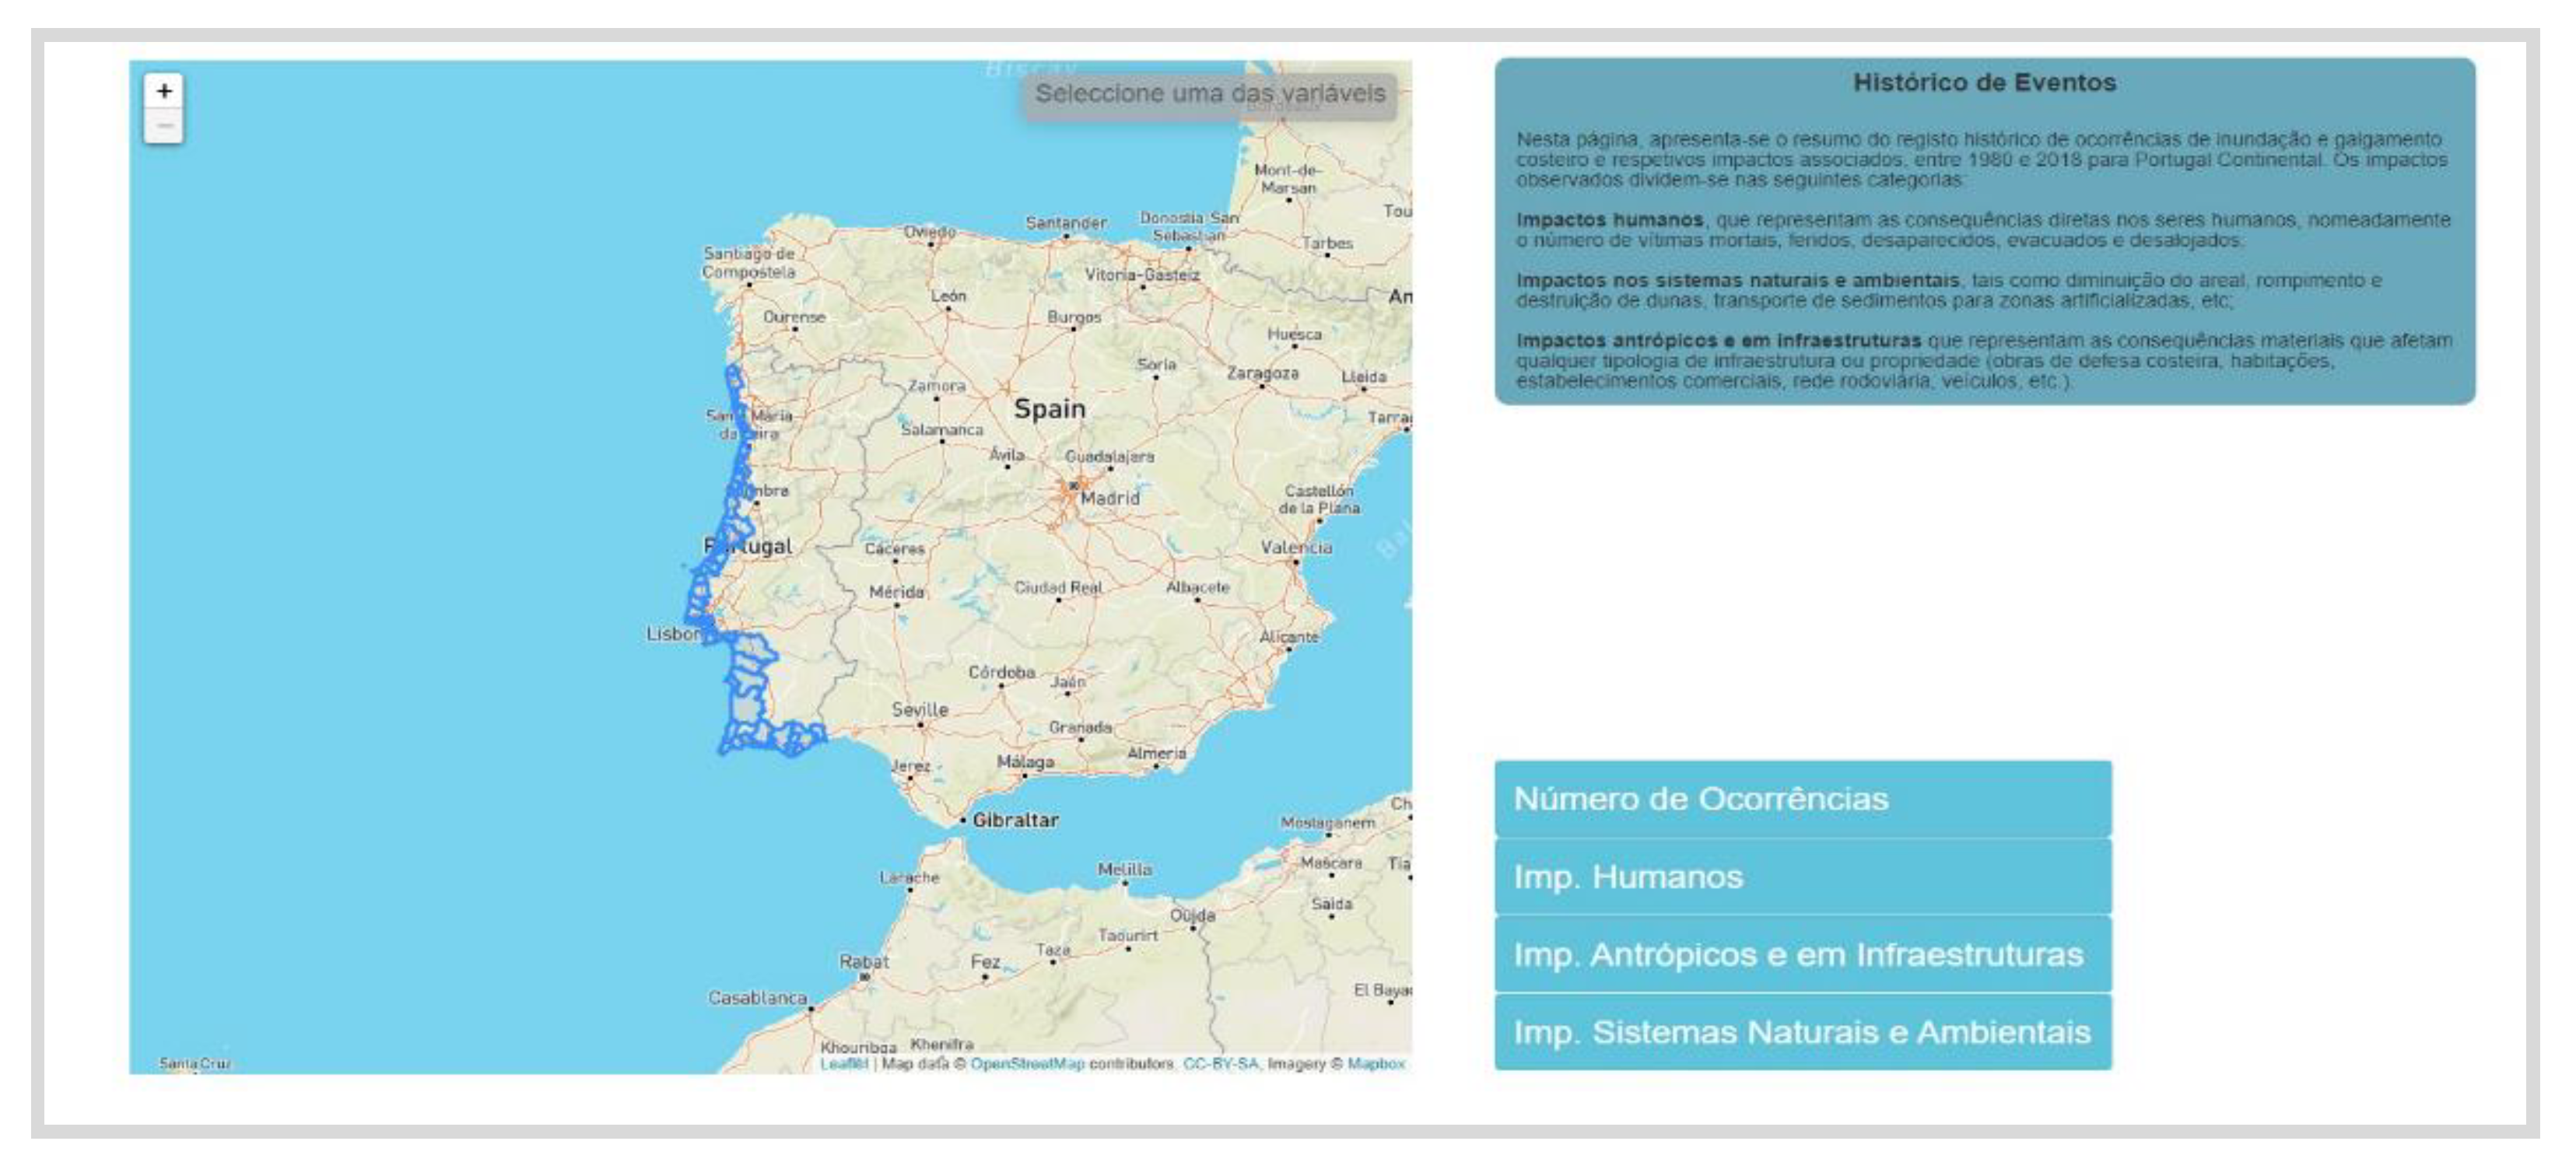
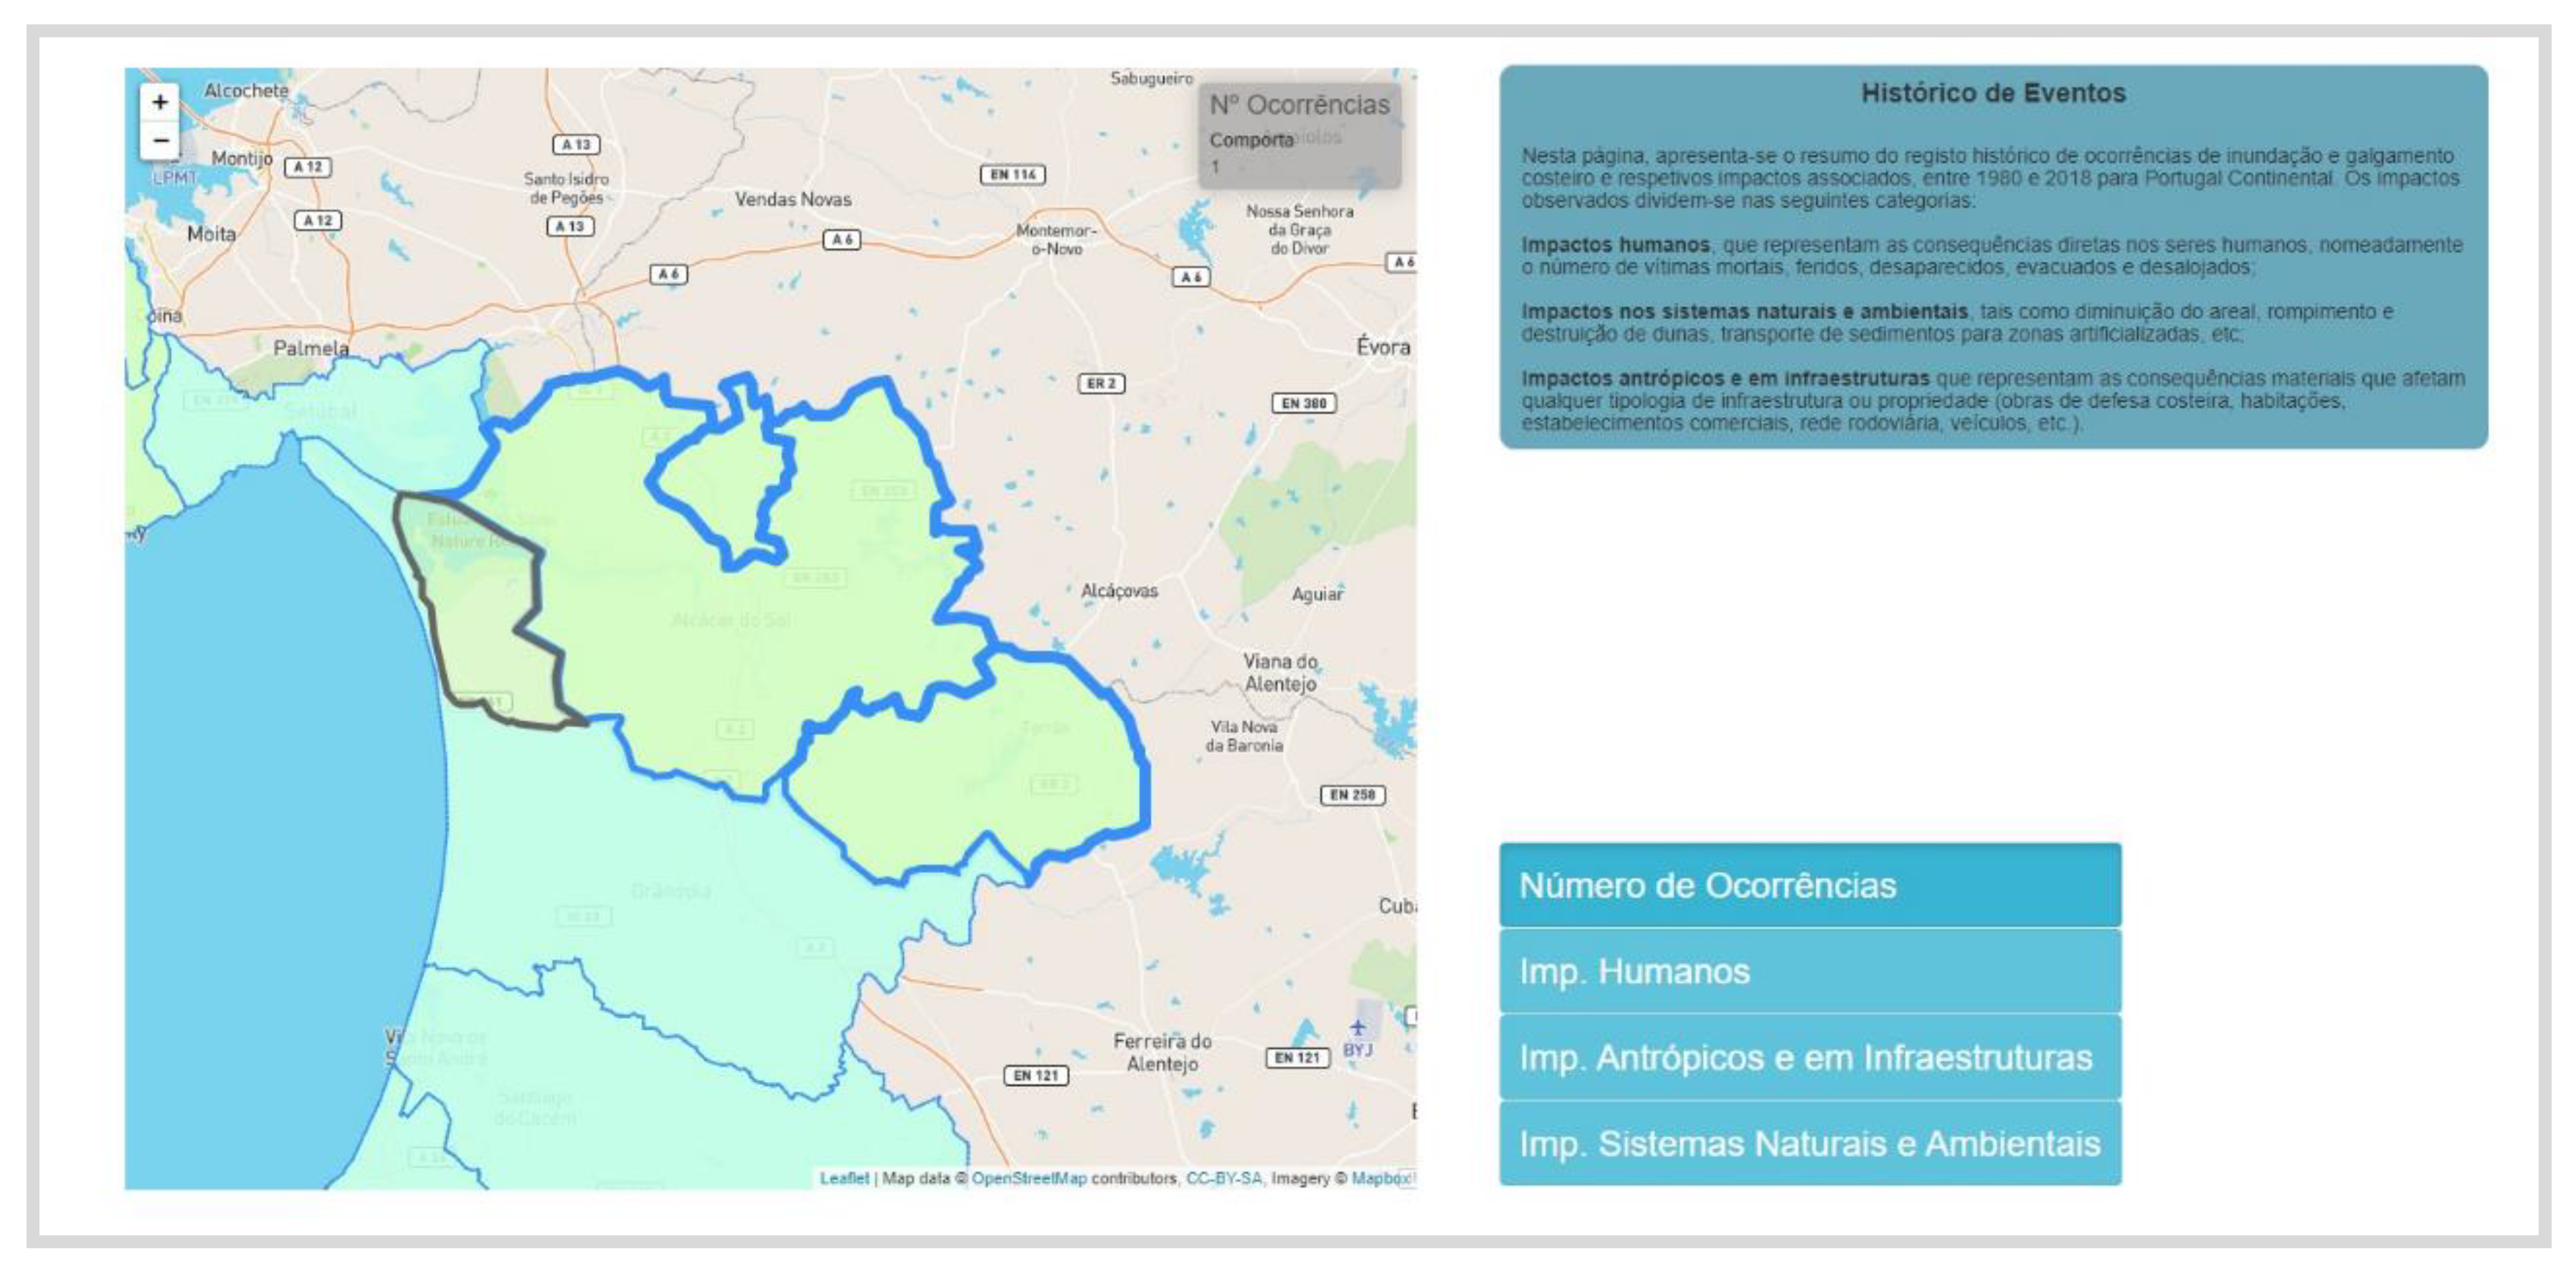
3.1.1. Historical Analysis of Past Flooding and Overtopping Events

The Historical Data of Coastal Flooding Occurrences (histórico de eventos) was created to showcase the history of flooding and the wave overtopping events in the continental Portuguese coastal zone. Data are organized along the counties located within the Portuguese shoreline. A county in Portugal is organized as a set of parishes. Parishes data for this type of occurrence are also available for analysis on this page (Figure 7).
Occurrences data include two major components. The first is a set of polygons that represents the area of a specific county or parish, while the other component is a numerical value that represents each variable that comes with the data. These variables are related to flood events:
-
Number of occurrences (número de ocorrências);
-
Impact on humans (imp. humanos);
-
Anthropic and infrastructures impact (imp. antrópicos e em infraestruturas);
-
Impact on natural and environmental system (imp. sistemas naturais e ambientais).
After the user selects a variable, a request is sent, via AJAX that activates a view on the MOSAIC backend to load the data into the interface. These data are stored in the project database and initially loaded through a Python script that handles two different shapefiles (.shp)—one corresponding to the counties and another to the parishes. The shapefiles contain polygons and attributes which are loaded and stored in the MOSAIC project database.
When the user selects a variable and a county, filtering occurs through a Django view. A view is a Python function that processes a Web request and returns a Web response. After the necessary filtering, a JSON (.json) is created and sent to the interface with the data that will be displayed on the map. Data are then loaded into the interface through a combination of pure JavaScript and the Leaflet JavaScript library (https://leafletjs.com/ (accessed on 10 May 2021)). The visualization that is created from this operation is a choropleth map, a type of thematic map where each area presented is colored proportionally to the statistic variable chosen by the user (Figure 8). The available variables to be chosen are the same that are loaded into the database initially: number of occurrences (número de ocorrências), impact on humans (imp. humanos), impact on natural and environmental systems (imp. sistemas naturais e ambientais) and anthropic and infrastructures impact (imp. antrópicos e em infraestruturas). The choropleth map is interactive through the use of both hover and on-click mechanisms.

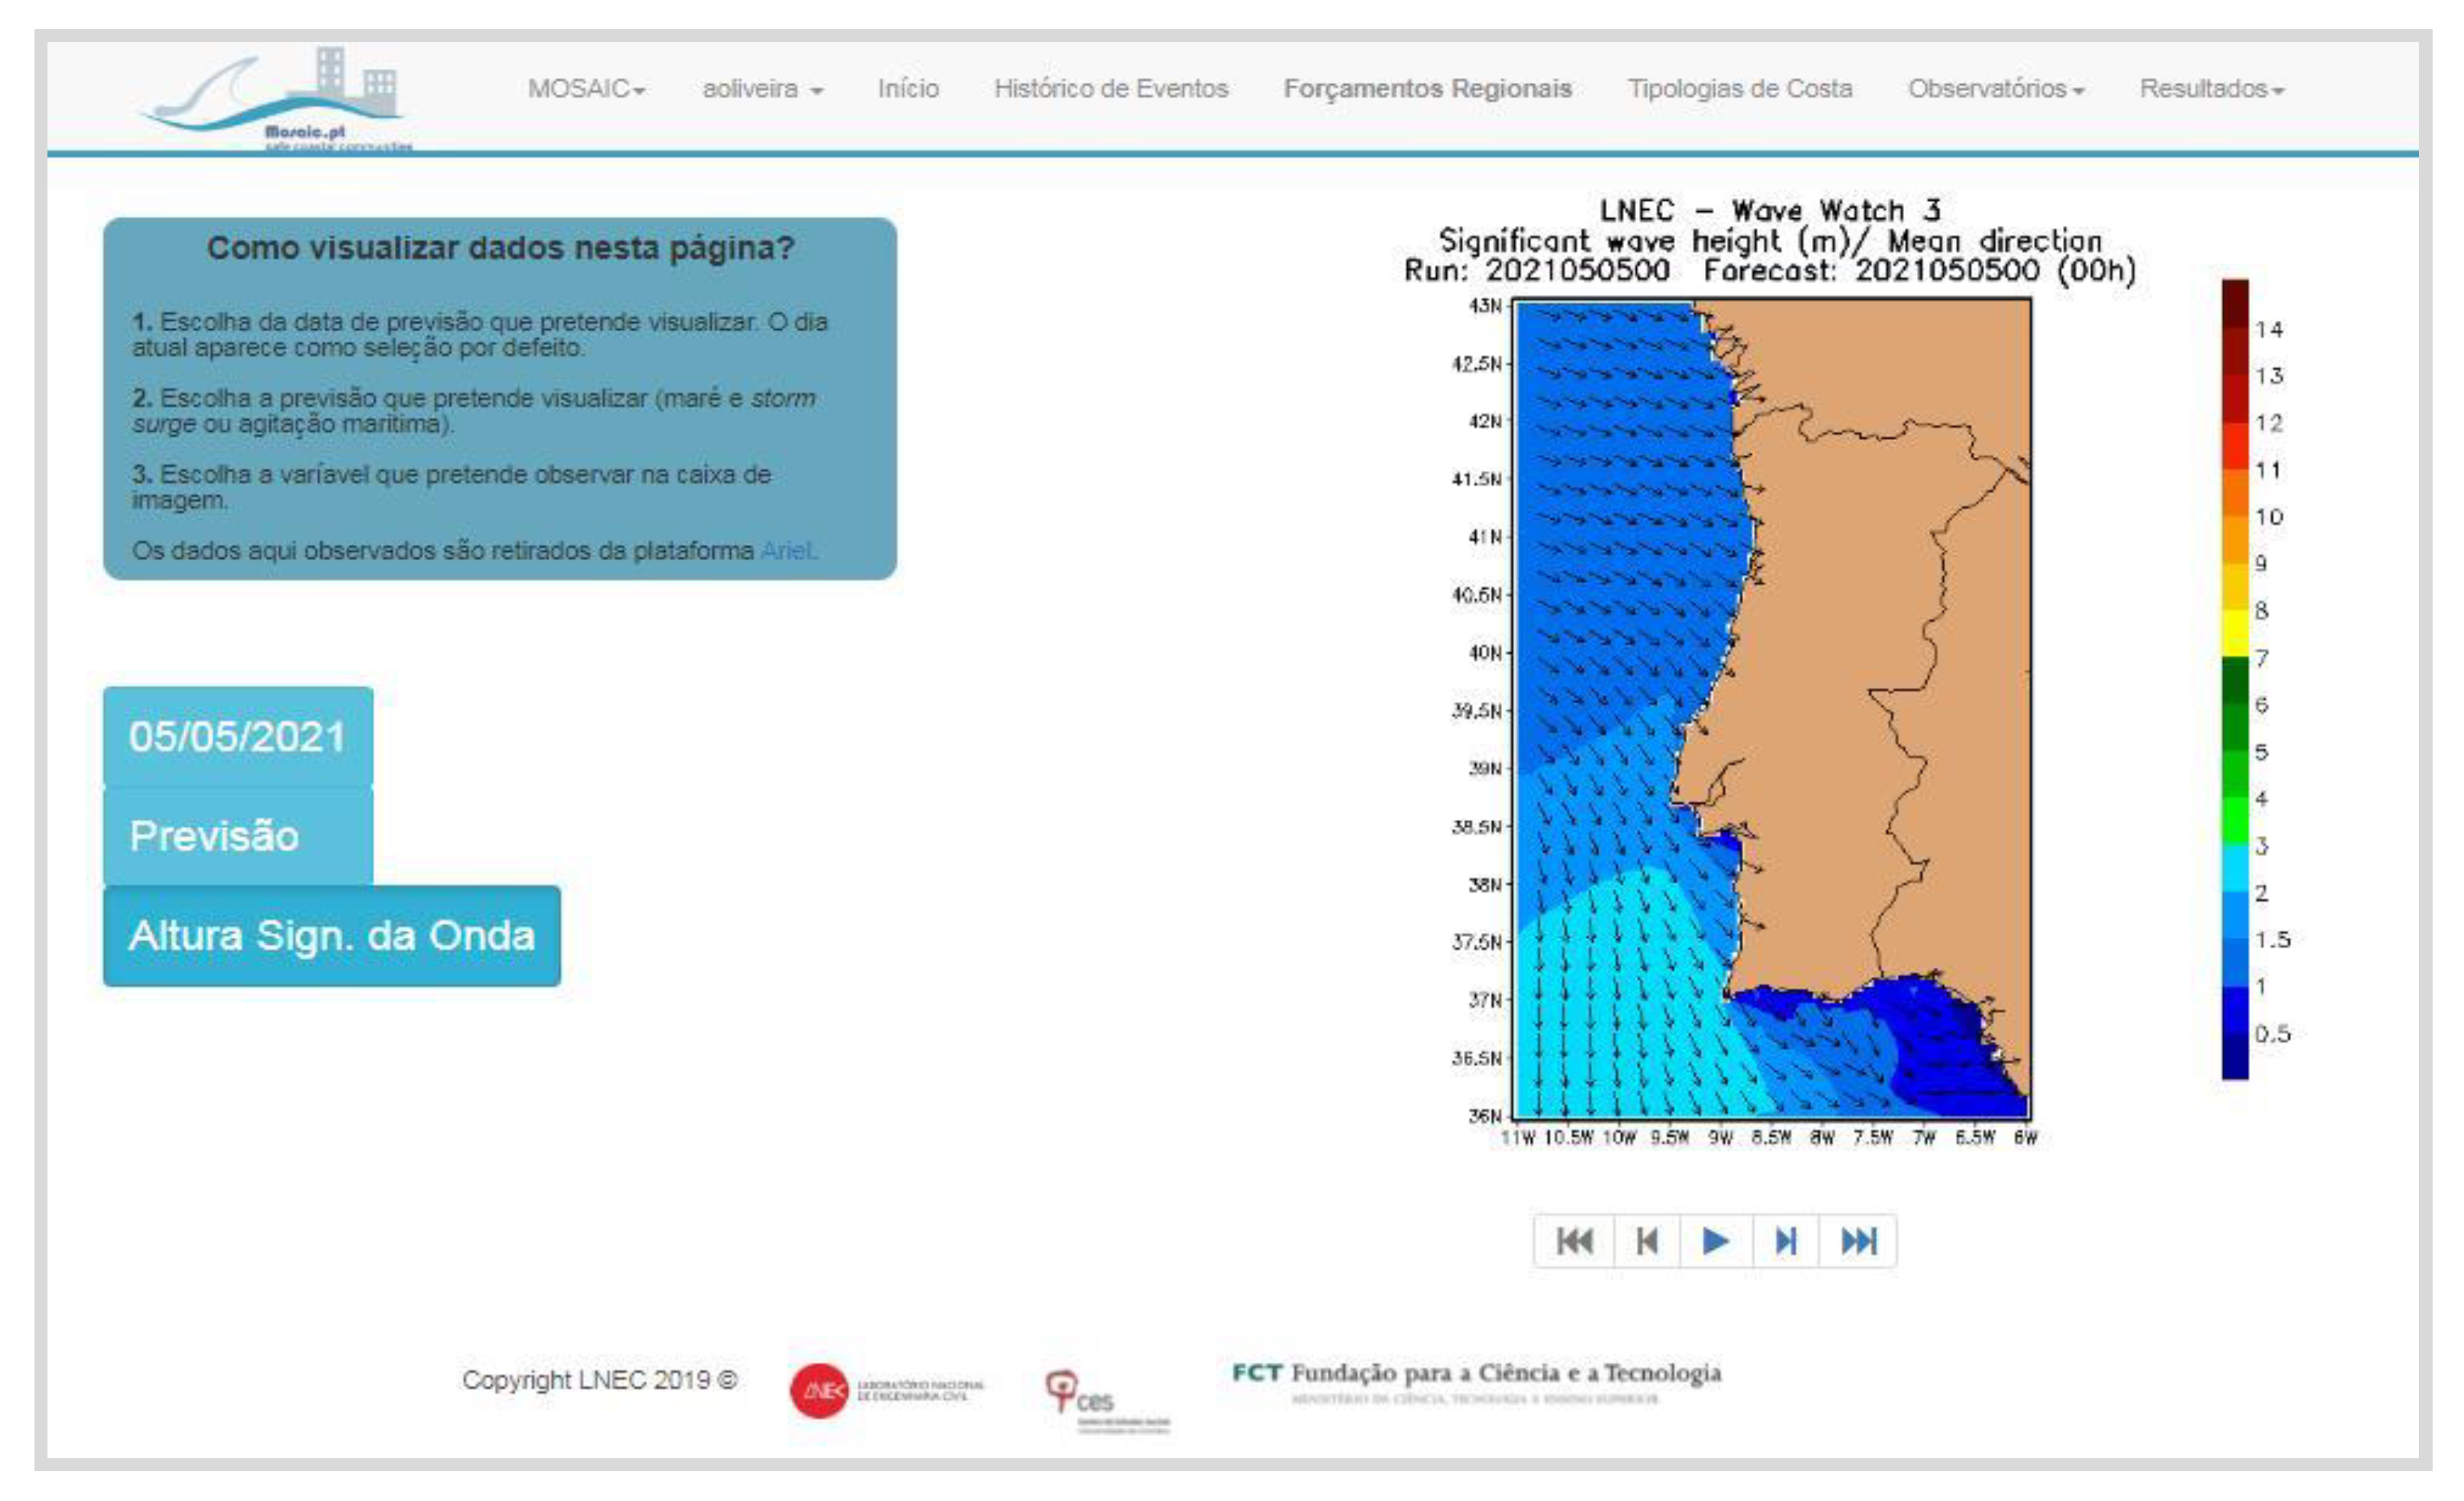
3.1.2. Regional Forcings for the Observatory Predictions

Both regional wave and storm surge (plus tidal) forecasts are provided in the webpage regional forcings (forçamentos regionais). Based on a 10-year-old public LNEC service for forecasting water dynamics on the Portuguese coast and the North Atlantic (http://ariel.lnec.pt) using the WIFF—Water Information Forecast Framework ([12,21]), the user can visualize the wave variables and water level for the next 48 h and thus anticipate any events that are generated offshore. The user is allowed to choose a date (post-January 2019) by using a calendar widget and a prediction (previsão) type variable to trigger the showcasing of the data. The predictions can be one of the following:
-
Wave climate (agitação marítima)
Significant wave height (altura significativa da onda);
Peak period (período de pico).
-
Tide and storm surge (maré e storm surge)
Sea level (nível do mar).
The prediction data are showcased as an image (Figure 9). As the image is available to download, the loading of the image into the MOSAIC interface is obtained through the use of pure Javascript and direct URL manipulation.

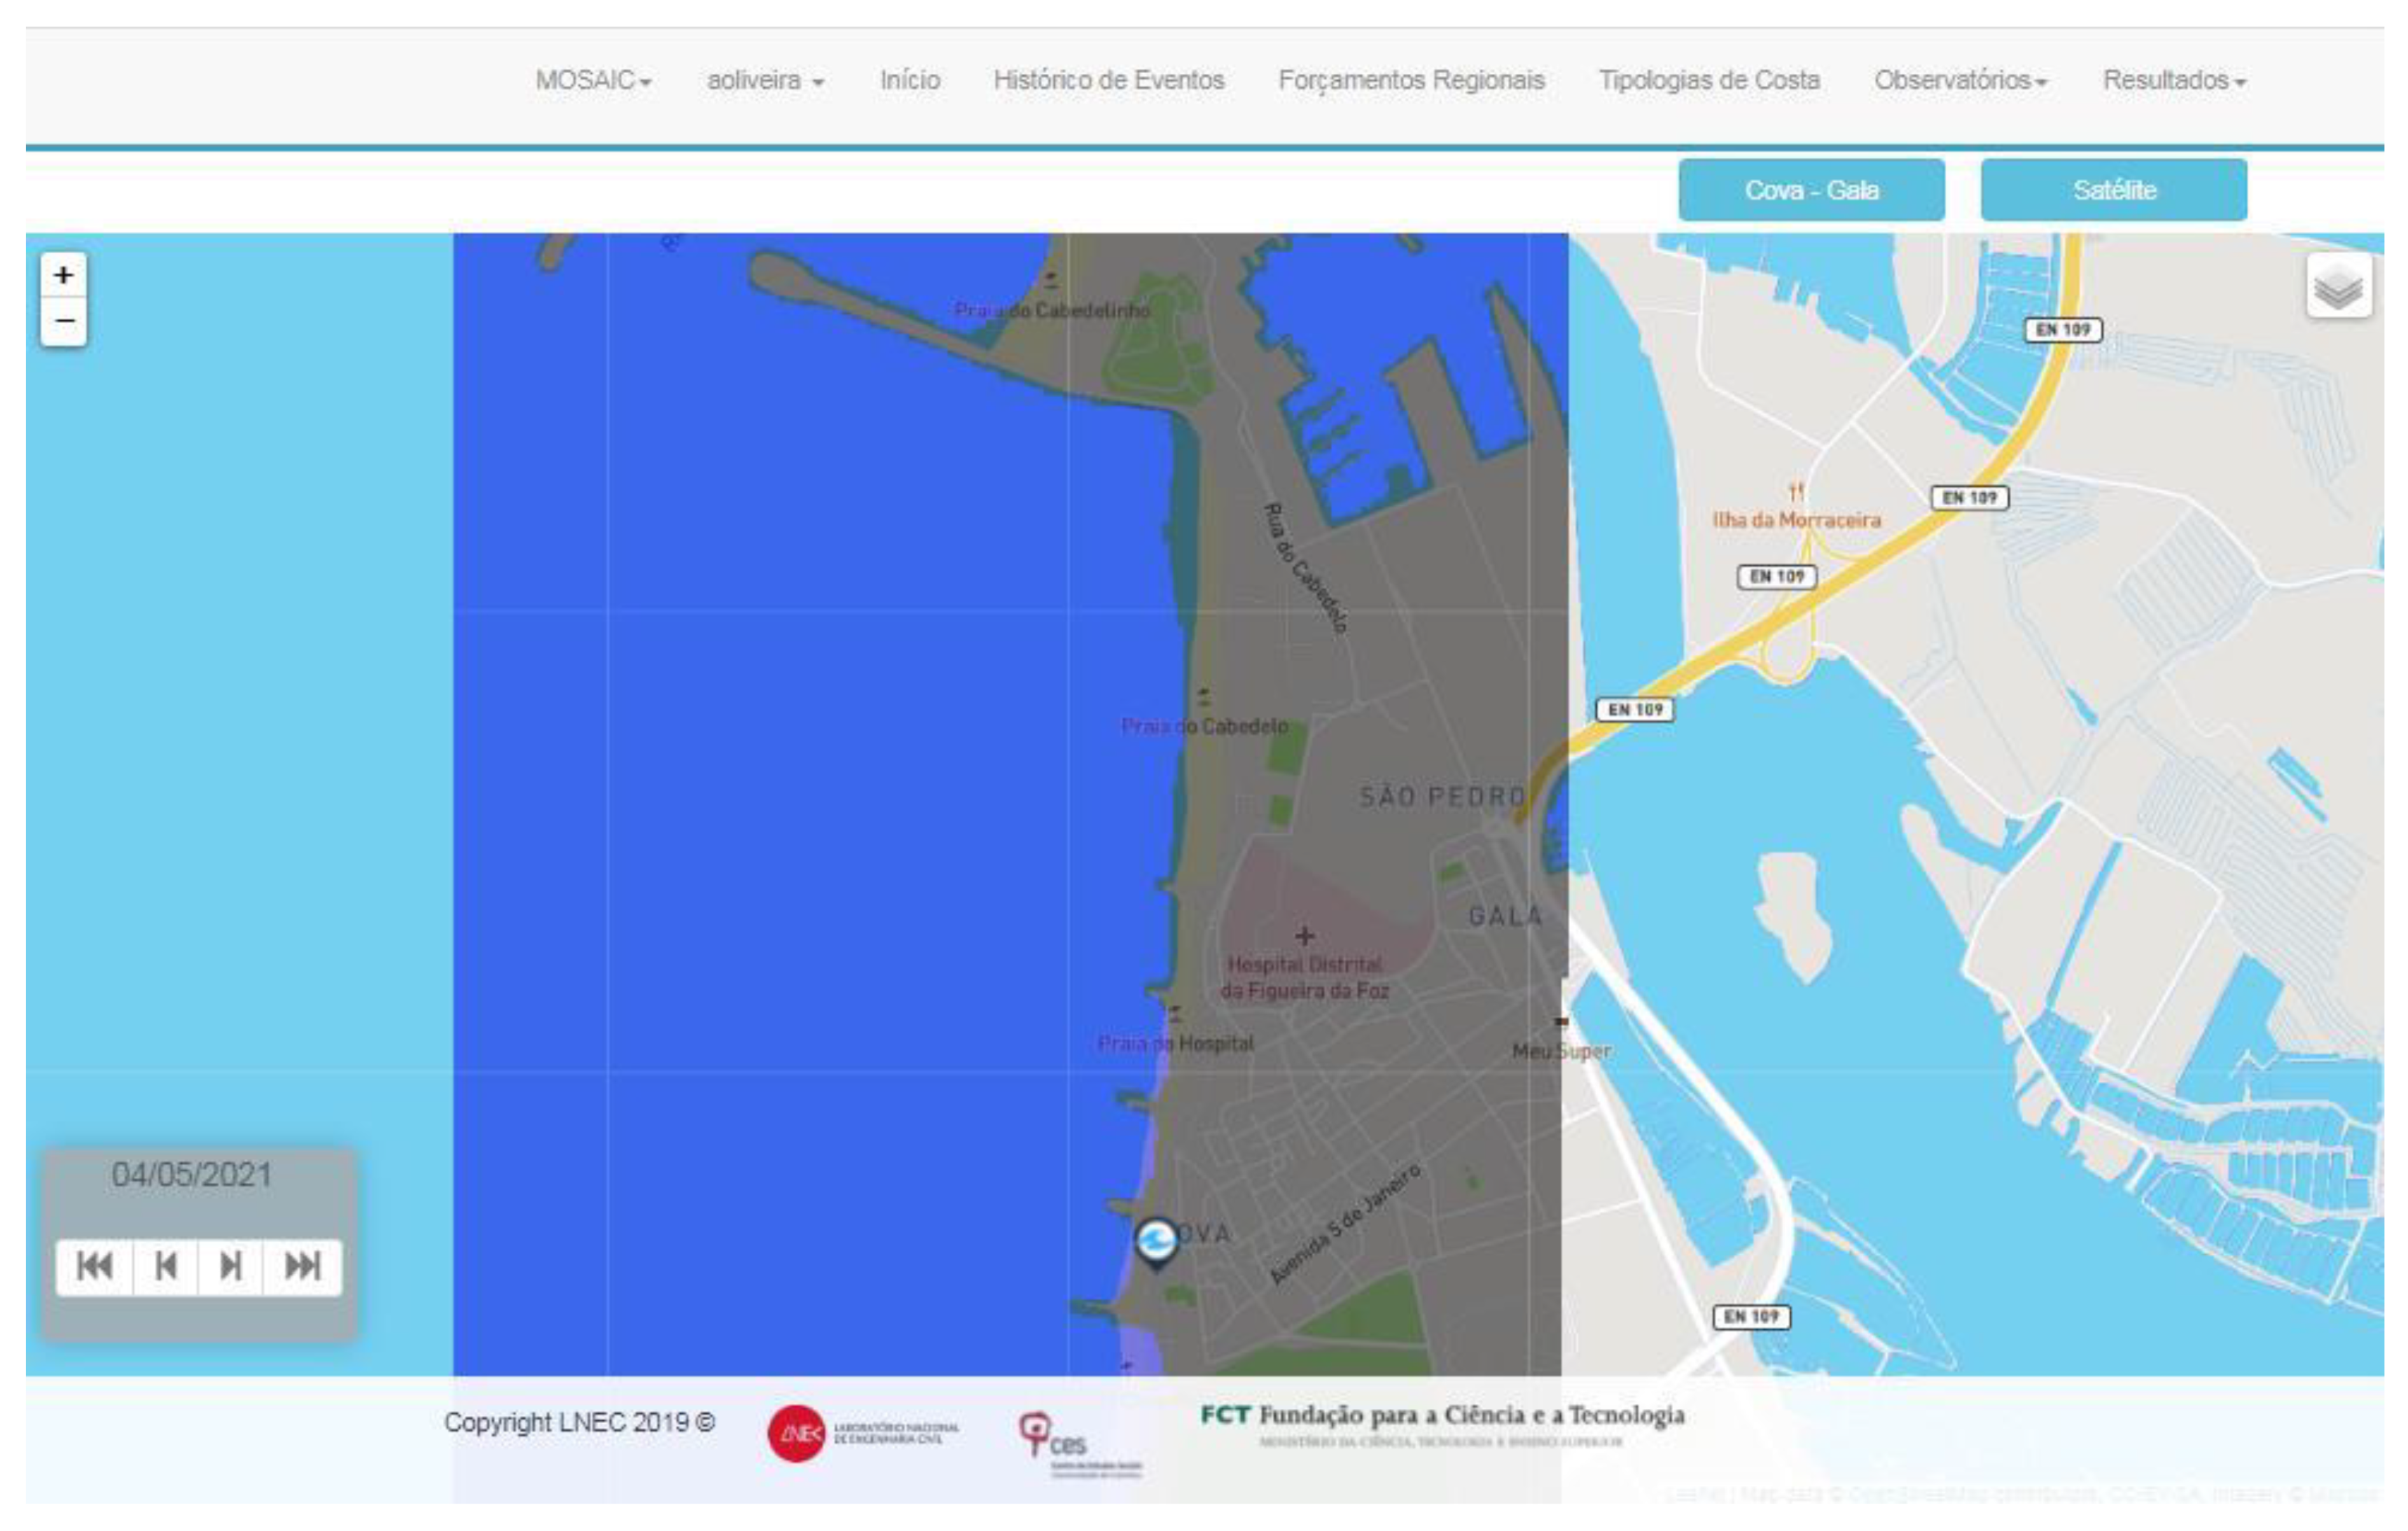
3.2. Cova-Gala Observatory
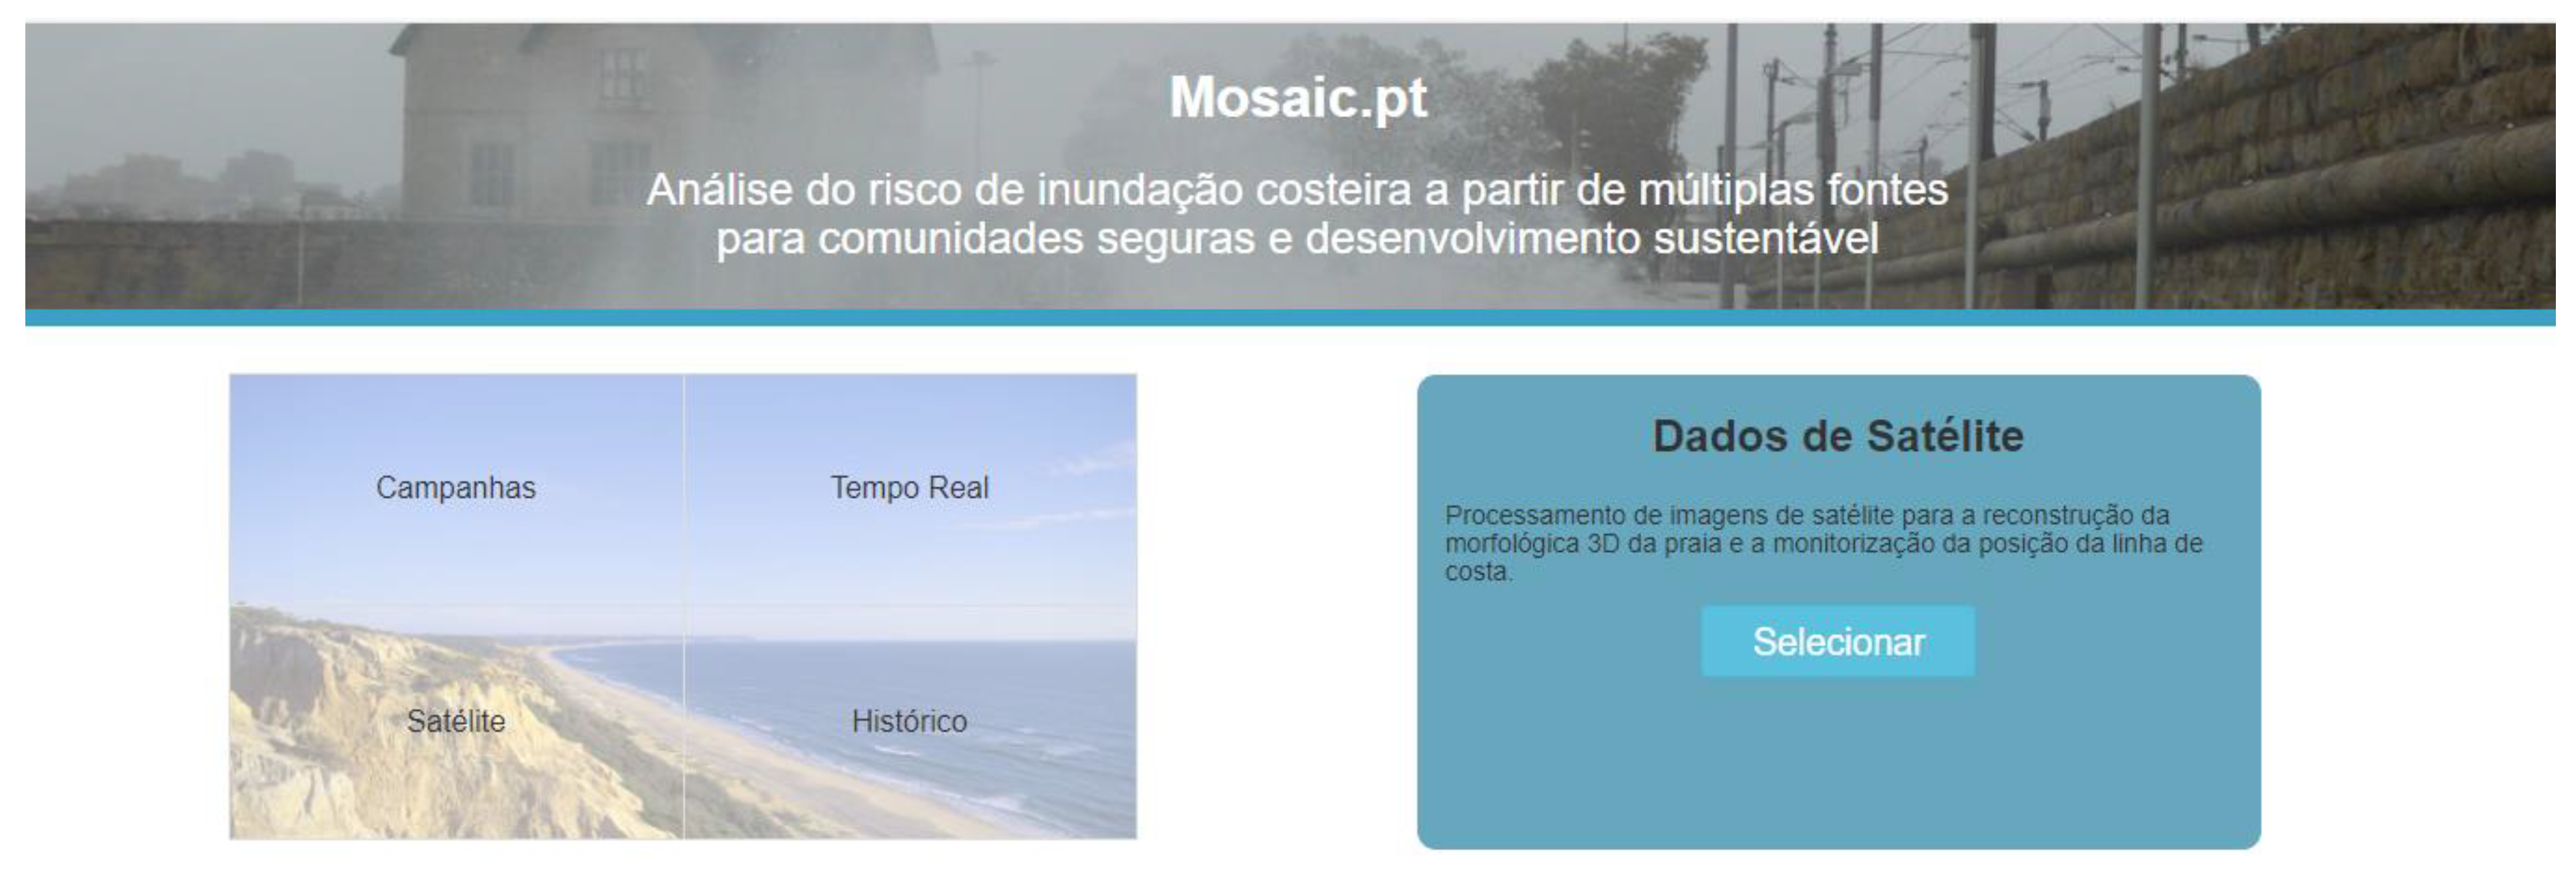
3.2.1. Overview

Although the MOSAIC platform covers the whole mainland Portuguese coast, a particular coastal observatory out of the three available in MOSAIC was selected here for a detailed assessment of hazard conditions, exposure and vulnerability: the Cova-Gala observatory. The area is a sandy-dune system located south of the Mondego river mouth, which stretches for near 50 km in the Central west Portuguese coast featuring significant geomorphological and human occupancy properties. The Cova-Gala observatory is located in the municipality of Figueira da Foz, civil parish of S. Pedro and covers an area of 72 ha.
Regarding the exposed elements, the observatory covers a heterogeneous typology ranging from residential areas, a camping site, a hospital, coffee shops, restaurants, surf schools, parking lots and fishery infrastructures. The three statistical blocks that cover the area of the Cova-Gala observatory has a total of 1363 inhabitants, although the number of residents in the observatory area is expected to be lower. The present population fluctuates considerably between the summer months (June to September) and the rest of the year. The vulnerability assessment considered 145 buildings.

3.2.2. Observatory Information

The results tab is split into multiple areas: data (dados), risk scenarios (cenários), vulnerability (vulnerabilidade), model predictions (previsões) and assimilations and alerts (assimilações e alertas). Each section provides access to the results at the best time and space resolution. This part of the interface provides all the information for both the model and prediction infrastructure and the monitoring analysis. Herein, we concentrate on two products: data with an emphasis on Sentinel data, and model predictions, illustrated by SCHISM results.
Four types of data are included in the portal (Figure 10):
-
Data related to field campaigns, which includes topographical and photogrammetric surveys, used to profile beaches, coastlines, defense structures toe, dunes foot, flooding and overtopping events at the selected observatory, and hydrodynamic data used to validate numerical models.
-
Real time data, obtained through on-site cameras, placed on each observatory. The resulting images serve as input for a Python processing algorithm, to obtain several outputs, namely the line of the offshore bar, the breaker line, the wet/dry interface line and the vegetation line. These lines are used to validate numerical models applied and validate events of overtopping or flooding. In-situ sensors are also included here.
-
Sentinel satellite data, composed of multiple satellite images that are processed and used to reconstruct the 3D morphology of beaches and to monitor the position of the shoreline.
-
Historical data of flooding and overtopping occurrences on the selected observatory (including times of occurrence, flooded area, water levels and other data).
When the user accesses the data (Dados) page, they are greeted with an interface that shares similarities with the MOSAIC home page. The main goal of this similarity is to highlight the importance of this section of the platform, by creating a small “data hub” to present the different data types.
By clicking on one of the available data types, in the 2 × 2 image-based table on the left (as shown on Figure 10), the text box on the right is updated with the corresponding data description and access button. The select (selecionar) button allows the user to finally visualize the selected data. After the selection procedure, a dedicated interface is presented for each data type. This concept is illustrated here for the processed Sentinel images, trimmed and merged to the dimensions of the observatory (Figure 11).
The water/land interface is identified by processing images from the Sentinel missions, automatically downloaded from the ESA Copernicus OpenHub. The satellite images used in this service are retrieved from Sentinel-2A and Sentinel-2B constellation, with a temporal resolution of five days. Level-2A images (bottom-of-atmosphere reflectance in cartographic geometry) were used for the calculation of the NDWI (normalized difference water index), using the green (B3—560 nm) and NIR (B8—842 nm) bands, both with 10 m pixel resolution. In summary, the service: (1) downloads the images from ESA sci-hub (https://scihub.copernicus.eu (accessed on 10 May 2021)), using the Sentinelsat API (https://pypi.org/project/sentinelsat/ (accessed on 10 May 2021)); (2) verifies if clouds do not cover the ROI (region of interest); (3) calculates the NDWI indexes for all available images for that particular ROI and period (i.e., usually the last week is considered); (4) afterwards, an automatic threshold is applied to determine the water-land interface; and finally (5) the water mask results are shown in the service portal.
In order to ensure that the images correspond to the area of the selected observatory, the script uses a predefined bounding box of the observatory area. The images are downloaded every five days, which corresponds to the revisit time of the Sentinel mission over this coast, using RabbitMQ and Celery to schedule and run a periodic task. The downloaded and cropped images are then binarized to identify the land and water pixels. The resulting binary image is rasterized and stored in the project database.
Based on the observatory chosen by the user, Django orchestrates the building of a JSON file with the latest rasters. The rasters are then loaded into the Leaflet map, which allows for selected the binarized image being visualized in the map. The satellite data interface allows switching between observatories and provides the possibility to return to the data hub.
Forecast results from both SCHISM and XBeach models are available in the forecasts (previsões) page of the interface. The user can select the variable and model to be visualized on the map, built using Leaflet. This selection triggers the choice of the hour of the day for the prediction to be visualized, over a 48 h period, provided by the OPENCoastS service. The layers are created by the OPENCoastS engine and are obtained through a direct, customizable URL (Figure 12).
The URL is directly accessed through Javascript and imported into the map via the Leaflet library. The URL allows the customization of the layer, which can come from either of the two models in the modeling infrastructure: SCHISM and XBEACH.

4. Discussion

The risk management in complex territories subject to multiple sources of hazards, such as North Atlantic coastal zones, requires integrated and user-targeted approaches that can scientifically support emergency interventions and long-term planning initiatives alike. IT platforms, integrating multiple sources of information, from either in-situ or remote sensing devices, or high-resolution process-based modelling systems, are the stepping-stones to address these challenges and constitute a single point of access to all required knowledge for timely and comprehensive coastal risk management. The MOSAIC platform introduced herein takes advantage of agile computer science technologies and multidisciplinary research knowledge and tools to provide real-time and long-term responses to coastal risks of inundation and erosion applied to the North Atlantic coasts. This platform materializes an innovative multi-hazard framework for coastal risks, assimilating in-situ and satellite remote sensing data with real-time forecast results under the concept of observatories. The platform is demonstrated herein in the western Portuguese coast, focusing on the Cova-Gala observatory. This demonstration included the implementation of a forecast using models SCHISM and XBeach through the WIFF framework [12]. This framework allows modelers to build and operate forecasts based on these two models. While the implementation of these forecasts requires both expert knowledge and computational resources, these requirements can be alleviated using OPENCoastS [20]. OPENCoastS automates the generation and automation of forecasts powered by SCHISM and simultaneously provides the required computational resources.

5. Conclusions

The MOSAIC platform will continue to grow in the near future, in particular by extending the modeling and monitoring suite to overtopping processes. This challenge will be implemented through both empirical formulae (e.g., [27]) and the application of numerical models for overtopping processes, duly validated with remote sensing data. Given the small scales of the overtopping processes in many areas, other high-resolution, near real-time remote sensing data sources such as Pleiades images should be integrated. This integration can be achieved through the remote sensing services under development in the EOSC-Synergy’s Worsica service.
Data assimilation efforts based on remote sensing data are also planned to be extended to bathymetric evolution. During energetic events, the rapid bathymetric evolution can cause considerable errors in the inundation and overtopping forecasts.
Monitoring and forecasting platforms such as MOSAIC can support emergency planning and response at local level, contribute for risk management for multiple hazards, performing new safety comprehensive approaches for coastal areas that can help stakeholders in decision-making.

Author Contributions

M.R.—main platform developer and collaborator in paper writing. A.O.—main platform and monitoring platform creator and lead paper writer. P.F.—lead risk framework creator, collaborator in paper writing. A.B.F.—creator of the modeling infrastructure, lead SCHISM and regional forcings modeling application developer, major collaborator in paper writing. A.N.—execution of XBEACH and SCHISM model application, responsible for the deployment of Cova-Gala model in OPENCoastS, collaborator in paper writing. J.L.B.—development and implementation of the regional event impacts database, support to implementation of this database in the platform. A.A.—creator of the remote sensing image processing algorithm and support to its implementation and validation. F.S.B.F.O.—co-creator of the modeling infrastructure, lead XBEACH modeling application developer, collaborator in paper writing. J.R.—lead developer of WIFF, responsible for data repository. G.J.—collaborator in paper writing, support in implementation of the remote sensing workflow. R.J.M.—support in implementation of the remote sensing workflow. P.P.S.—co-creator of the regional event impacts database, collaborator in paper writing. A.O.T.—co-creator of risk framework, co-creator of the regional event impacts database, collaborator in paper writing. J.O.—support to XBEACH implementation. All authors have read and agreed to the published version of the manuscript.

Funding

This paper is part of the work of project MOSAIC.pt (PTDC/CTA-AMB/28909/2017), funded by the Fundação para a Ciência e a Tecnologia (FCT). Pedro Pinto Santos is funded by FCT through the project with the reference CEEIND/00268/2017. The simulations of the numerical models were supported by FCT’s infrastructures project CPU4MOSAIC (CPCA/A1/7240/2020) and the OPENCoastS service is offered by INCD through project INCD (LISBOA-01-0145-FEDER-022153) funded by Lisboa2020 Operational Program.

Data Availability Statement

No new data were created or analyzed in this study. Data sharing is not applicable to this article.

Conflicts of Interest

The authors declare no conflict of interest.

References

  1. Nicholls, R.J.; Cazenave, A.A. Sea-Level Rise and Its Impact on Coastal Zones. Science 2010, 328, 1517–1520. [Google Scholar] [CrossRef] [PubMed]
  2. IPCC. Climate Change 2013: The Physical Science Basis. Contribution of Working Group I to the Fifth Assessment Report of the Intergovernmental Panel on Climate Change; Stocker, T.F., Qin, D., Plattner, G.K., Tignor, M., Allen, S.K., Boschung, J., Nauels, A., Xia, Y., Bex, V., Midgley, P.M., Eds.; Cambridge University Press: Cambridge, UK; New York, NY, USA, 2013; p. 1535. [Google Scholar]
  3. Islam, M.A.; Mitra, D.; Dewan, A.; Akhter, S.H. Coastal multi-hazard vulnerability assessment along the Ganges deltaic coast of Bangladesh–A geospatial approach. Ocean. Coast. Manag. 2016, 127, 1–15. [Google Scholar] [CrossRef]
  4. Vitousek, S.; Barnard, P.L.; Fletcher, C.H.; Frazer, N.; Erikson, L.; Storlazzi, C.D. Doubling of coastal flooding frequency within decades due to sea-level rise. Sci. Rep. 2017, 7, 1399. [Google Scholar] [CrossRef] [PubMed]
  5. Chaumillon, E.; Bertin, X.; Fortunato, A.B.; Bajo, M.; Schneider, J.-L.; Dezileau, L.; Walsh, J.P.; Michelot, A.; Etienne, C.; Créac, A.; et al. Storm-induced marine flooding: Lessons from a multidisciplinary approach. Earth-Sci. Rev. 2017, 165, 151–184. [Google Scholar] [CrossRef] [Green Version]
  6. Freire, P.; Oliveira, F.S.B.F.; Oliveira, J.N.C. Coastal Flooding Process: Comparing Different Coastal Typologies Response to Extreme Hydrodynamic Conditions. J. Coast. Res. 2020, 95, 797–802. [Google Scholar] [CrossRef]
  7. Bruneau, N.; Fortunato, A.B.; Dodet, G.; Freire, P.; Oliveira, A.; Bertin, X. Future evolution of a tidal inlet due to changes in wave climate, Sea level and lagoon morphology (Óbidos lagoon, Portugal). Cont. Shelf Res. 2011, 31, 1915–1930. [Google Scholar] [CrossRef]
  8. Bertin, X.; Prouteau, E.; Letetrel, C. A significant increase in wave height in the North Atlantic Ocean over the 20th century. Glob. Planet. Chang. 2013, 106, 77–83. [Google Scholar] [CrossRef]
  9. Gomes, J.L.; Jesus, G.; Rogeiro, J.; Oliveira, A.; Costa, R.; Fortunato, A. Molines–towards a responsive Web platform for flood forecasting and risk mitigation. In Proceedings of the Federated Conference on Computer Science and Information Systems, Lodz, Poland, 13–16 September 2015; Volume 5, pp. 1171–1176. [Google Scholar] [CrossRef] [Green Version]
  10. Khalid, A.; Ferreira, C.M. Advancing real-time flood prediction in large estuaries: iFLOOD a fully coupled surge-wave automated web-based guidance system. Environ. Model. Softw. 2020, 131. [Google Scholar] [CrossRef]
  11. Knight, P.J.; Prime, T.; Brown, J.M.; Morrissey, K.; Plater, A.J. Application of flood risk modelling in a web-based geospatial decision support tool for coastal adaptation to climate change. Nat. Hazard. Earth Syst. Sci. 2015, 15, 1457–1471. [Google Scholar] [CrossRef] [Green Version]
  12. Fortunato, A.B.; Oliveira, A.; Rogeiro, J.; Costa, R.T.; Gomes, J.L.; Li, K.; Jesus, G.; Freire, P.; Rilo, A.; Mendes, A.; et al. Operational forecast framework applied to extreme sea levels at regional and local scales. J. Oper. Oceanogr. 2017, 10, 1–15. [Google Scholar] [CrossRef]
  13. Azevedo, A.; Fortunato, A.B.; Epifânio, B.; den Boer, S.; Oliveira, E.R.; Alves, F.L.; Jesus, G.; Gomes, J.L.; Oliveira, A. An oil risk management system based on high-resolution hazard and vulnerability calculations. Ocean. Coast. Manag. 2017, 136, 1–18. [Google Scholar] [CrossRef] [Green Version]
  14. Rodrigues, M.; David, L.M.; Oliveira, A.; Fortunato, A.B.; Menaia, J.; Costa, J.; Mota, T.; Rogeiro, J.; Jesus, G.; Morais, P.G.; et al. On-line monitoring of CSO: Sewer and receiving waters. In Climate Change, Water Supply and Sanitation: Risk Assessment, Management, Mitigation and Reduction; IWA Publishing: London, UK, 2015; pp. 69–74. [Google Scholar]
  15. Rodrigues, M.; Martins, R.; Rogeiro, J.; Fortunato, A.B.; Oliveira, A.; Cravo, A.; Jacob, J.; Rosa, A.; Azevedo, A.; Freire, P. A web-based observatory for biogeochemical assessment in coastal regions. J. Environ. Inform. 2021, in press. [Google Scholar] [CrossRef]
  16. Swail, V.; Grimes, S.; Pilon, P.; Canterford, R.; Barrett, C.; Simonov, Y. Early Warnings of Coastal Inundation; World Meteorological Organization: Geneva, Switzerland, 2019; Volume 68, Available online: https://public.wmo.int/en/resources/bulletin/early-warnings-of-coastal-inundation (accessed on 10 May 2021).
  17. Environment Agency. UK Coastal Monitoring and Forecasting (UKCMF) Service-Strategy for 2009 to 2019. Available online: https://assets.publishing.service.gov.uk/government/uploads/system/uploads/attachment_data/file/292919/geho1009brfe-e-e.pdf (accessed on 10 May 2021).
  18. Freire, P.; Fortunato, A.B.; Tavares, A.; Oliveira, A.; Santos, P.P. Multi-source flood risk analysis for safe coastal communities and sustainable development. In 5ª Conferência sobre Morfodinâmica Estuarina e Costeira-Livro de Resumos; Faculdade de Ciências da Universidade de Lisboa: Lisboa, Portugal, 2019; pp. 71–72. ISBN 978-989-20-9612-4. [Google Scholar]
  19. Barros, J.L.; Freire, P.; Perdiz, L.; Tavares, A.O. Flooding Occurrences in the Portuguese Continental Coastal Zone: A Database for the Period 1980–2018. In E-Proceedings of the 30th European Safety and Reliability Conference and 15th Probabilistic Safety Assessment and Management Conference (ESREL2020 PSAM15); Baraldi, P., di Maio, F., Zio, E., Eds.; Research Publishing Services: Tamil Venice, Italy, 2020. [Google Scholar]
  20. Oliveira, A.; Fortunato, A.B.; Rogeiro, J.; Teixeira, J.; Azevedo, A.; Lavaud, L.; Bertin, X.; Gomes, J.; David, M.; Pina, J.; et al. OPENCoastS: An open-access service for the automatic generation of coastal forecast systems. Environ. Model. Softw. 2020, 124, 104585. [Google Scholar] [CrossRef]
  21. Rogeiro, J.; Rodrigues, M.; Azevedo, A.; Oliveira, A.; Martins, J.P.; David, M.; Pina, J.; Dias, N.; Gomes, J. Running high resolution coastal models in forecast systems: Moving from workstations and HPC cluster to cloud resources. Adv. Eng. Softw. 2018, 117, 70–79. [Google Scholar] [CrossRef]
  22. Zhang, Y.J.; Ye, F.; Stanev, E.V.; Grashorn, S. Seamless cross-scale modeling with SCHISM. Ocean Model. 2016, 102, 64–81. [Google Scholar] [CrossRef] [Green Version]
  23. Roelvink, D.; Reniers, A.; Dongeren, A.; Vries, J.T.; Mccall, R.; Lescinsky, J. Modelling storm impacts on beaches, dunes and barrier islands. Coast. Eng. 2009, 56, 1133–1152. [Google Scholar] [CrossRef]
  24. Roelvink, D.; McCall, R.; Mehvar, S.; Nederhoff, K.; Dastgheib, A. Improving predictions of swash dynamics in XBeach: The role of groupiness and incident-band runup. Coast. Eng. 2018, 134, 103–123. [Google Scholar] [CrossRef]
  25. Nahon, A.; Fortunato, A.B.; Azevedo, A.; Oliveira, F.S.B.F.; Oliveira, J.N.C.; Rogeiro, J.; Jesus, G.; Oliveira, A.; Silva, P.A.; Freire, P. Implementation and validation of an operational forecasting system for nearshore hydrodynamics with OPENCoastS. In Atas das 6as Jornadas de Engenharia Hidrográfica/1as Jornadas Luso-Espanholas de Hidrografia; Instituto Hidrográfico: Lisboa, Portugal, 2020; pp. 203–206. [Google Scholar]
  26. Jesus, G.; Casimiro, A.; Oliveira, A. Using Machine Learning for Dependable Outlier Detection in Environmental Monitoring Systems. Trans. Cyber-Phys. Syst. 2021, in press. [Google Scholar]
  27. Mase, H.; Tamada, T.; Yasuda, T.; Hedges, T.S.; Reis, M.T. Wave Runup and Overtopping at Seawalls Built on Landand in Very Shallow Water. J. Waterw. Port Coast. Ocean. Eng. 2013, 139, 346–357. [Google Scholar] [CrossRef]
Figure 1. Model Chain Workflow.
Applsci 11 05253 g001
Figure 2. Monitoring framework workflow. In the inset, the forecasting workflow is detailed, where the following acronyms stand for: BCs: boundary conditions, FES2014—the Finite Element Solution Global Ocean Tidal Atlas (2014 results), WW3: WaveWatch 2 model, GFS—(weather) Global Forecast System (from NOAA) as an alternative to Arpege, the French National Centre for Meteorological Research European/Global Numerical Weather Prediction Model, WWM—wind wave model.
Applsci 11 05253 g002
Figure 3. Welcome dashboard of the platform.
Applsci 11 05253 g003
Figure 4. Main dashboard and help center.
Applsci 11 05253 g004
Figure 5. MOSAIC platform workflow.
Applsci 11 05253 g005
Figure 6. Observatory selection options: map (background) or list pop-up.
Applsci 11 05253 g006
Figure 7. Default view of the Historical Data of Coastal Flooding Occurrences page, with no county or variable chosen.
Applsci 11 05253 g007
Figure 8. View of the Historical Data of Coastal Flooding Occurrences page when “number of occurrences” (número de ocorrências) is selected as variable and Alcácer do Sal is the county selected on the map.
Applsci 11 05253 g008
Figure 9. Sample significant wave height predictions. The user can use the slider to move back and forth in time.
Applsci 11 05253 g009
Figure 10. View of the data (dados) page. In this example, satellite data (dados de satélite) was pre-selected on the left (image-based) table. The actual data are accessed by clicking on the box on the right.
Applsci 11 05253 g010
Figure 11. Sample land/water interface at the Cova-Gala observatory represented by dark (land) and blue (water) pixels.
Applsci 11 05253 g011
Figure 12. Sample water elevation layer for the SCHISM prediction at the Cova-Gala observatory. The dark blue box provides instructions on how to select the model, variable and date.
Applsci 11 05253 g012
Publisher’s Note: MDPI stays neutral with regard to jurisdictional claims in published maps and institutional affiliations.

