Article

Wheat Bread Fortification: The Supplement of Teff Flour and Chia Seeds

1
Department of Carbohydrate Technology and Cereal Processing, University of Agriculture in Krakow, Balicka 122, 30-149 Kraków, Poland
2
Department of Engineering and Machinery in Food Industry, University of Agriculture in Krakow, 30-149 Kraków, Poland
3
Department of Agricultural and Environmental Chemistry, University of Agriculture in Krakow, 30-149 Kraków, Poland
*
Author to whom correspondence should be addressed.
Appl. Sci. 2021, 11(11), 5238; https://doi.org/10.3390/app11115238
Submission received: 28 April 2021 / Revised: 26 May 2021 / Accepted: 31 May 2021 / Published: 4 June 2021
(This article belongs to the Special Issue Carbohydrate Chemistry and Cereal Science)

Abstract

:
The evaluation of the quality and contents of nutritionally important chemical components in wheat bread fortified with teff flour and chia seed was shown. In the work, the quality was determined by means of the volume, total baking loss and yield and also by performing organoleptic evaluation. Moreover, the staling process in bread was also investigated. The research covers wheat bread (standard) and bread supplemented with 5, 10 and 15% of teff flour as well as bread with 5 and 10% of chia seed. It was found that the addition of teff flour or chia seeds significantly influenced all the quality characteristics. In the organoleptic evaluation, all the bread obtained was of the best quality. Moreover, in both teff flour and chia seed fortified bread it was established that they contained a higher content of protein, fat, ash and dietary fibre compared to pure wheat products. Therefore, the described fortifying raw materials can be considered a wholesome raw material in bakery production.

1. Introduction

Most bakery products are mainly made of various types of light wheat flour obtained from cereal grain endosperm. During the classic grinding of wheat into quality flours, the vast majority of valuable ingredients, such as fibre, antioxidants and vitamins, remain in the bran [1]. Therefore, from a nutritional point of view, the enrichment of bread flour is fully justified. However, only in some cases of flour enrichment by adding some synthetic ingredients, such as minerals or vitamins, is performed by mills. It is worth noting however, that it is more beneficial in terms of both nutrition and better consumer perception, to enrich products with natural additives [2].
In order to obtain a higher nutritional value of bread, some additives of animal origin, including milk and dairy products or those of plant origin, (e.g., cereals, various types of seeds, including oilseeds and different legumes, as well as fresh and dried fruit and vegetables, herbs and high-protein or high-fibre preparations) may be added [1,3].
There are many possibilities of enriching bread with plant additives, and the use of a given raw material in the right amount may have a positive effect not only on the nutritional value, but also on the quality features of bread baked with its addition [4,5].
There is also an increasing interest in (teff) as well as in chia seeds as an additive within the baking industry [6,7].
Teff (Eragrostis teff), is one of the oldest cereals of African origin. Teff is a so called “low-risk crop”, so it can be grown in harsh environmental conditions where most cereals do not yield a profitable crop. It is an easy-to-grow cereal due to its low soil requirements and very low water demand. The unique advantage of teff is that it tolerates perfectly prolonged storage without requiring any special conditions [8,9,10]. Teff contains fat that is not very prone to becoming rancid [9,11]. In recent years, the cultivation of teff in the world has increased significantly due to the presence of many valuable nutrients in this grain. Due to its very small size (diameter of about 1 mm, the mass of one thousand grains about 0.26–0.42 g), the teff grains are ground whole [10]. Teff flour is therefore always a whole grain flour, with a very attractive nutritional profile, and at the same time it does not contain gluten proteins, so it can be used in the production of healthy, dietary, gluten-free cereal products. The cereal is also a source of many minerals including iron, magnesium, calcium, aluminum, zinc, copper, phosphorus and barium [10]. The amount of iron (7.63 mg/100 g) in this grain deserves special attention [9]. It is estimated that a consumption of 100 g of teff provides 22.8% and 12.8% of the daily requirement of this element for both women and men, respectively. It is also worthwhile to emphasise that teff grain and flour contain thiamine and, as the only cereal, vitamin C (0.25–0.3 mg/100g).
On the other hand, chia (Salvia hispanica L.) comes from central and southern Mexico and Guatemala and was already known by the Aztecs and Mayans in pre-Columbian times. It is a cultivated plant widespread throughout South and Central America. Currently, it is being rediscovered due to the richness of its nutrients. The content in chia seed makes it a highly nutritious and healthy food [12]. The oil contained in chia seeds is a very good source of α-linolenic acid and phytosterols when compared with other vegetable oils. Particularly it is worth pointing out the high content of α-linolenic acid, which is the dominant component of the fatty acid fraction of chia seeds (the share is around 60%) with a simultaneous low content of linoleic acid (the share is around 10%) [13,14]. Chia seeds also contain a number of ingredients with antioxidant, anti-inflammatory, anti-cancer and anticoagulant properties, including cinammic, chlorogenic and caffeic acids as well as flavonoids (myricetin, quercetin, kaempferol) [14]. Chia seeds are also characterised by a relatively high content of dietary fibre (38–40 g/100 g of seeds) [14].
Due to a significant decrease in the consumption of bread in recent years, producers should try and stop this steady depreciation. The most advantageous solution seems to be the production of bread that is attractive to consumers, being of both good quality and also being rich in nutrients and minerals. The latter issue seems to be particularly important in the case of wheat bread, which is a good source of energy, but at the same time has a poor nutritional and mineral value [3].
Until now, teff flour was not the raw material for enriching wheat bread. Despite the fact that teff is a very old plant, the interest in its grain and the possibilities of its use has only recently increased. In baking, it is used mainly in the production of gluten-free products and cookies [6,15].
Ground chia seeds also seem to be a good plant material for wheat bread enrichment, mainly due to the presence of both wholesome protein, fat with a unique content of fatty acids and minerals, as well as dietary fibre [6,14]. On the other hands chia seeds have already been used as raw material for gluten free products (similiary to teff flour) [15]. Moreover suplementation of wheat bread with chia seeds has not been invastigated in case of high chia seed share.
Hence, it seems reasonable to use these found in teff flour and chia seeds in order to enrich poor white-wheat bread with valuable nutrients.
In this study, an attempt was made to investigate the influence of ground chia and teff on chemical composition, and quality (determined both on the baking day and during storage) of wheat bread.

2. Materials and Methods

2.1. Materials

The research material consisted of ingredients needed for regular wheat bread (standard) as well as for bread enriched with teff and chia. Wheat flour type 650 was purchased from a local mill company (PZZ Krakow S.A, Krakow, Poland). The 650 type of flour means that the flour contains about 650 mg of mineral ash in 100 g of flour. Teff flour as well as chia seeds (Bio-Planet, Leszno, Poland) were purchased from a local market. The chia seeds were ground in a Kenwood (De’Longhi, Treviso, Italy) grinder for five minutes and used without any further processing. The bread recipe used during the investigation also contained salt (JanikoSoda, Janikowo, Poland) and dried baking yeasts (Lesaffre Group, Wołczyn, Poland).

2.2. Methods

2.2.1. Recipes and Quality Evaluation

Wheat bread (standard—without any shares, only wheat flour), wheat bread with 5% and 10% of ground chia seeds (the share of chia seeds in wheat bread—is by the limited regulation of the European Union, which says that their content in bread cannot exceed 10%) [16] and wheat bread with 5%, 10% and 15% teff flour (shares calculated based on wheat flour) were baked in the laboratory. The recipes of the tested bread are shown in Table 1.
The dough was prepared using a straight method (mixing time 6 min, 3 min slow speed, 3 min fast) with a laboratory spiral mixer Diosna type SP 12 (Dierks and Söhne, Osnabrück, Germany).
Baking was performed at 230 °C for 30 min, in an electric oven (MIWE CO 2 P608, Amstein, Germany). 6 loaves (250 g each) were baked for each batch. The loaves were cooled for 2 h, weighed and their volume was determined in a laser volume meter Volscan Profiler 600 (Stable Micro Systems, Surrey, England). Organoleptic assessment was performed according to the polish standard, by a 15-person evaluation panel with proven sensory sensitivity. The methods of organoleptic evaluation were based on the acceptance analysis of encoded bread samples on a six-point scale. The analysis included the following quality attributes: appearance, crumb porosity, elasticity of the crumb, thickness of the crust as well as flavour. Bread with a score of 36–40 is classified into the I quality class, which is the best grade [17].

2.2.2. Bread Stalling

The texture profile analysis (TPA) of breadcrumbs from one loaf of each batch was performed, using a texture analyser TA-XT 2 plus (Stable Micro Systems, Surrey, England), according to the standard program, at the compression rate of 5 mm·s−1 (loaves used for analysis in the following days were stored in plastic bags at 22 ± 2 °C). Samples of breadcrumbs, taken from the centre of the loaf with a height of 2 cm were pressed to reach 50% deformation by a P/20 aluminium cylinder probe (diameter of 2 cm), in two cycles with a 5 s delay. The resulting hardness, springiness, cohesiveness and chewiness of the crumb were used as indicators of textural changes during storage. The calculations were performed using the attached software Texture Exponent (Stable Micro Systems, Surrey, England). The analysis was performed after 2, 24, 48 and 72 h after baking. The moisture of the crumbs (AOAC, met. 925.10) [18] were analysed after 2, 24, 48 and 72 h after baking, respectively.

2.2.3. Chemical Composition

The chemical composition of bread was determined according to the AOAC methods (2006) including: dry mass (met. 925.10), total protein (met. 950.36), total dietary fibre (including soluble and insoluble fraction—met. 935.38), raw fat (met. 930.05), total ash (met. 930.05) [18].
The determination of selected minerals was performed according to the modified AOAC method (2006)—method 985.01 [19]. Minerals were selected on the basis of literature data describing the content of minerals in the tested plant materials. The samples were ashed for 6 h at 460 °C. The cooled ash was moistened with 10 drops of water, then 3–4 cm3 HNO3 was added. The excess of acid was then evaporated (temp. 100–120 °C). The samples were ashed again at 460 °C for 3 h. The cooled ash thus obtained was dissolved in 10 cm3 of HCl and quantitatively transferred to a 50 cm3 volumetric flask, making up the required volume with distilled water. Determination of the content of selected minerals in the solutions obtained after mineralisation of the samples was carried out in an atomic emission spectrophotometer with inductively excited argon plasma ICP-OES 7300 DUAL VIEW by Perkin Elmer.
Determination of the fatty acids profile was performed based on Kulawik et al., 2016 [19]. Methyl esters were prepared from the separated fat according to the developed analytical procedure. Saponification of acylglycerols was performed with a methanolic sodium hydroxide solution. The soaps were converted to methyl esters by reaction with a boron trifluoride/methanol complex. The fatty acid methyl esters were extracted from the reaction mixture with heptane and analysed using a Varian GC/MS 4000 gas chromatograph equipped with a 30 m long BPX70 capillary column, 0.25 mm internal diameter and a film thickness of 0.25 μm. Helium was used as the carrier gas. Conditions for the separation of fatty acid methyl esters include initial temperature 50 °C for 1 min, temperature increase from 50 to 205 °C at the rate of 4 °C·min−1, injector temperature 250 °C, detector: mass spectrometer with ion trap, external electron ionisation, ion trap temperature 230 °C, ion source temperature 150 °C and total analysis time 40 min. The qualitative identification and the percentage of fatty acid esters were carried out on the basis of the fatty acid ester peaks by comparing them with the retention times of the corresponding standards of methyl fatty acid esters prepared on the basis of standard solutions of single fatty acids by Sigma-Aldrich, grade 98.5–99%. The percentages of fatty acid esters were calculated on the basis of integration of the peak areas as a percentage of individual esters in relation to the total amount of fatty acid esters in the sample.

2.3. Statistical Evaluation

All results were subjected to one-way analysis of variance (ANOVA) using the software STATISTICA 10 (StatSoft, Poland). The significance of the differences was analysed by the Duncan test at α = 0.05. Results are presented as mean and standard deviation (SD).

3. Results and Discussion

The results presented in Table 2 show the quality of wheat bread (standard) and wheat bread with a 5 and 10% share of ground chia seeds and with 5, 10 and 15% share of teff flour.
It was found that the diversified proportion of ground chia seeds or teff flour significantly influenced the weight and volume of the loaves. Bread with 5% and 10% chia flour had a significantly higher weight in cold loaves. On the other hand, with the increase in the share of teff flour, the weight of the obtained, cooled loaves gradually decreased.
Moreover, the higher the proportion of ground chia seeds or teff flour, the volume of the loaves decreased. Thus, there is an inverse relationship between the volume of the loaves and the proportion of ground chia seeds or teff flour. The volume of wheat bread is higher, which is related to the fact that wheat flour contains gluten proteins, which are not present in ground chia seeds. These proteins are responsible for the structure and porosity of the loaf [20]. The lowering of the gluten content by the substitution of some part of wheat flour with chia or teff could have contributed to the deterioration of the volume [15].
It was also found that 10% and 15% teff flour significantly decreased the bread yield, and thus increased the total baking loss compared to wheat bread—Table 2. Significant reduction in the volume of bread and its yield when increasing the share of teff flour, was also found by other authors [21,22]. In the case of breads with chia seeds, an inverse relationship was observed. Breads with chia seed flour were characterised by a lower baking loss, and thus—a greater bread yield than standard bread.
A significant increase in crumb moisture was also found in comparison to the standard that was observed for bread with 10% and 15% share of teff flour. Teff flour is a whole grain flour, which means that it has a high content of dietary fibre, which absorbs additional water. It was precisely this significant amount of fibre that could have influenced the increase in the moisture content of the softie [23]. A similar tendency was found in the case of breads with ground chia seeds–on the day of baking. Wheat bread had the lowest crumb moisture, while breads with a varied proportion of chia seeds were characterised by higher crumb moisture, which was probably caused by a large amount of dietary fibre present in chia.
In addition, chia seeds contain a branched polysaccharide composed of xylose, glucose and glucuronic acid, with a high molecular weight, which can bind 10 times its weight in water [12,24].
The tested breads were also organoleptically assessed (Figure 1 and Figure 2). All the breads qualified for the I quality class (Table 2), but the highest scores were obtained by breads with a 5% share of teff flour or chia seeds. A lower score was observed for bread with a 10% share of chia seed flour, due to the external appearance, taste and smell (flavour). The panelists felt a sense of sand between the teeth in this case. Similarly, breads with 15% teff flour get a worse score—the darker colour of the crumb (the greater the proportion of teff flour, the darker the colour of the crumb) and a smaller volume.
Bread with teff flour was assessed more critically during studies by other authors. According to them only bread with a small, 6% share of teff flour was classified as quality class I, while others were rated much worse [22].
A very important role in the qualitative assessment of bread is also played by the textural properties of the crumb. These properties are important not only on the baking day, but also during the storage of the bread, when it becomes stale. Staling is an unfavourable process that causes a number of changes. The crunchiness of the crust is reduced, the aroma is lost, the crumb elasticity is reduced and the crumb dryness, brittleness and, most of all, hardness increases [25]. It is the crumb hardness that is one of the most frequently determined parameters characterising the texture of the bread [4,26]. Its changes during the storage of the tested loaves can be observed on the basis of the results obtained in Table 3. It was found that on the day of baking, the standard wheat bread was characterised by the highest hardness, in relation to breads with a different proportion of ground chia seeds or teff flour (Table 3) and this tendency was maintained throughout the whole storage period. This was likely due to the higher amount of fat in the chia seeds [7,13].
The breads with 10% share of chia seeds were characterised by a significantly greater hardness both on the day of baking and during the entire storage period, compared to bread with 5% share of chia. Similarly, in the case of bread with teff flour, the higher share of teff flour results in an increased hardness of the crumb. This is due to a significantly higher content of dietary fibre, which significantly deteriorates the parameters of the texture of the bread, as was observed in previous studies of breads with high-fibre flours [23].
Chewiness (the energy required to crush (chew) the product into an ingestible state) is another important parameter of crumb texture. The chewing results obtained on the day of baking and the next three days of storage are presented in Table 3. The obtained results are similar to the hardness. The addition of teff flour or ground chia seeds decreased chewiness. A positive correlation was found between the amount of enrichment raw material and the increase in chewiness. As in the case of hardness, the chewiness gradually increased during the next days of storage. On the other hand, no significant difeferences were found between all the tested loaves in the resilience of the crumb (immediate elasticity), i.e., the ability to return the crumb to its original form before being compressed on the day of baking. In all tested breads, the value of this parameter was similar, regardless of the share and type of enrichment additives used—Table 3. Significant deterioration of this characteristic was found after the first day of storage, and in the following days a gradual, much smaller and proportional decrease in resilience was observed. The resilience is clearly correlated with the consistency of the crumb—Table 3. The consistency of the crumb was similar here, regardless of the share and type of enrichment additives used. Significant deterioration of this feature was found after the first day of storage, and this tendency was maintained throughout the storage period.
The next stage of the research was to examine the changes in crumb moisture in the following days of storage—Table 4. It was found that with an increase in the share of chia seeds or teff flour, the crumb moisture increased. As mentioned before, this is probably due to the high dietary fibre content of the enrichment raw materials. During storage, the moisture of the crumbs of all the breads decreased, which, similarly to all the textural properties, proves the aging (stealing) processes of the examined bread (Table 4) [25].
The results of the nutrient content of wheat flour and enrichment raw materials (teff flour and chia seeds) and the tested breads are presented in Table 5, Table 6 and Table 7.
It was found that the protein content in teff flour, which is 12%, is at a similar level as in the case of the tested wheat flour and is in the range of 8%–15%, as reported by other authors [21]. It is worth noting that the teff grain protein is characterised by a very good amino acid composition, it does not contain gluten and due to the low share of prolamines, makes the grain itself and the products containing it easier to digest [6,7,15]. It was found that bread with teff flour had a higher content of protein compared to standard. Similarly, chia seeds were characterised by a significantly higher protein content, which also resulted in a higher protein content in breads with these seeds, compared to flour and wheat bread—Table 5.
According to the presented data, both teff flour and chia seeds contain much more fat than wheat flour, which also influences the fat content in the final product, i.e., bread. The fat content is consistent with the literature data [27].
Both teff flour and ground chia seeds are undoubtedly a rich source of dietary fibre, in particular in the insoluble fraction—Table 5. All fortified breads were thus characterised by a significantly higher total fibre content compared to standard wheat bread.
The same is true for the ash content. Significantly higher amounts of minerals were found in both teff flour and ground chia seeds (compared to wheat flour). The ash consists mainly of minerals. Hence, ground chia seeds and teff flour were characterised by a significantly higher content of all the determined micronutrients and macronutrients (Table 6). Teff flour and ground chia seeds are also characterised by a much higher content of macronutrients, such as: calcium, magnesium, potassium and phosphorus, than wheat flour (Table 6). Fortification with these raw materials contributed to an increase in the content of these macronutrients in the tested breads.
In both teff flour and chia seeds as well as in bread fortified with them, a significantly higher content of all determined micronutrients was found [10,12]. The obtained results also confirm the significant content of iron which in the teff grain is emphasised by many authors [8,10]. It was found that in teff flour there is as much as 93 mg of Fe per kilogram of dry matter, and this is a value more than three times higher than those for wheat flour. Chia seeds, like teff flour, turned out to be a very good source of iron–Table 6. Another important micronutrient that can be supplied to the body in a large amount by consuming products containing teff is zinc. It is a component of over 2000 proteins, of which about 400 are enzymes [28]. Its content in teff flour was 3 times higher, and in ground chia seeds almost 5 times higher than in wheat flour. On the basis of the obtained results, it can be concluded that teff grain and chia seeds are also a good source of copper, which is also part of proteins, participates in the process transferring electrons to oxygen atoms, as a result of which the body obtains chemical energy, supporting other metabolic processes [29]. As for the content of manganese, the use of teff flour and chia seeds also increased the content of this element in the tested bread. Similar to zinc, it is a component of enzymes and acts as an activator for many of them. This element is necessary for the formation of bones and connective tissue and is needed for the proper functioning of the pancreas and brain [30].
According to the literature [29] and the results presented in Table 6, chia seeds are a very good source of fat. Hence, the content of fatty acids was determined both in seeds and bread with them as ingredients, the results of which are presented in Table 7. Ground chia seeds were found to be a very good source of α-linolenic acid (18:3), as confirmed by the data in the literature. Chia seeds are the richest plant source of this acid because they contain even 16% more of this acid, compared to the oilseed flax seeds, considered the richest source so far [31].
The obtained breads with 5% and 10% chia flour were also characterised by a higher content of this acid (more than 30 times higher). The content of α-linolenic acid increased with an increasing share of ground chia seeds. Moreover, it was found that supplementing the diet with chia seed fat may contribute to the reduction of the consumption of excess n-6 acids in the daily diet, which is confirmed by the literature [29,31].

4. Conclusions

Both ground chia seeds and teff flour are a valuable raw material that enriches wheat bread, this due to their chemical composition and the content of selected macro- and micronutrients. In the case of chia seeds the fatty acid profile is also much more favourable than in wheat flour. The supplementation of wheat bread with teff flour and chia seeds resulted in a better quality of bread compared with wheat bread and with a more valuable chemical composition, but this fortification adversely affected the loaf volume. A supplementation of a 5% share of teff flour positively influenced the textural features of the crumb, in particular it reduced its hardness and chewiness. In addition, bread with teff flour was assessed organoleptically better. Moreover, teff flour and bread baked with it are characterised by a higher content of protein, fat, ash and dietary fibre compared to wheat products. Fortification of 5% ground chia seeds flour for baking wheat bread significantly increased the quality as well as the content of all tested nutrients in these bread, i.e., protein, fat, ash (including macro and micro-elements important for the organism), as well as the content of dietary fibre. In the case of fortified bread, chia seeds also have α-linolenic acid. Therefore, the described fortifying raw materials can be considered a wholesome raw material in bakery production.

Author Contributions

Conceptualization, G.Z. and M.L.; Investigation, H.G.; Methodology, F.G.; formal analysis, G.Z., F.G.; investigation, H.G.; writing—original draft preparation, G.Z.; writing—review and editing, M.L. and H.G.; supervision, H.G. and M.L. All authors have read and agreed to the published version of the manuscript.

Funding

The work was financed by a subsidy of the Ministry of Science and Higher Education for the University of Agriculture in Krakow for 2020.

Institutional Review Board Statement

The experiments conducted as part of the research did not require the approval of the Institutional Review Board at the time of their conduct.

Informed Consent Statement

Informed consent was obtained from all subjects involved in the study.

Data Availability Statement

Data available on request.

Conflicts of Interest

The authors declare no conflict of interest.

References

  1. Odunayo, N.W.; Abimbola, A.; David, J.; Banji, A.; Ayodele, O.; Oluwatosin, S.; Adebayo, O. Nutritional enrichment of wheat bread using various plant proteins. Int. J. Multidiscip. Curr. Res. 2017, 5, 1–6. [Google Scholar]
  2. Dewettinck, K.; van Bockstaele, F.; Kuhne, B.; van de Walle, D.; Courtens, T.M.; Gellynck, X. Nutritional value of bread: Influence of processing, food interaction and consumer perception. J. Cereal Sci. 2008, 48, 243–257. [Google Scholar] [CrossRef]
  3. Roseli, C.M. 14—Vitamin and mineral fortification of bread. In Woodhead Publishing Series In Food Science, Technology And Nutrition; Elsevier: Amsterdam, The Netherlands, 2008; pp. 336–361. [Google Scholar]
  4. Dziki, D.; Różyło, R.; Laskowski, J. Wpływ dodatku mąki ryżowej na zmiany tekstury miękiszu pieczywa pszennego [The effect of the addition of rice flour on changes in the texture of the crumb of wheat bread]. Acta Agrophys. 2009, 13, 329–340. [Google Scholar]
  5. Mikulec, A.; Kowalski, S.; Makarewicz, M.; Skoczylas, Ł.; Tabaszewska, M. Cistus extract as a valuable component for enriching wheat bread. LWT Food Sci. Tech. 2020, 118. [Google Scholar] [CrossRef]
  6. Ivan, Š.; Marie, H.; Barbora, B. Chia and teff as improvers of wheat-barley dough and cookies. Czech J. Food Sci. 2017, 35, 79–88. [Google Scholar] [CrossRef]
  7. Coelho, M.S.; Salas-Mellado, M.S. Effects of substituting chia (Salvia hispanica L.) flour or seeds for wheat flour on the quality of the bread. LWT Food Sci. Tech. 2015, 60, 729–736. [Google Scholar] [CrossRef] [Green Version]
  8. Zhu, F. Chemical composition and food uses of teff (Eragrostis tef). Food Chem. 2018, 239, 402–415. [Google Scholar] [CrossRef] [PubMed]
  9. Rico, D.; Ronda, F.; Villanueva, M.; Montero, C.; Martin-Diana, A. Development of healthy gluten-free crackers from white and brown tef (Eragrostis tef Zucc.) flurs. Heliyon 2019, 5, e02598. [Google Scholar] [CrossRef] [Green Version]
  10. Forsido, S.F.; Rupasinghe, H.P.V.; Astatkie, T. Antioxidant capacity, total phenolics and nutritional content in selected Ethiopian staple food ingredients. Int. J. Food Sci. Nutr. 2013, 64, 915–920. [Google Scholar] [CrossRef]
  11. Ali, N.M.; Yeap, S.K.; Ho, W.Y. The promising future of chia, Salvia hispanica L. J. Biomed. Biotechnol. 2012, 2012, 1–9. [Google Scholar] [CrossRef] [Green Version]
  12. Silveira Coelho, M.; Salas-Mellado, M. Chemical characterization of CHIA (Salvia hispanica L.) for use in food products. J. Food Nutr. Res. 2014, 2, 263–269. [Google Scholar] [CrossRef] [Green Version]
  13. Sargi, S.C.; Silva, B.C.; Santos, H.M.C. Antioxidant capacity and chemical composition in seeds rich in omega-3: Chia, flax, and perilla. Food Sci. Technol. 2013, 33, 541–548. [Google Scholar] [CrossRef] [Green Version]
  14. Oliveira-Alves, S.C.; Vendramini-Costa, D.B.; Betim Cazarin, C.B.; Maróstica Júnior, M.R.; Borges Ferreira, J.P.; Silva, A.B. Characterization of phenolic compounds in chia (Salvia hispanica L.) seeds, fiber flour and oil. Food Chem. 2017, 232, 295–305. [Google Scholar] [CrossRef]
  15. Hager, A.S.; Wolter, A.; Jacob, F.; Zannini, E.; Arendt, E.K. Nutritional properties and ultra-structure of commercial gluten free flours from different botanical sources compared to wheat flours. J. Cereal Sci. 2012, 56, 239–247. [Google Scholar] [CrossRef]
  16. The European Commision. 2013/50/EU: Commission Implementing Decision of 22 January 2013 authorising an Extension of Use of Chia (Salvia hispanica) Seed as a Novel Food Ingredient Under Regulation (EC) No 258/97 of the European Parliament and of the Council (Notified Under Document C(2013) 123). Available online: https://eur-lex.europa.eu/legal-content/EN/TXT/PDF/?uri=CELEX:32013D0050&from=EN (accessed on 18 May 2021).
  17. Polish Standards PN-A-7418. Research Methods; Bakery Polish Committee for Standardization: Warsaw, Poland, 1996. [Google Scholar]
  18. AOAC. Official Methods of Analysis, 18th ed.; Association of Analytical Chemists International: Gaithersburg, MD, USA, 2006. [Google Scholar]
  19. Kulawik, P.; Migdał, W.; Tkaczewksa, J.; Gambuś, F.; Szczurkowska, K.; Özuğul, F. Nutritional composition of frozen fillests from Pangasius catfish (Pangasius hypophthalmus) and Nile tilapia (Oreochromis nilotcus) imported to European countries. Ann. Anim. Sci. 2016, 16, 931–950. [Google Scholar] [CrossRef] [Green Version]
  20. Geisslitz, S.; Wieser, H.; Scherf, K.A.; Koehler, P. Gluten protein composition and aggregation properties as predictors for bread volume of common wheat, spelt, durum wheat, emmer and einkorn. J. Cereal Sci. 2018, 83, 204–212. [Google Scholar] [CrossRef]
  21. Mariam, I.O.M.; Abdelmoneim, I.M.; Gammaa, A.M.O. Evaluation of wheat breads supplemented with teff (‘Eragrostis tef (ZUCC.’) trotter) grain flour. Aust. J. Crop Sci. 2009, 3, 207–212. [Google Scholar]
  22. Wolska, P.; Ceglińska, A.; Wojniłowicz, J. Ocena jakości pieczywa pszennego z udziałem mąki z teffu [Assessment of the quality of wheat bread with teff flour]. Acta Agrophys. 2012, 19, 689–697. [Google Scholar]
  23. Zięć, G. Właściwości teksturalne miękiszu i jakości chlebów pszenno-owsianych [Textural properties of crumb and quality of wheat-oat bread]. Żywność Nauka Tech. Jakość 2016, 206, 102–111. [Google Scholar]
  24. Coorey, R.; Tjoe, A.; Jayasena, V. Gelling properties of chia seed and flour. J. Food Sci. 2014, 79, E859–E866. [Google Scholar] [CrossRef]
  25. Fadda, C.; Sanguinetti, A.M.; Del Caro, A.; Collar, C.; Piga, A. Bread staling: Updating the view. Compr. Rev. Food Sci. Food Saf. 2014, 13, 473–492. [Google Scholar] [CrossRef] [PubMed] [Green Version]
  26. Dziki, D.; Siastała, M.; Laskowski, J. Ocena właściwości fizycznych pieczywa handlowego [Assessment of physical properties of commercial bread]. Acta Agrophys. 2011, 18, 235–244. [Google Scholar]
  27. Simopoulos, A.P. Omega-3 fatty acids in inflammation and autoimmune diseases. J. Am. Coll. Nutr. 2002, 21, 495–505. [Google Scholar] [CrossRef] [PubMed]
  28. World Health Organization, Food and Agricultural Organization of the United Nations. Vitamin and Mineral Requirements in Human Nutrition; World Health Organization: Geneva, Switzerland, 2004. [Google Scholar]
  29. Ciftci, O.N.; Przybylski, R.; Rudzińska, M. Lipid components of flax, peirlla and chia seeds. Eur. J. Sci. Tech. 2012, 114, 794–800. [Google Scholar] [CrossRef]
  30. Krasińska, B.; Uruski, P.; Miazga, A.; Dudlik, P.; Krasiński, Z.; Zdaniewicz, M.; Tykarski, A. Potassium and hypertension—Pathophysiology, therapeutic implications. Arter. Hypertens. 2013, 17, 393–404. [Google Scholar]
  31. Simopoulos, A.P. The importance of the Omega-6/Omega-3 fatty acid ratio in cardiovascular disease and other chronic diseases. Exp. Biol. Med. 2008, 233, 674–688. [Google Scholar] [CrossRef] [PubMed]
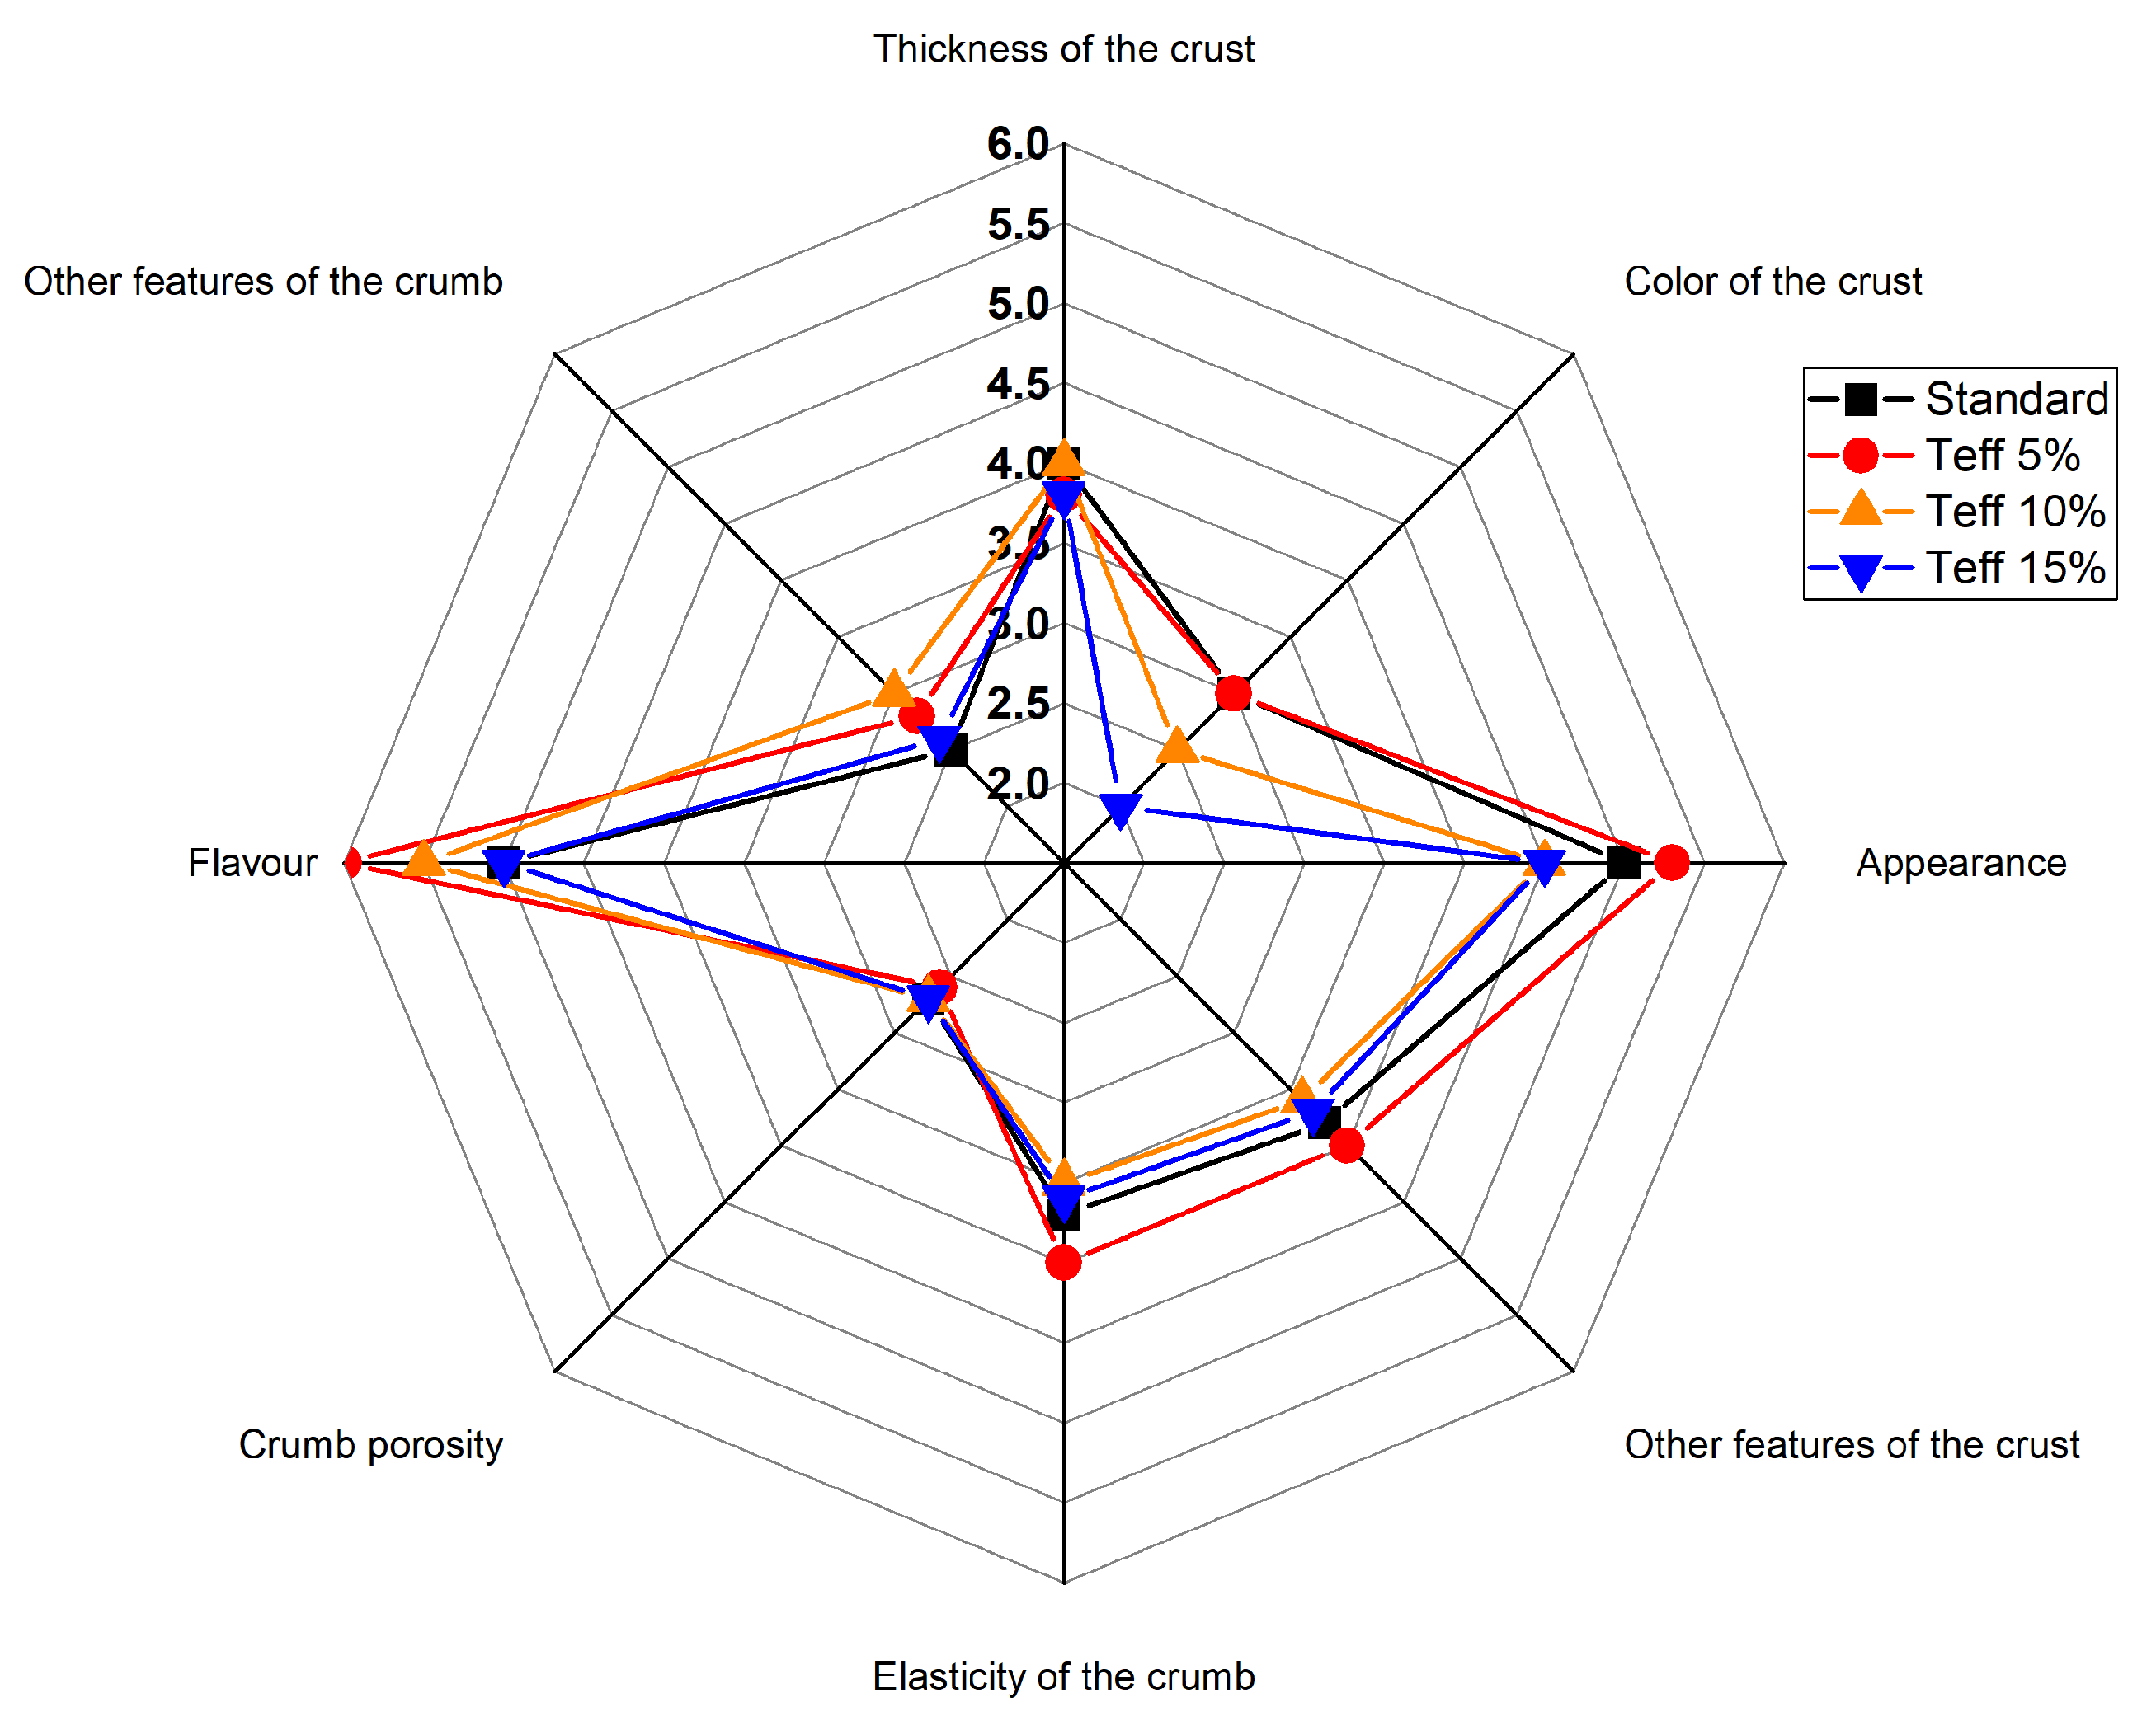
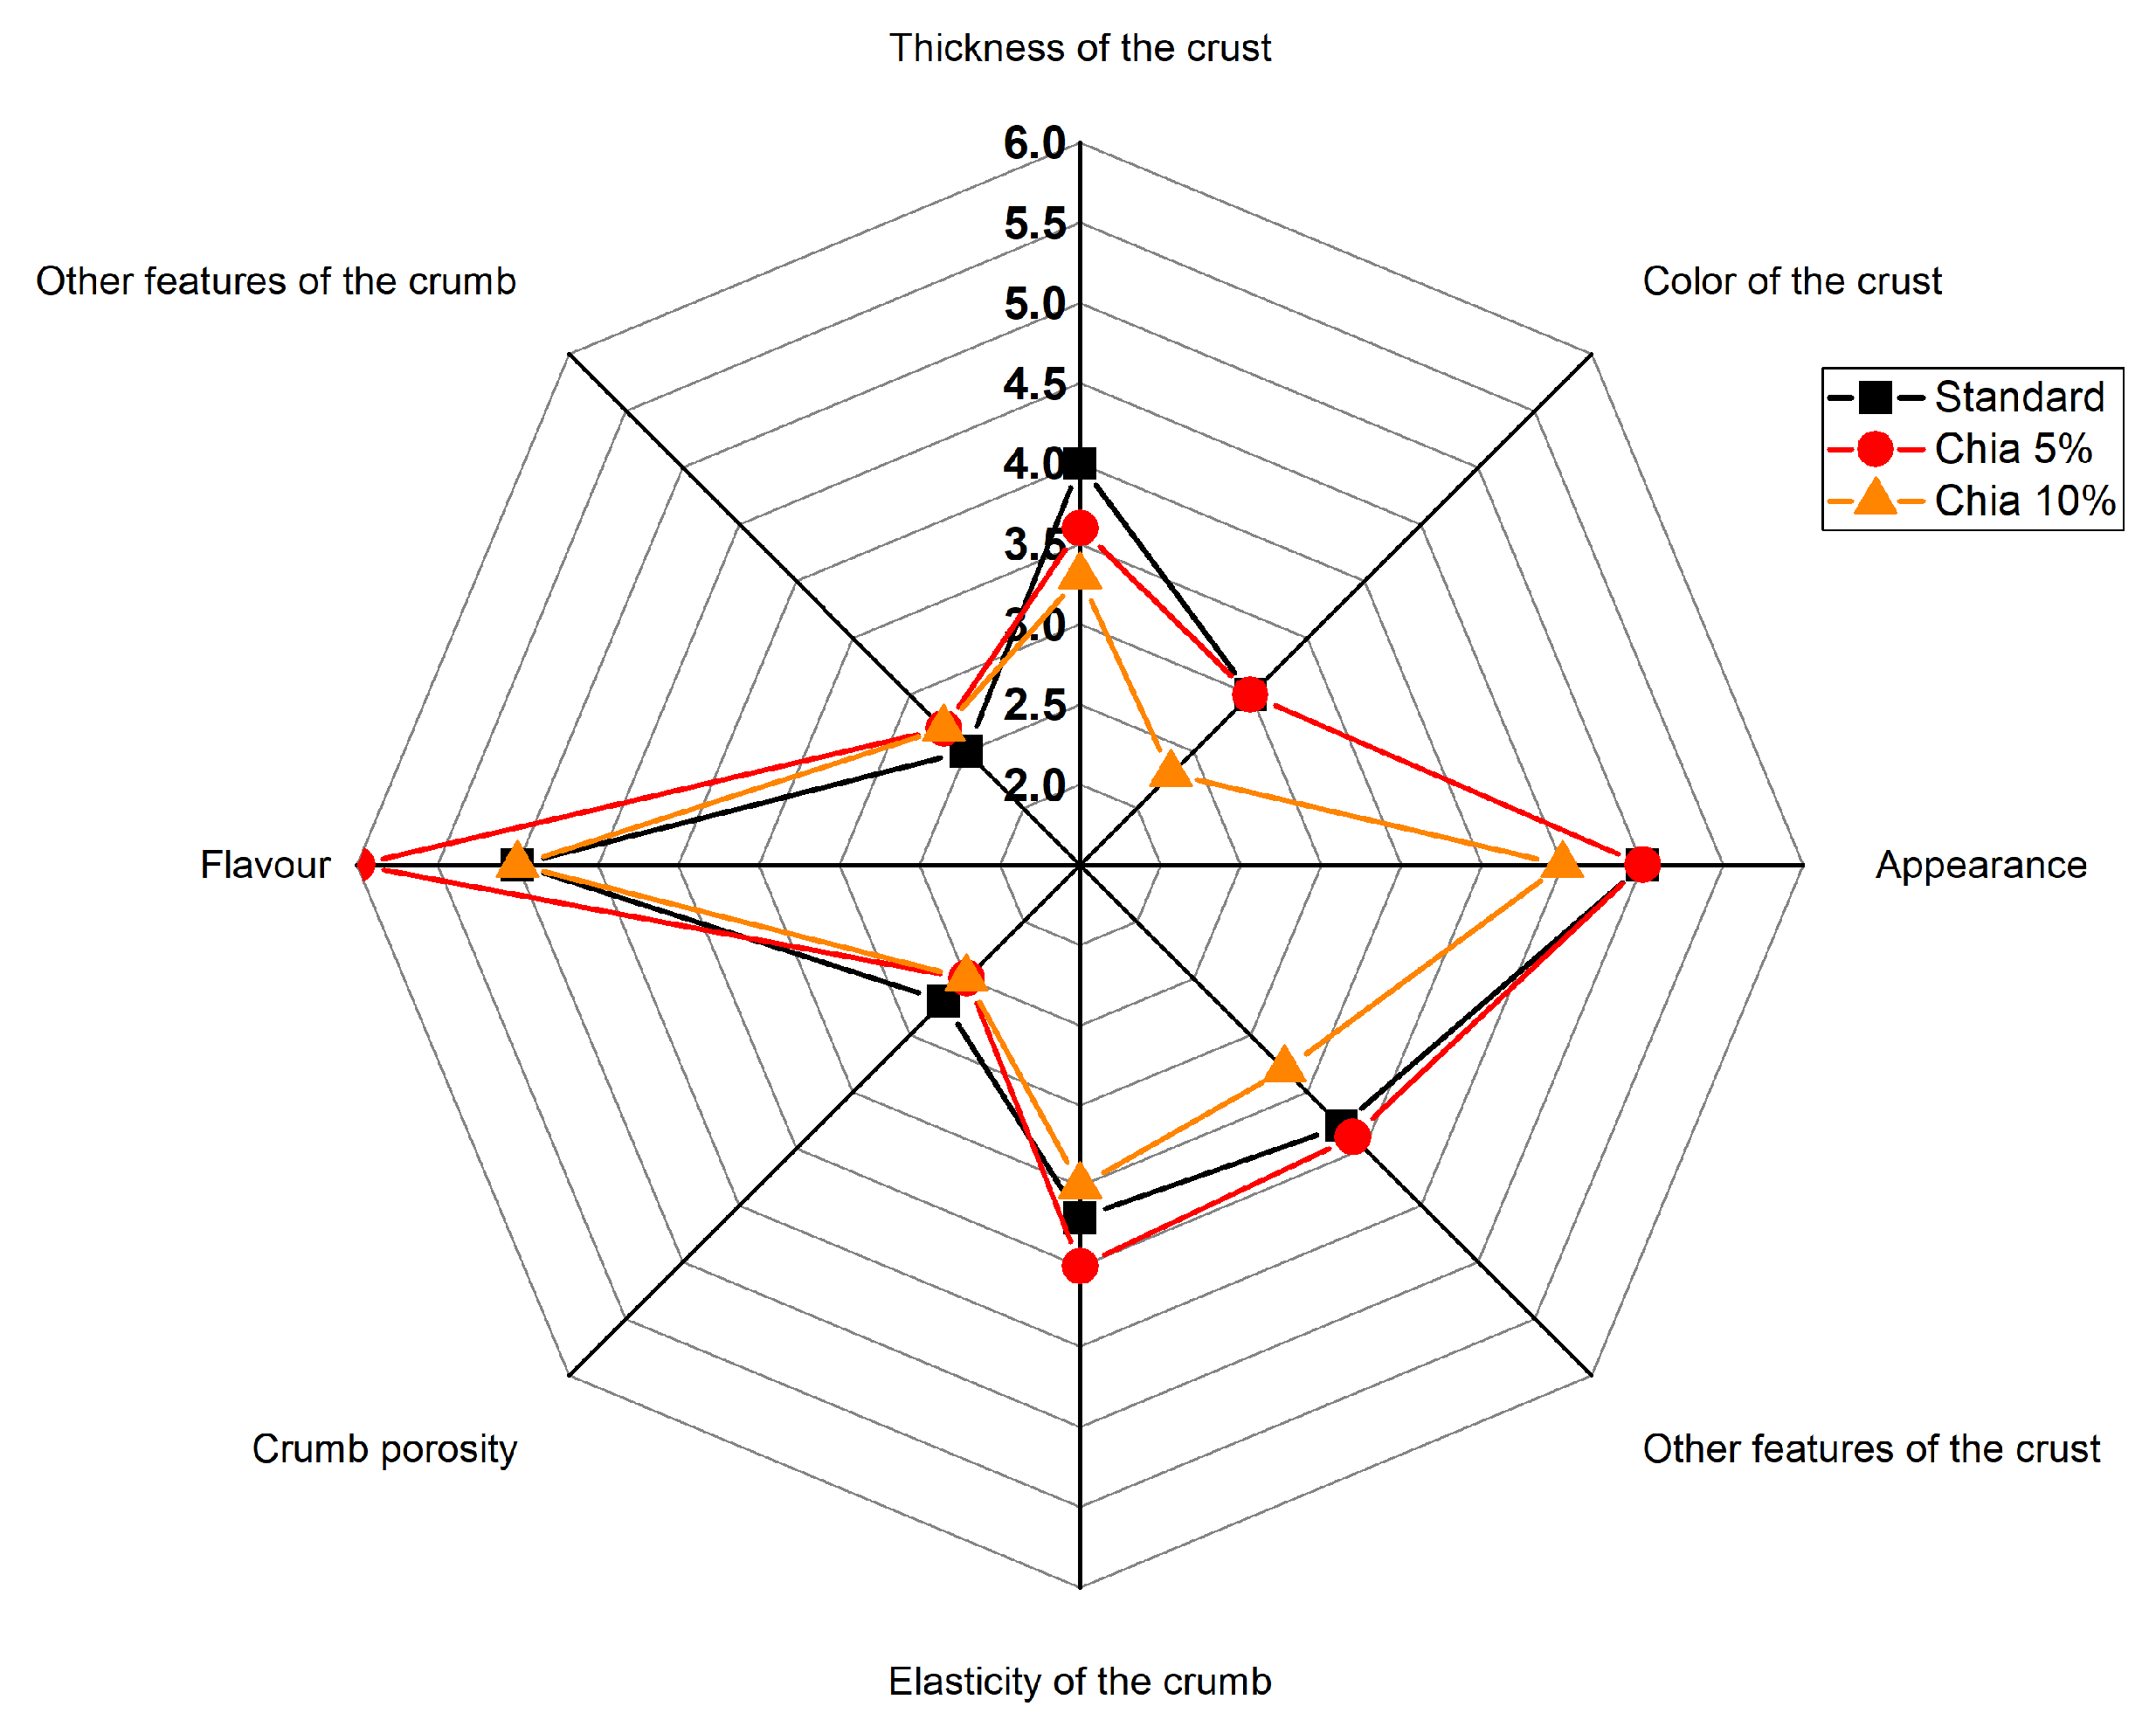
Figure 1. Organoleptic evaluation of the tested bread with teff flour.
Applsci 11 05238 g001
Figure 2. Organoleptic evaluation of the tested bread with chia seeds.
Applsci 11 05238 g002
Table 1. Recipes of tested bread.
Ingredients
[g]
StandardTeff 5%Teff
10%
Teff
15%
Chia 5%Chia 10%
Wheat flour1000950900850950900
Chia seeds000050100
Teff flour05010015000
Water650 *650650650650650
Yeast303030303030
Salt202020202020
* Water absorption determined at 500 B.U. + 30 cm3 of water in order to achieve a dough consistency of 350 B.U.
Table 2. Assessment of the quality of baked bread with a varied proportion of teff flour on the baking day.
BreadThe Weight
of Cold Bread
[g]
Volume
[cm3]
Bread Yield
[%]
Total Baking Loss [%]Crumb Moisture [%]Organoleptic Assessment
Total
Points
Quality Class
Standard220.56 d * ± 0.69789.49 d ± 0.71145.70 c ± 0.9012.09 b ± 0.4142.94 a ± 0.6538.5 b ± 0.43I
Teff 5%218.88 c ± 0.86790.21 d ± 0.22144.46 c ± 0.5712.45 b ± 0.3443.12 a ± 0.4339.8 c ± 0.13I
Teff 10%214.86 b± 0.29758.12 c ± 0.65141.81 b ± 0.5114.06 c ± 0.9243.87 b ± 0.7638.3 b ± 0.36I
Teff 15%209.97 a ± 2.87656.78 a ± 0.76138.58 a ± 0.9016.01 d ± 0.1544.16 b ± 0.6536.9 a ± 0.27I
Chia 5%225.21 e ± 0.58702.23 b ± 2.14147.98 d ± 0.0911.05 a ± 0.5746.42 c ± 0.2139.0 c ± 0.41I
Chia 10%226.15 e ± 1.11654.12 a ± 1.98147.12 d ± 0.0210.98 a ± 0.1546.21 c ± 0.1236.0 a ± 0.87I
* Table shows mean values ± standard deviations and standard error of mean; a, b, c, d, e—mean values in columns denoted by different letters differ statistically significantly (p ≤ 0.05).
Table 3. Textural parameters of the tested bread during storage.
BreadHardness [N]/Hours of StorageChewiness [N]/Hours of Storage
22448722244872
Standard5.12 d * ± 0.328.82 c± 0.3210.12 d ± 0.5115.13 d ± 1.003.42 d ±0.124.23 b± 0.545.76 c ± 0.427.21 c± 0.33
Teff 5%2.34 a ±0.124.12 a ± 0.566.23 a ± 0.149.17 b ± 0.252.34 a ± 0.563.16 a ± 0.264.16 a ± 0.435.32 a ± 0.11
Teff 10%2.87 a ± 0.524.64 a ± 0.127.43 b ± 0.269.98 c ± 0.462.89 b ± 0.323.45 a ± 0.874.32 a± 0.265.32 a ± 0.23
Teff 15%3.75 b ± 0.775.23 b ± 0.218.54 c ± 0.7610.77 c ± 0.123.12 c ± 0.184.21 b ± 0.215.02 b ± 0.536.54 b ± 0.64
Chia 5%3.21 b ± 0.265.02 b ± 0.566.87 a ± 0.148.17 a ± 0.252.04 a ± 0.563.19 a ± 0.264.30 a ± 0.435.67 a ± 0.11
Chia 10%4.16 c ± 0.525.64 b ± 0.127.03 b± 0.268.43 a ± 0.462.76 b ± 0.323.21 a ± 0.874.25 a ± 0.265.58 a ± 0.23
Resilience [[–]/Hours of StorageCohesive [[–]/Hours of Storage
Standard0.48 a * ± 0.020.17 a± 0.010.15 a ± 0.010.12 a± 0.010.51 a ± 0.010.44 b ± 0.010.37 a± 0.010.34 ab ± 0.01
Teff 5%0.50 b ± 0.010.28 b ± 0.020.19 b ± 0.030.13 a ± 0.010.55 b ± 0.020.42 a ± 0.020.39 b ± 0.020.36 b ± 0.01
Teff 10%0.47 a ± 0.010.26 b ± 0.010.14 a ± 0.020.16 b ± 0.010.52 a ± 0.010.41 a ± 0.010.37 ab ± 0.030.33 a ± 0.01
Teff 15%0.46 a ± 0.020.25 b ± 0.020.18 b ± 0.030.16 b ± 0.010.51 a ± 0.050.43 ab ± 0.010.36 a ± 0.010.32 a ± 0.01
Chia 5%0.52 b ± 0.020.30 c ± 0.020.20 b ± 0.030.16 b ± 0.010.53 b ± 0.020.42 a ± 0.020.39 b ± 0.020.35 ab ± 0.01
Chia 10%0.50 b ± 0.010.29 c ± 0.010.16 a ± 0.020.16 b ± 0.010.51 a ± 0.010.42 a ± 0.010.38 b ± 0.030.33 a ± 0.01
* Table shows mean values ± standard deviations and standard error of mean; a, b, c, d–mean values in columns denoted by different letters differ statistically significantly (p ≤ 0.05).
Table 4. Changes in the humidity of the crumb of the tested bread during storage.
BreadMoisture of Crumb [%]/Hours of Storage
2244872
Standard42.94 a * ± 0.6541.87 a ± 0.3341.21 a ± 0.4240.96 a ± 0.12
Teff 5% 43.12 ab ± 0.4342.85 b ± 0.2142.14 b ± 0.1341.62 b ± 0.43
Teff 10%43.87 b ± 0.7642.28 b ± 0.5342.01 b ± 0.5141.87 b ± 0.27
Teff 15%44.16 b ± 0.6543.59 c ± 0.8342.95 c ± 0.9141.67 b ± 0.65
Chia 5%46.42 c ± 1.2145.62 d ± 0.2144.87 d ± 1.3444.02 c ± 1.43
Chia 10%46.21 c ± 1.1245.34 d ± 1.5344.21 d ± 1.5144.01 c± 0.27
* Table shows mean values ± standard deviations and standard error of mean; a, b, c, d –mean values in columns denoted by different letters differ statistically significantly (p ≤ 0.05).
Table 5. The content of selected chemical components in the tested flours and bread.
SampleTotal Protein
[% d.m.]
Raw Fat [% d.m.]Total Ash [% d.m.]Dietary Fibre [% d.m.]
Insoluble FractionSoluble FractionTotal
Wheat flour16.48 b * ± 0.021.72 bc ± 0.320.57 a ± 0.061.41 a ± 0.041.52 ab ± 0.162.93 a ± 0.12
Teff flour12.38 a ± 0.063.17 d ± 0.042.37 b ± 0.115.56 c ± 0.101.47 a ± 0.327.03 d ± 0.04
Chia seeds26.22 e ± 0.2133.14 e ± 0.055.90 d± 0.0538.25 d± 0.054.59 d ± 0.0542.84 e ± 0.05
Standard16.50 b ± 0.041.57 a ± 0.082.75 b± 0.092.49 b ± 0.091.30 a ± 0.013.79 b ± 0.16
Teff 5%17.30 c ± 0.011.66 b ± 0.102.77 b ± 0.212.62 b ± 0.321.45 a ± 0.054.05 c ± 0.02
Teff 10%17.29 c ± 0.051.76 bc ± 0.712.93 b ± 0.022.70 b ± 0.031.64 b ± 0.094.34 c ± 0.32
Teff 15%17.49 c ± 0.032.08 c ± 0.023.05 c ± 0.082.96 b ± 0.021.75 bc ± 0.174.71 c ± 0.06
Chia 5%17.95 c ± 0.063.21 d ± 0.053.16 c ± 0.073.88 bc ± 0.051.65 b ± 0.055.53 c ± 0.06
Chia 10%18.89 d ± 0.054.87 d ± 0.053.39 c ± 0.245.84 c ± 0.072.21 c ± 0.058.05 d ± 0.02
* Table shows mean values ± standard deviations and standard error of mean; a, b, c, d, e –mean values in columns denoted by different letters differ statistically significantly (p ≤ 0.05).
Table 6. The content of selected macronutrients in the tested flours and bread.
SampleMacronutrients
[mg·kg−1 d.m.]
Micronutrients
[mg·kg−1 d.m.]
CaKMgPFeZnCuMn
Wheat flour270.51 a * ± 16.241870.42 a ± 26.329.67 a ± 0.0361473.79 a ± 25.9014.30 a ± 0.628.99 a ± 0.210.76 a ± 0.049.67 a ± 0.04
Teff flour1841.79 d ± 587.545708.78 e ± 334.55205.49 e ± 11.374662.14 d ± 55.6093.94 f ± 8.7829.11 d ± 0.004.88 d ± 0.00205.49 f ± 11.38
Chia seeds6787.47 e ± 78.326880.12 d ± 100.973488.38 d ± 102.548815.9 e ± 76.5453.40 e ± 0.6254.71 e ± 1.7015.70 e ±0.2032.68 e ± 0.45
Standard265.19 a ± 0.412397.00 bc ± 72.757.65 b ± 0.661617.27 b ± 163.8016.83 b ± 0.4614.17 b ± 1.751.10 b ± 0.077.65 a ± 0.36
Teff 5%364.13 b ± 70.862189.69 b ± 220.1812.43 c ± 0.491726.90 b ± 158.8020.95 c ± 4.6713.67 b ± 2.091.81 b ± 0.1312.43 b ± 0.49
Teff 10%597.79 c ± 78.122616.82 c ± 172.4212.84 c ± 0.352023.17 c ± 120.7023.25 c ± 0.3212.97 b ± 0.311.99 b ± 0.2112.84 b ± 0.04
Teff 15%725.18 d ± 23.192997.42 d ± 27.3016.43 d ± 0.132196.44 c ± 118.2033.45 d ± 9.9816.74 c ± 0.592.42 c ± 0.0216.43 c ± 0.13
Chia 5%481.64 bc ± 28.322180.48 b ± 95.32414.93 f ± 31.121843.65 b ± 45.1218.37 c ± 3.2113.72 b ± 0.511.87 b ± 0.048.15 a ± 0.15
Chia 10%778.37 d ± 34.322745.98 c ± 87.97561.95 f ± 21.762234.12 c ± 65.3229.20 d ± 6.0116.71 c ± 4.392.40 c± 0.2610.21 b ± 1.00
* Table shows mean values ± standard deviations and standard error of mean; a, b, c, d, e –mean values in columns denoted by different letters differ statistically significantly (p ≤ 0.05).
Table 7. Fatty acid content in the bread with 5 and 10% of chia share.
Fatty AcidsWheat FlourChia SeedsStandardChia 5%Chia 10%
14:00.04%0.03%0.08%0.05%0.02%
16:015.89%6.07%8.72%9.37%7.75%
16:10.06%0.06%1.04%0.92%0.56%
18:01.02%3.27%2.73%2.87%2.55%
18:1 (ω-6)11.99%12.27%56.73%19.30%13.67%
18:2 (ω-9)66.91%28.79%24.77%30.62%28.78%
18:3 (ω-3)3.45%46.95%4.05%35.57%45.83%
20:00.05%0.99%0.36%0.26%0.25%
20:10.34%0.35%0.91%0.31%0.29%
22:00.06%0.77%0.14%0.07%0.08%
22:1n90.02%0.01%0.10%0.02%0.02%
Other0.16%0.44%0.35%0.65%0.19%
Publisher’s Note: MDPI stays neutral with regard to jurisdictional claims in published maps and institutional affiliations.

