
Stress Analysis with Dimensions of Valence and Arousal in the Wild
by
 , , , ,
Thi-Dung Tran
1, 
Junghee Kim
2,
Ngoc-Huynh Ho
1,
Hyung-Jeong Yang
1,*,
Sudarshan Pant
1,
Soo-Hyung Kim
1 and
Guee-Sang Lee
1 1
Department of Artificial Intelligence Convergence, Chonnam National University, 77 Yongbong-ro, Gwangju 61186, Korea
2
Department of Psychology, Chonnam National University, 77 Yongbong-ro, Gwangju 61186, Korea
*
Author to whom correspondence should be addressed.
Appl. Sci. 2021, 11(11), 5194; https://doi.org/10.3390/app11115194
Submission received: 14 April 2021
/
Revised: 25 May 2021
/
Accepted: 28 May 2021
/
Published: 3 June 2021
(This article belongs to the Special Issue Latest Advances and Prospects in Big Data)
Abstract
:In the field of stress recognition, the majority of research has conducted experiments on datasets collected from controlled environments with limited stressors. As these datasets cannot represent real-world scenarios, stress identification and analysis are difficult. There is a dire need for reliable, large datasets that are specifically acquired for stress emotion with varying degrees of expression for this task. In this paper, we introduced a dataset for Stress Analysis with Dimensions of Valence and Arousal of Korean Movie in Wild (SADVAW), which includes video clips with diversity in facial expressions from different Korean movies. The SADVAW dataset contains continuous dimensions of valence and arousal. We presented a detailed statistical analysis of the dataset. We also analyzed the correlation between stress and continuous dimensions. Moreover, using the SADVAW dataset, we trained a deep learning-based model for stress recognition.
1. Introduction
Stress is a normal phenomenon that is characterized by a feeling of emotional or physical tension. Recognition of multiple levels of stress is challenging due to the lack of easily accessible data with real-world context. Most of the currently available datasets are either acquired through a controlled lab environment or provide only a broad classification of different emotions.
According to the dimensional approach, affective states are not independent of each other. The circumplex model of affect [1] defines the emotion in arousal and valence dimensions, where arousal refers to the person’s agitation level, and valence refers to how pleasant or unpleasant the feeling is. The psychological evidence suggests that these two dimensions are intercorrelated [2,3,4]. Likewise, stress has both positive and negative interpretations based on its origin. Stress can arise from various events; for example, getting a new job with high demand can keep a person excited while being in a stressed condition, while failing to get the desired result in any activity may induce negative stress. High arousal and negative valence are characteristics of emotional stress [5], an affective state induced by threatening stimuli. The adjectives typically used to describe emotional stress include “stressed”, “nervous”, and “tense”, with antonyms being “relaxed”, “calm”, and “at ease” [6]. High arousal and negative valence are also characteristic of acute affective states: the specific emotions of anger, disgust, and fear [7].
Therefore, in the stress recognition process, identifying the position of emotion in arousal–valence space is significant. Due to the crucial effects of stress on humans, there have been several studies related to stress analysis, such as stress assessment in the workplace [8,9] or using electronics equipment to detect stress [10,11]. The purpose of such studies is to understand stress better and build a computational mechanism to detect stressful situations. For example, assessing employees’ stress levels through monitoring systems enables the adjustment of working conditions, thereby improving the performance of the employees [8,9].
To identify various levels of stress, we present a new publicly available dataset named Stress Analysis with Dimensions of Valence and Arousal in Wild (SADVAW), which focuses on stress in 9 different levels of expression and the representation of stress in valence–arousal space. In this paper, we present three main contributions:
- Firstly, we analyze the relationship between stress and continuous dimensions of valence and arousal.
- The second, the SADVAW dataset, which is constructed to evaluate multiple stress levels in continuous dimensions of valence and arousal based on facial features. The SADVAW dataset consists of 1236 video clips extracted from 41 Korean movies. Video clips are extracted from many characters with different backgrounds, closer to the real-world environment. The video clips were evaluated on a 9-level scale for each stress, valence, and arousal class.
- The third contribution is developing a baseline model based on deep learning techniques for stress level detection. In particular, we first detect and extract human faces using TinyFace [12] model. Then, we use ResNet [13] (pp. 770–778) to extract an important feature vector for each frame of the video clip. The sequence of features is trained by Long Short-Term Memory (LSTM) [14], followed by fully connected layers to predict the stress, arousal, and valence level. Based on the SADVAW dataset, we determined the correlation of stress with valence and arousal. Furthermore, we aim to use this analysis for stress detection systems through images/videos captured from real-world situations.
The remainder of this paper is organized as follows. Section 2 discusses the related works on data sets for emotion recognition. Section 3 provides details of the dataset construction process and dataset statistics. Section 4 describes the details of the baseline model, along with experiments and a discussion of the results. Finally, Section 5 presents the conclusions drawn from the study.
2. Related Work
2.1. Existing Stress Dataset
In recent years, numerous datasets related to emotion recognition have been published. However, only a few of them focus on a specific emotion, such as stress. Among the stress-related datasets, the WeSAD dataset [15] has been widely explored in recent stress recognition studies. The dataset consists of physiological and motion data collected from 15 subjects using wearable devices worn on the wrist and the chest. The ground truth was assigned based on the data collection protocol, where the neutral, stressed, and amused states were induced using stressors. The dataset aims at classifying the neutral, stressed, and amused state of the participants; however, it does not focus on stress with a granular classification of stress at multiple levels.
MuSE dataset [16] consists of the recording of 28 University of Michigan college students in the process of answering monologue questions and watching emotional videos. After responding to the questions, the participants were asked to mark themselves on two emotion dimensions: activation and valence. After watching each video clip, the participants marked an emotion category (angry, sad, etc.).
Similarly, the SWELL-KW dataset [17] is the result of experiments conducted on 25 subjects doing office work, such as writing reports, making presentations, reading e-mail, and searching for information. The collected data consists of the computer usage patterns, facial expressions, body postures, electrocardiogram (ECG) signal, and electrodermal activity (EDA) signal. All participants worked under all three conditions: no stress, time pressure, and interruptions.
However, the WeSAD [15], MuSE [16], and SWELL-KW [17] datasets were collected in controlled laboratory conditions with limited context, and stressors such as time pressure and interruptions [17], or emotion elicitation clips [15,16], while stress has many different levels and is variously expressed in each particular case. Therefore, we have built a large video dataset to solve these limitations. The dataset focuses on stress detection based on facial expression. The stress values also were evaluated with multi-levels. Besides, the collected data has diverse faces in various situations under the impact of many different factors. This eliminates the limitation of datasets collected from the lab and makes the dataset closer to the real-world environment. The comparison with related datasets is summarized in Table 1. Furthermore, the models used by these datasets for evaluation, while achieving high prediction accuracy, are inflexible and expensive to deploy in natural environments because these models need many items of equipment to measure many parameters. In contrast, with the proposed dataset, the models only use cameras to catch the user’s face.
2.2. LSTM Architecture
Hochreiter and Schmidhuber introduced Long Short-Term Memory (LSTM) in 1997 [14]—a type of recurrent neural network. This architecture is particularly well suited for sequential data such as video or audio. The crucial difference of LSTM compared to other recurrent neural networks is memory cell—a cell state to save long-term states, which allows LSTM to remember and connect previous information of data, that was introduced in detail in [18]. The LSTM unit structure is shown in Figure 1. Each LSTM unit comprises three gates: input gate, forget gate, and output gate. Each port is assigned a specific task. First, the input gate adds and controls the amount of information flow into the memory cell. Second, the forget gate defines the previous cell state that needs to be overlooked and keeps part of the data in the current moment. Finally, the output gate controls the amount of data flows in the rest of the networks.
where is input at the current time t; are the vectors of the forget gate, input gate, and output gate, respectively. Character ‘∘’ denotes the Hadamard product; , are weight matrices of the input and are weight matrices of the previous hidden state at the forget gate, input gate, cell state, and output gate, respectively; are the bias parameters. are the sigmoid function and hyperbolic tangent function, respectively. refers to a tanh output. and denote the current and previous cell states, respectively. and denote the current and previous output, respectively.
3. SADVAW Dataset and Stress Analysis
3.1. Dataset Overview
This paper introduces a new stress recognition dataset—Stress Analysis with Dimensions of Valence and Arousal in Wild (SADVAW) (The SADVAW dataset can be downloaded at https://www.kaggle.com/c/2020kerc/data, accessed on 13 April 2021)—a collection of video clips of actors in movies. The levels of stress, valence, and arousal of the actors are evaluated based on their apparent emotional states. The SADVAW dataset contains 1236 video clips, where each clip focuses on only one person. The video clips were collected from 41 different Korean movies that represent diverse contexts. The video clips were extracted from movies using a tool in [25]. Then, to ensure the data set’s quality, the clips with invisible or obstructed faces of actors were removed. Therefore, each video clip focuses on a visible face, composed of facial expressions, of a person involved in different activities. The data consist of people in many different environments, such as office, home, or the outdoors. Data is provided for the detection model focusing on facial expressions.
This dataset uses the same videos in [25], but two datasets were created with two different objectives. In particular, the dataset in [25] relates to emotion recognition in the videos with seven basic emotions, while in this work, the dataset was built for stress recognition and affective dimensions in continuous values. Figure 2 shows examples of people annotated with different scores of stress, valence, and arousal in the SADVAW.
3.2. Annotators and Evaluation Process
A total of 27 (12 males and 15 females) college students, with ages ranging from 21 to 26, voluntarily participated in this study. They were asked to evaluate and annotate for video clips in the dataset with nine scales for each class (stress, valence, and arousal). They had no history of mental or psychiatric ailments. The participation criteria also required candidates to not be under medication, even for simple illnesses, such as the common cold because health and mental issues can affect the emotional perception of the characters in the video. The annotators were trained before carrying out the evaluation. They were instructed to immediately and quickly judge the facial expressions for emotion labels as they felt and were told to avoid making a conscious effort to respond. They were also prohibited from any discussion with others to avoid any bias or influence.
Annotation sessions were conducted for 3 h each in the morning and afternoon for 2 days. The evaluators were divided into two groups. The first group (14 people) evaluated on the morning of the first day and the second day’s afternoon. The second group (13 people) evaluated on the afternoon of the first day and the morning of the second day. Annotators rated each video clip on a nine-point scale, where the range (1 to 9) represents the least positive to the most positive, the least agitated to the most agitated, and the least stressful to the most stressful, for valence, arousal, and stress, respectively (see Table 2). For example, Figure 3 illustrates some examples of a frame in video clips in the SADVAW database, along with their corresponding annotations. At the top-left of Figure 3, the man is looking towards the woman with a cheerful and happy smile. According to the evaluated values, the man was in an active state, without stress, and had a low agitation level. In Figure 3, at bottom-left, the girl was cautious of someone, showed a little nervousness, and was therefore evaluated for neutral stress, valence, and stress. Similarly, people in Figure 3, at top-right and bottom-right, were evaluated for high stress, high level of agitation, and valence of negative status.
We computed the average value, median, and average of the values within the range of two standard deviations (±2σ) [26] around the mean for each video clip, which 27 people evaluated. The results show that the calculated values were similar or differed slightly. Therefore, we chose the values within the mean ±2σ range as ground truth.
3.3. Annotation Agreement
To measure the agreement of annotators, we calculated the percentage of videos with the agreement of n (max(n) = 27) annotators on each value of stress, valence, and arousal as shown in Table 3a–c, respectively. The values in a table from lowest to highest have been shown clearly by color scales. The results showed that 77.48% of videos agree with two annotators and more for all levels of stress, 78.6% of valence, and 78.94% of arousal. As it is shown, the highest percentage of videos with two or more annotators’ agreement is on level four on valence (17.83%), and six on stress (14.54%) and arousal (15.16%); while the lowest percentage of videos with two or more annotators’ agreement is on level nine of valence (1.09%), on level one of stress (2.64%), and arousal (1.95%). Visual inspection shows that some of the videos are likely to be understood differently and can be labeled with different levels of stress, valence, and arousal. For example, Figure 4 shows the number of people who annotated the given video with various levels of stress, valence, and arousal.
3.4. Stress Analysis
Figure 5 shows the number of annotated videos for every value of stress, valence, and arousal. The number of videos is unevenly distributed across all values of the range (1–9), which makes the dataset particularly challenging. In particular, Figure 5a shows more examples of stress values from (6 to 7.5) associated with stress than those of the stress values associated with unstress characterized by values (1 or 2). In Figure 5b, there are more examples of negative emotions with the value ranging (3 to 4) than those of positive emotions having values (8 or 9). Similarly, in Figure 5c, there are more examples of arousal values from (4.5 to 7) associated with agitation level from neutral to high than those of the arousal values associated with low agitation level, having values (1 or 2).
Table 4 shows the correlation relationship between stress, valence, and arousal dimensions, according to Pearson’s correlation coefficient (PCC). For example, we observe that the PCC value between stress and valence is negative (r = −0.96), which negatively correlates. This means that when the value of stress increases, the value of valence tends to decrease, and vice versa (Figure 6a). Conversely, the PCC value between stress and arousal is positive (r = 0.78), indicating a positive correlation. This implies that as the value of stress increases, the value of arousal tends to increase, while with the decrease in the value of stress, it decreases, as seen in Figure 6b.
In addition, we evaluated statistically using t-test [27] to evaluate valence in stress (stress value ≥ 6.0) and non-stress (stress value < 6.0) groups. According to Table 5, the obtained one-tail p < 0.05 indicated a significant difference in negative emotions in the stress and non-stress groups. The negative t-stat = −56.34 means that the value of valence in the non-stress group is greater than that in the stress group. In other words, the non-stressed people have a more positive state than those who are stressed. Therefore, we concluded that the stress perception level influenced the negative/positive emotion perception of facial expressions.
Similarly, the one-tail value (p < 0.05) of arousal in the stress (stress value ≥ 6.0) and non-stress (stress value < 6.0) groups showed a statistically significant difference. The t-stat = 11.18 is a positive value that indicates that the agitation state of the stressed people is higher than that of the non-stressed people (see more detail in Table 5).
4. Baseline Model Experiments
4.1. Experimental Setup
The dataset is divided into three sets: training (636 videos), validation (300 videos), and testing (300 videos). The experiment was performed in three steps. In the first step, we used TinyFace [12] model to detect faces from the video frames. The number of detected faces on the train, validation, and test sets were 43,328, 20,314, and 20,924, respectively. In the second step, we used the Resnet50 model [13], pre-trained on the ImageNet [28] dataset with 1000 class labels, to extract features with an input image size of 224 × 224 × 3. Finally, in the third step, we used two LSTMs followed by four fully-connected layers to train and predict stress, valence, and arousal values using a sigmoid function. Note that we normalize all classes to lie in the range (0–1). Moreover, we use mean squared error as a loss function and Adam function as an optimizer. The model output includes three values of stress, valence, and arousal. Table 6 shows the network parameters. Besides, the overall architecture of the baseline model is shown in Figure 7.
We used LSTM for the baseline model because it could process entire data sequences (such as speech or video). Besides, it was designed to remember information for long periods; this is implicitly that output may be affected by a value that has been inputted a long time ago. This makes sense for the task to detect stress based on facial expression because facial changes through video frames all contribute to better recognition.
4.2. Evaluation Metrics
We evaluated the calculations and determined the relationships of the relevant variables using various metrics, such as mean squared error (MSE), mean relative error (MRE) [29], and Pearson’s correlation coefficients. The mean squared error is an evaluation measure commonly used as a loss function for training regression models [30]. It is used to evaluate the average squared difference between the predicted value and the ground-truth value [31,32], as shown in Equation (2). Let Y be the ground truth, and be the prediction. MSE is defined as follows:
The mean relative error measures the ratio of the absolute error of a measurement to the measurement being taken. This is expressed as follows:
The Pearson’s correlation coefficient is the most commonly used correlation statistic to measure the degree of the relationship between two variables. It is calculated by Equation (4):
4.3. Experimental Results
Table 7 presents the performance on stress recognition in terms of MSE, MRE, and PCC. In particular, the baseline model achieved the best performance for the arousal class of 1.13 MSE, 15.42% MRE, and 0.46 PCC. In addition, for the stress class, the model also showed an error of 1.66 MSE, 22.16% MRE, and 0.52 PCC, and for the valence class, the error rate of 1.23 MSE, 22.71% MRE, and 0.53 PCC.
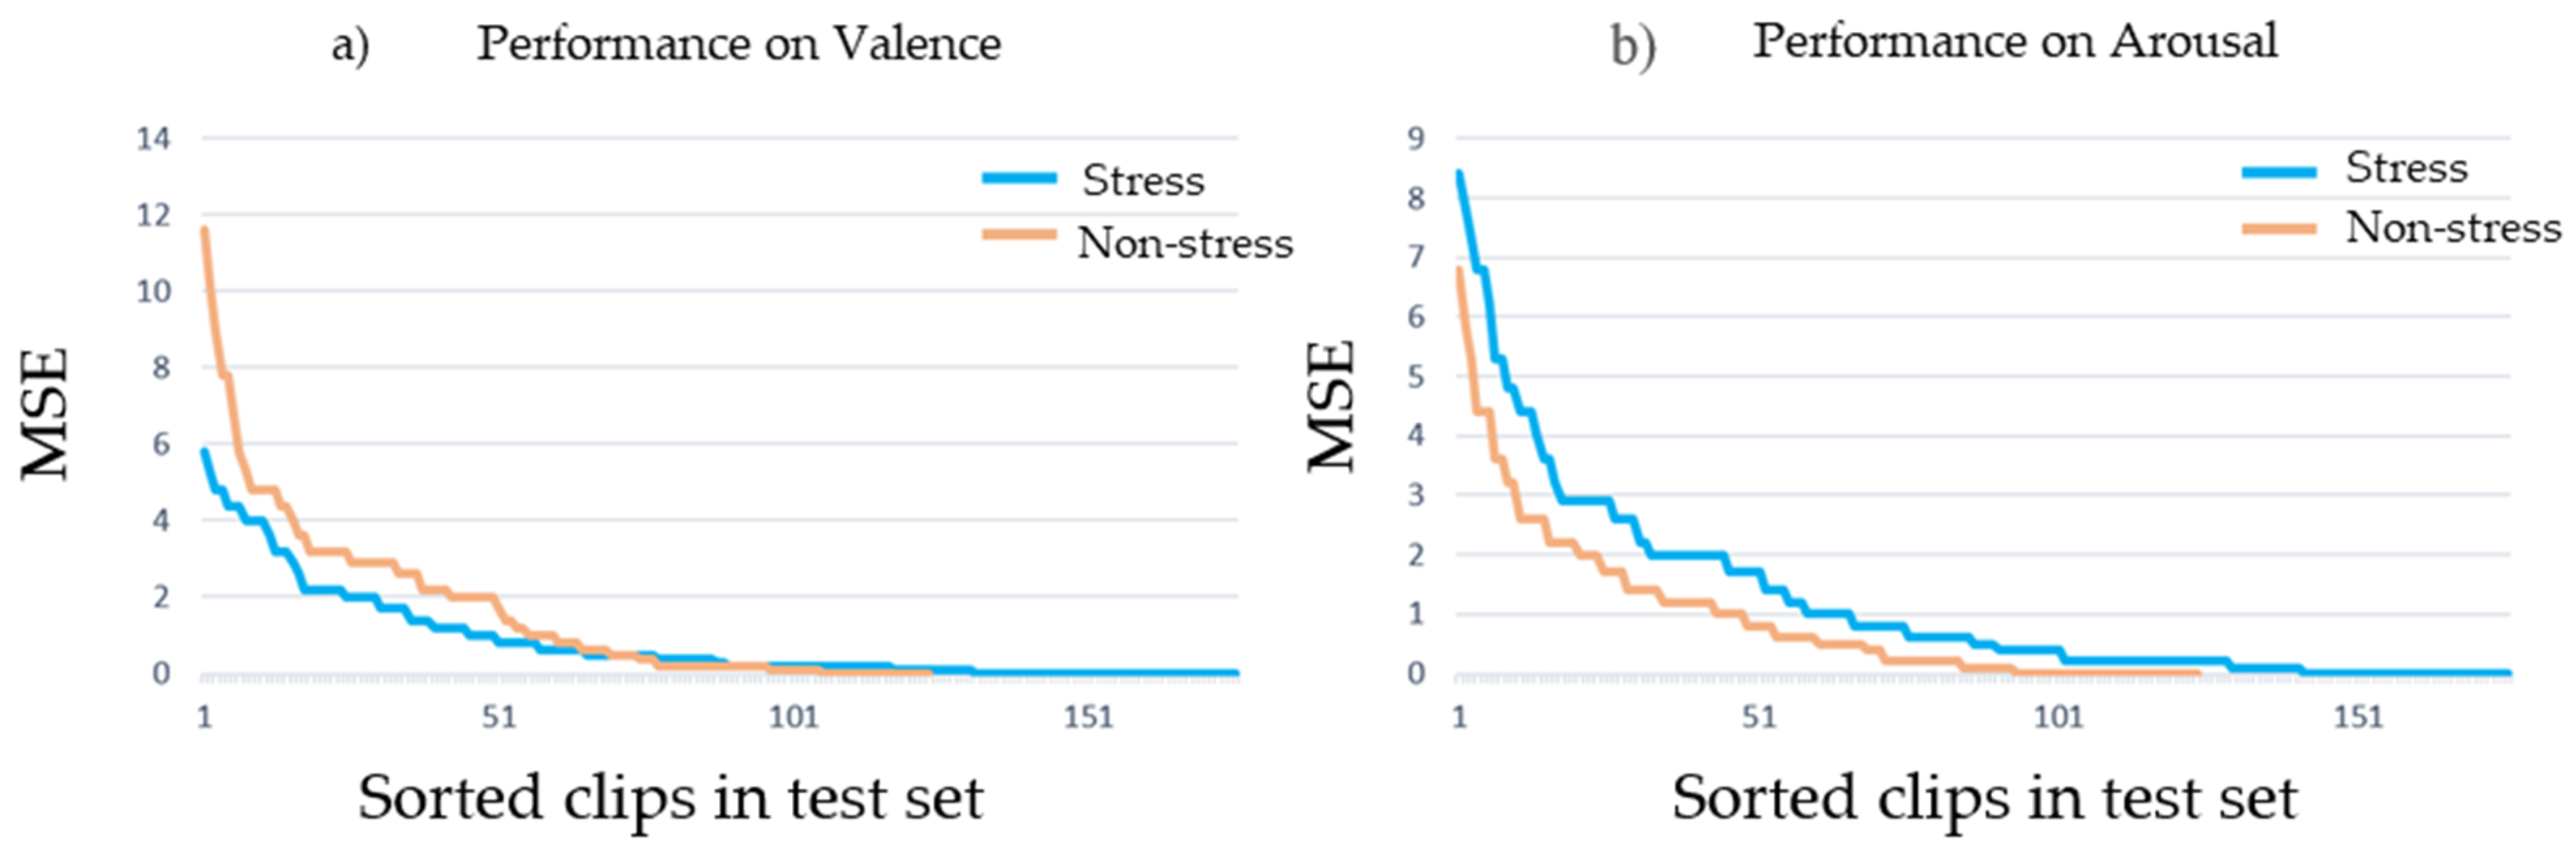
In addition, Figure 8 summarizes the results obtained for each example in the test set. Figure 8a shows the MSE of valence for the stress and non-stress samples, where the stress cases obtained lower error. Besides Figure 8b illustrates the results of arousal, where the non-stress samples achieved better performance than the stress cases.
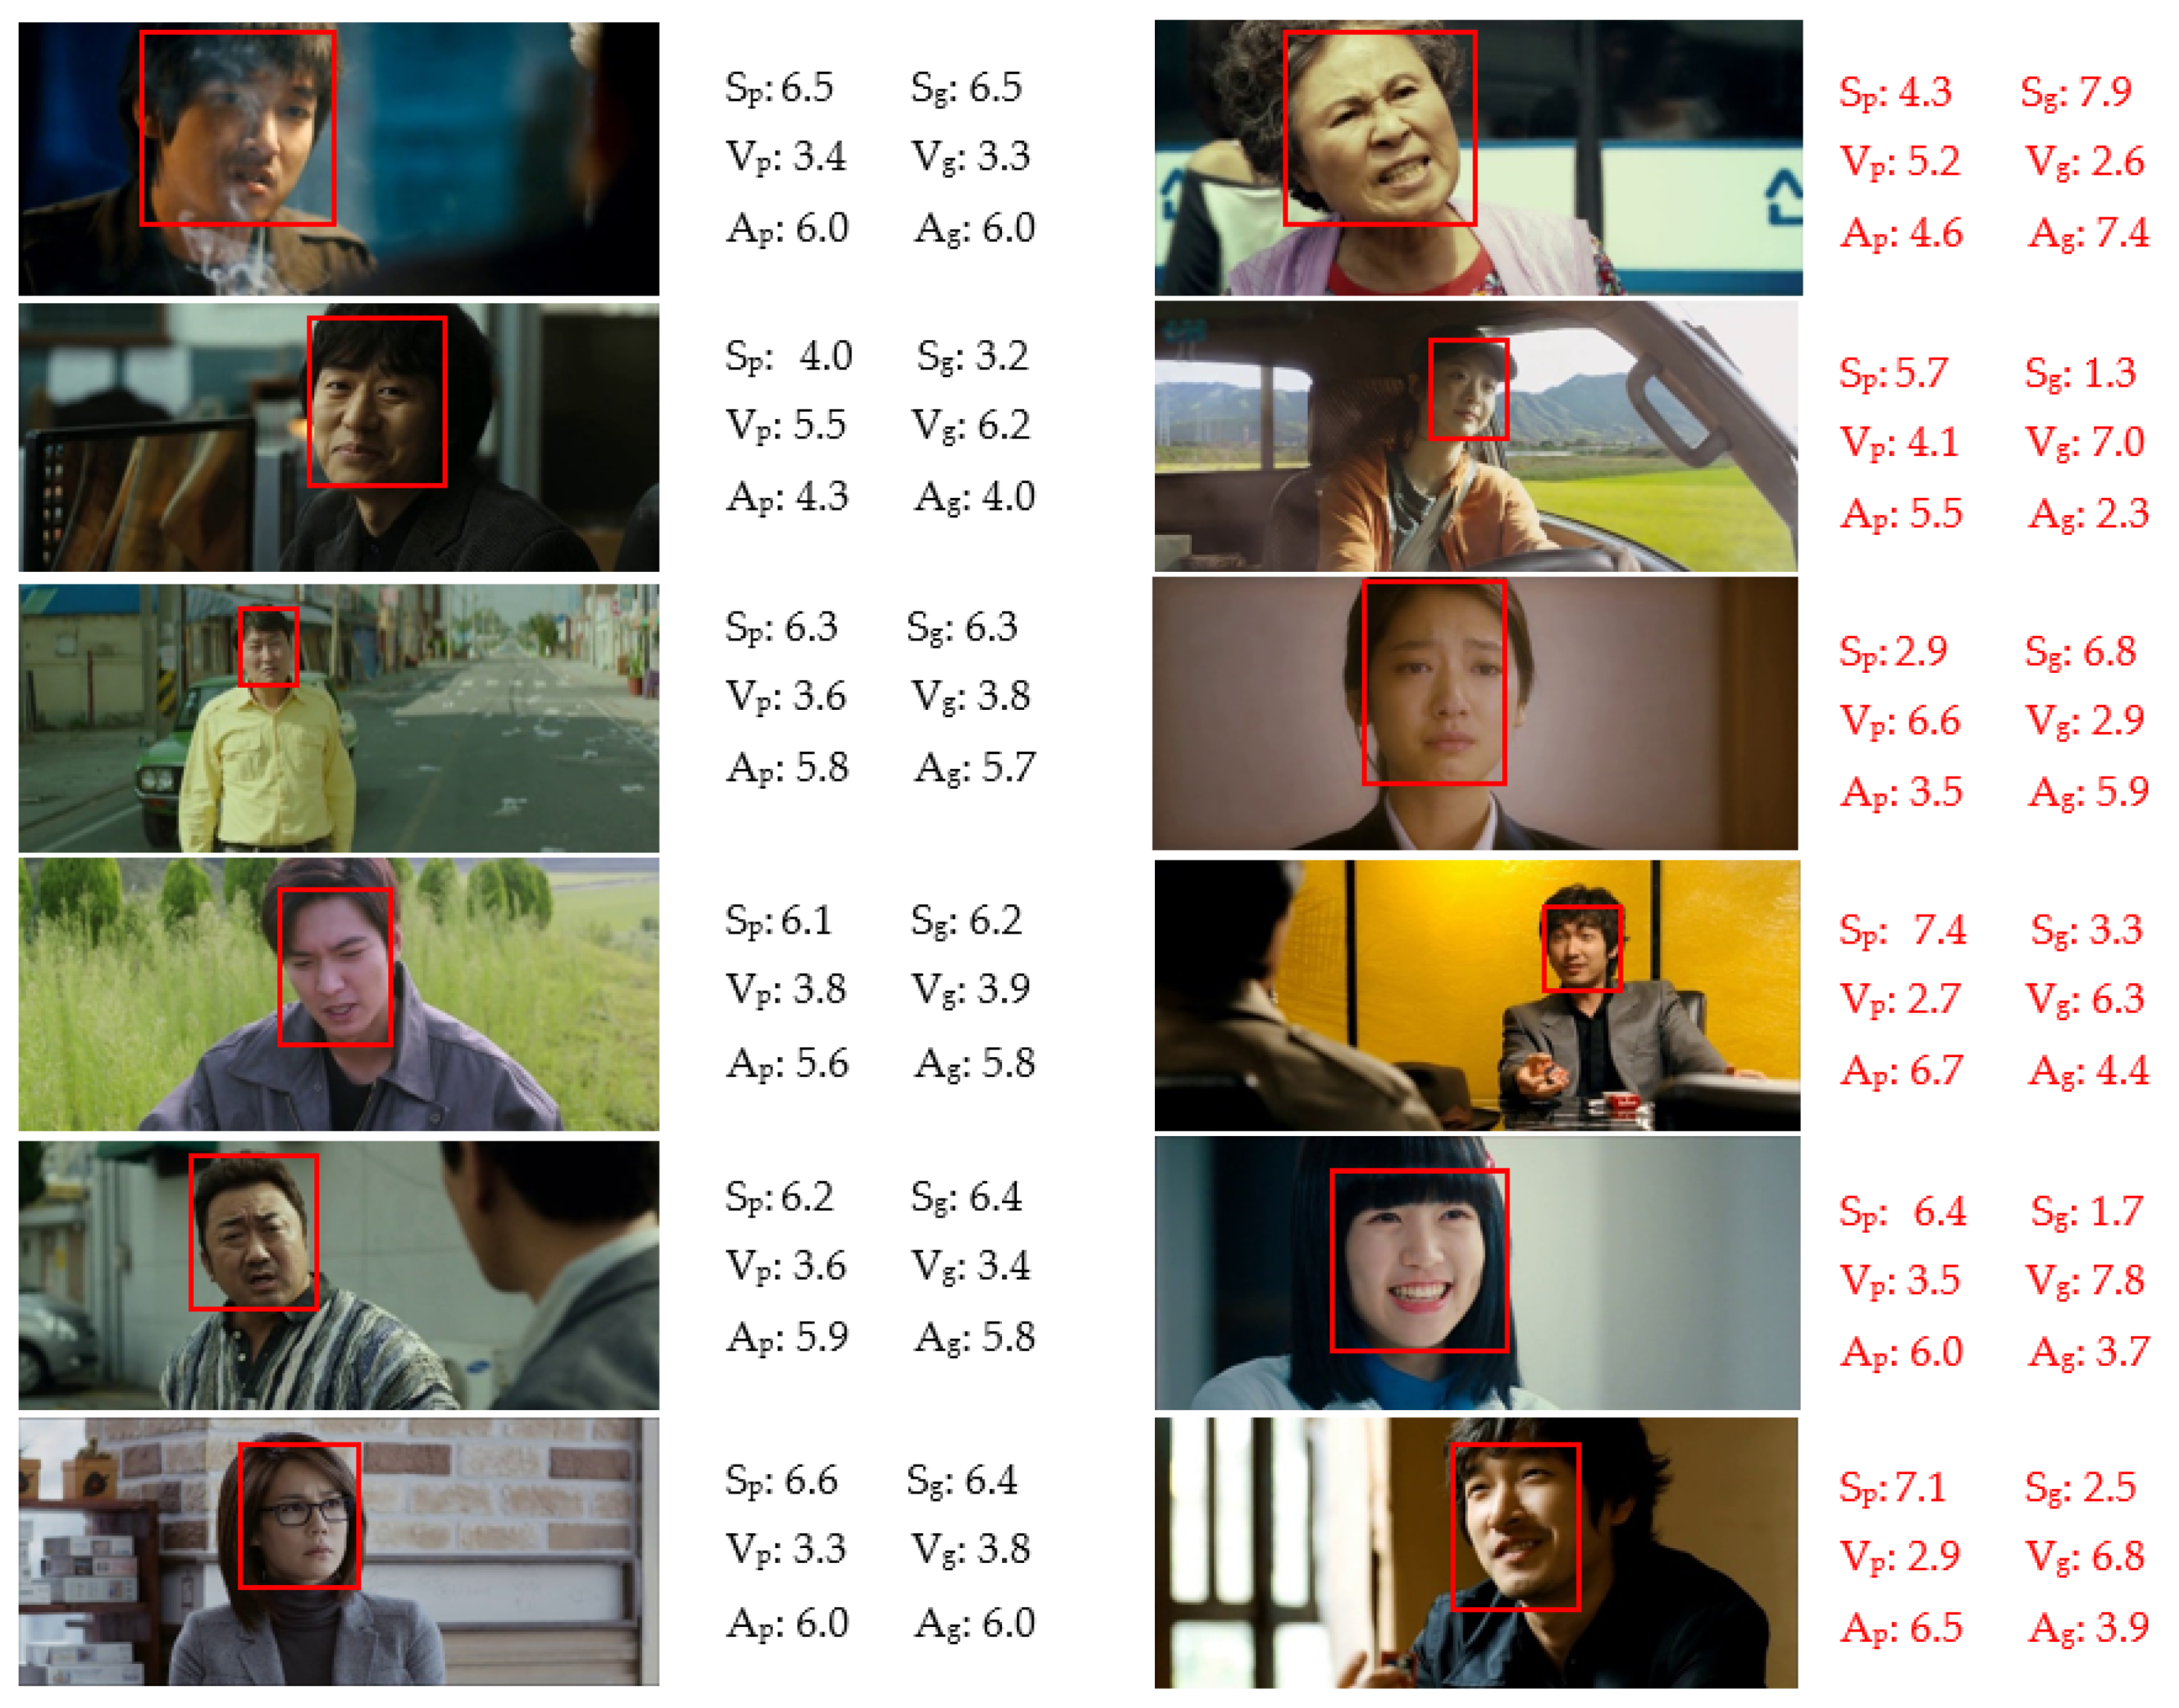
Finally, Figure 9 shows the baseline model’s predictions with quite good predictable results in the left column’s images, and a large gap between ground truth and prediction values (indicated in red) in the right column’s images.
5. Conclusions
Our analysis shows that stress has a positive correlation with arousal and a negative with valence. We also presented the SADVAW dataset that contains video clips closer to the actual scene to address the problem of stress recognition in the wild for this task. The video clips were evaluated and annotated with a 9-level scale for stress, valence, and arousal classes. Moreover, we developed a baseline model based on deep learning techniques to verify that the levels of stress, valence, and arousal could be assessed in our dataset. The SADVAW dataset has also contributed to clarifying the correlation between stress and the dimensions of valence and arousal.
Although the data collected from movies represent the real-world scenario more accurately than the data collected from controlled environments, there also exists certain limitations such as influence of scripted scenario and acting ability of the actors. Additionally, the facial expressions of the movie characters are more intense as compared to real-life expressions because the movies are designed to impact the viewers as much as possible. However, the clips taken from popular movies with experienced and professionally-trained actors minimize such limitations.
In the future, we hope to increase the number of samples available in the dataset and refine the quality of selected samples. In particular, we are interested in collecting more samples of currently infrequent values such as stress values, arousal values at 1, 2 or valence values at 8, 9. We also intend to use the dataset to further research the real-world emotion expressions.
Author Contributions
Conceptualization, T.-D.T. and H.-J.Y.; Formal analysis, T.-D.T.; Funding acquisition, H.-J.Y., S.-H.K. and G.-S.L.; Methodology, T.-D.T.; Project administration, H.-J.Y., S.-H.K. and G.-S.L.; Supervision, H.-J.Y., S.-H.K. and G.-S.L.; Writing—review & editing, T.-D.T., J.K., N.-H.H. and S.P. All authors have read and agreed to the published version of the manuscript.
Funding
This work was supported by a National Research Foundation of Korea (NRF) grant funded by the Korea government (MSIT). (NRF-2020R1A4A1019191).
Institutional Review Board Statement
Not applicable.
Informed Consent Statement
Not applicable.
Data Availability Statement
The SADVAW dataset can be downloaded at https://www.kaggle.com/c/2020kerc/data, accessed on 13 April 2021.
Conflicts of Interest
The authors declare no conflict of interest.
References
- Posner, J.; Russell, J.A.; Peterson, B.S. The circumplex model of affect: An integrative approach to affective neuroscience, cognitive development, and psychopathology. Dev. Psychopathol. 2005. [Google Scholar] [CrossRef] [PubMed]
- Lewis, P.A.; Critchley, H.D.; Rotshtein, P.; Dolan, R.J. Neural correlates of processing valence and arousal in affective words. Cereb. Cortex. 2007. [Google Scholar] [CrossRef] [PubMed] [Green Version]
- Oliveira, A.; Teixeira, M.; Fonseca, I.B.B.; Oliveira, M.; Kornbrot, D.; Msetfi, R. Macrae Joint model-parameter validation of self-estimates of valence and arousal: Probing a differential-weighting model of affective intensity. Meet. Int. Soc. Psychophys. 2006, 22, 245–250. [Google Scholar]
- Alvarado, N. Arousal and valence in the direct scaling of emotional response to film clips. Motiv. Emot. 1997. [Google Scholar] [CrossRef]
- Christianson, S.-A. Emotional stress and eyewitness memory: A critical review. Psychol. Bull. 1992. [Google Scholar] [CrossRef]
- Barrett, L.F.; Russell, J.A. The structure of current affect: Controversies and emerging consensus. Curr. Dir. Psychol. Sci. 1999. [Google Scholar] [CrossRef]
- Wichary, S.; Mata, R.; Rieskamp, J. Probabilistic inferences under emotional stress: How arousal affects decision processes. J. Behav. Decis. Mak. 2016. [Google Scholar] [CrossRef]
- Carneiro, D.; Novais, P.; Augusto, J.C.; Payne, N. New methods for stress assessment and monitoring at the workplace. IEEE Trans. Affect. Comput. 2019. [Google Scholar] [CrossRef] [Green Version]
- Alberdi, A.; Aztiria, A.; Basarab, A. Towards an Automatic Early Stress Recognition System for Office Environments Based on Multimodal Measurements: A Review; Elsevier: Amsterdam, The Netherlands, 2016. [Google Scholar]
- Can, Y.S.; Arnrich, B.; Ersoy, C. Stress detection in daily life scenarios using smart phones and wearable sensors: A Survey. J. Biomed. Inform. 2019, 92, 103139. [Google Scholar] [CrossRef]
- Schmidt, P.; Reiss, A.; Duerichen, R.; van Laerhoven, K. Wearable Affect and stress recognition: A review. arXiv 2018, arXiv:1811.08854. [Google Scholar]
- Hu, P.; Ramanan, D. Finding tiny faces. In Proceedings of the 30th IEEE Conference on Computer Vision and Pattern Recognition, CVPR 2017, Honolulu, HI, USA, 21–26 July 2017. [Google Scholar]
- He, K.; Zhang, X.; Ren, S.; Sun, J. Deep residual learning for image recognition. In Proceedings of the IEEE Computer Society Conference on Computer Vision and Pattern Recognition, Las Vegas, NV, USA, 27–30 June 2016; pp. 770–778. [Google Scholar]
- Hochreiter, S.; Schmidhuber, J. Long Short-Term Memory. Neural Comput. 1997, 9, 1735–1780. [Google Scholar] [CrossRef] [PubMed]
- Schmidt, P.; Reiss, A.; Duerichen, R.; Van Laerhoven, K. Introducing WeSAD, a multimodal dataset for wearable stress and affect detection. In Proceedings of the ICMI 2018 International Conference on Multimodal Interaction, Boulder, CO, USA, 10–20 October 2018. [Google Scholar]
- Jaiswal, M.; Bara, C.-P.; Luo, Y.; Burzo, M.; Mihalcea, R.; Provost, E.M. MuSE: A multimodal dataset of stressed emotion. In Proceedings of the Language Resources and Evaluation, Marseille, France, 11–16 May 2020. [Google Scholar]
- Koldijk, S.; Sappelli, M.; Verberne, S.; Neerincx, M.A.; Kraaij, W. The swell knowledge work dataset for stress and user modeling research. In Proceedings of the ICMI 2014 International Conference on Multimodal Interaction, Bogazici University, Istanbul, Turkey, 12–16 November 2014. [Google Scholar]
- Chen, G. A Gentle Tutorial of Recurrent Neural Network with Error Backpropagation. arXiv 2016, arXiv:1610.02583. [Google Scholar]
- Wöllmer, M.; Kaiser, M.; Eyben, F.; Schuller, B.; Rigoll, G. LSTM-modeling of continuous emotions in an audiovisual affect recognition framework. Image. Vis. Comput. 2013. [Google Scholar] [CrossRef] [Green Version]
- Avots, E.; Sapiński, T.; Bachmann, M.; Kamińska, D. Audiovisual emotion recognition in wild. In Proceedings of the Machine Vision and Applications, Tokyo, Japan, 27–31 May 2019. [Google Scholar]
- Chatterjee, A.; Gupta, U.; Chinnakotla, M.K.; Srikanth, R.; Galley, M.; Agrawal, P. Understanding emotions in text using deep learning and big data. Comput. Hum. Behav. 2019. [Google Scholar] [CrossRef]
- Ng, J.Y.H.; Hausknecht, M.; Vijayanarasimhan, S.; Vinyals, O.; Monga, R.; Toderici, G. Beyond short snippets: Deep networks for video classification. In Proceedings of the IEEE Computer Society Conference on Computer Vision and Pattern Recognition, Boston, MA, USA, 7–12 June 2015. [Google Scholar]
- Graves, A.; Mohamed, A.R.; Hinton, G. Speech recognition with deep recurrent neural networks. In Proceedings of the ICASSP, IEEE International Conference on Acoustics, Speech and Signal Processing, Vancouver, BC, Canada, 26–31 May 2013. [Google Scholar]
- Graves, A.; Jaitly, N. Towards end-to-end speech recognition with recurrent neural networks. In Proceedings of the 31st International Conference on Machine Learning, ICML 2014, Beijing, China, 21–26 June 2014. [Google Scholar]
- Khanh, T.L.B.; Kim, S.H.; Lee, G.; Yang, H.J.; Baek, E.T. Korean video dataset for emotion recognition in the wild. Multimed. Tools Appl. 2020. [Google Scholar] [CrossRef]
- Pritha Bhandari Standard Deviation|A Step by Step Guide with Formulas. Available online: https://www.scribbr.com/statistics/standard-deviation/ (accessed on 20 December 2020).
- Stephanie Glen T Test (Student’s T-Test): Definition and Examples—Statistics How To. Available online: https://www.statisticshowto.com/probability-and-statistics/t-test/ (accessed on 9 January 2021).
- Russakovsky, O.; Deng, J.; Su, H.; Krause, J.; Satheesh, S.; Ma, S.; Huang, Z.; Karpathy, A.; Khosla, A.; Bernstein, M.; et al. ImageNet large scale visual recognition challenge. Int. J. Comput. Vis. 2015. [Google Scholar] [CrossRef] [Green Version]
- Stephanie Glen Relative Error: Definition, Formula, Examples—Statistics How to. Available online: https://www.statisticshowto.com/relative-error/ (accessed on 8 March 2021).
- Jaiswal, S.; Song, S.; Valstar, M. Automatic prediction of depression and anxiety from behaviour and personality attributes. In Proceedings of the 2019 8th International Conference on Affective Computing and Intelligent Interaction, ACII 2019, Cambridge, UK, 3–6 September 2019. [Google Scholar]
- Nicolaou, M.A.; Gunes, H.; Pantic, M. Continuous prediction of spontaneous affect from multiple cues and modalities in valence-arousal space. IEEE Trans. Affect. Comput. 2011. [Google Scholar] [CrossRef] [Green Version]
- Muszynski, M.; Tian, L.; Lai, C.; Moore, J.; Kostoulas, T.; Lombardo, P.; Pun, T.; Chanel, G. Recognizing induced emotions of movie audiences from multimodal information. IEEE Trans. Affect. Comput. 2019. [Google Scholar] [CrossRef]
Figure 1.
Structure of an LSTM unit.
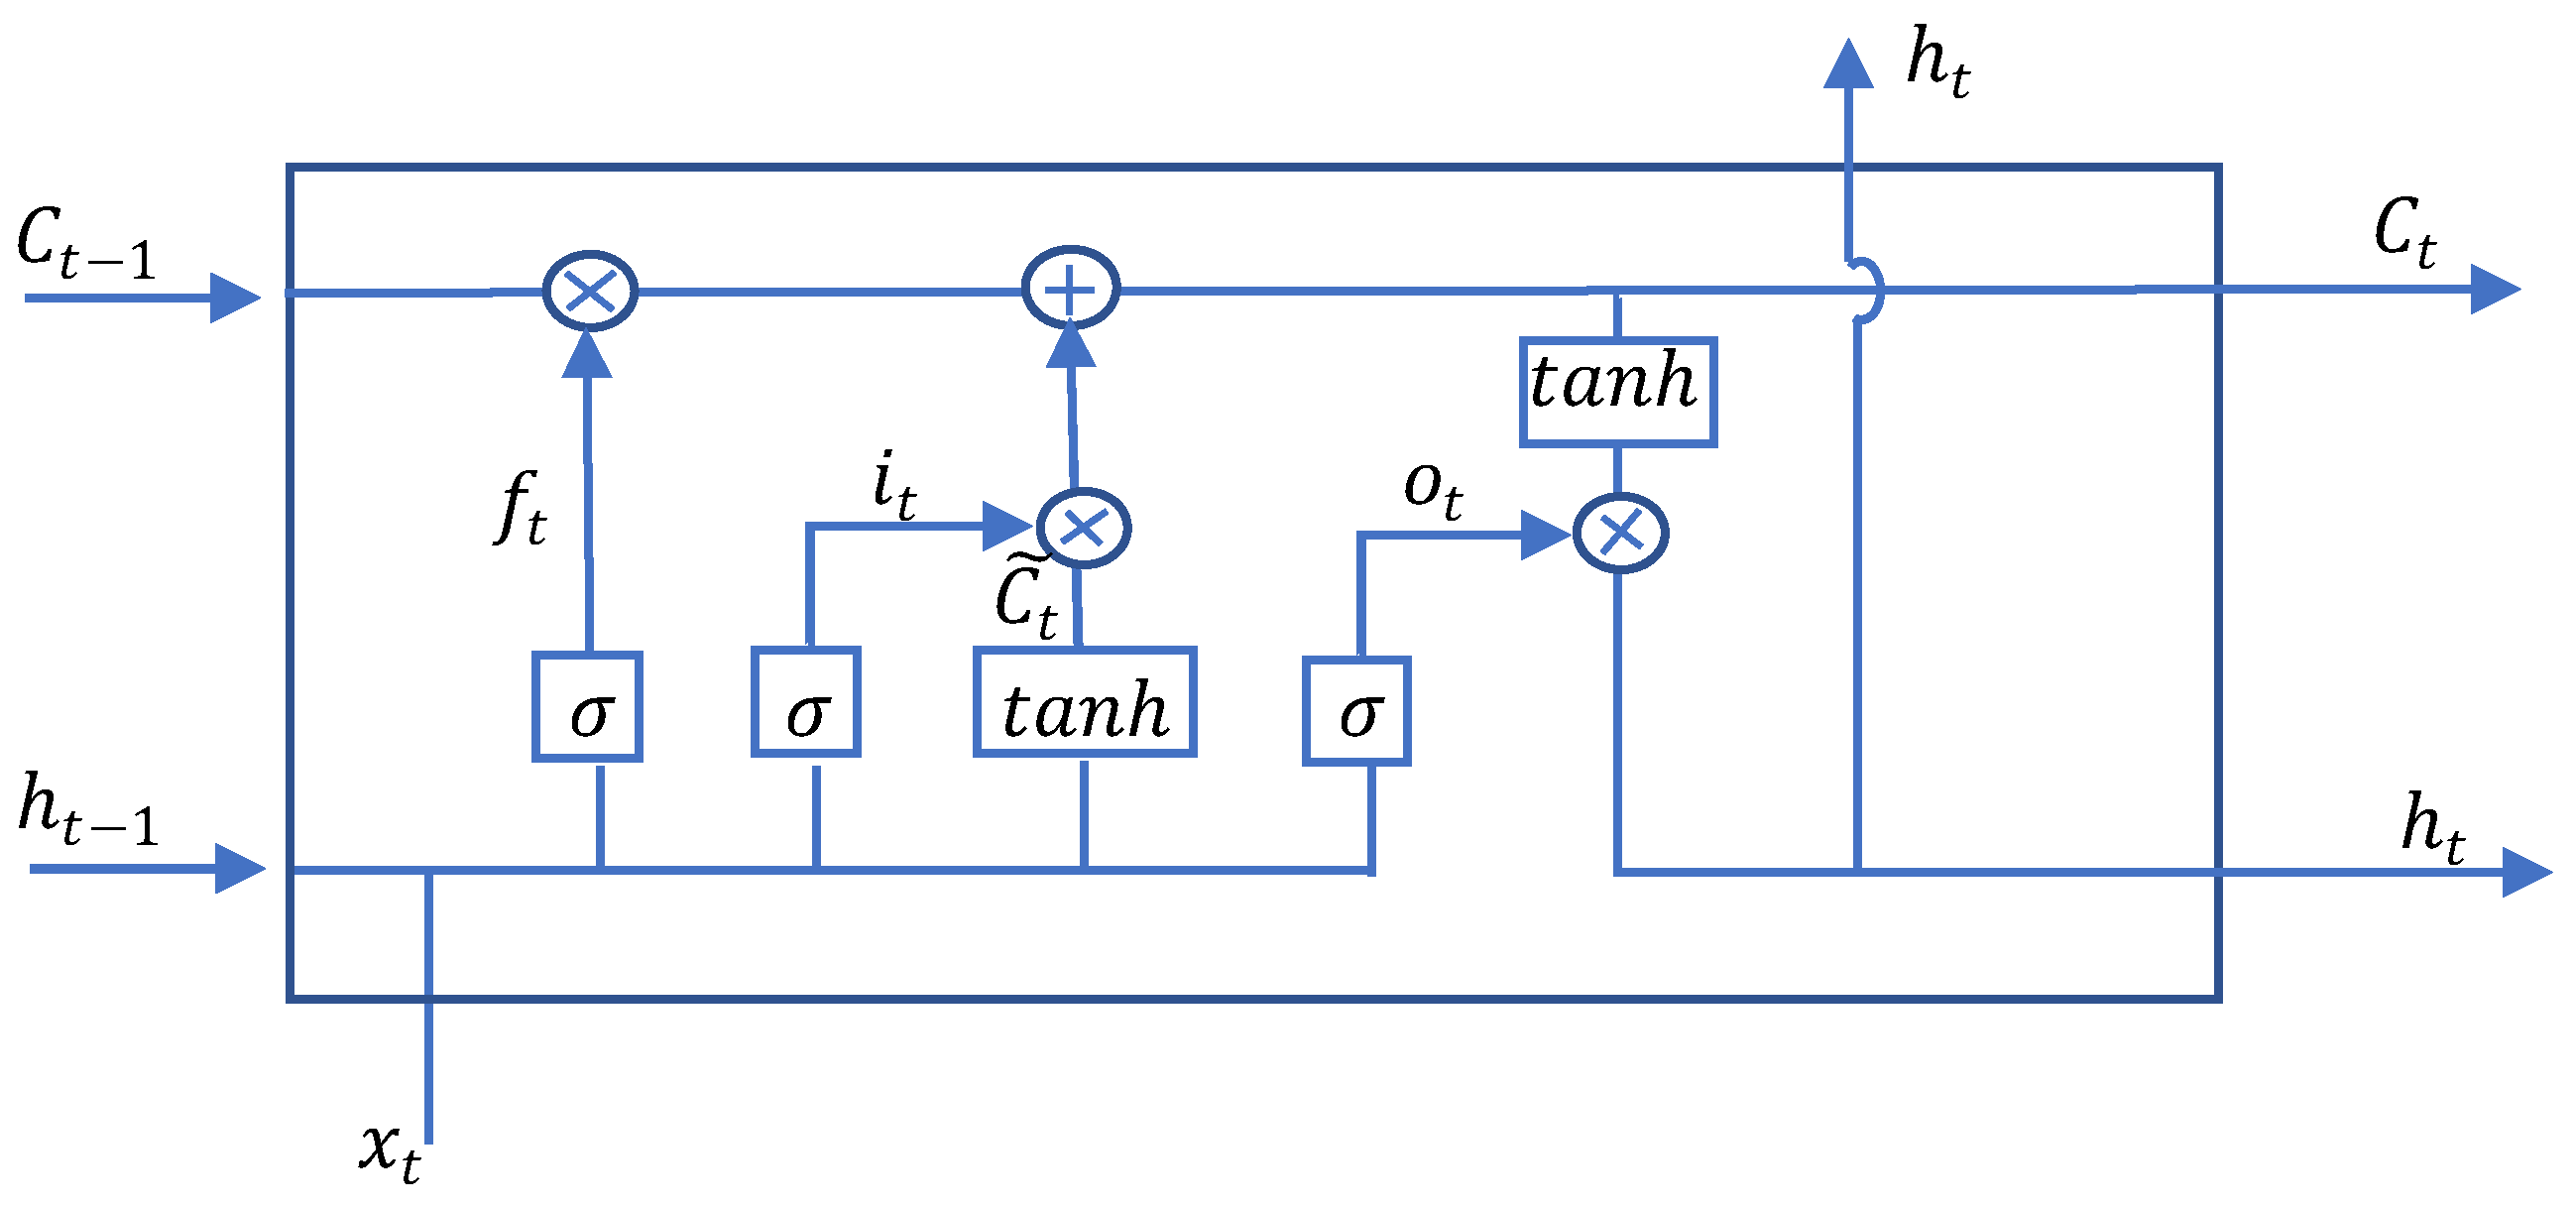
Figure 2.
Examples of different scores of valence, arousal, and stress in the SADVAW dataset. The first four rows present examples for stress values, the next four rows include examples for valence values, and the last four rows show examples for arousal values. Each row consists of the sequence of frames of a video with the corresponding annotated value on the left. The value range of stress, valence, and arousal is from 1 to 9. Here, we only present the videos with some representative values (2–4–6–8) for each class.
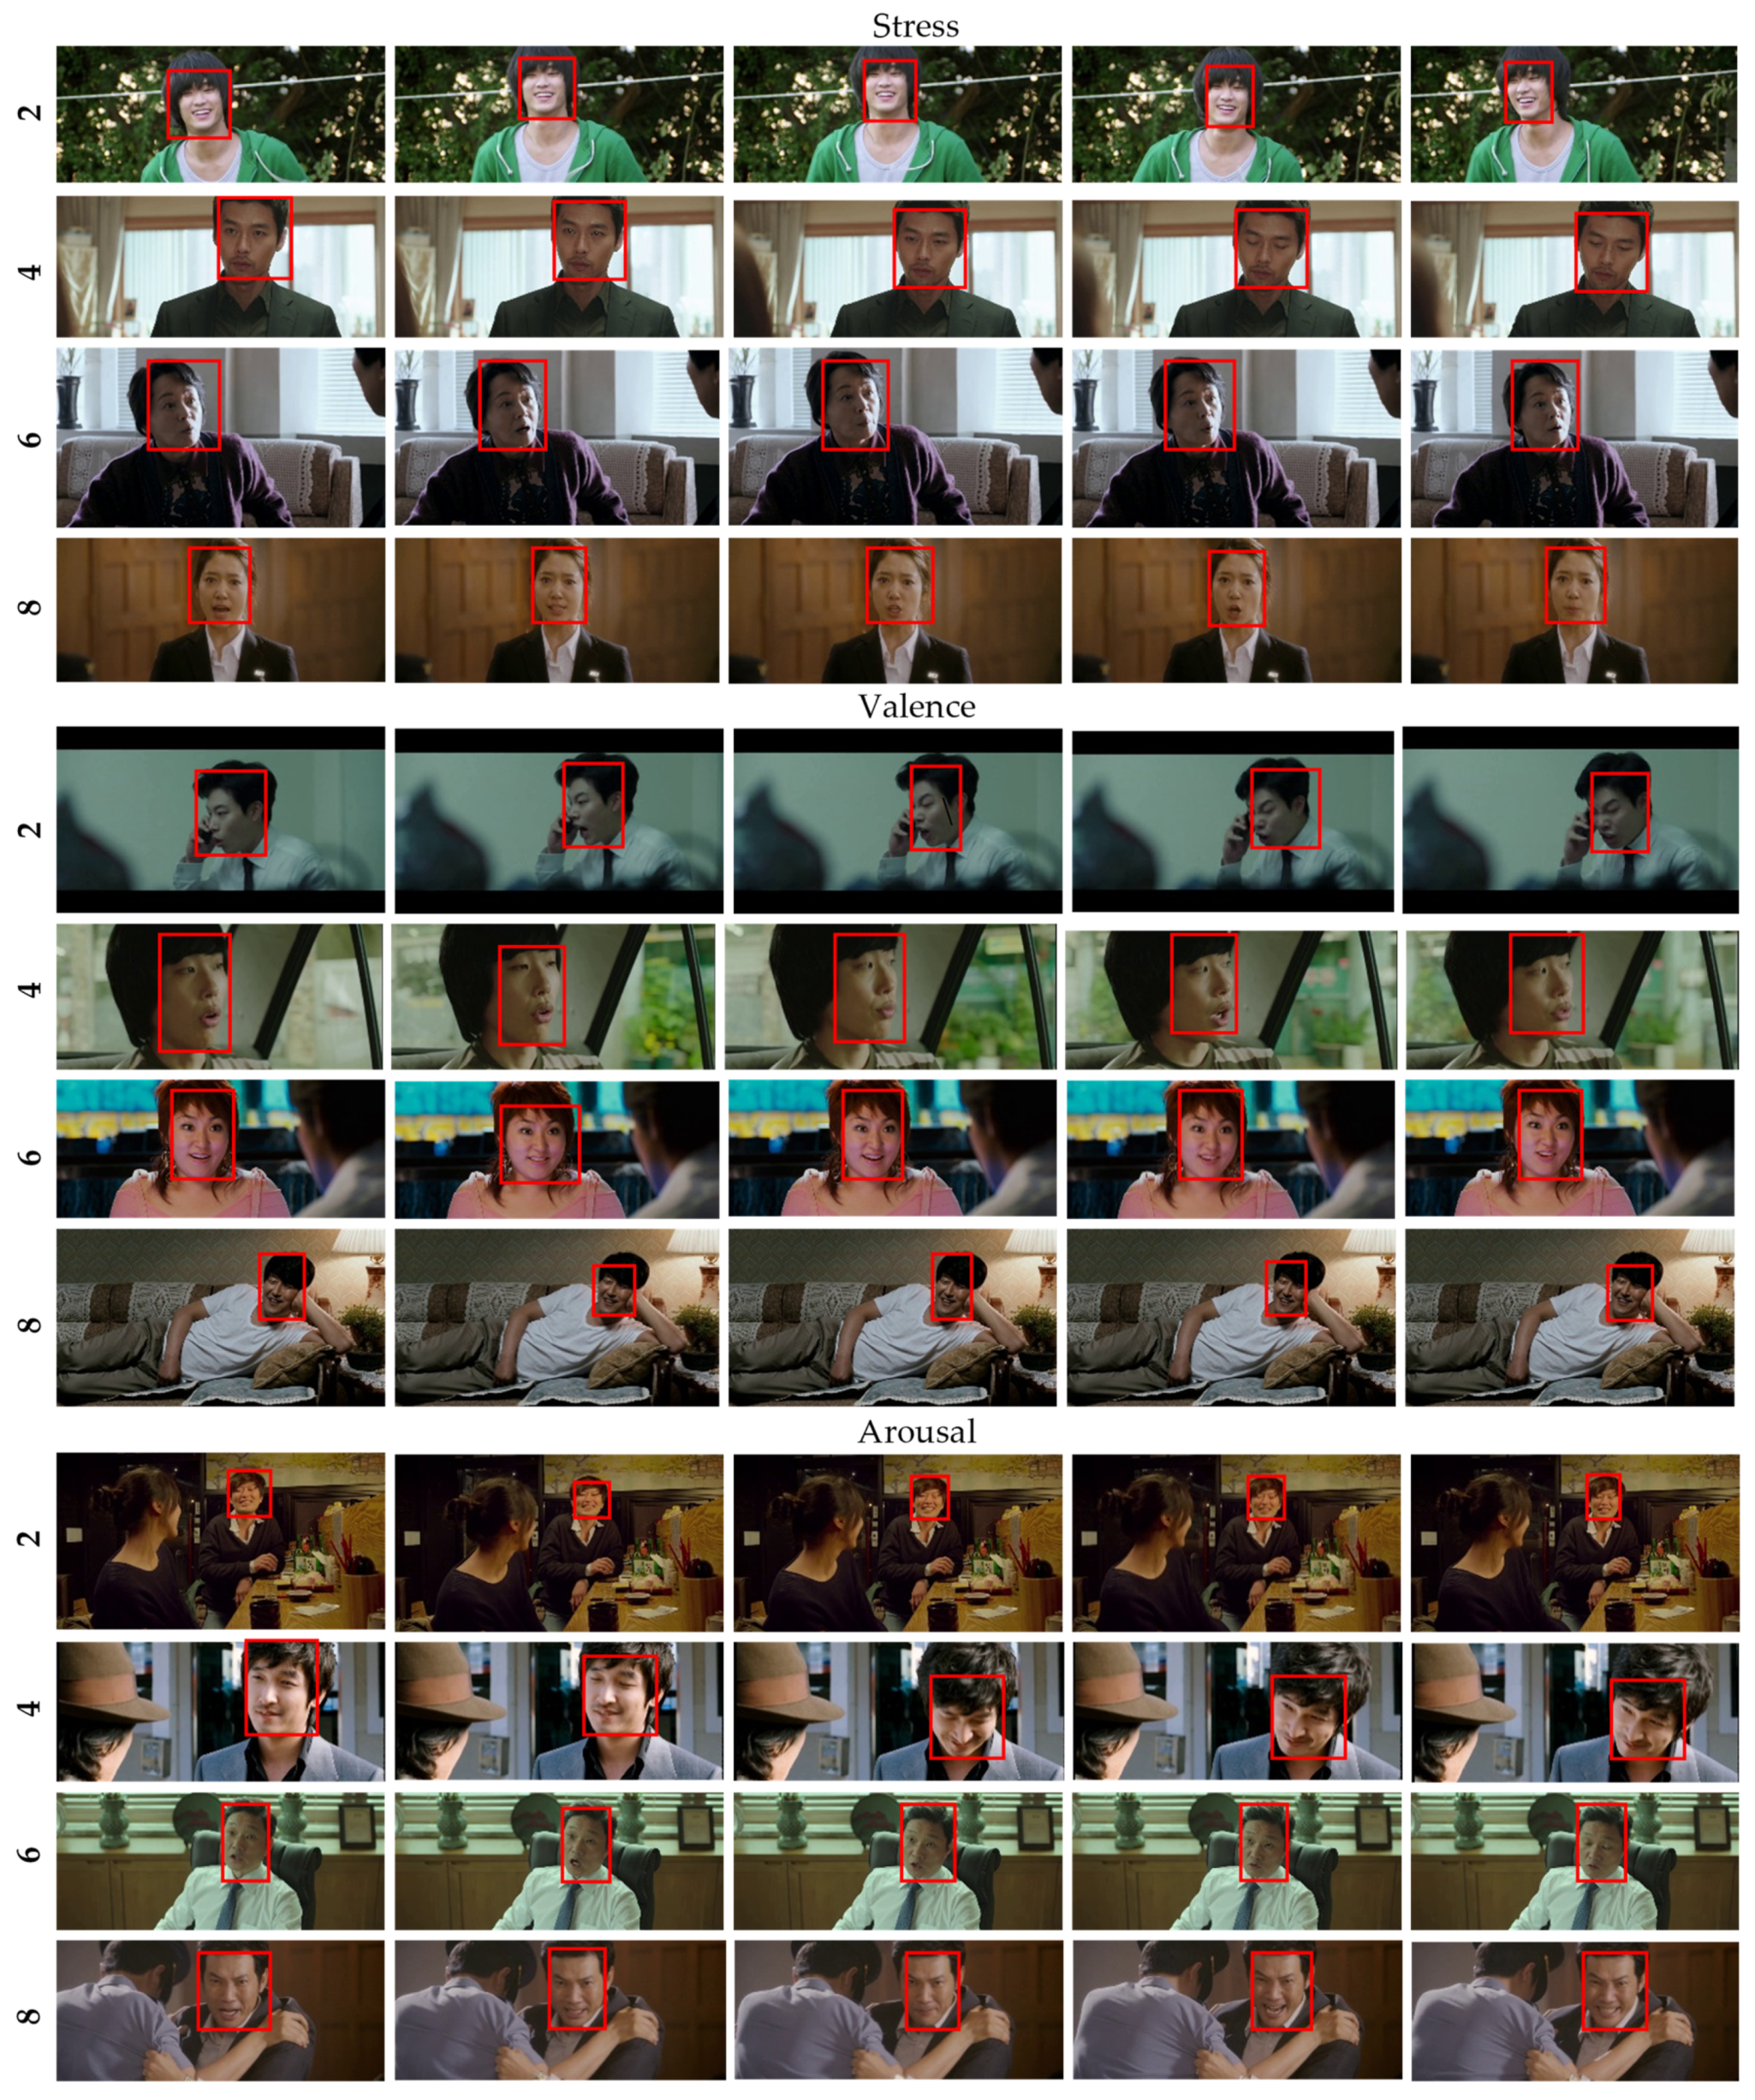
Figure 3.
Frame examples in the SADVAW Dataset.
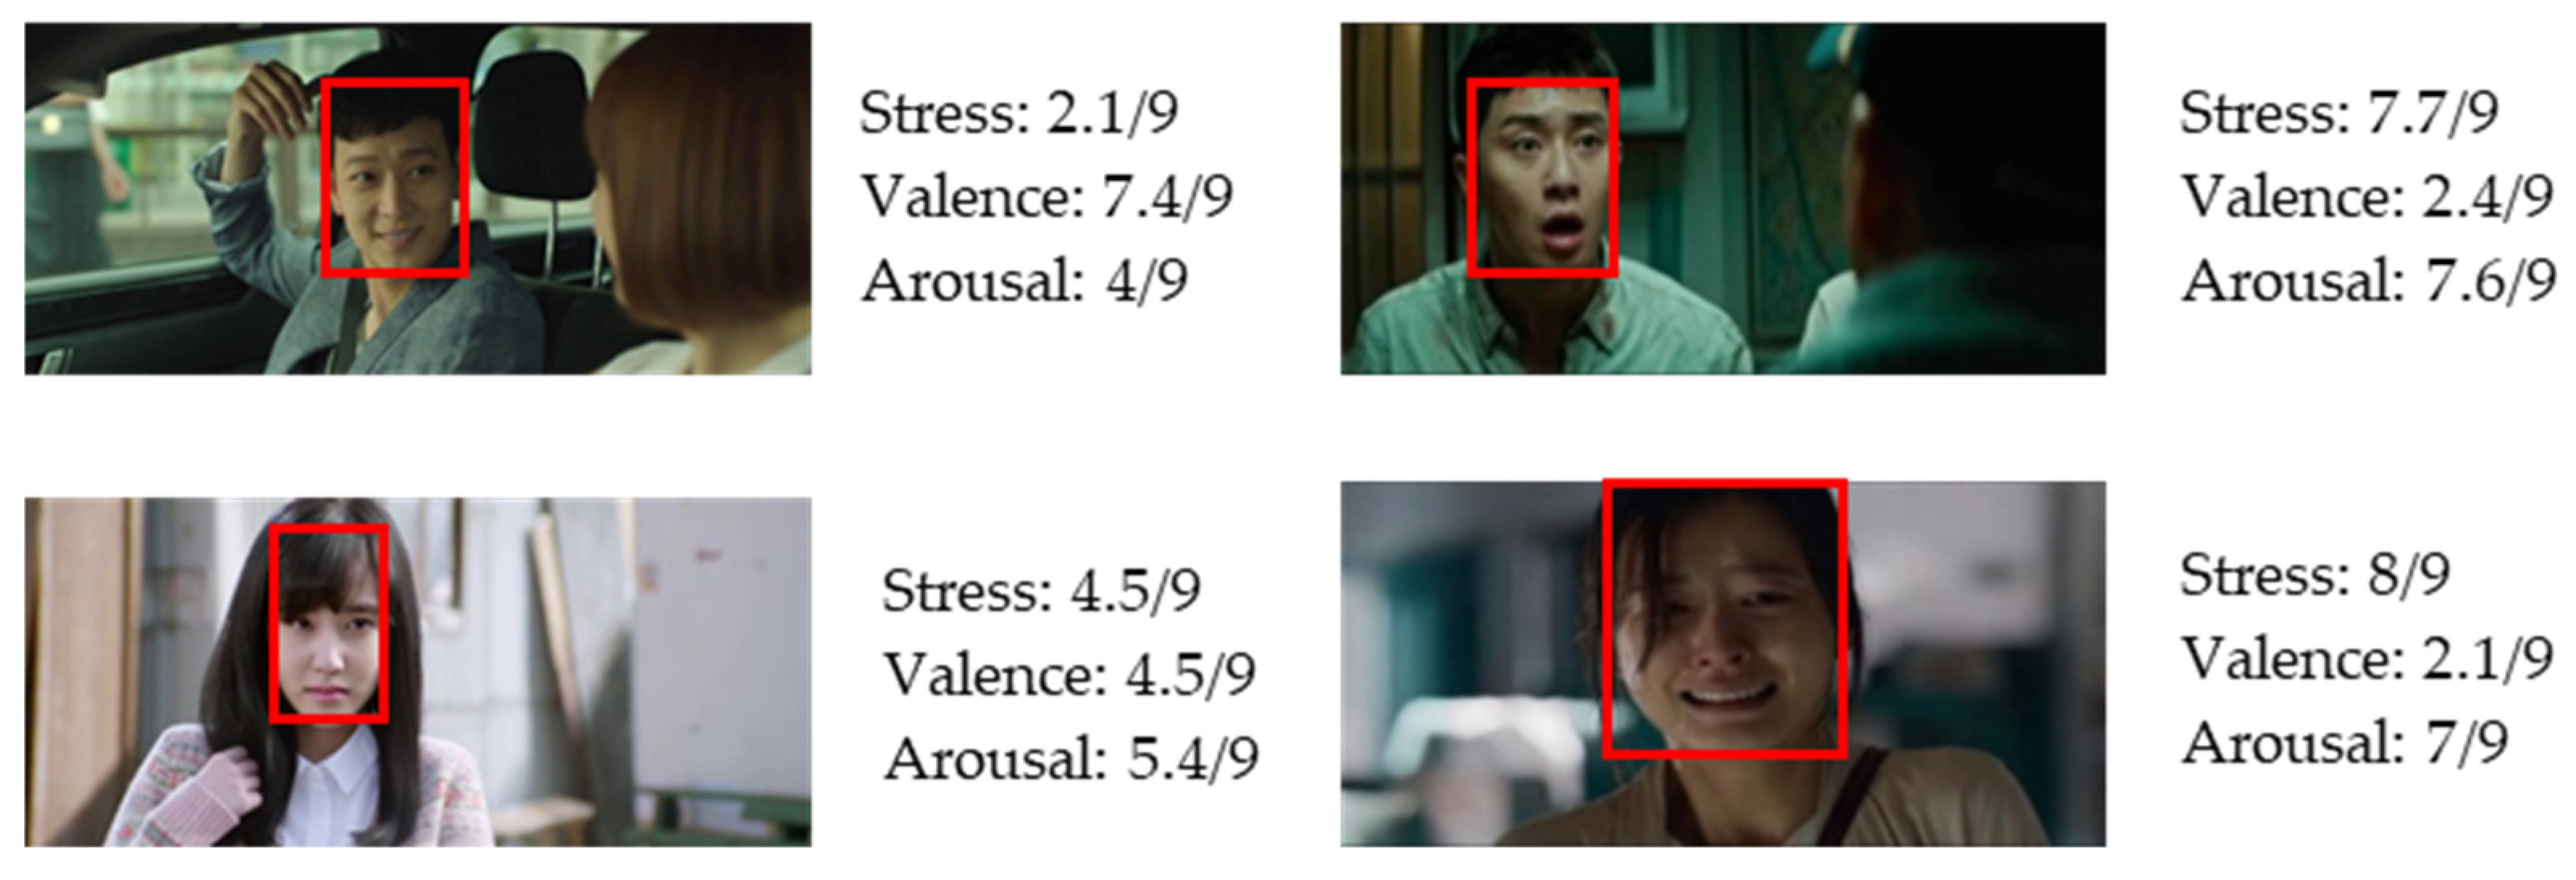
Figure 4.
Examples of the number of agreements of people who annotated the given video with various stress levels, valence, and arousal.
Figure 4.
Examples of the number of agreements of people who annotated the given video with various stress levels, valence, and arousal.
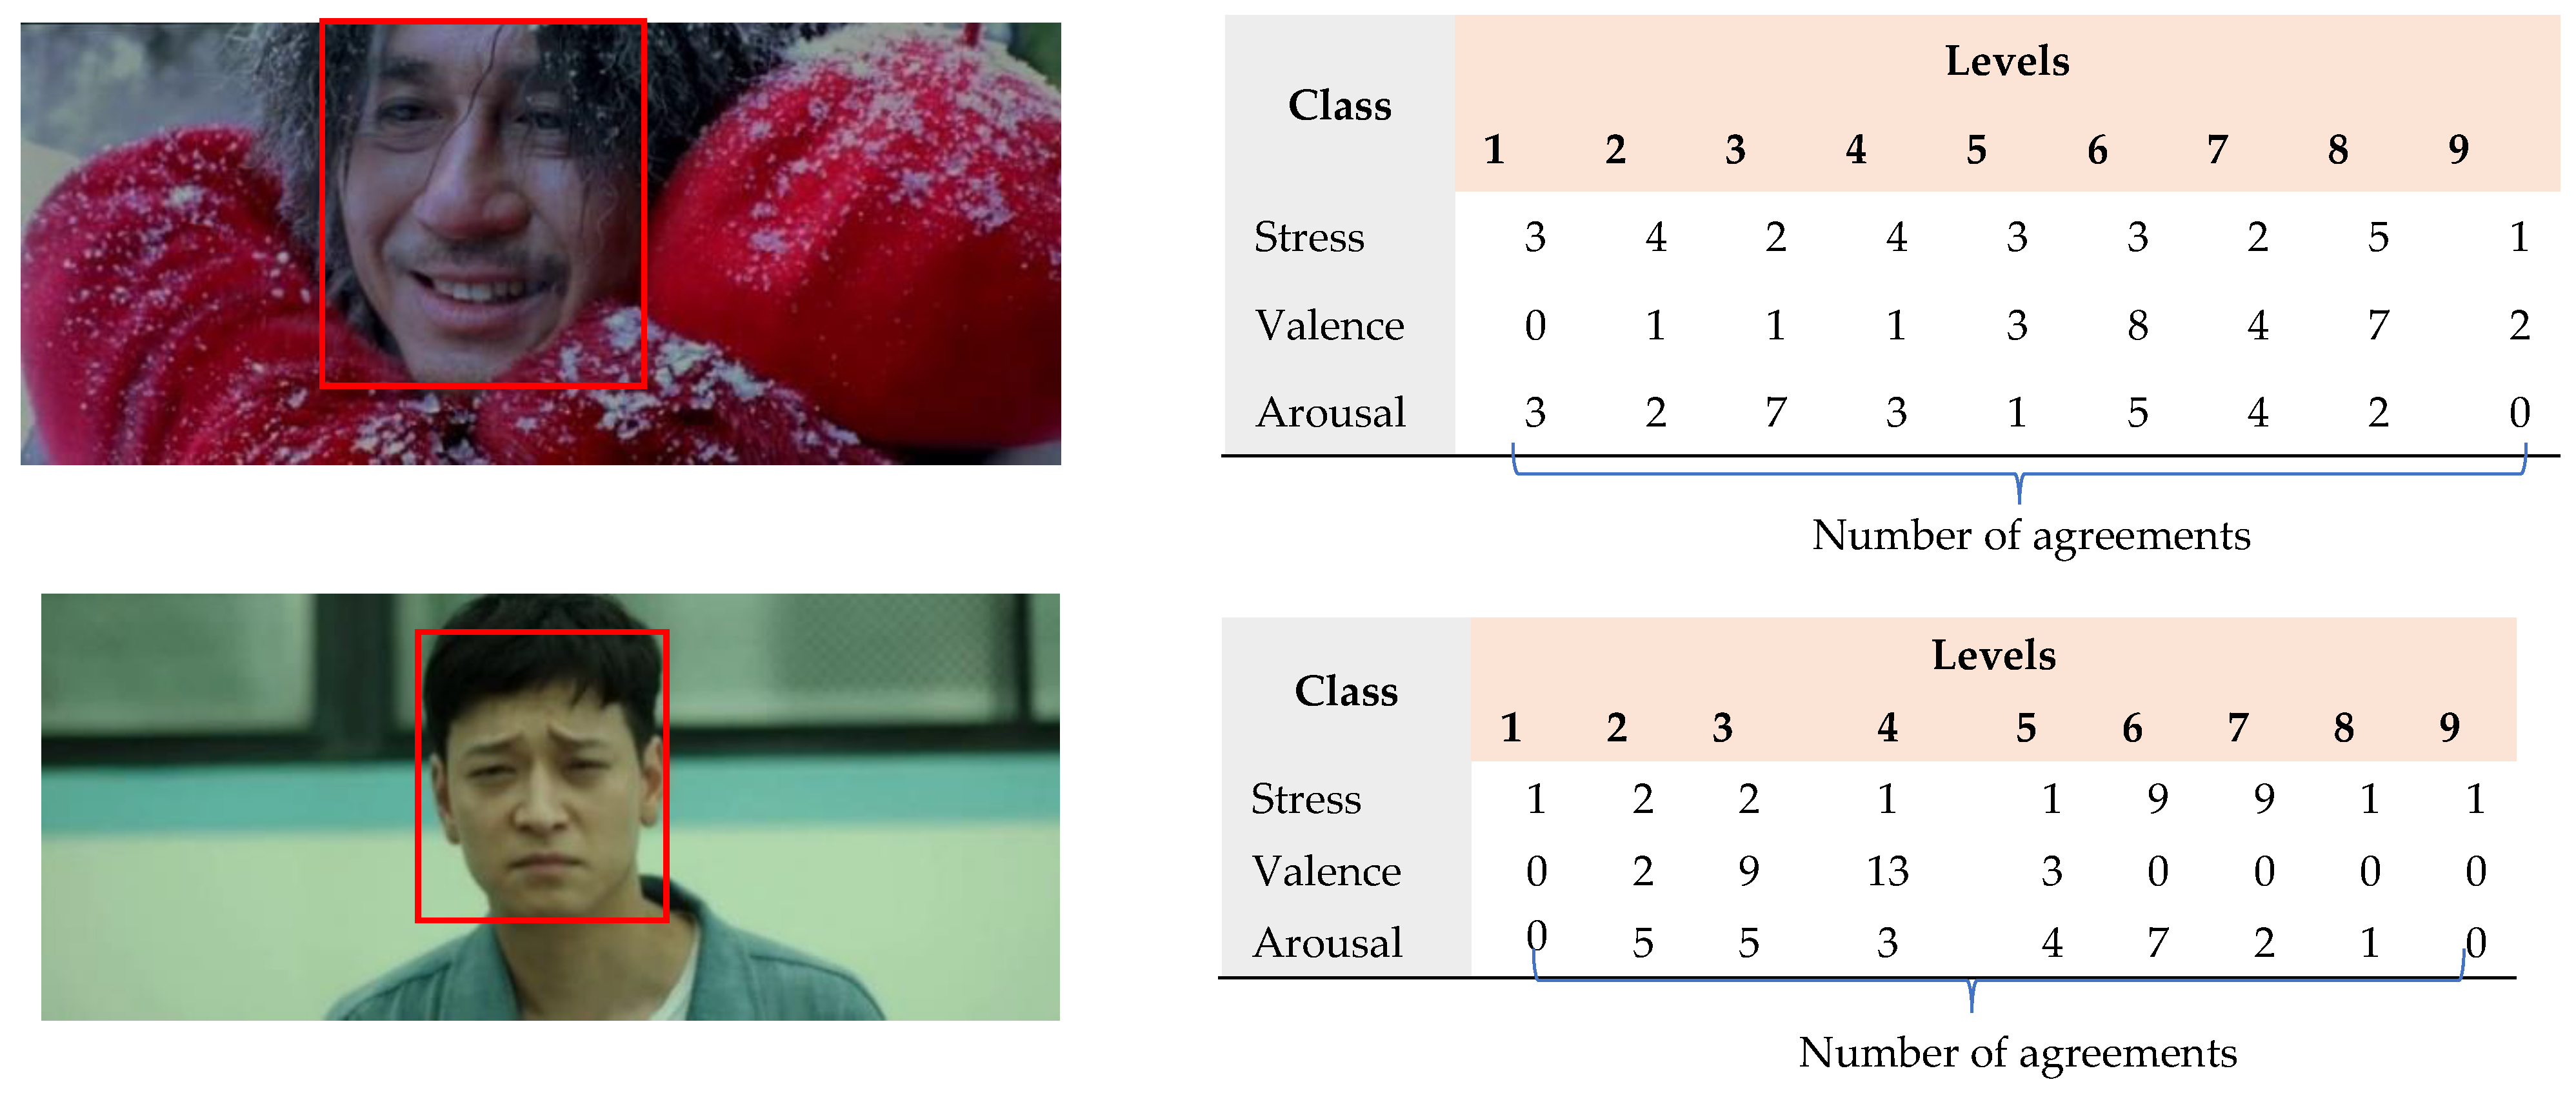
Figure 5.
Distribution of all classes.
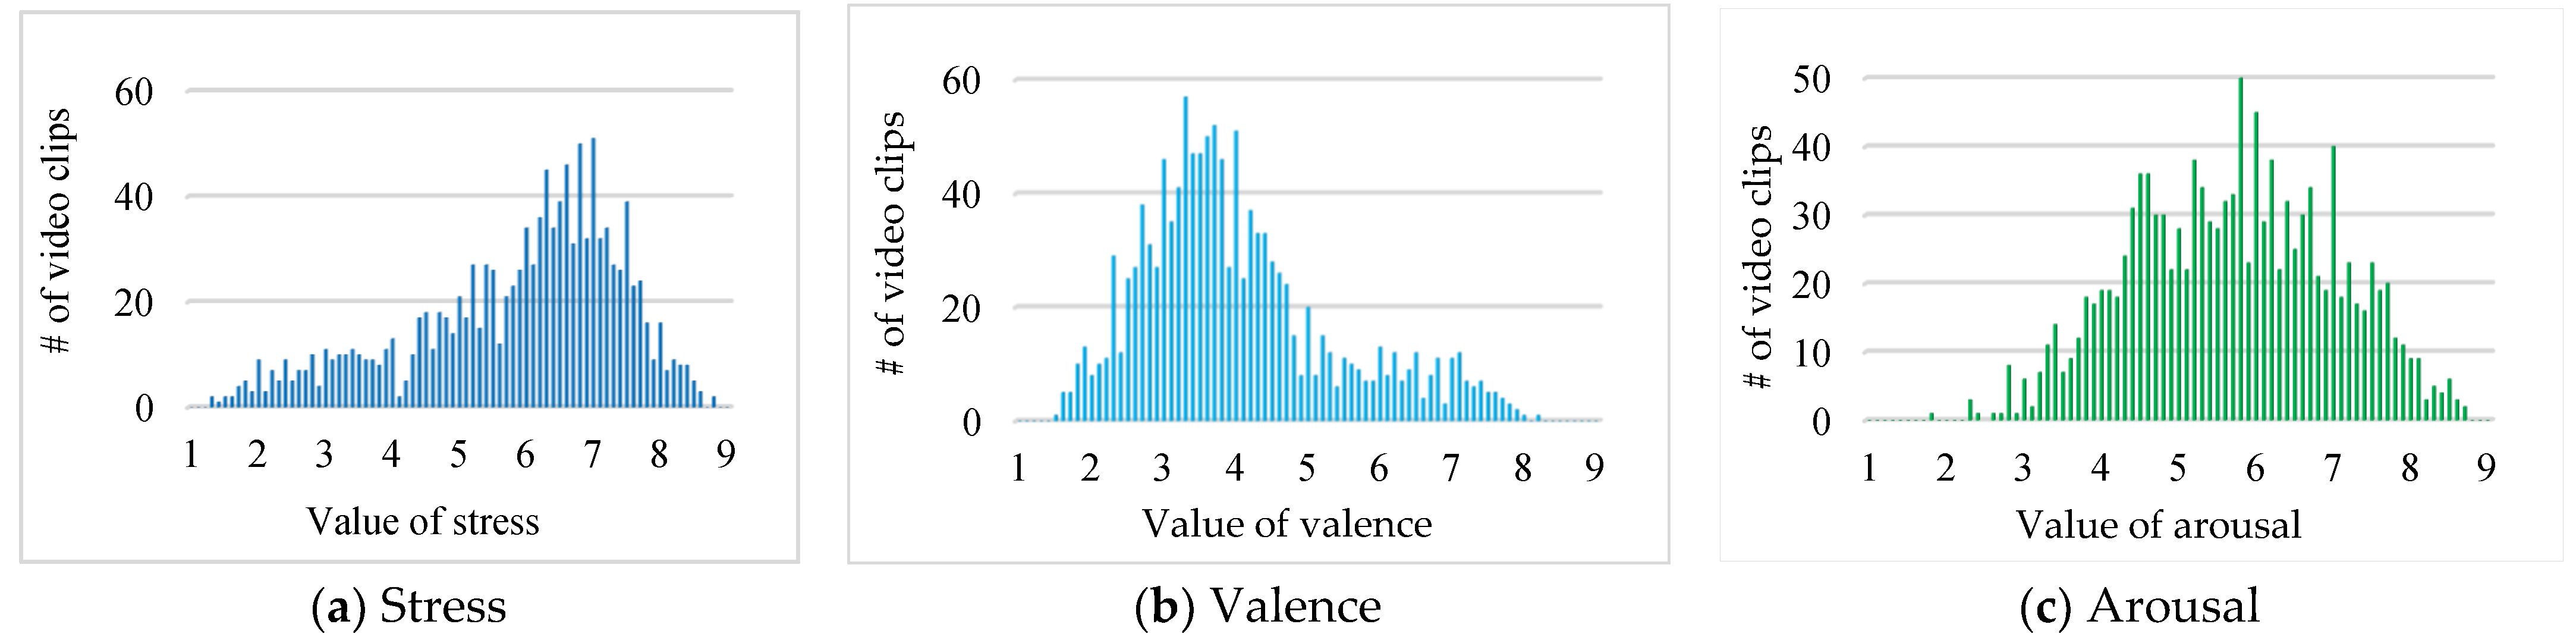
Figure 6.
Correlation of each pair of values.
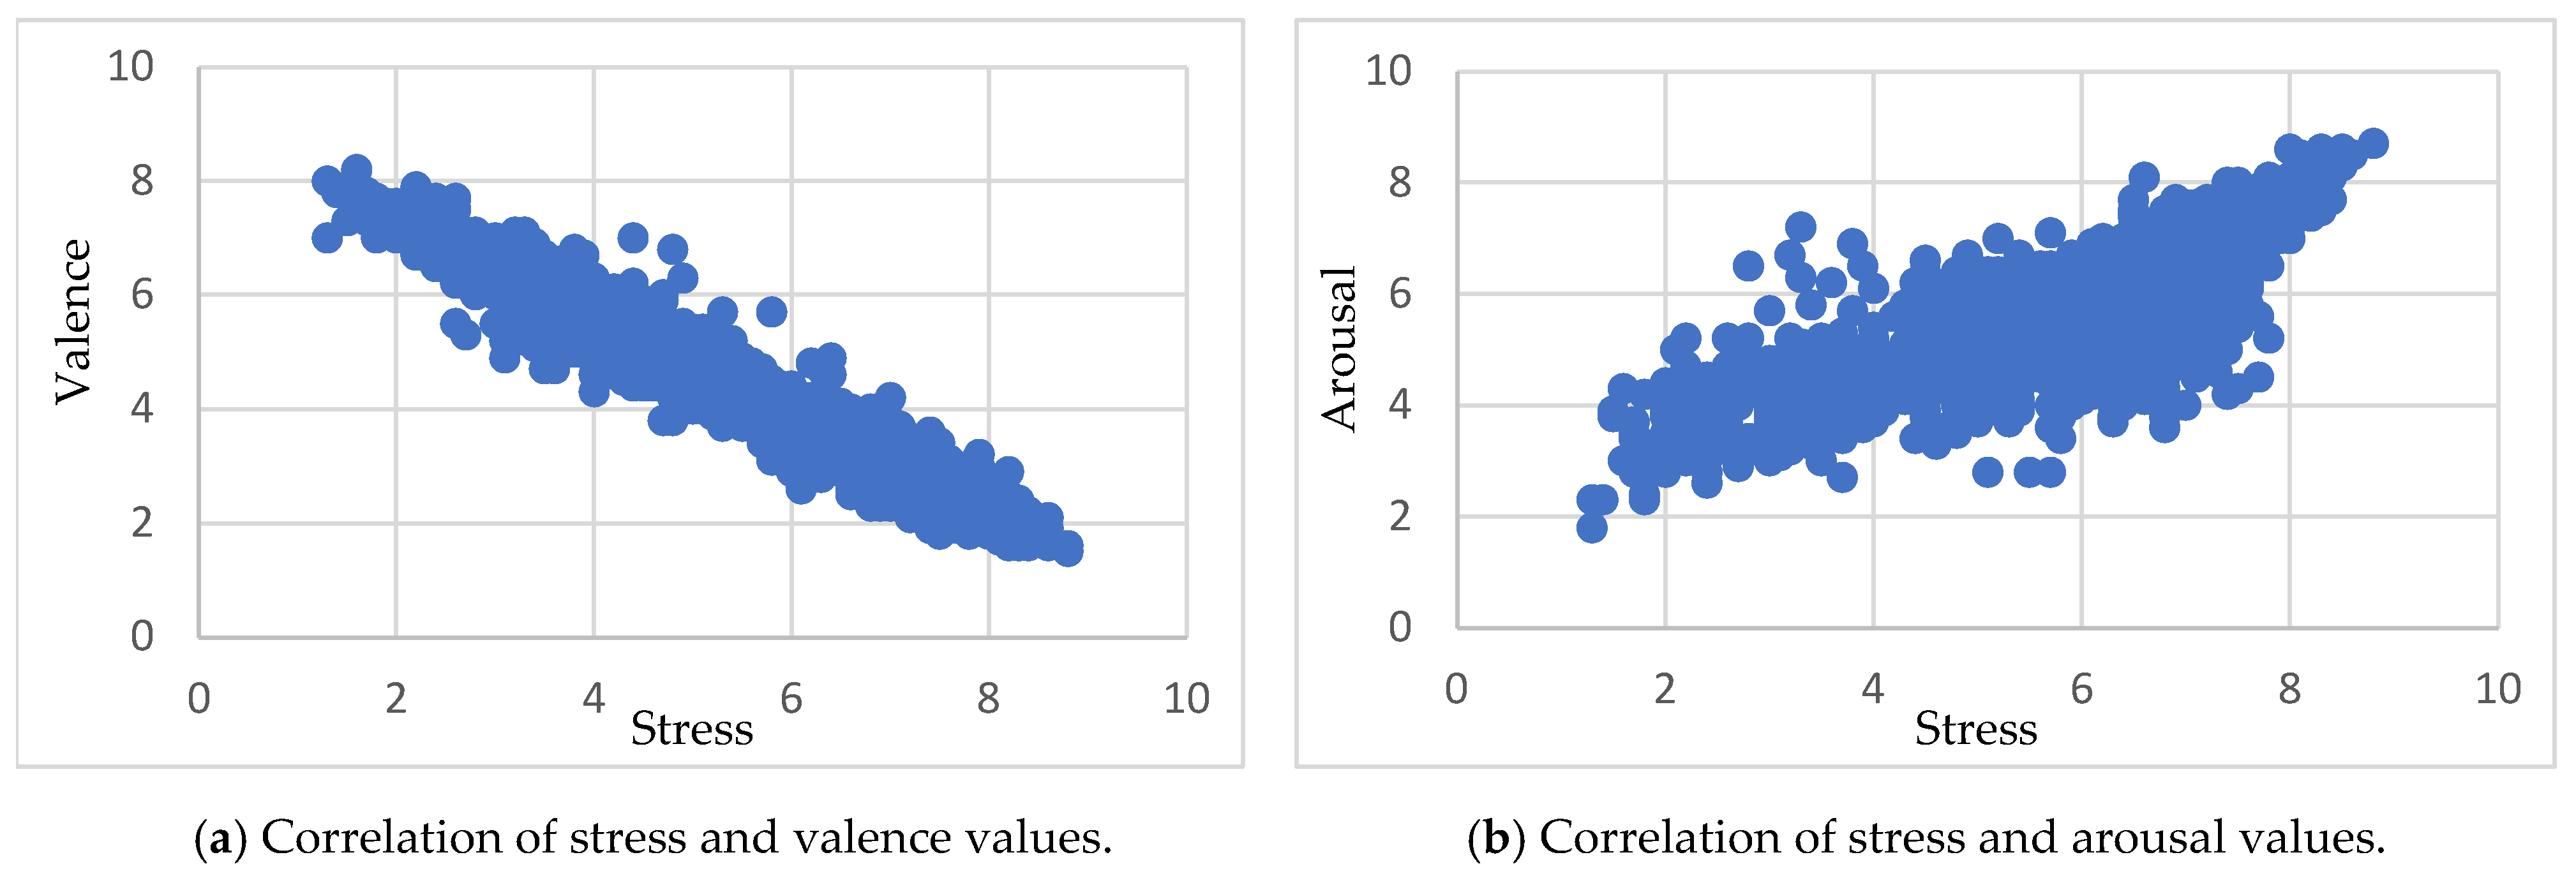
Figure 7.
Architecture of the baseline model for stress, valence, and arousal recognition.
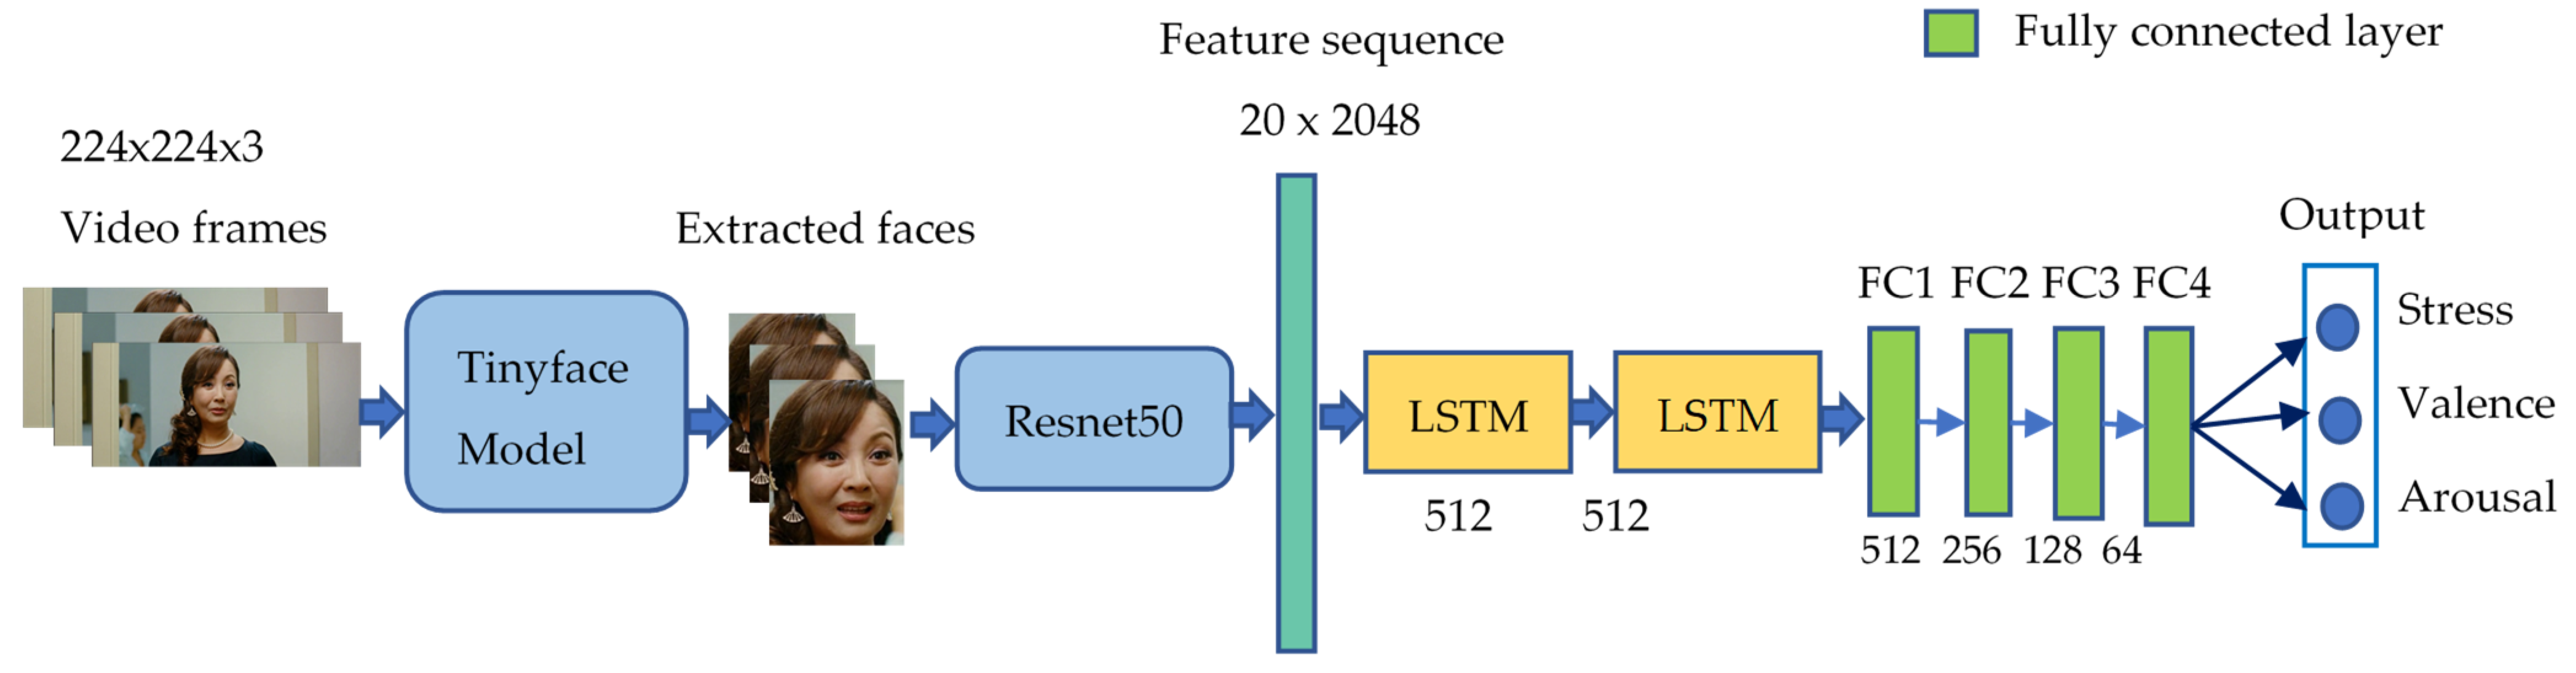
Figure 8.
MSE per sample (test set, sorted) for the stress and non-stress cases.

Figure 9.
Ground truth and results on clips for stress recognition (Sp: prediction stress; Vp: prediction valence; Ap: prediction arousal; Sg: ground truth stress; Vg: ground truth valence; Ag: ground truth arousal).
Figure 9.
Ground truth and results on clips for stress recognition (Sp: prediction stress; Vp: prediction valence; Ap: prediction arousal; Sg: ground truth stress; Vg: ground truth valence; Ag: ground truth arousal).


Table 1.
Comparision of the SADVAW dataset with the existing stress datasets WeSAD [15], MuSE [16], and SWELL-KW [17].
| Dataset | Number of Videos | Length per Video Clip | Setting | Target Objects |
|---|---|---|---|---|
| SADVAW (proposed) | 1236 | 2–4 (s) | Movie | Stress, valence, arousal |
| WeSAD [15] | 15 | 36 (min) | Lab | Baseline, stress, amusement |
| MuSE [16] | 28 | 45 (min) | Lab | Activation, valence, stress |
| SWELL-KW [17] | 25 | 2 (h) | Lab | Stress, valence, arousal, mental effort, frustration, task load |
Table 2.
Description of the stress and dimensions of valence and arousal.
| Class | Description |
|---|---|
| Stress (1–9) | How stressed does the person feel? (non-stress–stress) |
| Valence (1–9) | How positive or negative is their emotion? (negative–positive) |
| Arousal (1–9) | What is the agitation level of the person? (inactive–active) |
Table 3.
The percentage of videos with the agreement of n (max(n) = 27) annotators on each value of stress, valence, and arousal.
Table 3.
The percentage of videos with the agreement of n (max(n) = 27) annotators on each value of stress, valence, and arousal.
| (a) The percentage of videos with the agreement of n (max(n) = 27) annotators on each value of stress (%) | ||||||||||
| # of People (n) | Values of Stress | Total | ||||||||
| 1 | 2 | 3 | 4 | 5 | 6 | 7 | 8 | 9 | ||
| 1 | 2.05 | 3.04 | 3.64 | 4.32 | 2.67 | 0.93 | 1.11 | 2.06 | 2.7 | 22.52 |
| n ≥ 2 | 2.64 | 5.27 | 6.77 | 7.5 | 11.74 | 14.54 | 13.36 | 10.27 | 5.39 | 77.48 |
| Total | 4.69 | 8.31 | 10.41 | 11.82 | 14.41 | 15.47 | 14.47 | 12.33 | 8.09 | 100 |
| (b) The percentage of videos with the agreement of n (max(n) = 27) annotators on each value of valence (%) | ||||||||||
| # of People (n) | Values of Valence | Total | ||||||||
| 1 | 2 | 3 | 4 | 5 | 6 | 7 | 8 | 9 | ||
| 1 | 4.07 | 3.12 | 1.56 | 1.17 | 3.65 | 3.12 | 1.96 | 1.78 | 0.97 | 21.4 |
| n ≥ 2 | 5 | 11.88 | 16.54 | 17.83 | 12.25 | 7.16 | 4.29 | 2.56 | 1.09 | 78.6 |
| Total | 9.07 | 15 | 18.1 | 19 | 15.9 | 10.28 | 6.25 | 4.34 | 2.06 | 100 |
| (c) The percentage of videos with the agreement of n (max(n) = 27) annotators on each value of arousal (%) | ||||||||||
| # of People (n) | Values of Arousal | Total | ||||||||
| 1 | 2 | 3 | 4 | 5 | 6 | 7 | 8 | 9 | ||
| 1 | 1.82 | 3.56 | 2.96 | 2.75 | 1.76 | 0.49 | 1.64 | 3.27 | 2.81 | 21.06 |
| n ≥ 2 | 1.95 | 6.18 | 8.24 | 9.85 | 12.77 | 15.16 | 12.98 | 8.04 | 3.77 | 78.94 |
| Total | 3.77 | 9.74 | 11.2 | 12.6 | 14.53 | 15.65 | 14.62 | 11.31 | 6.58 | 100 |
Table 4.
Pearson’s correlation coefficient between stress with two dimensions of valence and arousal.
Table 4.
Pearson’s correlation coefficient between stress with two dimensions of valence and arousal.
| Valence | Arousal | |
|---|---|---|
| Stress | −0.96 | 0.78 |
Table 5.
The t-test evaluated valence and arousal values in the stress and non-stress groups.
| Valence | Arousal | |||
|---|---|---|---|---|
| Stress | Non-Stress | Stress | Non-Stress | |
| Mean | 3.13 | 5.24 | 6.38 | 4.73 |
| Variance | 0.37 | 1.32 | 1.11 | 0.93 |
| t-stat | −56.34 | 11.18 | ||
| P(T ≤ t) one-tail | 2 × 10−269 | 5.70 × 10⁻²⁸ | ||
Table 6.
Network parameters.
| Layer (Type) | Output Shape | Parameters |
|---|---|---|
| Input | (20, 2048) | 0 |
| Lstm_1 (LSTM) | (20, 512) | 5,244,928 |
| Lstm_2 (LSTM) | 512 | 2,099,200 |
| dense_1(FC) | 512 | 262,656 |
| dense_2(FC) | 256 | 131,328 |
| dense_3(FC) | 128 | 32,896 |
| dense_4(FC) | 64 | 8256 |
Table 7.
Baseline model’s performance on the test set in terms of MSE, MRE and PCC.
| Dimension | MSE | MRE (%) | PCC |
|---|---|---|---|
| Stress | 1.66 | 22.16 | 0.52 |
| Valence | 1.23 | 22.71 | 0.53 |
| Arousal | 1.13 | 15.42 | 0.46 |
| Mean | 1.34 | 20.10 | 0.50 |
Publisher’s Note: MDPI stays neutral with regard to jurisdictional claims in published maps and institutional affiliations. |
© 2021 by the authors. Licensee MDPI, Basel, Switzerland. This article is an open access article distributed under the terms and conditions of the Creative Commons Attribution (CC BY) license (https://creativecommons.org/licenses/by/4.0/).
Share and Cite
MDPI and ACS Style
Tran, T.-D.; Kim, J.; Ho, N.-H.; Yang, H.-J.; Pant, S.; Kim, S.-H.; Lee, G.-S. Stress Analysis with Dimensions of Valence and Arousal in the Wild. Appl. Sci. 2021, 11, 5194. https://doi.org/10.3390/app11115194
AMA Style
Tran T-D, Kim J, Ho N-H, Yang H-J, Pant S, Kim S-H, Lee G-S. Stress Analysis with Dimensions of Valence and Arousal in the Wild. Applied Sciences. 2021; 11(11):5194. https://doi.org/10.3390/app11115194
Chicago/Turabian StyleTran, Thi-Dung, Junghee Kim, Ngoc-Huynh Ho, Hyung-Jeong Yang, Sudarshan Pant, Soo-Hyung Kim, and Guee-Sang Lee. 2021. "Stress Analysis with Dimensions of Valence and Arousal in the Wild" Applied Sciences 11, no. 11: 5194. https://doi.org/10.3390/app11115194
Note that from the first issue of 2016, this journal uses article numbers instead of page numbers. See further details here.