Article

Study on the Performance of Optical Lenses under High Fluxes of Solar Radiation

by
Luís Guerra Rosa
1,*,
José Carlos Garcia Pereira
2,
Kaveh Rahmani
1,
Guilherme De Almeida
1 and
Luís F. Santos
2
1
IDMEC, Instituto de Engenharia Mecânica, Instituto Superior Técnico, University of Lisboa, Av. Rovisco Pais, 1049-001 Lisboa, Portugal
2
Centro de Química Estrutural, Departamento de Engenharia Química, Instituto Superior Técnico, Universidade de Lisboa, Av. Rovisco Pais, 1049-001 Lisboa, Portugal
*
Author to whom correspondence should be addressed.
Appl. Sci. 2021, 11(11), 5174; https://doi.org/10.3390/app11115174
Submission received: 11 May 2021 / Revised: 28 May 2021 / Accepted: 1 June 2021 / Published: 2 June 2021

Abstract

:
This work compares the performance of optical lenses made of silica glass or borosilicate glass (BK-7) when submitted to high-flux radiation emitted by a xenon arc lamp or provided by a high-concentration solar tower. Each irradiation test lasted for 60 min, with continuous monitoring of the radiation-flux incident on the lenses and the temperature generated in their vicinity. All silica glass lenses showed a good performance with both irradiation sources, xenon arc lamp and natural solar radiation, contrary to what was observed with the lenses made of borosilicate glass which fractured when irradiated with a xenon arc lamp. The negative behavior observed with the borosilicate lenses is attributed to the fact that the radiation spectrum of a xenon arc lamp contains certain wavelengths, in the near ultraviolet (UV) region, that are not present in the natural solar radiation spectrum at sea level.

1. Introduction

It is a fact that at the present time solar energy is primarily associated to the production of electricity from photovoltaic (PV) cells or modules and, also, in a different way, to the use of “solar thermal panels” which, contrary to PV modules, turn sunlight into heat instead of electric power. Nowadays, either for residential, commercial, or industrial applications, solar heating and cooling technologies are available to provide hot water, space heating and cooling, pool heating, water desalination, etc. Also, for most of the common citizens, a “solar furnace” is a way to heat food or things without spending electricity or gas. Therefore, we may say that the potential of solar thermal energy is relatively well-known for applications in the low temperature range (80–150 °C).
The so-called high-concentration or high-flux solar applications, which pertain to attain much higher temperatures, are much less used despite the fact that the origin of high-temperature solar furnaces dates back to the beginning of the 20th century, when Manuel António Gomes (nicknamed “Himalaya”) created and patented an apparatus “for making industrial use of solar heat, particularly in the metallurgical and chemical arts which necessitate the use of temperatures higher than those of ordinary furnaces” [1,2]. More than 100 years later, modern solar furnaces—equipped with reactors or process chambers and specially designed accessories—are used for physical and chemical processes requiring high (>400 °C) and very-high (>1500 °C) temperatures. Different review works [3,4,5,6,7,8] demonstrate the immense potentialities of the usage of solar heat for thermochemical processes involving fluids, but also for processing of (solid) materials. Concentrated solar energy can be competitive with energy-intensive technologies (laser [9,10] or plasma [11]) and has a great potential in the treatment of wastes [12,13]. Nonetheless, many studies reveal the necessity to further develop the solar-driven high-temperature technologies that are needed to displace the use of fossil fuel combustion furnaces or electric furnaces that require limited and pollutant-conventional energy sources. In particular, it is necessary to ameliorate the temperature homogeneity conditions inside reaction chambers for materials processing when using solar heat. One of the main current shortcomings is to reach a homogeneous temperature distribution on the processed materials, due mainly to the unidirectionality of the radiation pattern and the non-homogeneous distribution of the highly concentrated radiant flux. Thus, there is a need for innovative modular systems for capture, concentration, control, and conduction of concentrated solar radiation.
As presented in earlier works [6,14], optical waveguide transmission lines made of optical fibers can direct the concentrated solar radiation to the place of utilization of the high-flux solar energy. As the fiber optical cables are flexible (see Figure 1), they can be used to illuminate (irradiate) the target not only from one single direction, but by using several cables it is possible to illuminate the target with radiation that is coming from different directions, thus circumventing one of the major problems with traditional high-flux concentrators: the unidirectionality of the radiation pattern.
In the case of using a Fresnel lens as the primary concentrator of the direct solar radiation, optical diverging systems may be needed to be inserted at the entrance/inlet of each optical fiber cable to satisfy its acceptance angle (see Figure 2).
Optical lenses are essential elements for reconfiguring the beams of solar radiation. The lenses are necessary for being used in the new systems to conduct concentrated solar radiation using optical fiber cables. Figure 3a shows a schematic of an optical diverging system that is planned to be installed at the entrance/inlet of the optical fiber cable/bundle (depicted in Figure 1) to provide the right conditions to satisfy the acceptance angle. Additionally, it might be important to use a converging system at the end/outlet of the cable, to re-concentrate the radiation. Figure 3b shows a schematic of the converging system that was designed for the same cable.

2. Materials and Methods

2.1. Tested Lenses

The characteristics of the optical lenses that have been tested in this work are shown in Table 1 for biconcave lenses, and in Table 2 for the plane-convex lenses. The lenses were purchased from well-known suppliers: “Lens-Optics”, “Fichou”, “LOT-QuantumDesign”. Lenses made of borosilicate glass (type BK-7 from Schott) are much cheaper than those made of silica glass. As both BK-7 glass and silica glass have excellent optical quality, allowing the use of these lenses in a wide range of applications, comparison of their behavior when subjected to highly concentrated radiation conditions is essential.

2.2. Irradiation Tests

Two types of high-flux radiation equipment have been used in this work: (i) a laboratory-scale high-flux 7 kWe-solar simulator in which the radiation is provided by a xenon arc lamp; and (ii) highly concentrated natural sunlight provided at the top of a solar tower by a heliostat field.

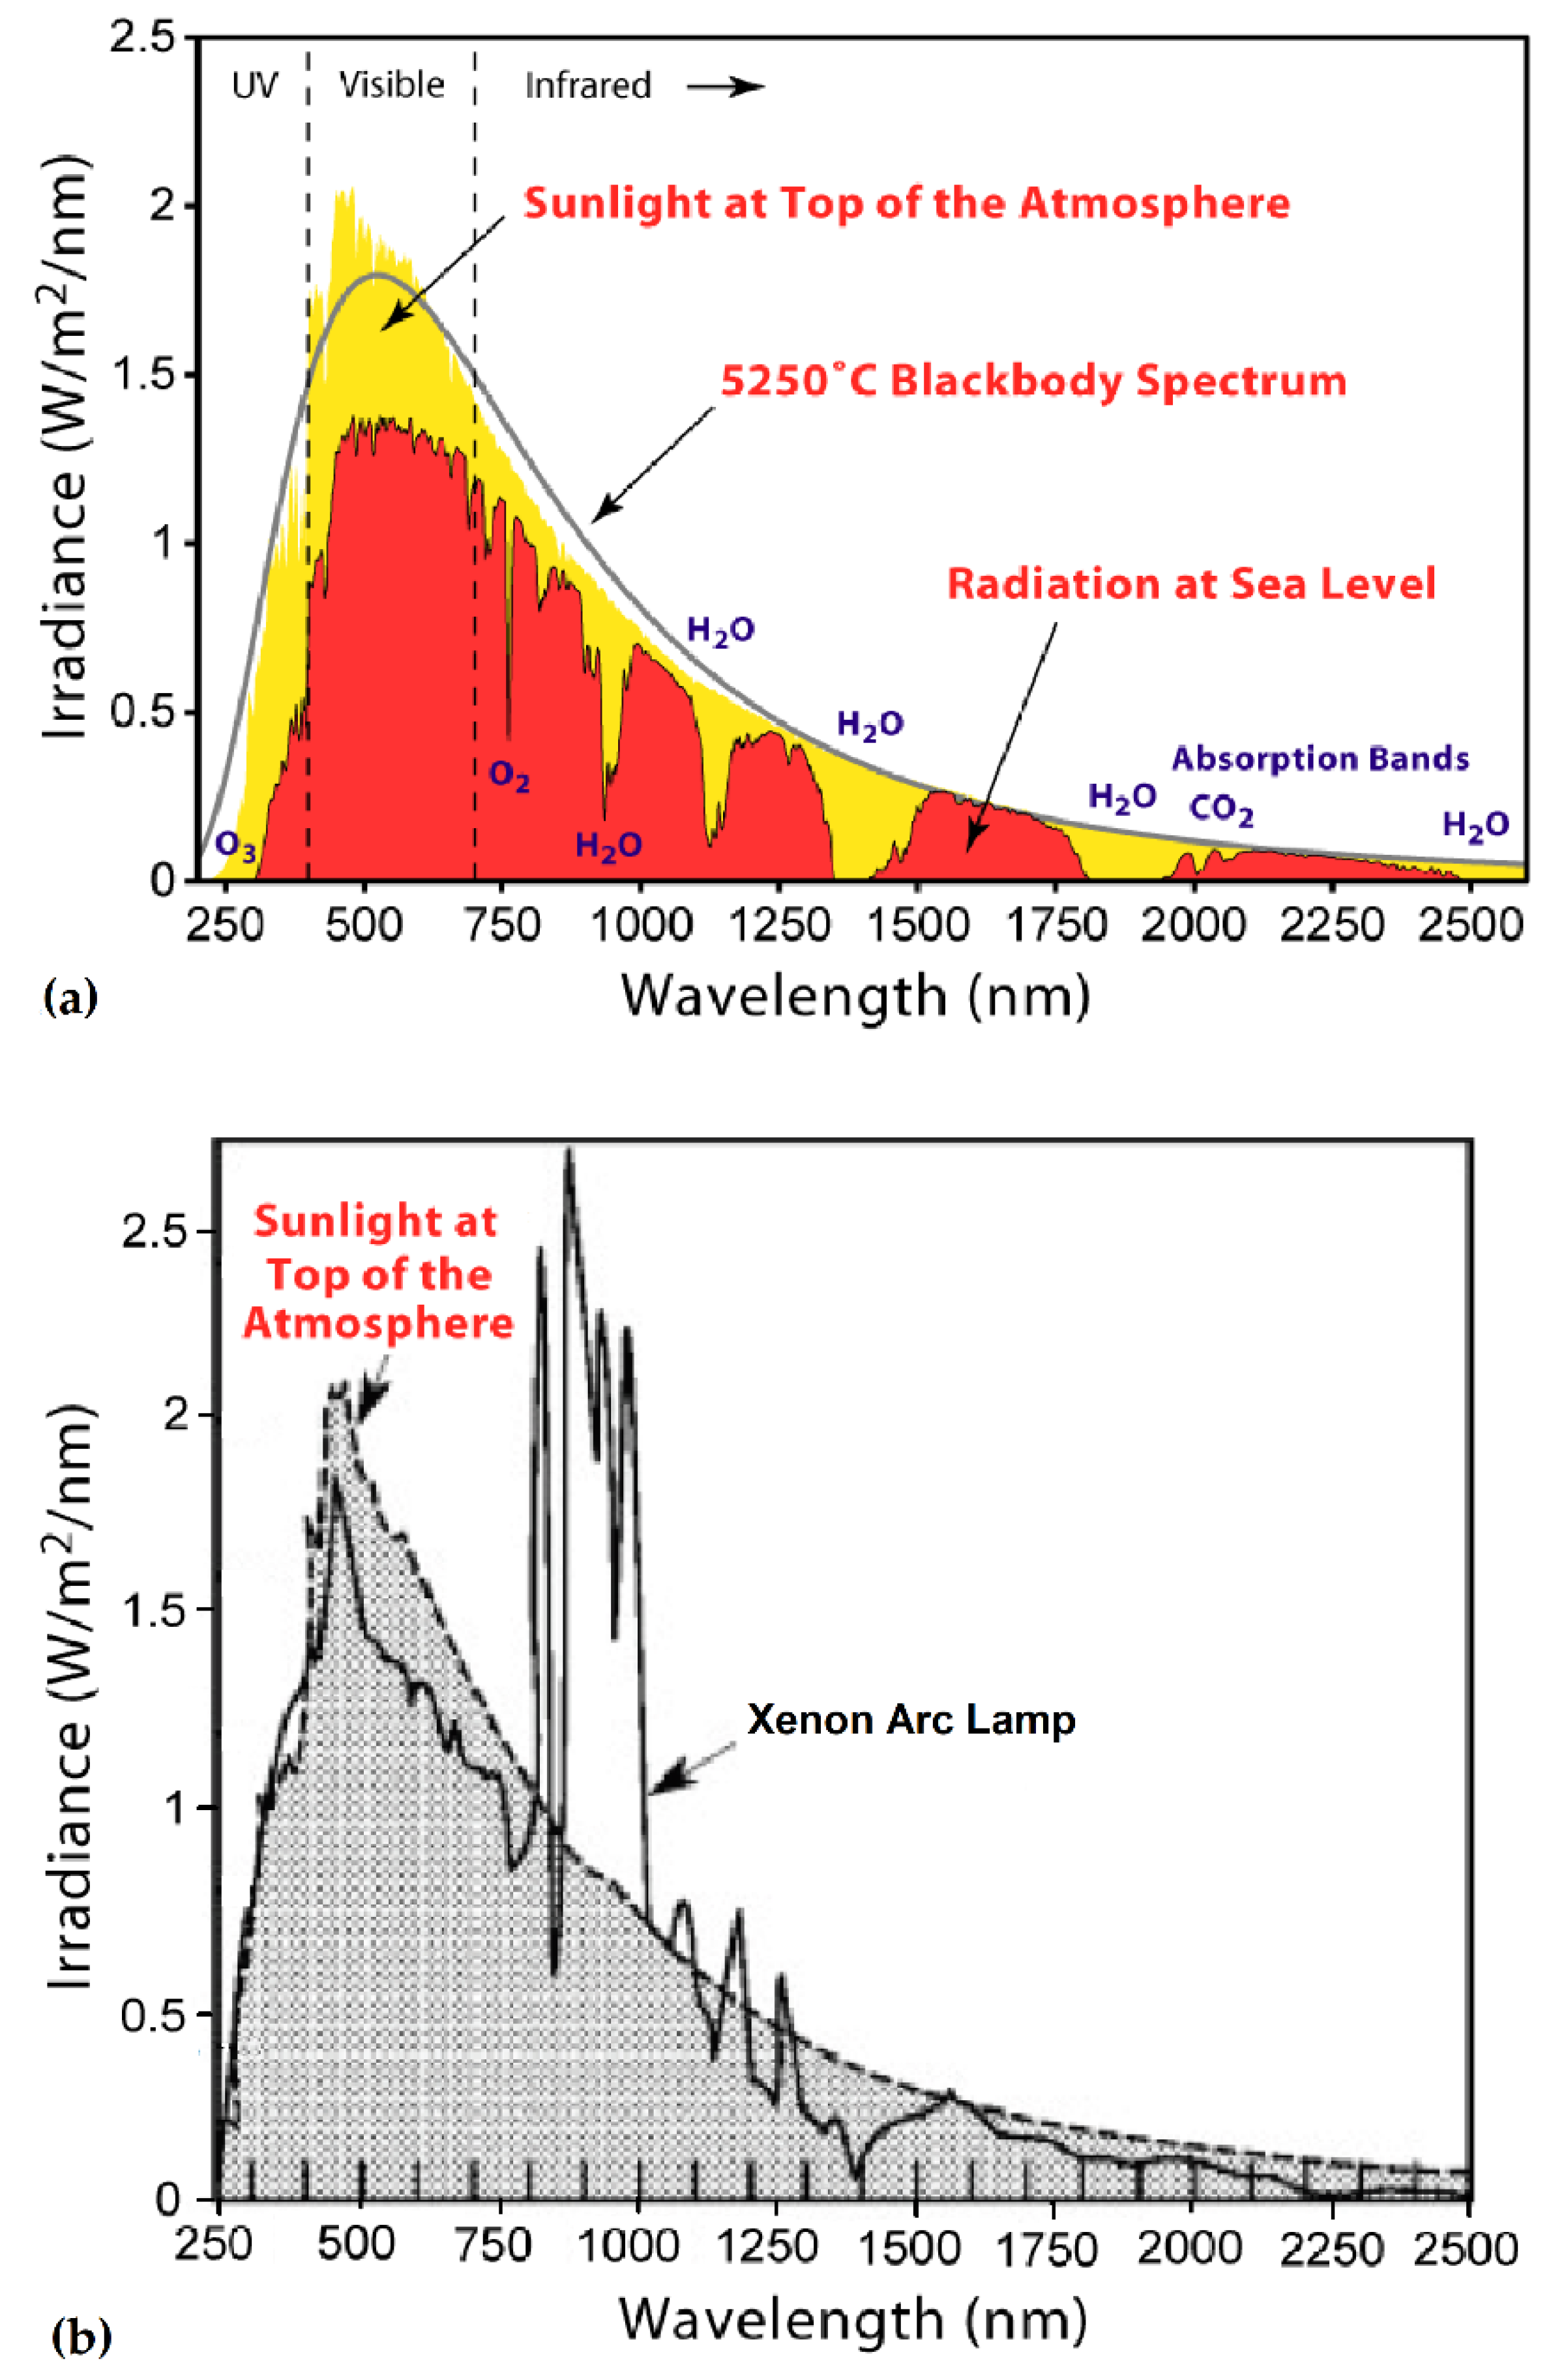
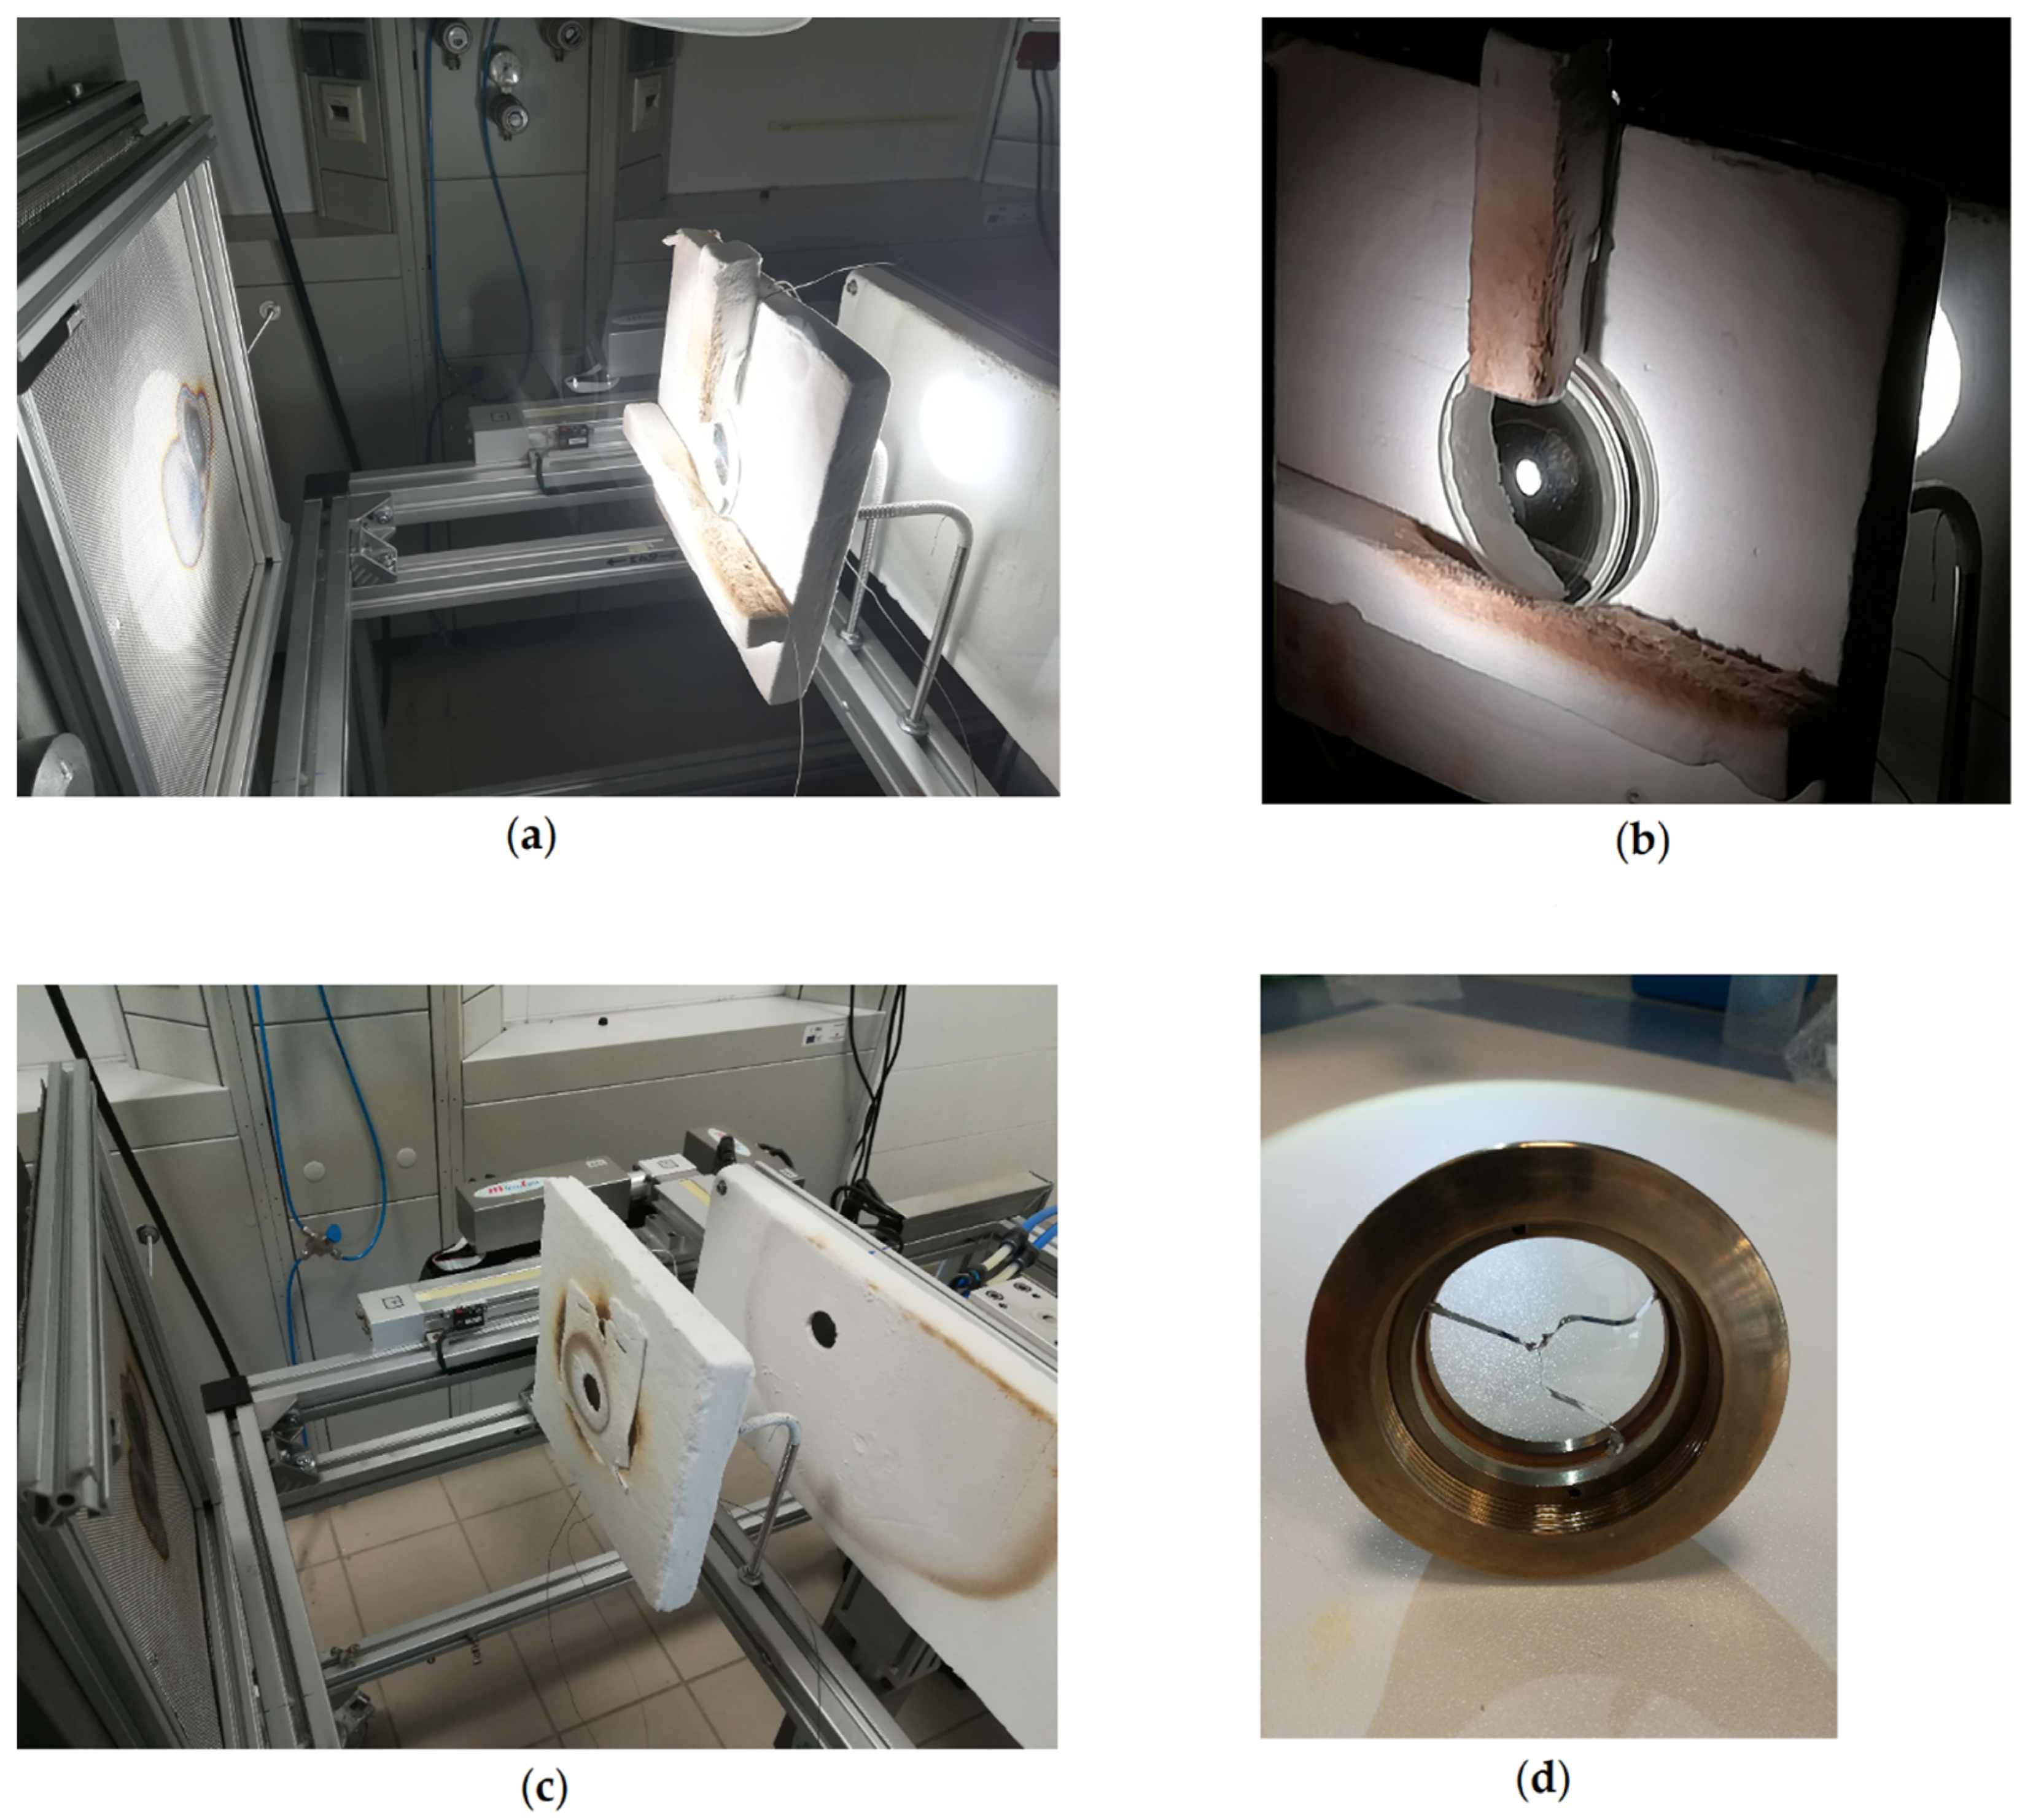
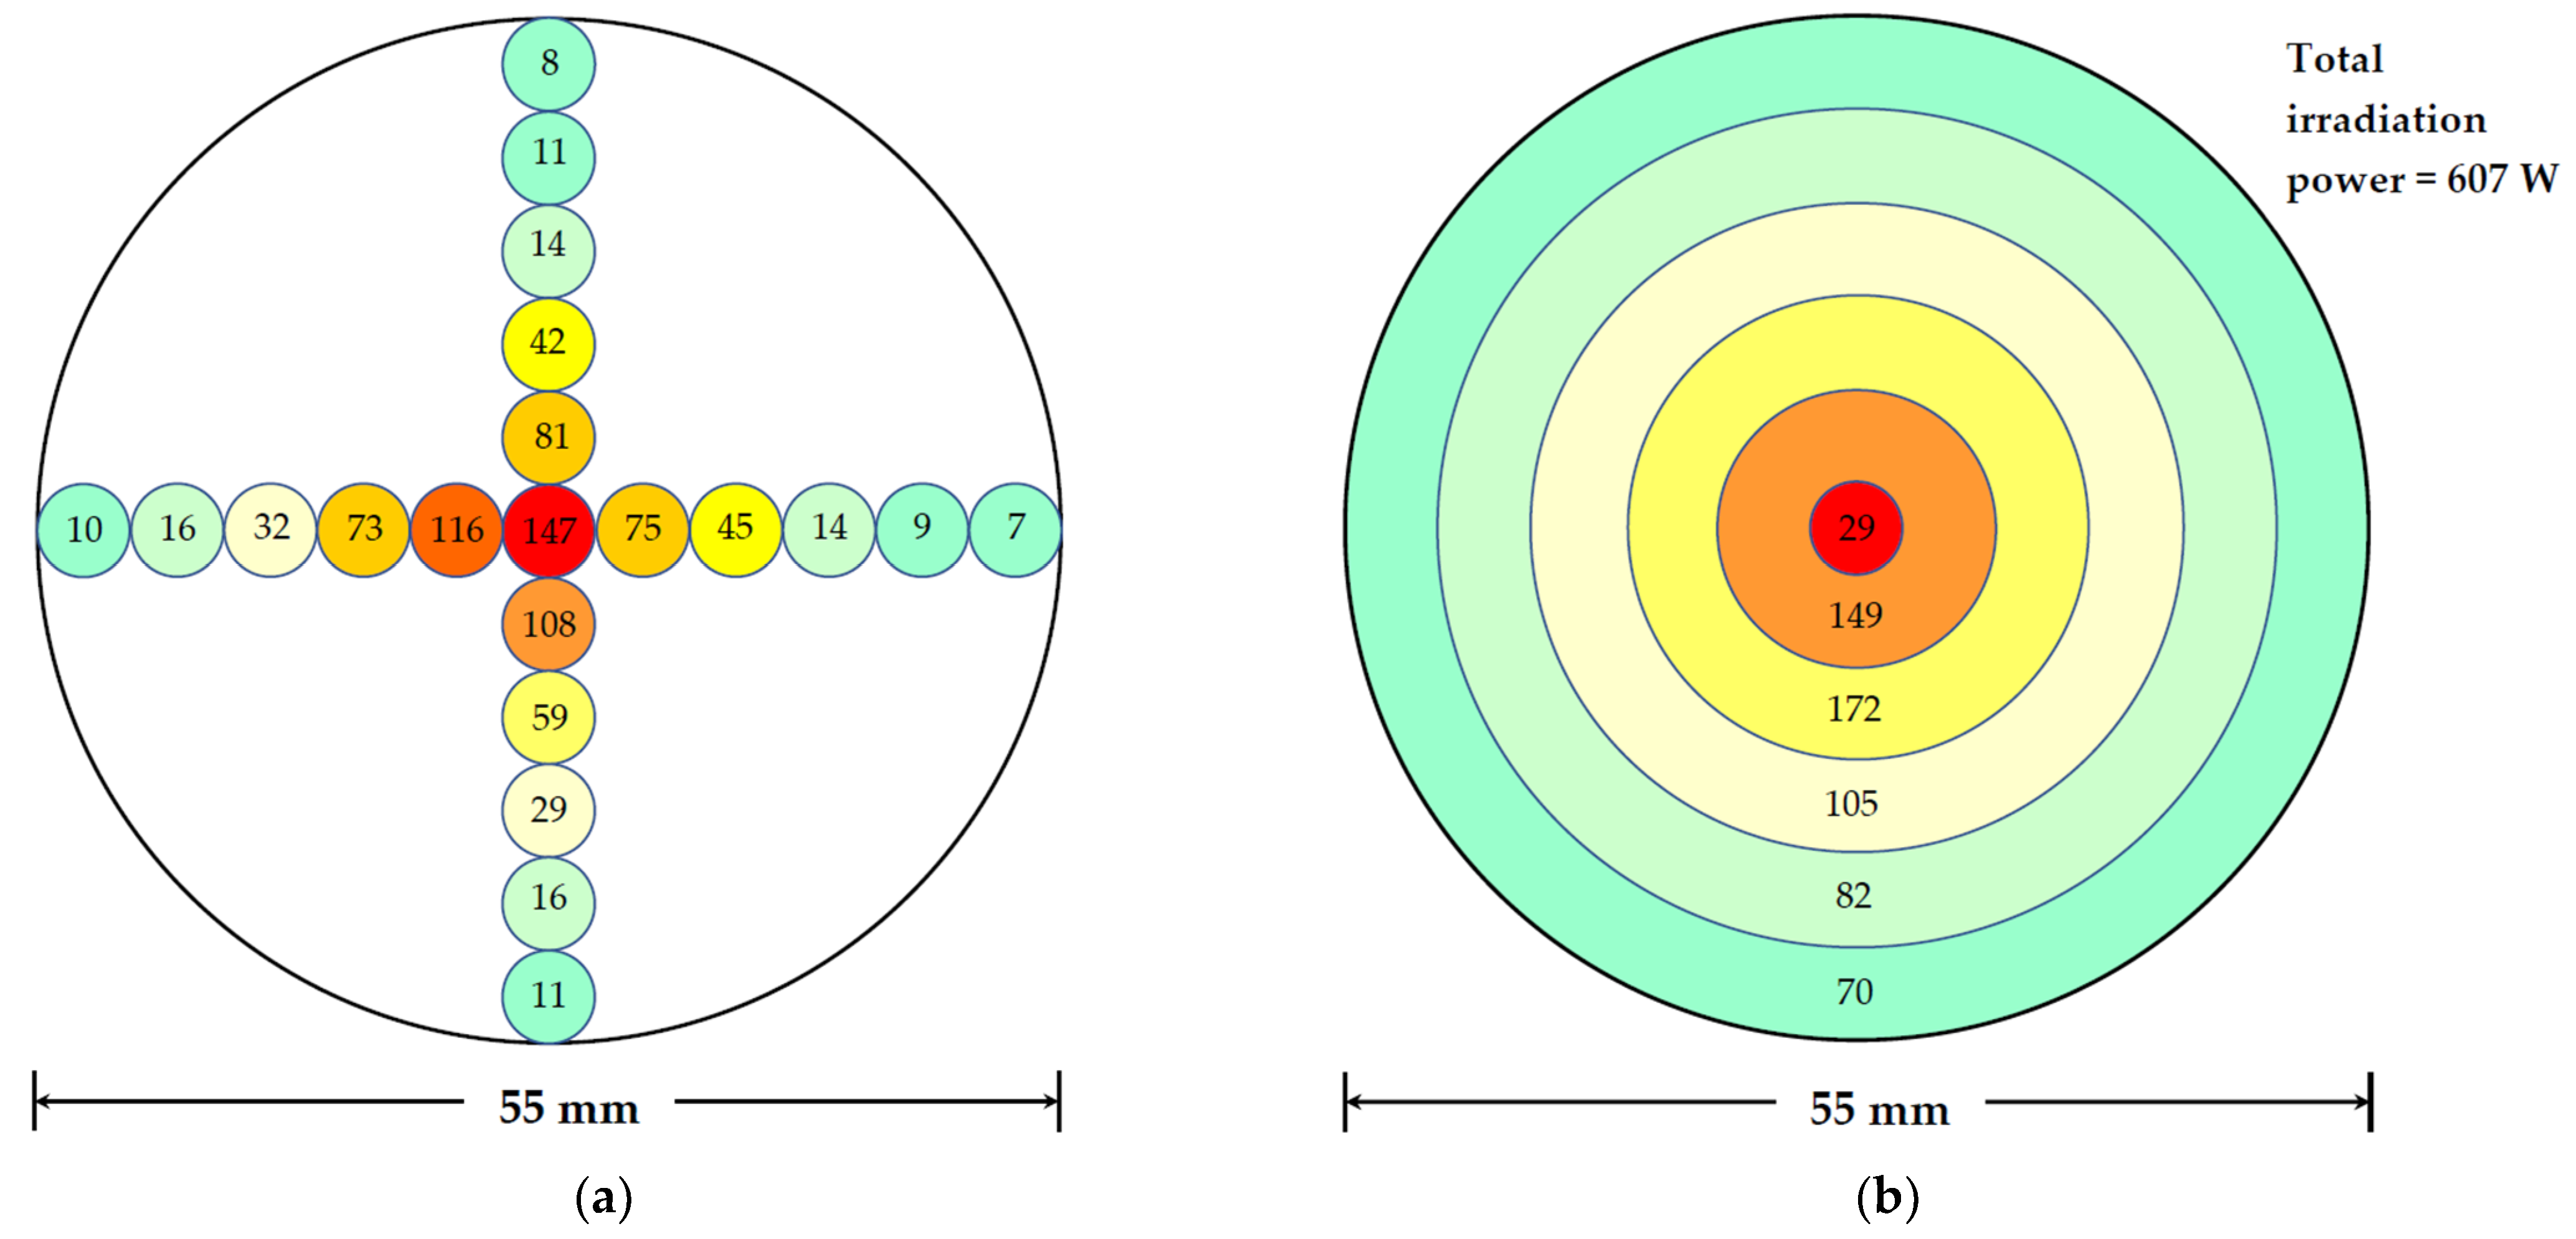
2.2.1. Irradiation with a Solar Simulator Using Xenon Arc Lamp

Irradiation tests using a xenon arc lamp projector (see Figure 4) as high-flux solar simulator were conducted at the Unit of High-Temperature Processes of IMDEA Energy Institute (Móstoles, Madrid, Spain) [16]. The lenses were tested separately i.e., one by one. By default, the duration of exposure of each lens to the concentrated radiation was 60 min. The irradiation tests were stopped before 60 min only in the case of fracture of the lens. The lenses were appropriately positioned so that the power applied on the exposed surface of each lens could be calculated with reasonable accuracy. The test methodology for performing this calculation will be explained further on. A computer controlled XYZ table was used for the correct positioning of each lens.
The xenon arc lamp that was used is manufactured by OSRAM GmbH (Munich, Germany) with the reference XBO 7000 W/HS XL OFR. These lamps of the XBO series are generally used for classic cinema 35 mm film projection. The radiation generated by the lamp has almost the same blackbody temperature that is attributed to the solar radiation entering the Earth’s atmosphere (i.e., approx. 6000 K). The lamp belongs to the OFR class (ozone-free version) which means that during its operation it does not produce ozone. This is possible because the quartz alloy used in these xenon lamps is typically doped with cerium compounds or titanium dioxide to absorb ultraviolet wavelengths that serve to generate ozone during operations [17]. If it was not doped the silica glass would allow the light to pass through with very small wavelengths up to 180 nanometers (nm), but by using doped glass the xenon arc lamp will emit radiation with wavelengths larger than 220 nm.
Details of experimental setup of the irradiation tests using xenon arc lamp are presented in Figure 5. Since the xenon arc lamp emits a constant (non-adjustable) radiation flux, metallic grids have been used as attenuators to change the radiation flux (see Figure 5a). The temperature in the vicinity of each lens was assessed by using K-type thermocouples (TC Ltd., Uxbridge, UK) and, additionally, a thermal imaging infrared camera was used (see example in Figure 6).
Measurements of radiation flux were performed with a Gardon-type radiometer (Vatell Circular-Foil Heat Flux Transducer TG100-1, Vatell Corporation, Christiansburg, VA, USA) with sensitivity of 0.022 mV/(W·cm−2); working range 0–445 W·cm−2; coated with colloidal graphite.
Initially, the measurements of flux were uniquely dedicated to determining the position of the focal zone, which corresponds to the x,y,z coordinates where the maximum value of radiation flux is registered. For that, the radiometer was moved along the three axes, in 1 mm steps (increments). After knowing the focal zone location, the second phase consisted in carrying out flux measurements after insertion of the radiation attenuators. Table 3 shows the values of radiation flux measured at the focal zone (typically named “focus”) and the corresponding attenuation factor.
The third phase of radiation-flux measurements consisted of obtaining radiation-flux values at positions around the “focus”. The objective of these measurements is to estimate the total power incident on a plane perpendicular to the optical axis (X axis). This series of measurements was carried out with attenuator no. 5. Due to the dimensions of the radiometer used in this work, the measured values of radiation-flux are attributed to circles with 5 mm diameter. Thus, as is schematically shown in Figure 7a, 21 measurements of radiation-flux were performed at the positions represented in Figure 7a, all of them symmetrically distributed (at positions: north, south, east, west) inside a circular area with 55 mm diameter. This circular area has been chosen because the flux measured outside this area revealed very low values. For each of the circular crowns represented in Figure 7b we have calculated the average value of the four radiation-flux measurements that we took inside the circular crown (north, south, east, west) and then we multiplied this average value by the area of the corresponding circular crown, thus obtaining an estimate of the irradiation power received in each circular crown. These estimated values (in W) for each of the zones are shown in Figure 7b. By summing up the power received at each of the zones we obtain an estimate of the total power incident on a plane perpendicular to the optical axis. In the case shown in Figure 7b, the sum is 29 + 149 + 172 + 105 + 82 + 70 = 607 W. As in this case we have used the attenuator no.5, that has attenuation factor of 0.411, we may say that without attenuator the total power incident in a plane perpendicular to the optical axis would be 607/0.411 = 1477 W.

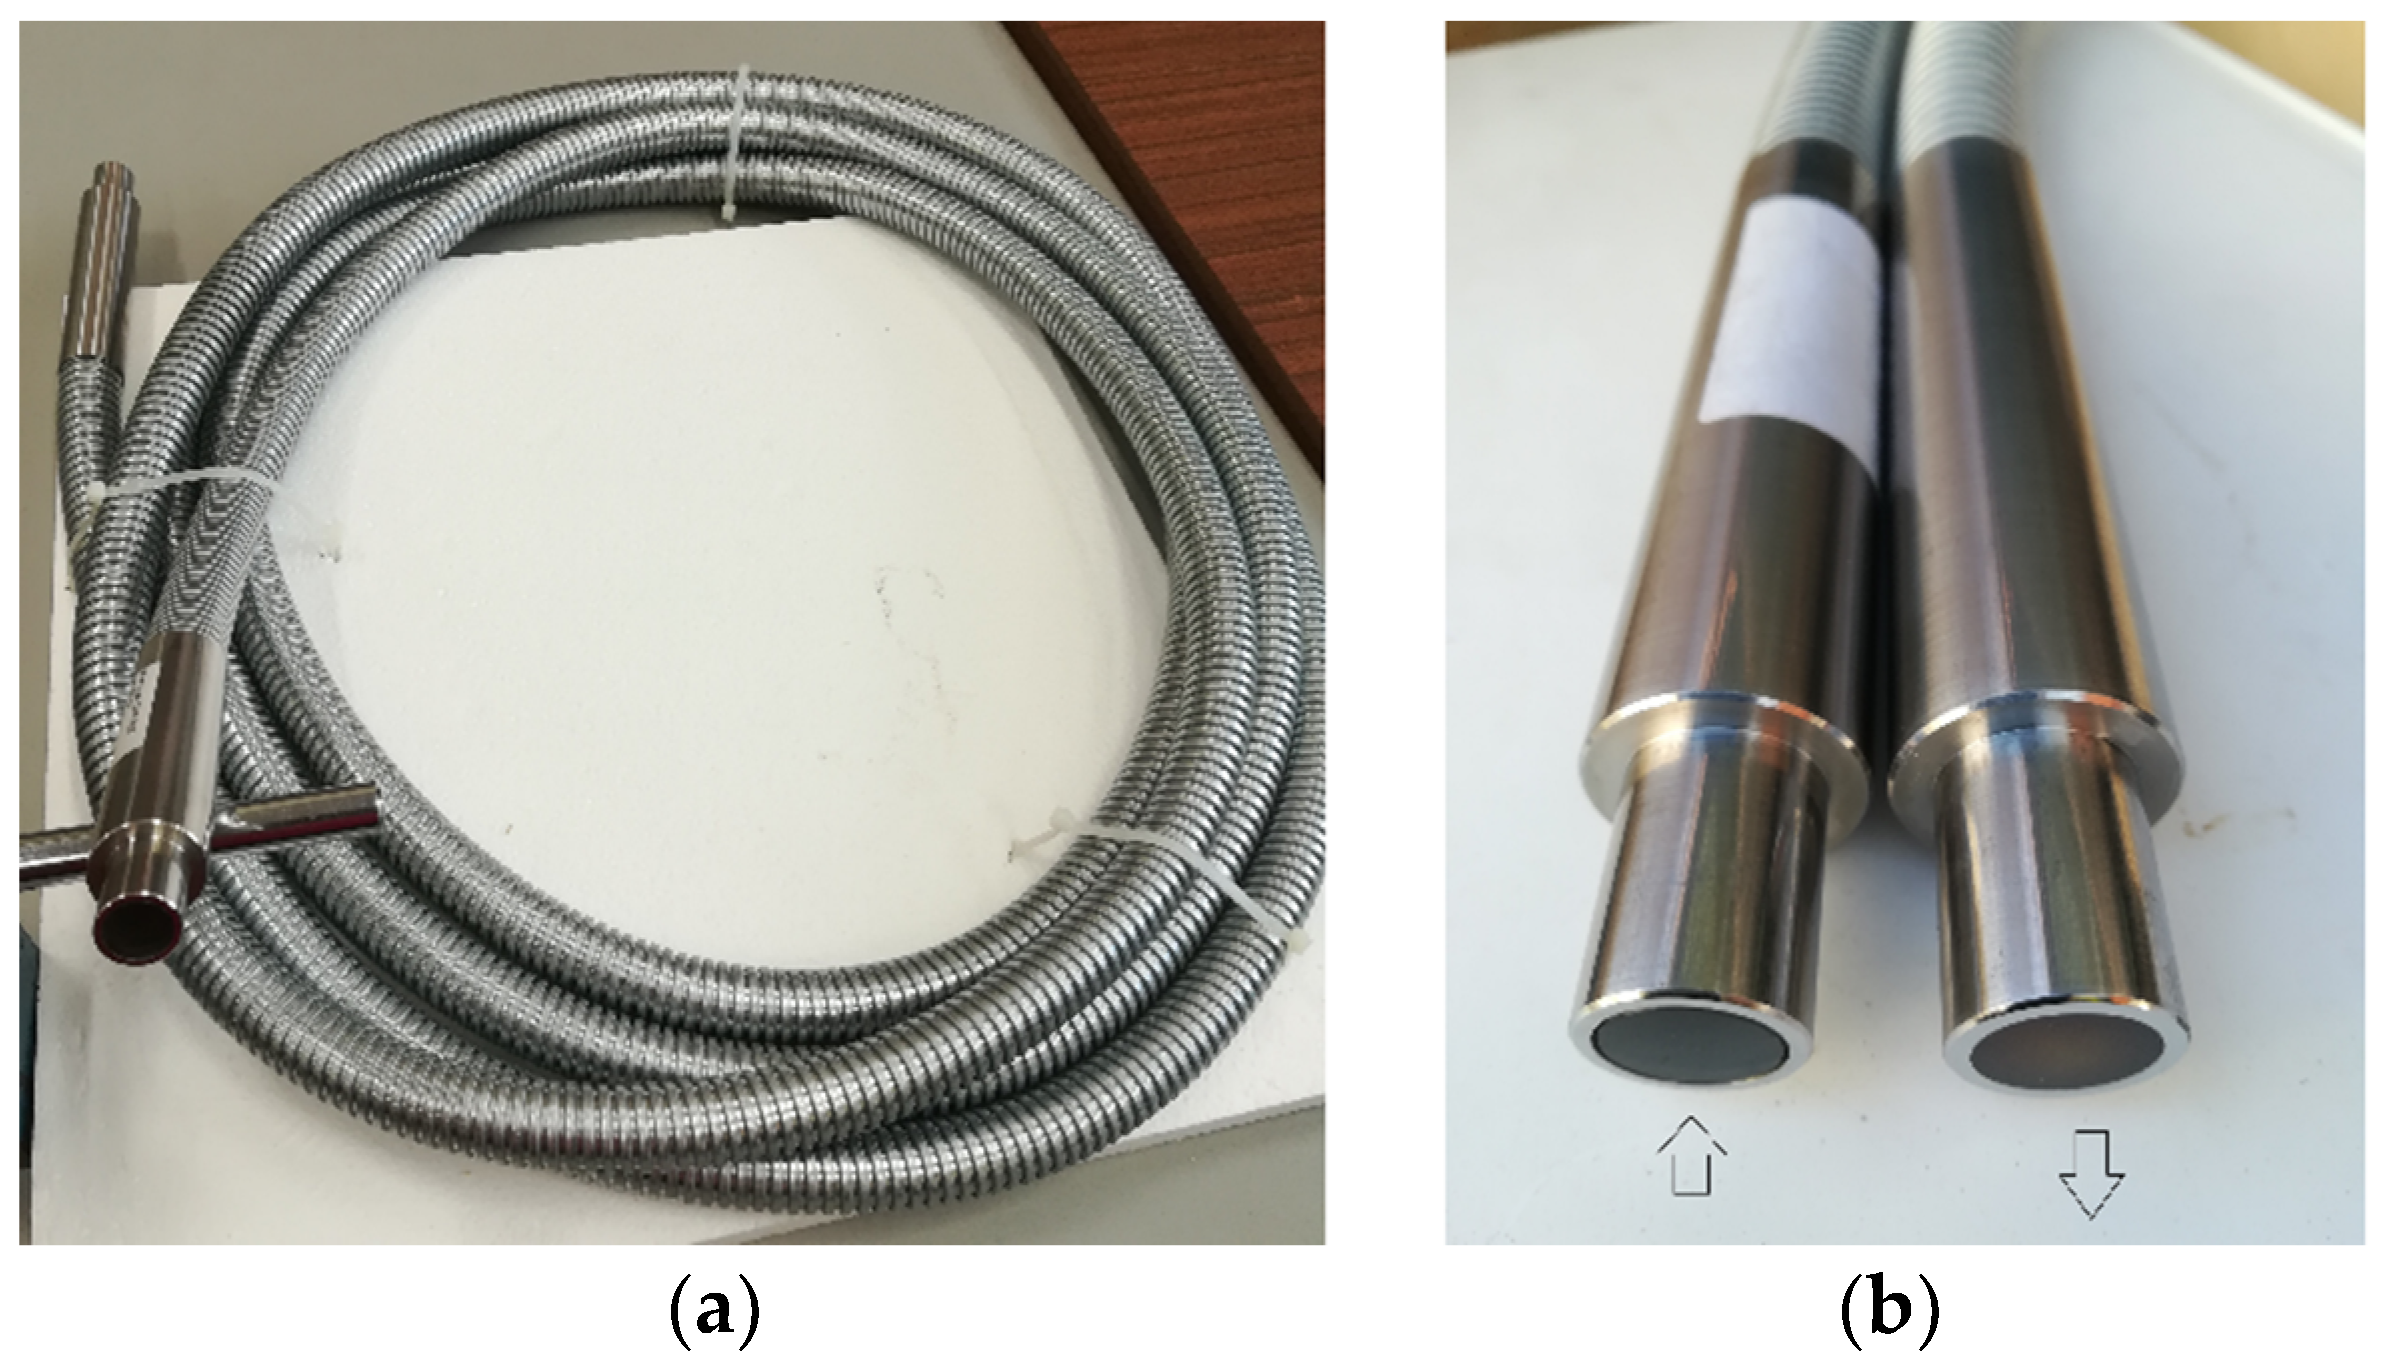
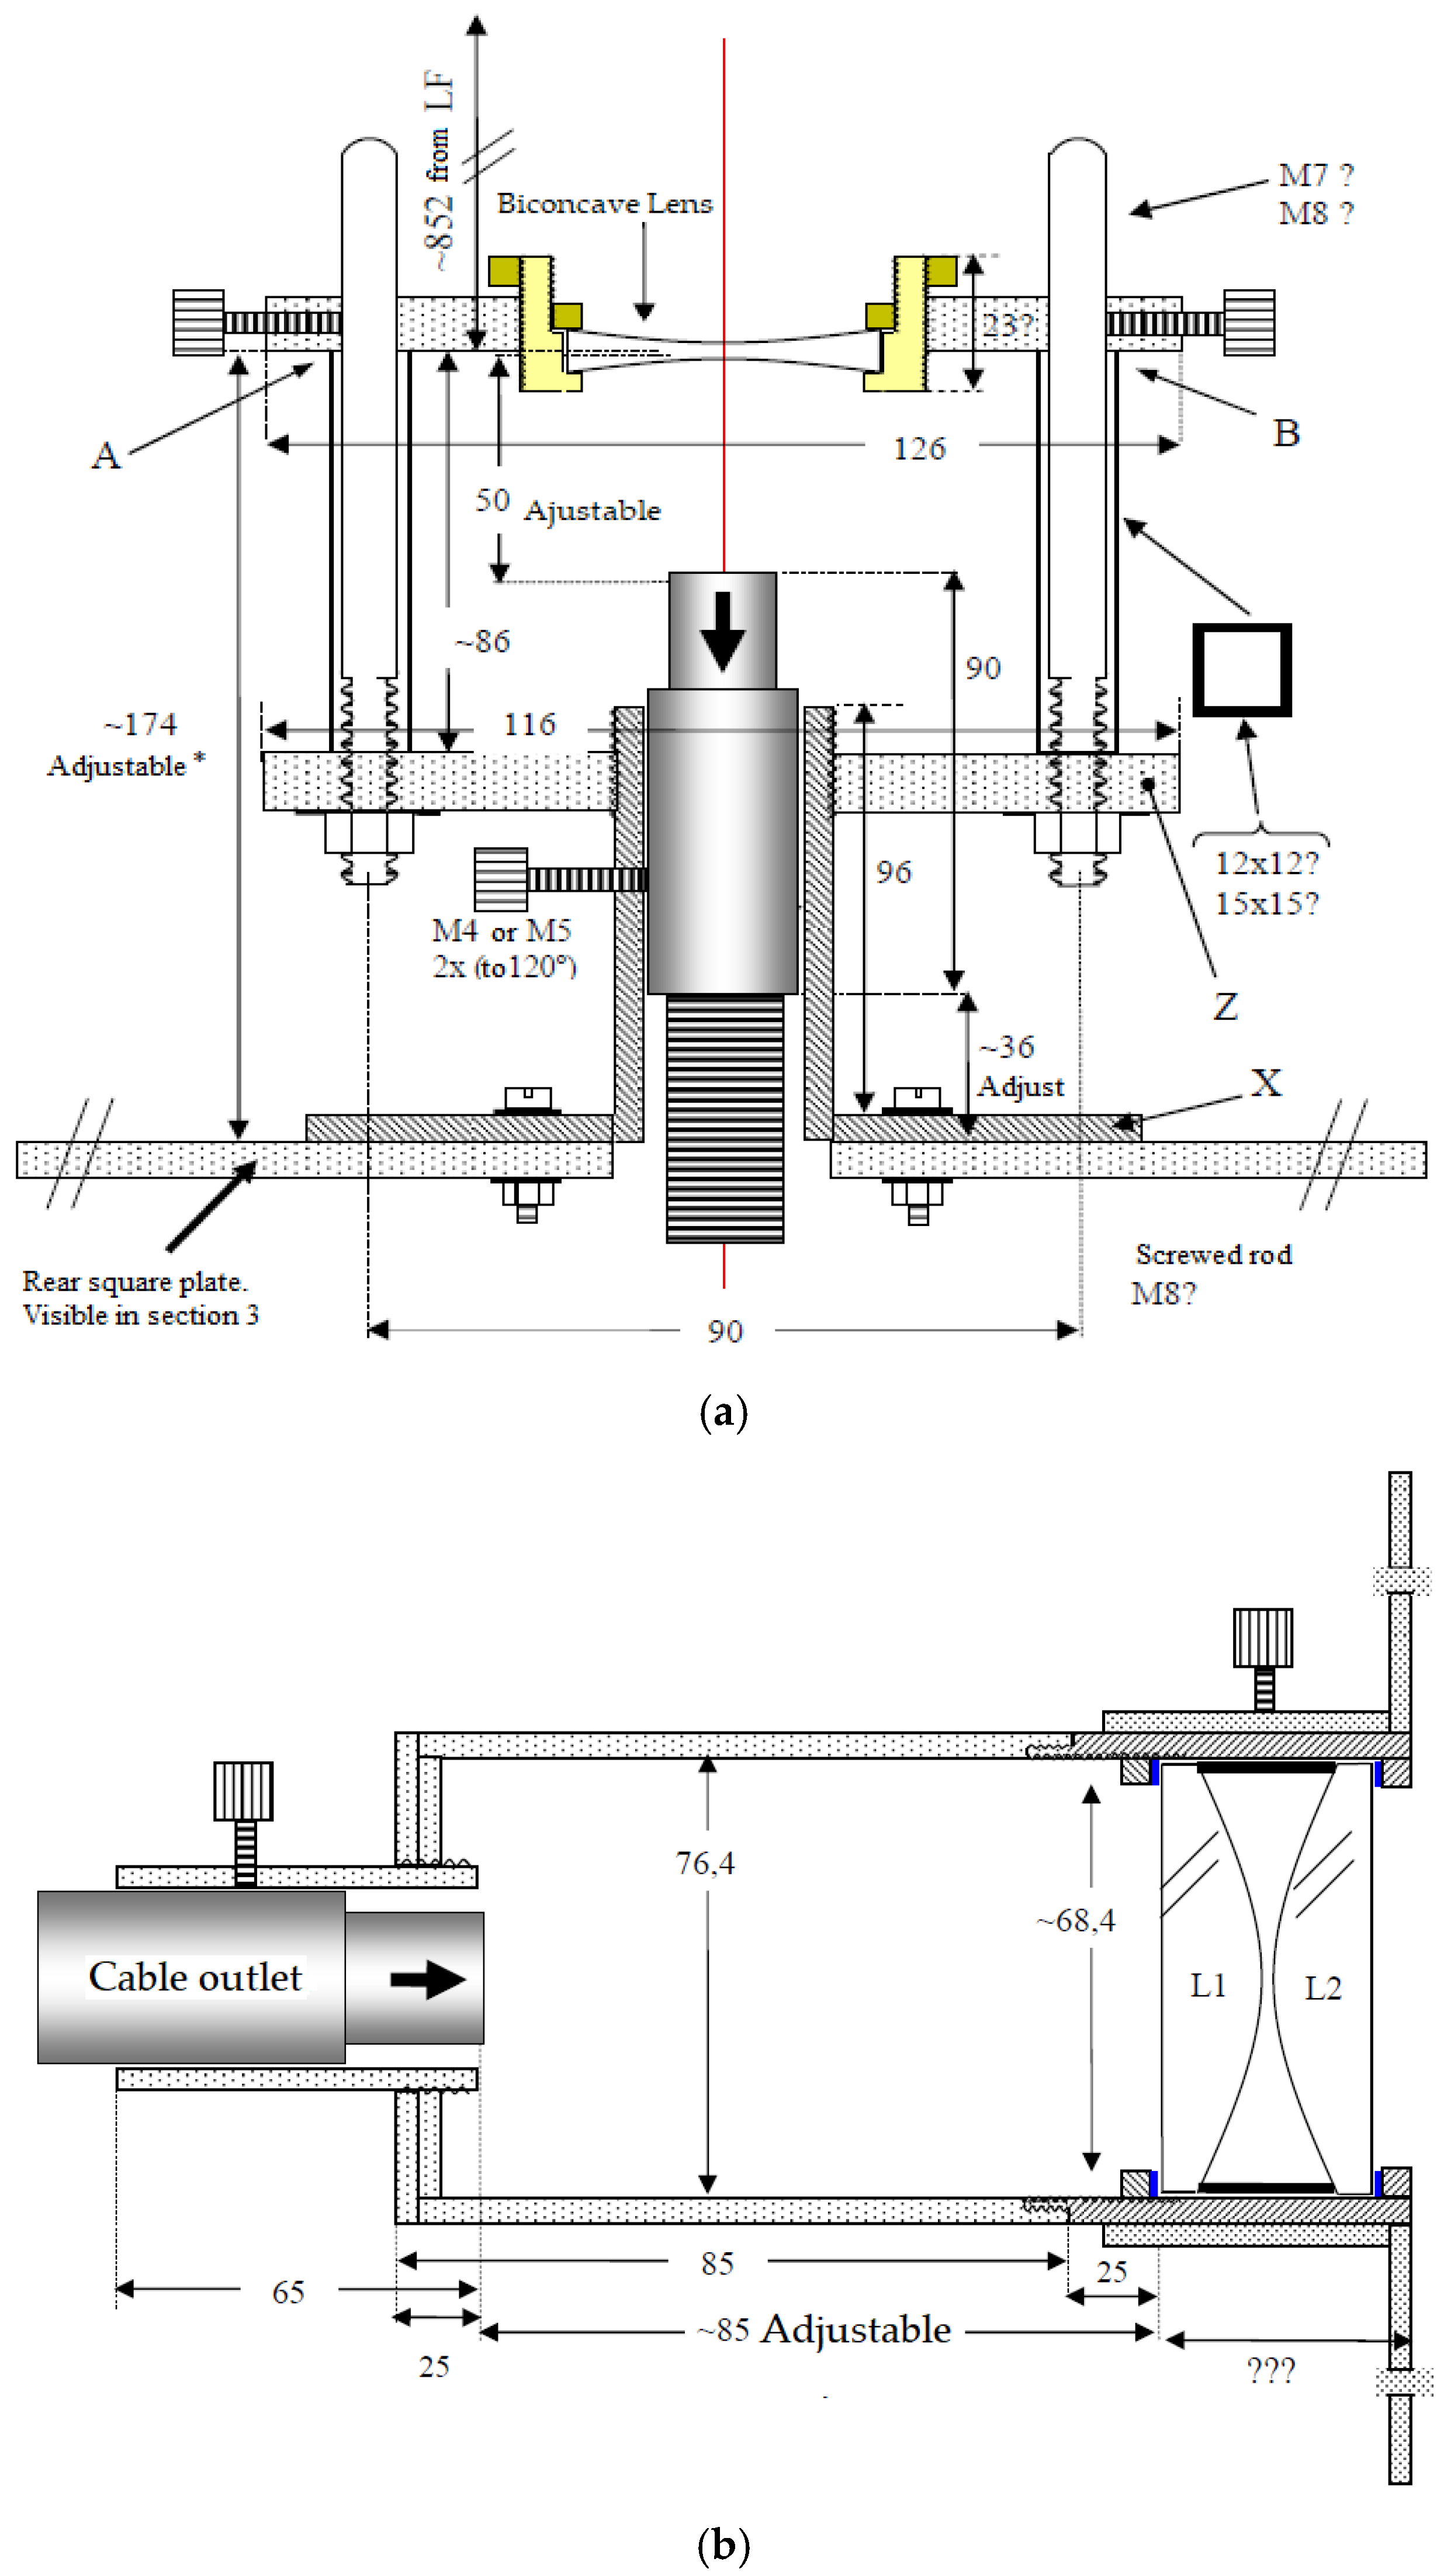
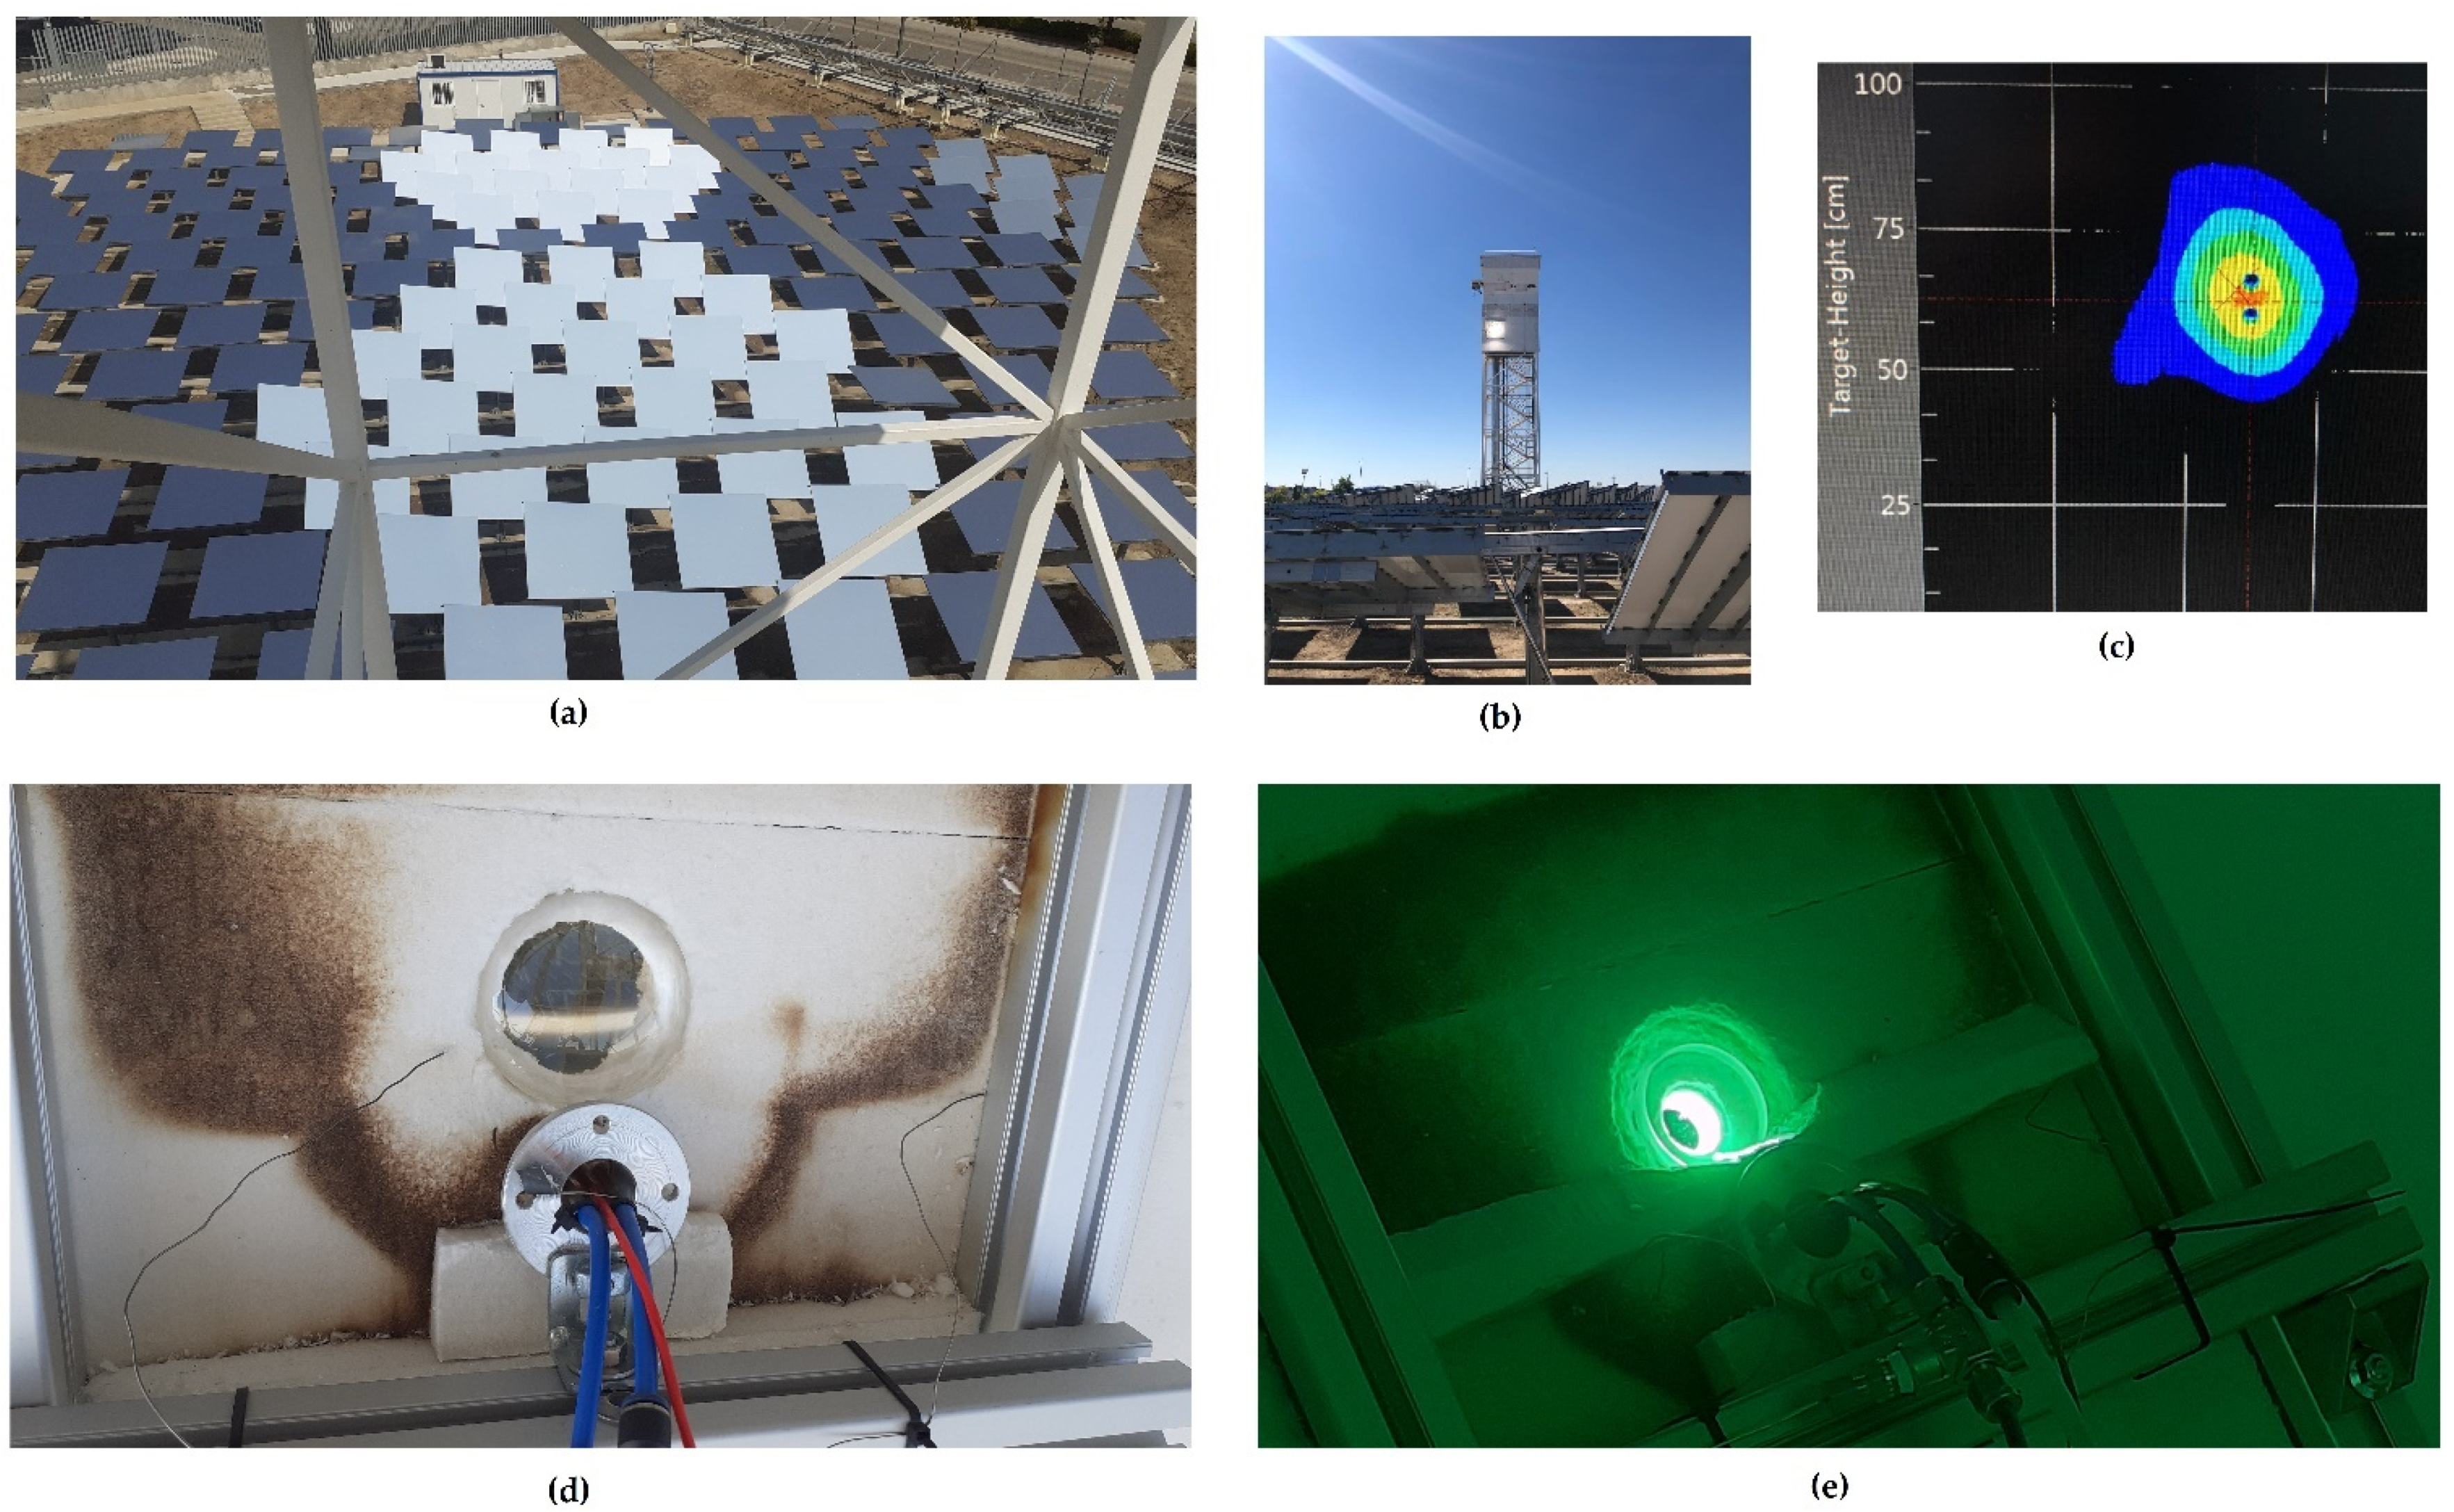
2.2.2. Irradiation with Concentrated Natural Sunlight

Irradiation tests with concentrated natural sunlight were conducted at the Very High Concentration Solar Tower (VHCST) [18,19], an installation available at the IMDEA Energy Institute (Móstoles, Madrid, Spain). The VHCST has a customized heliostat field (see Figure 8a) and a tower with optical height of 15 m (see Figure 8b). As in the previous experiments conducted with the xenon arc lamp radiation, the lenses were tested separately i.e., one by one, and duration of exposure of each lens to the radiation was also 60 min. The lenses were positioned on a target, made of alumina foam, at the top of the tower and measurements of radiation flux were performed with the same type of radiometer (Vatell Circular-Foil Heat Flux Transducer TG100-1, Vatell Corporation, Christiansburg, VA, USA). Figure 8c depicts the image provided by infrared camera software, showing the temperature distribution on the target (made of alumina foam) at the top of the tower. The radiometer was placed close to the lens in a zone where the radiation flux is homogenously distributed (see Figure 8c). The two small spots at the center of the yellow zone at Figure 8c correspond to the locations of the lens (above) and the radiometer (below). Photos in Figure 8d,e provide more details on the setup used to test the lenses on the inclined target at the top of the tower.

2.3. Vibrational Spectral Analyses of Lenses

After all irradiation tests, we conducted vibrational spectral analyses to investigate possible effects of the radiation tests that could lead to alterations in the internal structure of the optical lenses. For that, we have carried out absorption spectroscopy in the ultraviolet (UV)–visible light wavelength range and also Raman spectroscopy, on four lenses that were previously irradiated. Two of the lenses are made of borosilicate BK-7 glass and the other two are made of silica glass.

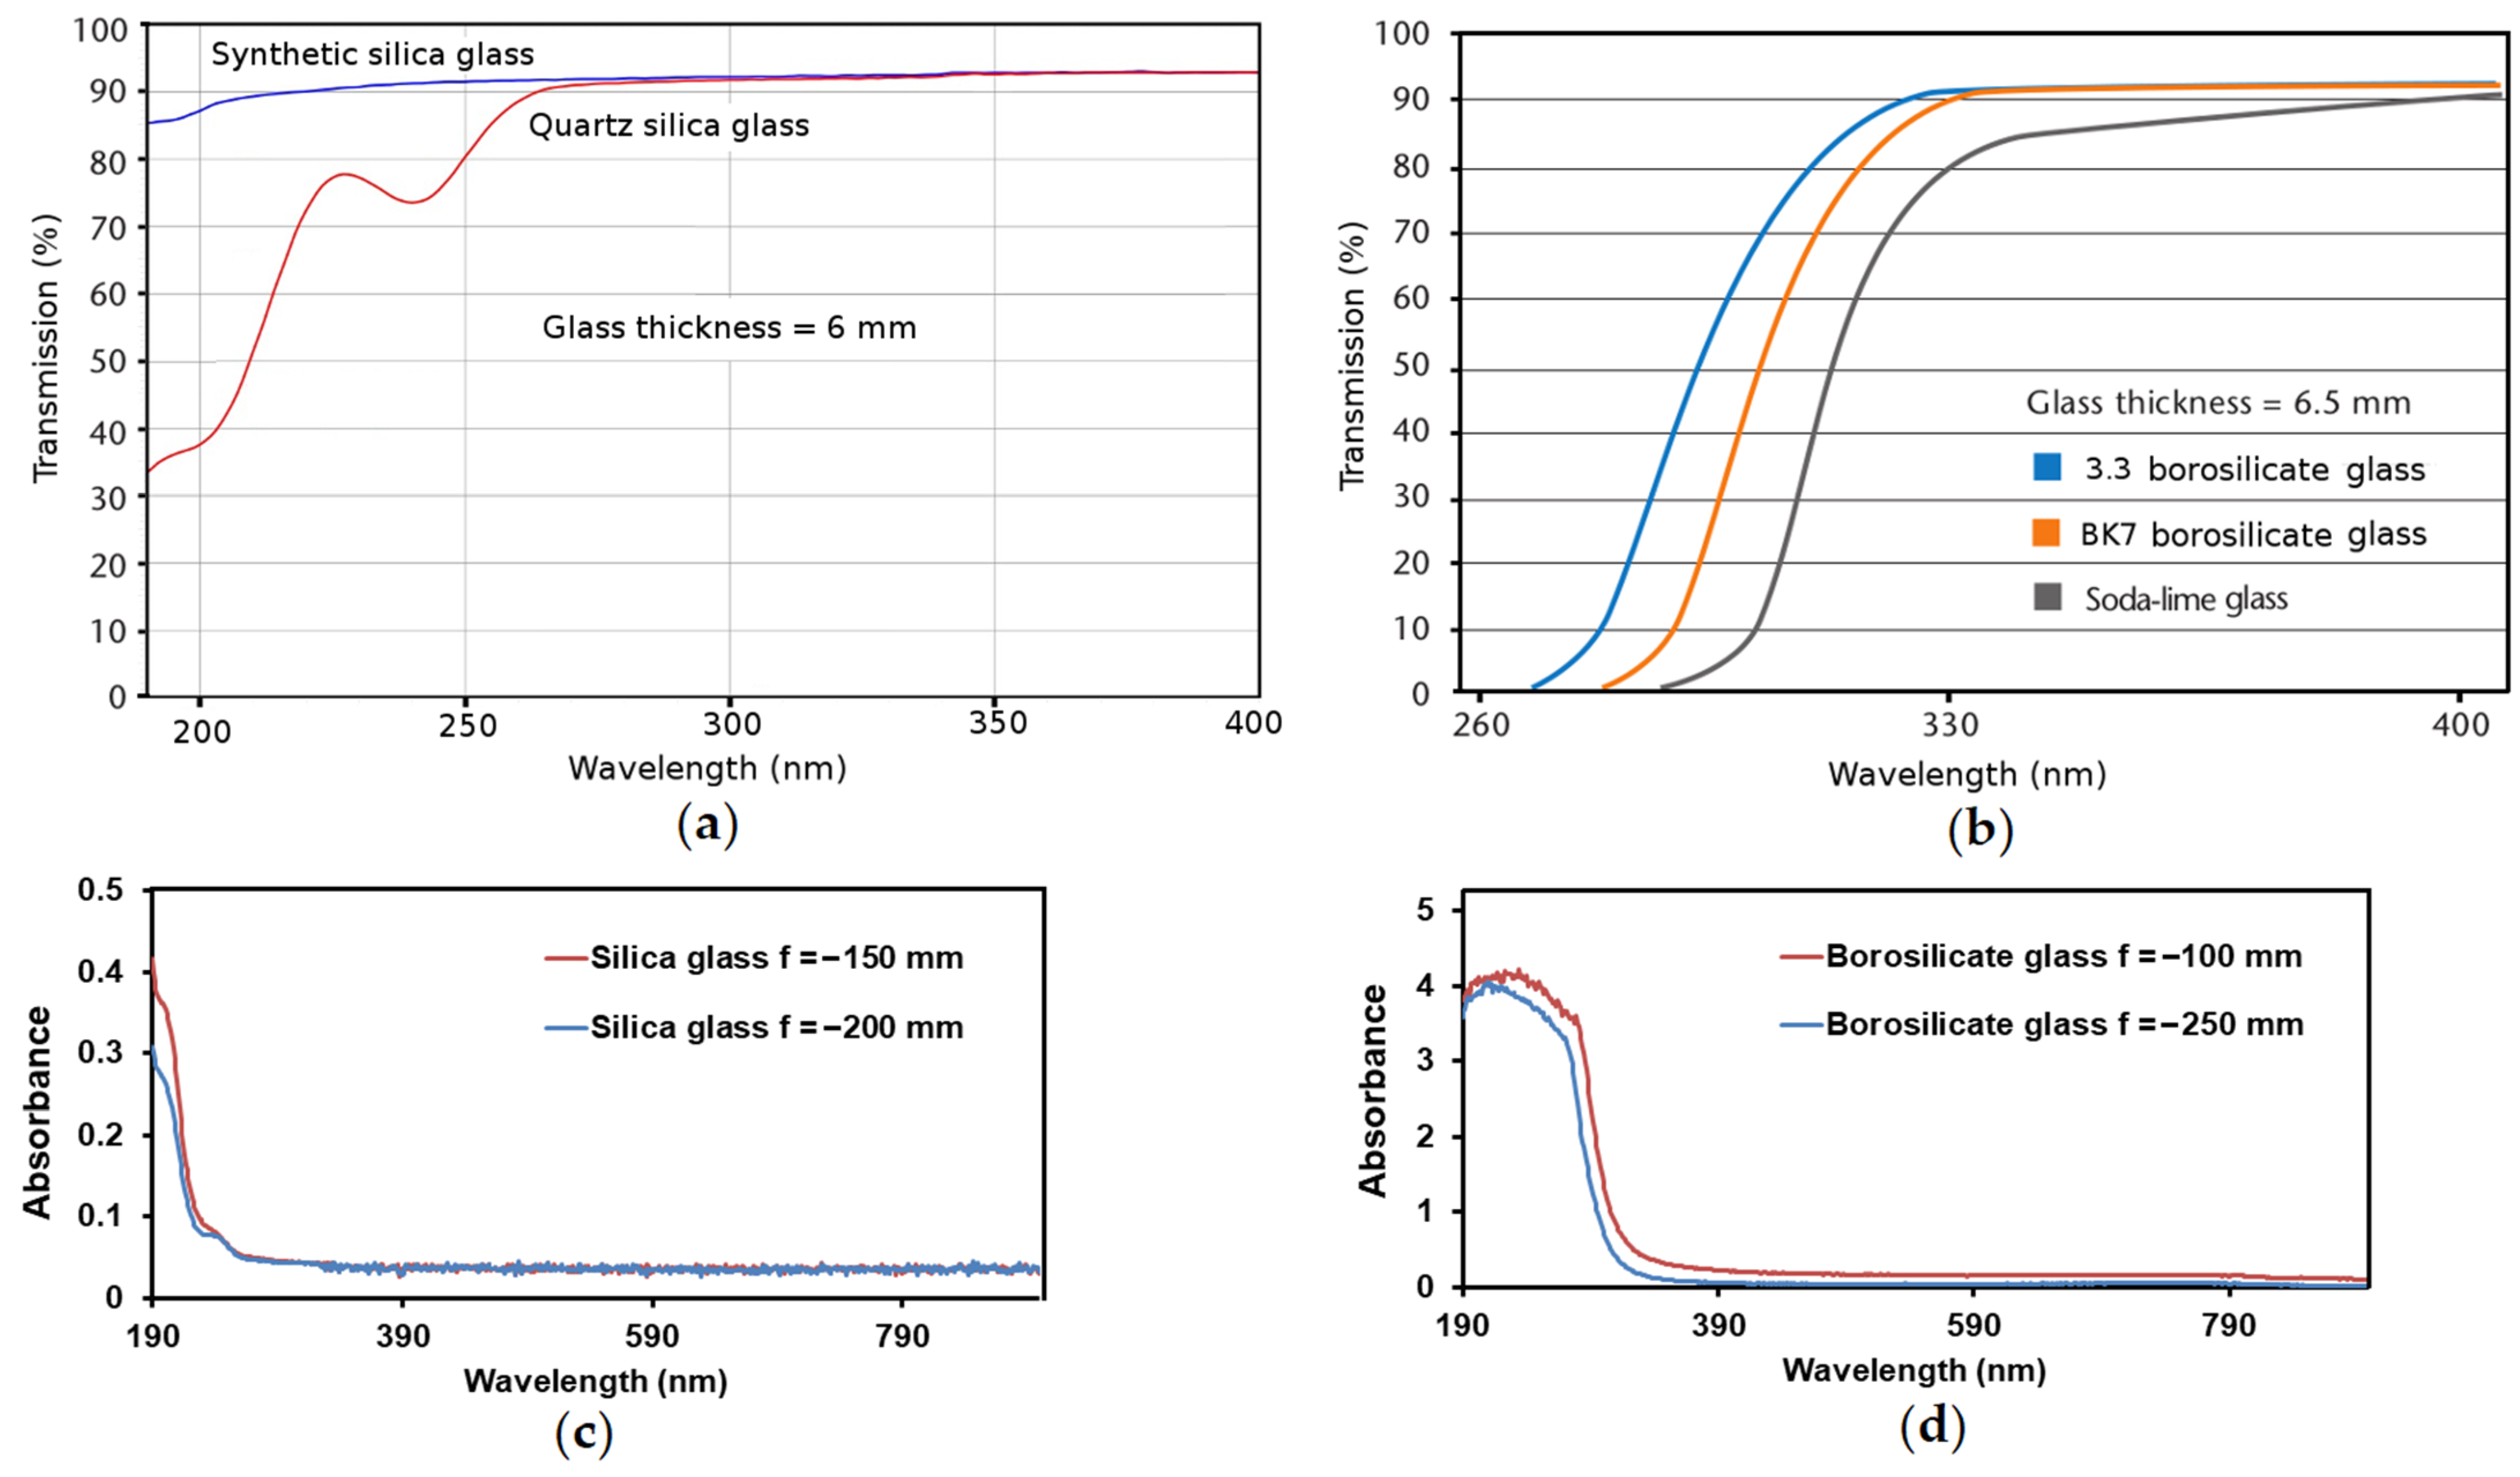
2.3.1. Ultraviolet (UV)–Visible Spectral Analysis

UV–visible absorbance/transmission spectra were obtained at room temperature with a Spectronic Helios Alpha UV-visible spectrophotometer (Thermo Electron Corporation, Waltham, MA, USA) in the 190–1100 nm wavelength range.

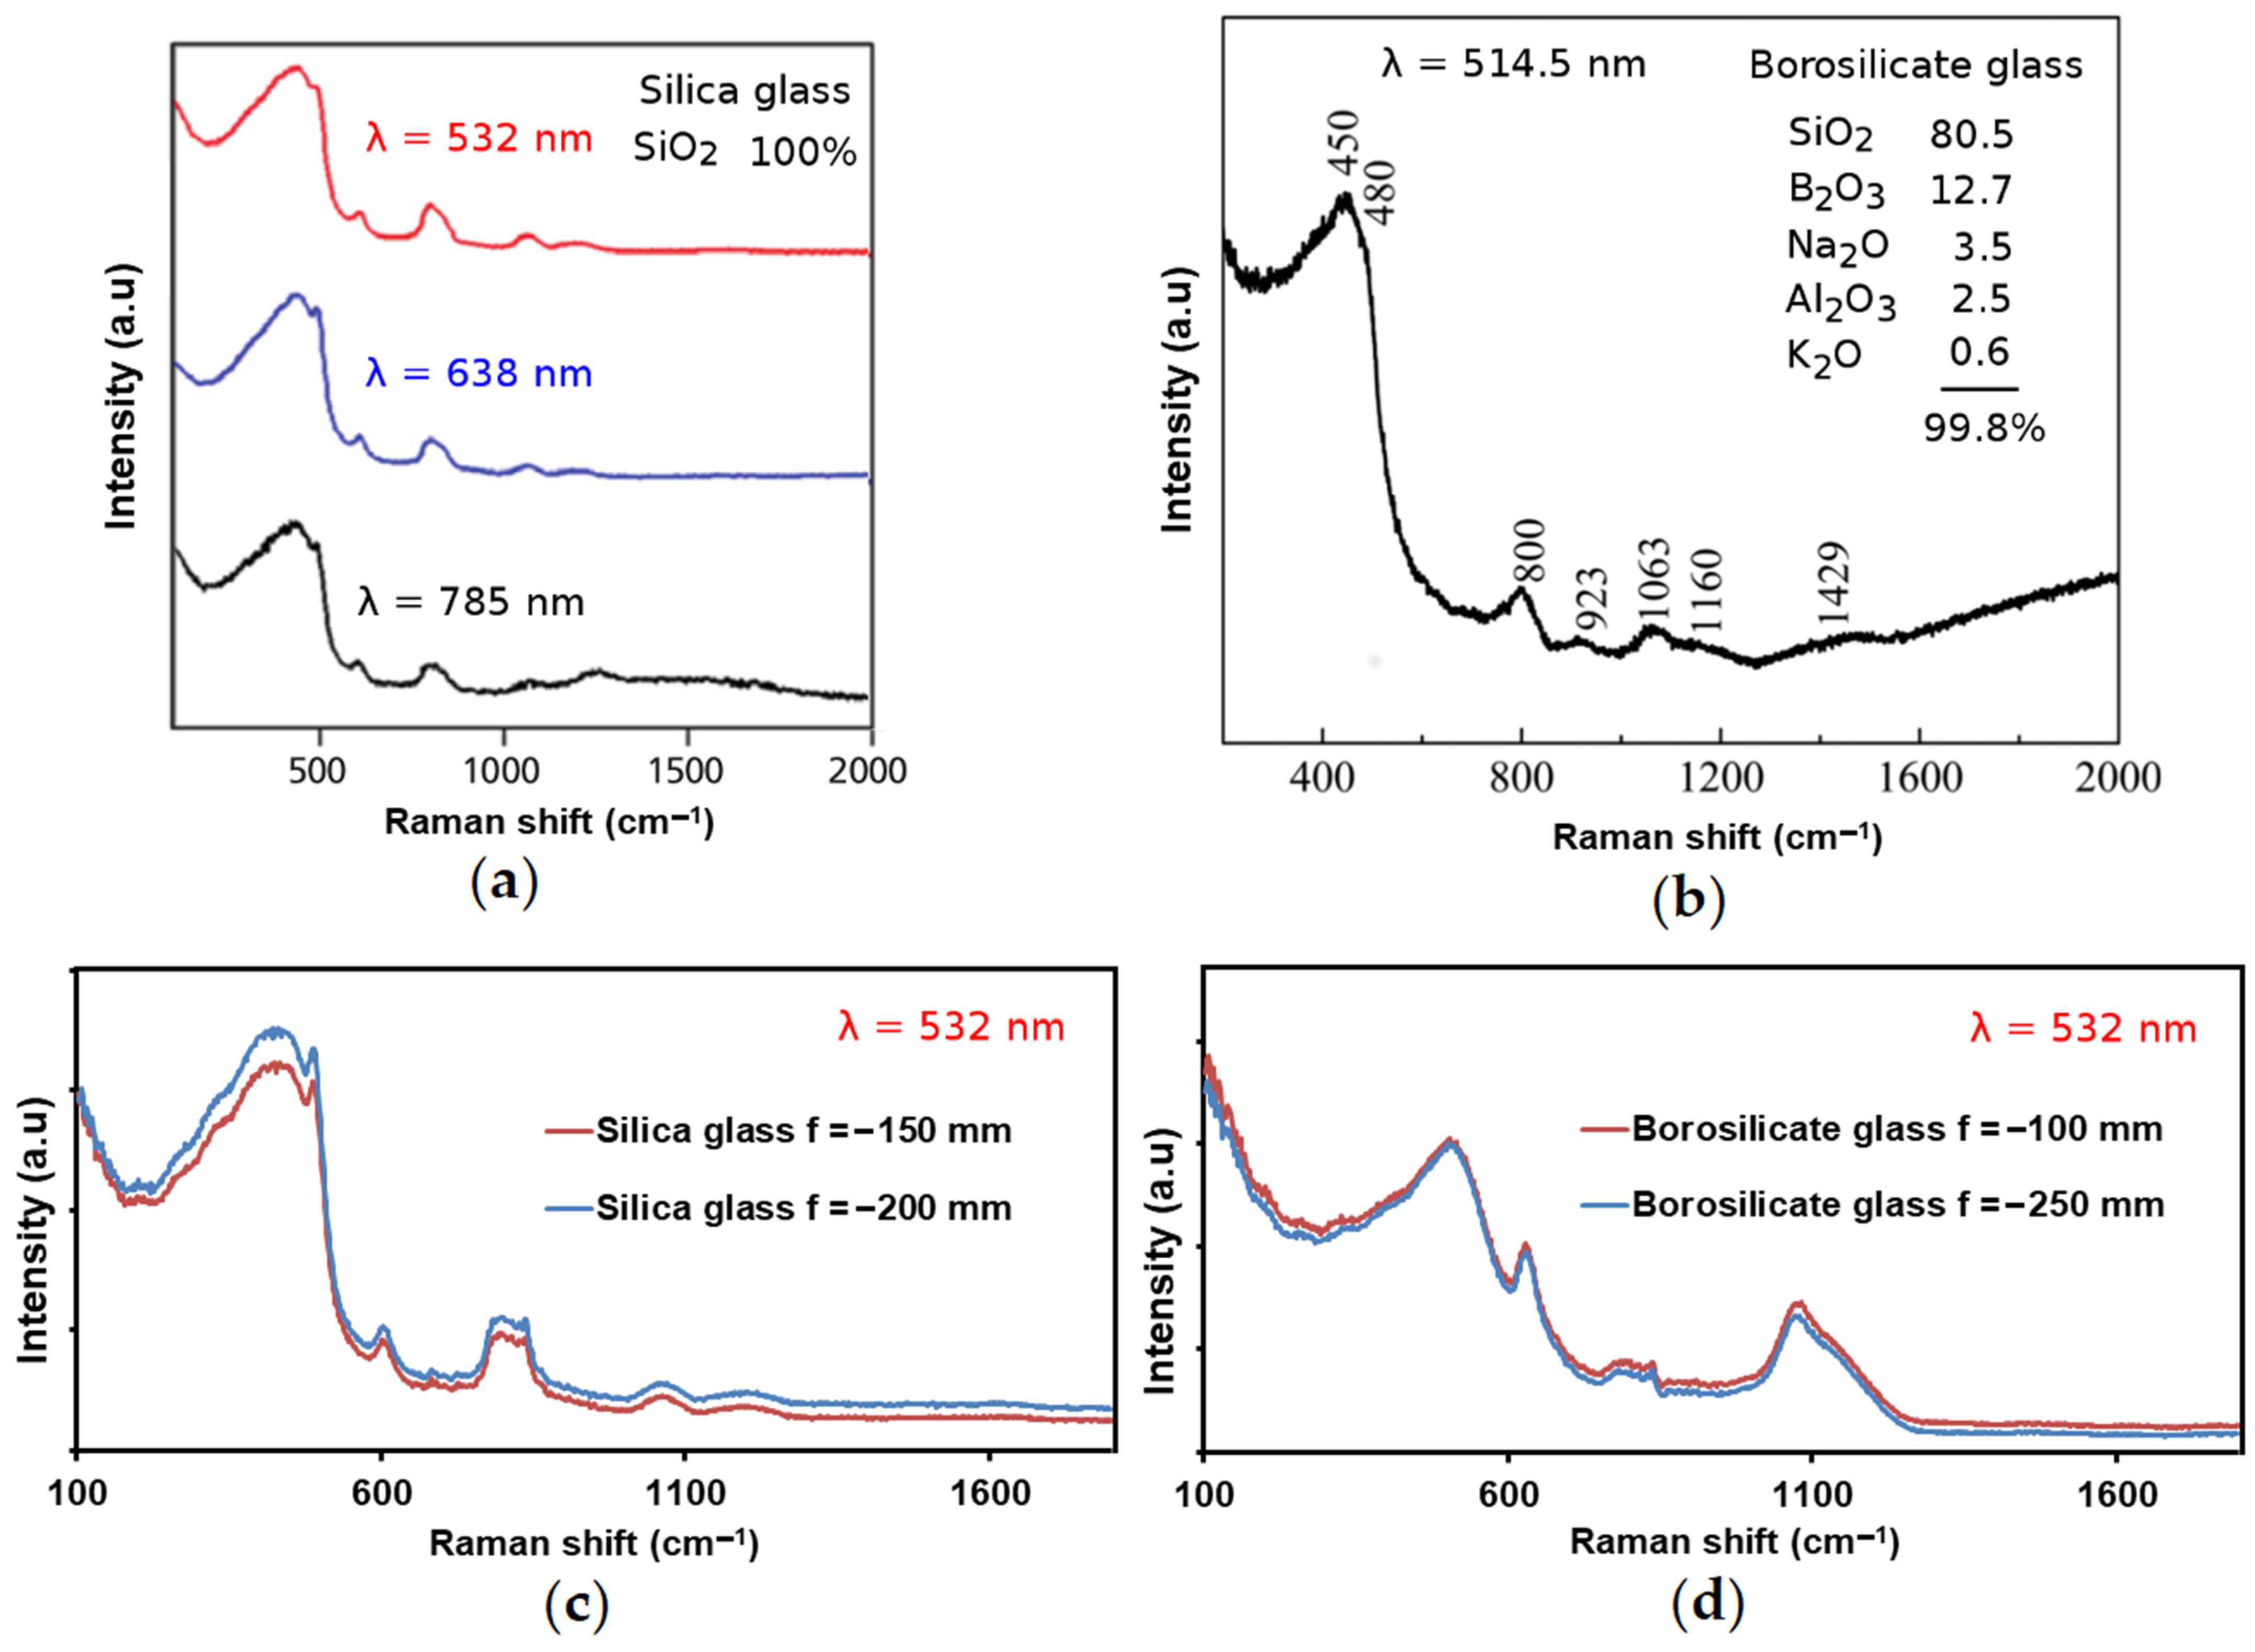
2.3.2. Raman Spectral Analysis

Raman spectra were collected, also at room temperature, with a LabRAM HR Evolution spectrometer (HORIBA Ltd., Minami-Ku Kyoto, Japan) with 532 nm excitation, for 30 s and 16 scans; the laser power at the samples was ~10 mW and data were collected using a 100× objective lens.

3. Results and Discussion

3.1. Results from Tests with Xenon Arc Lamp

The results of irradiation tests performed with the xenon arc lamp are summarized in Table 4.
It should be emphasized that the lenses were tested using different types of support in order to detect possible problems caused by the behavior of the support along the irradiation test. The type of support is mentioned in the 2nd column of Table 4: the letter “M” means that the lens was carried on a metallic holder (made of brass); the letter “A” means that the lens was simply surrounded by an alumina foam. As previously mentioned, details of the experimental setup of the irradiation tests performed with a xenon arc lamp are presented in Figure 5. To confine the radiation beam, making it uniquely incident in a central zone of the lens (thus restricting as much as possible the unnecessary heating of the supports), we have used a mask (or screen) made of alumina felt with a circular aperture of 1 inch (25.4 mm) diameter (as depicted in Figure 5c).
The converging lenses (plano-convex) that were tested in this work are larger (diameter = 76.2 mm) than the diverging (biconcave) lenses (diameter = 50.8 mm) and, as the radiation beam generated by the xenon arc lamp can be confined to the central zone of a lens with 76.2 mm in diameter, all tests conducted on converging lenses were undertaken without a mask.
As revealed in Table 4, no changes were observed in the lenses made of silica glass, even in those situations where hypothetically the risk was higher, such as the case of a diverging (biconcave) lens inserted on a holder made of brass, heated up to ≈340 °C, when the lens was irradiated during 60 min with an estimated power of 852 W.
The only problems that were detected during the testing campaign using a xenon arc lamp were assigned to the lenses made of borosilicate glass, because they fractured. In our opinion, the borosilicate (BK-7) lenses collapsed due to an internal vibrational phenomenon, occurring in the glass material, and not due to mechanical efforts induced by the support or by thermal shock. In all our experiments with the lenses, there was no thermal shock because the radiation was not applied suddenly. The thermal lensing effect [20] induced by temperature gradients may also occur in our experiments, but the fracture of the lenses must be attributed to internal mechanical stresses. As can be seen in Table 4, even the CB100 lens that was simply surrounded by an alumina foam was fractured after being exposed to the radiation generated by the xenon arc lamp. It should be noted that it is common at the laboratories that make use of high-flux solar radiation to employ reaction chambers (spherical or tubular) made of borosilicate glass, so it was surprising to observe the premature fracture of the lenses made with this type of glass. The origin of the fracture can only be explained by differences between the solar radiation and the radiation emitted by a xenon arc lamp.
Figure 9a depicts the solar radiation spectrum before entering the Earth’s atmosphere (in yellow color) and the solar radiation spectrum at sea level (in red color) [21]. After absorption by the atmosphere, the solar radiation shows wavelengths starting only at 290 nm, at the ultraviolet region. However, a xenon arc lamp emits radiation with wavelengths starting at circa 250 nm, as shown in Figure 9b (from the work of Finlayson-Pitts and Pitts Jr. [22]). The range between 250 nm and 290 nm, where the borosilicate glass (but not the silica glass) is strongly absorbing the xenon light, seems to be the key reason to explain the fracture of all the tested lenses made of BK7 glass. Finlayson-Pitts and Pitts Jr. [22] have also mentioned that the region of the xenon arc lamp spectrum with wavelengths ≤290 nm can be filtered using a borosilicate glass of Pyrex type in order to become more similar to the solar radiation spectrum.
The unfiltered spectrum of the xenon arc lamp presents also a series of peaks in the region between 800 and 1000 nm, as shown in Figure 9b, which do not appear in the solar radiation spectrum. However, both silica and borosilicate glasses are transparent in this spectral range, in the close infrared region (as discussed later), and the associated energy should be too low to actually break the glass.

3.2. Results from Tests with Concentrated Natural Sunlight

The results of irradiation tests performed with concentrated natural sunlight are summarized in Table 5.
As shown in Table 5, the irradiation power applied to the lenses tested in the solar tower are in the range between 200 and 314 W. We should note that tests performed with a xenon arc lamp covered the range between 180 and 852 W (Table 4). Comparing maximum temperatures in the vicinity of the lenses, we found higher temperatures with the test setup used in the solar tower than in the test setup used with the solar simulator using a xenon arc lamp. This discrepancy is explained due to the fact that in the solar tower the total irradiated area of the target (made of alumina foam) is quite large (approximately 30 cm in diameter, as depicted in the Figure 8b) and it is continuously being heated up by the heliostats during the 60 min of the irradiation test. However, in the solar simulator using a xenon arc lamp, the total irradiated area is only approximately 5.5 cm in diameter and most of the radiation beam just illuminates (irradiates) the lens. It should be emphasized that the values of irradiation power mentioned in Table 4 (for a xenon arc lamp) and Table 5 (for concentrated natural sunlight) pertain only to power incident on the lens surface.

3.3. Results from Vibrational Spectral Analyses of Lenses

The UV–visible spectra measured on the lenses of silica glass and of borosilicate glass, after sustaining intense radiation are reported in Figure 10c,d, respectively. The silica glass lenses that were analyzed were DS151 (focal length f = −150 mm) and DS201 (focal length f = −200 mm). DS151 was previously irradiated during 60 min at the xenon arc lamp projector +60 min at the solar tower; and DS201 was only irradiated during 60 min at the xenon arc lamp projector. On the other hand, the borosilicate glass lenses that were analyzed were DB100 (focal length f = −100 mm) and DB250 (focal length f = −250 mm); both were previously irradiated during 60 min at the solar tower.
The obtained UV–visible spectra (Figure 10c,d) were similar to the standard spectra for these types of glass (see Figure 10a [23] and Figure 10b [24]). This seems to indicate that the optical behavior of the lenses was not affected by the irradiation tests. For each pair of silica glass or borosilicate glass lenses, the obtained spectra for lenses of different focal length, with different thermal and radiation history, were almost matching and were only slightly different. The lenses that were thicker (i.e., silica glass lens with f = −150 mm, and borosilicate glass lens with f = −100 mm) presented higher absorbance compared to their thinner partner. It is known [25,26] that the absorption in the ultraviolet region for oxide glasses is mainly determined by the O atoms, steadily increasing with the weakness of the bonds established by these atoms. Pure silica glass has only bridging O2− ions, strongly bonded, so absorption is very low above 200 nm. Modified glasses have increasing fractions of terminal O oxygens, covalently bonded only to one Si4+ cation, thus absorption increases substantially in the 200–300 nm region. Pure borate glasses, B2O3, have also an excellent transmission in the ultraviolet, above 170 nm. The addition of small quantities (below 15%) of Na2O does not change absorption significantly because the O bonds are not affected (the B coordination number increases from 3 to 4, but each O remains bonded to two Si). For larger amounts of Na2O, some of the O atoms become terminal, bonded only to one Si, and the absorption increases sharply [25,26]. However, if we compare the scale of absorbance in the graphs shown in Figure 10c,d, we can notice that, for the range of wavelengths up to ~290 nm, the absorbance values of borosilicate glass are approximately 10 times higher than the corresponding ones measured in silica glass. In what concerns the region between 800 and 1000 nm where a series of intense peaks appear in the spectrum of the xenon arc lamp, the graphs depicted in Figure 10c,d indicate that for wavelengths above 800 nm pure silica glass as well as borosilicate glass are both quite transparent and, therefore, these glasses are not affected by those peaks.
The Raman spectra of the analyzed lenses are presented in Figure 11c,d; and are analogous to the standard spectra of silica glass (fused quartz) [27] depicted in Figure 11a, and of borosilicate glass [28] depicted in Figure 11b. The band assignments of the Raman spectra can be based on previous works on SiO2 glass and SiO2-rich glasses as borosilicate glasses [29,30,31,32]. The spectra of the silica lenses are dominated by a ~430 nm band assigned to symmetrical stretching (SS) vibrational modes of Si-O-Si. The sharp peak observed at 490 cm−1 and the small at ~600 cm−1 have been attributed to four and three-membered silicate rings, respectively. The 450 cm−1 Raman band is assigned to the bending vibration mode of the Si–O–Si bond in six-membered rings. The 480 cm−1 band has been assigned to a vibrationally isolated Si-O-Si, Si-O-B mode of four-membered rings which has small inter-tetrahedral angles. The weak band at around 800 cm−1 is assigned to the O-Si-O symmetric bond stretching, associated with motions of Si (possibly also B) against its O cage [33].

4. Conclusions

In this work we have examined the performance of optical lenses made of silica glass or of borosilicate glass (BK-7) when submitted to high-flux radiation emitted by a xenon arc lamp or provided by a high-concentration solar tower. All lenses made of silica glass perfectly withstood the tests, even when the power applied on the surface of a 50.8 mm diameter lens was of the order of 852 W and a temperature of 342 °C (measured by thermocouples located in the back of the lens, at shadow, but very close to the lens border) was registered. Concerning the lenses made of borosilicate glass, all of them fractured, sooner or later, when tested with the xenon arc lamp projector; but they resisted unaffected when tested with concentrated natural sunlight. We concluded that the borosilicate (BK-7) lenses collapsed due to an internal phenomenon (occurring at the glass material) and not due to mechanical efforts induced by the support. There is a discrepancy in the wavelength region between 250 and 290 nm when we compared the spectrum of natural solar radiation at sea level with the unfiltered spectrum of the xenon arc lamp. The solar radiation at sea level shows wavelengths starting at only around 290 nm at the ultraviolet region; but the unfiltered spectrum of the xenon arc lamp shows wavelengths already starting from circa 250 nm. The collapse of the borosilicate lenses is attributed to the radiation within this interval between 250 and 290 nm, in the UV region. Absorption spectroscopy analyses in the UV–visible light wavelength range and also Raman spectroscopy analyses were conducted on lenses that were previously irradiated and corroborate the conclusion that both types of glass, either silica glass or borosilicate glass, seem not to be affected by high-flux natural solar radiation at sea level (i.e., after passing through the Earth’s atmosphere).

Author Contributions

L.G.R.: methodology, data curation, validation, project administration and funding acquisition, writing—review and editing. J.C.G.P.: methodology, data curation, validation, original draft preparation. K.R.: data curation, original draft preparation. G.D.A.: selection of optical lenses, formal analysis, optical and mechanical diagrams. L.F.S.: Vibrational spectral analyses of lenses. All authors have read and agreed to the published version of the manuscript.

Funding

The authors were beneficiaries of the Solar Facilities for the European Research Area (SFERA) Programme (SFERA-III Project Grant Agreement no. 823802) which allowed them to carry out a test campaign at the IMDEA Energy Institute. This research was partially funded by the Portuguese Foundation for Science and Technology (FCT), through IDMEC, under LAETA, project UIDB/50022/2020.

Acknowledgments

We thank the IMDEA Energy Institute (Móstoles, Spain) for providing access to its installations, the support of its scientific and technical staff, namely, José González-Aguilar, Alejandro Martínez-Hernández, and Iván Bravo Gonzalo, as well as the financial support of the SFERA-III project (Grant Agreement No 823802). Special thanks are also due to Pedro Franco (Marinha Grande, Portugal) for his help in the acquisition process of the tested lenses, and construction of metallic holders.

Conflicts of Interest

The authors declare no conflict of interest.

References

  1. Himalaya, M.A.G. Improved Apparatus for Making Industrial Use of the Heat of the Sun and Obtaining High Temperatures. Patent GB190116181, 26 October 1901. Available online: https://worldwide.espacenet.com/publicationDetails/biblio?FT=D&date=19011026&DB=EPODOC&locale=en_EP&CC=GB&NR=190116181A&KC=A&ND=2 (accessed on 16 April 2021).
  2. Himalaya, M.A.G. Solar Apparatus for Producing High Temperatures. U.S. Patent 797,891, 22 August 1905. Available online: https://patents.google.com/patent/US797891 (accessed on 16 April 2021).
  3. Levêque, G.; Bader, R.; Lipinski, W.; Haussener, S. High-flux optical systems for solar thermochemistry. Sol. Energy 2017, 156, 133–148. [Google Scholar] [CrossRef] [Green Version]
  4. Fernández-González, D.; Ruiz-Bustinza, I.; González-Gasca, C.; Piñuela-Noval, J.; Mochón-Csataños, J.; Sancho-Gorostiaga, J.; Verdeja, L.F. Concentrated solar energy applications in materials science and metallurgy. Sol. Energy 2018, 170, 520–540. [Google Scholar] [CrossRef]
  5. Bushra, N.; Hartmann, T. A review of state-of-the-art reflective two-stage solar concentrators: Technology categorization and research trends. Renew. Sustain. Energ. Rev. 2019, 114, 109307. [Google Scholar] [CrossRef]
  6. Rosa, L.G. Solar Heat for Materials Processing: A Review on Recent Achievements and a Prospect on Future Trends. ChemEngineering 2019, 3, 83. [Google Scholar] [CrossRef] [Green Version]
  7. Sonawane, P.D.; Raja, V.K.B. Concentrated solar energy in materials processing. Int. J. Ambient Energy 2020, 41, 1201–1207. [Google Scholar] [CrossRef]
  8. Kumar, K.R.; Chaitanya, N.V.V.K.; Natarajan, S.K. Solar thermal energy technologies and its applications for process heating and power generation—A review. J. Clean. Prod. 2021, 282, 125296. [Google Scholar] [CrossRef]
  9. Almeida, J. Advances in Solar-Pumped Laser Efficiency and Brightness. Ph.D. Thesis, Faculty of Sciences and Technology, NOVA University of Lisbon, Caparica, Portugal, September 2017. Available online: https://run.unl.pt/bitstream/10362/28836/3/Almeida_2017.pdf (accessed on 1 June 2021).
  10. Costa, H.; Almeida, J.; Liang, D.W.; Garcia, D.; Catela, M.; Tiburcio, B.D.; Vistas, C.R. Design of a multibeam solar laser station for a megawatt solar furnace. Opt. Eng. 2020, 59, 086103. [Google Scholar] [CrossRef]
  11. Abanades, S.; Tescari, S.; Rodat, S.; Flamant, G. Natural gas pyrolysis in double-walled reactor tubes using thermal plasma or concentrated solar radiation as external heating source. J. Nat. Gas Chem. 2009, 18, 1–8. [Google Scholar] [CrossRef]
  12. Ugwuishiwu, B.O.; Owoh, I.P.; Udom, I.J. Solar energy application in waste treatment—A review. Niger. J. Technol. 2016, 35, 432–440. [Google Scholar] [CrossRef] [Green Version]
  13. Padilla, I.; Romero, M.; Robla, J.I.; López-Delgado, A. Waste and Solar Energy: An Eco-Friendly Way for Glass Melting. ChemEngineering 2021, 5, 16. [Google Scholar] [CrossRef]
  14. Gonzalez, A.; Gonzalez-Aguilar, J.; Romero, M. Preliminary analysis of a 100-kWth mini-tower solar field with an integrated optical waveguide receiver for solar chemistry. In Proceedings of the ASME 2010 4th International Conference on Energy Sustainability, Phoenix, AZ, USA, 17–22 May 2010; Volume 2, pp. 543–552. [Google Scholar] [CrossRef]
  15. De Almeida, G. Proposta: Estrutura de Suporte do Concentrador e Dispositivos de Fixação e Regulação dos Seus Elementos Ópticos; do Autor: Lisboa, Portugal, 2019. [Google Scholar]
  16. Luque, S.; Santiago, S.; Gómez-García, F.; Romero, M.; González-Aguilar, J. A new calorimetric facility to investigate radiative-convective heat exchangers for concentrated solar power applications. Int. J. Energy Res. 2018, 42, 966–976. [Google Scholar] [CrossRef]
  17. Fundamentals of Xenon Arc Lamps. Xenon Arc Lamp Construction. Available online: http://zeiss-campus.magnet.fsu.edu/articles/lightsources/xenonarc.html (accessed on 5 May 2021).
  18. Romero, M.; González-Aguilar, J.; Luque, S. Ultra-modular 500m2 heliostat field for high flux/high temperature solar-driven processes. AIP Conf. Proc. 2017, 1850, 030044. [Google Scholar] [CrossRef] [Green Version]
  19. Martínez-Hernández, A.; Gonzalo, I.B.; Romero, M.; González-Aguilar, J. Drift analysis in tilt-roll heliostats. Sol. Energy 2020, 211, 1170–1183. [Google Scholar] [CrossRef]
  20. Paschotta, R. Thermal Lensing. Available online: https://www.rp-photonics.com/thermal_lensing.html (accessed on 28 May 2021).
  21. Spectrum of Solar Radiation (Earth). Available online: https://en.wikipedia.org/wiki/Solar_irradiance#/media/File:Solar_spectrum_en.svg (accessed on 5 May 2021).
  22. Finlayson-Pitts, B.J.; Pitts, J.N., Jr. Applications of Atmospheric Chemistry. In Chemistry of the Upper and Lower Atmosphere; Academic Press: Cambridge, MA, USA, 2000; pp. 871–942. [Google Scholar] [CrossRef]
  23. Crystran—Silica Glass, SiO2. Available online: https://www.crystran.co.uk/userfiles/images/silica-glass-uv-transmission.jpg (accessed on 7 May 2021).
  24. BOROFLOAT® 33—Optical Properties Datasheet. Available online: https://www.schott.com/en-us/products/borofloat/downloads (accessed on 7 May 2021).
  25. Scholze, H. Glass: Nature, Structure, and Properties, 1st ed.; Springer: New York, NY, USA, 1991. [Google Scholar] [CrossRef]
  26. Fernández Navarro, J.M. El Vidrio; Tercera Edición; Consejo Superior de Investigaciones Científicas: Madrid, Spain, 2003; Available online: https://editorial.csic.es/publicaciones/libros/10909/978-84-00-08158-4/el-vidrio-constitucion-fabricacion-propiedades.html (accessed on 1 June 2021).
  27. Tuschel, D. Selecting an Excitation Wavelength for Raman Spectroscopy. In Molecular Spectroscopy Workbench: The 2016 Collection; Spectroscopy E-Books 2016; Volume e4, Issue 2; Available online: https://cdn.sanity.io/files/0vv8moc6/spectroscopy/6d3eda3f1fa42c509c63a2c0f1ea1f265df62902.pdf (accessed on 1 June 2021).
  28. Manghnani, M.H.; Hushur, A.; Sekine, T.; Wu, J.; Stebbins, J.F.; Williams, Q. Raman, Brillouin, and nuclear magnetic resonance spectroscopic studies on shocked borosilicate glass. J. Appl. Phys. 2011, 109, 113509. [Google Scholar] [CrossRef] [Green Version]
  29. McMillan, P.F.; Wolf, G.H.; Poe, B.T. Vibrational spectroscopy of silicate liquids and glasses. Chem. Geol. 1992, 96, 351–366. [Google Scholar] [CrossRef]
  30. Smith, C.F. The vibrational analysis of boron in vitreous silica. In Borate Glasses: Structure, Properties, Applications; Pye, L.D., Fréchette, V.D., Kreidl, N.J., Eds.; Springer US: New York, NY, USA; Philadelphia, PA, USA, 1978; pp. 307–319. Available online: https://www.springer.com/gp/book/9781468433593#aboutBook (accessed on 1 June 2021).
  31. Konijnendijk, W.L.; Stevels, J.M. Raman scattering measurements of silicate glasses and compounds. J. Non-Cryst. Solids 1976, 21, 447–453. [Google Scholar] [CrossRef]
  32. Manara, D.; Grandjean, A.; Neuville, D.R. Advances in understanding the structure of borosilicate glasses: A Raman spectroscopy study. Am. Miner. 2009, 94, 777–784. [Google Scholar] [CrossRef]
  33. Gautam, C.R.; Yadav, A.K. Synthesis and optical investigations on (Ba,Sr)TiO3 borosilicate glasses doped with La2O3. Opt. Photonics J. 2013, 3, 1–7. [Google Scholar] [CrossRef]
Figure 1. (a) Photo of a 7 m optical fiber bundle/cable specially designed to transmit concentrated sunlight (up to 1000 W); (b) detail of the terminals (inlet and outlet) of the optical fiber bundle/cable.
Applsci 11 05174 g001
Figure 2. Scheme showing a concentration system (Fresnel lens) and a diverging lens to satisfy the acceptance angle of a possible conducting optical cable (not shown in the figure).
Applsci 11 05174 g002
Figure 3. (a) Design of a diverging system to be used at the entrance/inlet of the optical fiber bundle/cable [15]; (b) design of a converging system to be used at the end/outlet of the optical fiber bundle/cable [15]; all dimensions in mm.
Applsci 11 05174 g003
Figure 4. General layout of the solar radiation simulator/projector by xenon arc lamp, and the XYZ coordinate table.
Applsci 11 05174 g004
Figure 5. Details of experimental setup for the irradiation tests using xenon arc lamp projector. (a) Photo of an irradiation test showing a metallic grid used as radiation attenuator (at the left) and irradiated lens (at the right); (b) lens (of 76.2 mm diameter) being irradiated, simply surrounded by alumina foam; (c) for confining the radiation beam, in some tests we have used a mask made of alumina felt with a circular aperture of 1 inch (25.4 mm) diameter; the Gardon-type radiometer is on the right protected by alumina foam; (d) fractured lens (of 50.8 mm diameter) mounted in metallic holder.
Applsci 11 05174 g005
Figure 6. Image provided by the infrared camera software during a test with a biconcave lens DS151, showing the temperature distribution. In this test, the irradiation power incident on the exposed surface of the lens is 180 W, because a mask made of alumina felt with a circular aperture of 1 inch (25.4 mm) diameter is used (facing directly towards the xenon lamp projector).
Applsci 11 05174 g006
Figure 7. Scheme showing: (a) positions where measurements with radiometer were carried out. Inside each circle, the value indicates the measured flux, in W·cm−2; (b) zones used to calculate the total power; using the attenuator no. 5, estimated average values of power (in W) for each of the zones are mentioned in the figure, as well as the total power (607 W).
Applsci 11 05174 g007
Figure 8. Details of experimental setup of the irradiation tests using the Very High Concentration Solar Tower (VHCST). (a) Heliostat field; (b) central tower; (c) image provided by infrared camera software, showing the temperature distribution on the target (made of alumina foam) at the top of the tower; (d) photo showing the test setup used for a lens (with 76.2 mm diameter) simply surrounded by alumina foam and aspect of the Gardon-type radiometer; (e) photo taken during an irradiation test on a lens (with 50.8 mm diameter) simply surrounded by alumina foam and aspect of the Gardon-type radiometer below the lens.
Applsci 11 05174 g008
Figure 9. (a) Solar radiation spectrum for direct light at both the top of the Earth’s atmosphere (represented by yellow area) and at sea level (red area); (b) unfiltered radiation spectrum of xenon arc lamp and the sunlight spectral irradiance at top of the atmosphere.
Applsci 11 05174 g009
Figure 10. UV–visible spectra: (a) standard spectra for natural silica glass and synthetic silica glass; (b) Standard spectra for borosilicate glasses and soda-lime glass; (c) obtained UV–visible spectra in silica glass lenses of different focal length; (d) obtained UV–visible spectra in borosilicate glass lenses of different focal length.
Applsci 11 05174 g010
Figure 11. Raman spectra: (a) standard spectra for silica glass, measured with different excitation wavelength; (b) standard spectra for a borosilicate glass; (c) obtained Raman spectra in silica glass lenses of different focal length; (d) obtained Raman spectra in borosilicate glass lenses of different focal length.
Applsci 11 05174 g011
Table 1. Diverging (biconcave) lenses tested in this work.
DesignationMaterialDiameter (mm)ThicknessFocal Length (mm)
Board (mm)Center (mm)
DB100Borosilicate glass50.89.02.0−100 1
DB150Borosilicate glass50.87.73.5−150 2
DB200Borosilicate glass50.86.73.5−200 2
DB250Borosilicate glass50.85.02.0−250 1
DS151Silica glass50.88.43.5−150 2
DS201Silica glass50.87.13.5−200 2
1: at 589 nm. 2: at 546.1 nm.
Table 2. Converging lenses (plano-convex) tested in this work.
DesignationMaterialDiameter (mm)ThicknessFocal Length (mm)BFL 2 (mm)
Board (mm)Center (mm)
CB100Borosilicate glass76.22.519.3100 187.2 1
CS100Silica glass76.22.422.9100 184.2 1
1: at 589 nm. 2 BFL: back focal length.
Table 3. Radiation-flux attenuation factors obtained with five different attenuators.
AttenuatorRadiation-Flux in the Focal Zone (W cm−2)Attenuation Factor
Without attenuator3161
Attenuator no. 12490.788
Attenuator no. 22210.699
Attenuator no. 31930.611
Attenuator no. 41620.513
Attenuator no. 51300.411
Table 4. Summary of irradiation tests performed with xenon arc lamp.
Lens TypeType of Support and MaskIrradiation Power (W)Irradiation Time (min)Maximum Temperature 1 (°C)Comment
DB150M, 1 inch180≈10≈100Fractured after ≈10 min
DB200M, no mask311≈3≈84Fractured after ≈3 min
DS151A, 1 inch18060≈205No changes observed in the lens
DS151M, 1 inch18060≈127No changes observed in the lens
DS151A, 1 inch35060≈189No changes observed in the lens
DS151A, 1 inch85260≈342No changes observed in the lens
DS201M, 1 inch18060≈126No changes observed in the lens
DS201M, 1 inch35060≈191No changes observed in the lens
DS201M, 1 inch85260≈340No changes observed in the lens
CB100A, no mask31160≈182No changes observed in the lens
CB100A, no mask607≈10≈262Fractured after ≈10 min
CS100A, no mask31160≈148No changes observed in the lens
CS100A, no mask60760≈213No changes observed in the lens
1 Measured by thermocouples located in the back of the lens, at shadow, but very close to the lens border.
Table 5. Summary of tests performed with concentrated natural sunlight.
Lens TypeType of Support and MaskIrradiation Power (W)Irradiation Time (min)Maximum Temperature 1 (°C)Comment
DB100A, 1 inch20060≈507No changes observed in the lens
DB250A, 1 inch25360≈577No changes observed in the lens
DS151A, 1 inch20260≈537No changes observed in the lens
CB100A, 2 inch31460≈241No changes observed in the lens
1 Measured by thermocouples located in the back of the lens, at shadow, but very close to the lens border.
Publisher’s Note: MDPI stays neutral with regard to jurisdictional claims in published maps and institutional affiliations.

