Article

Polyphenol Rich Sugarcane Extract Reduces Body Weight in C57/BL6J Mice Fed a High Fat, High Carbohydrate Diet

1
TPM Bioactives Division, The Product Makers Pty. Ltd., Melbourne 3173, Australia
2
School of Life Sciences, La Trobe University, Melbourne 3086, Australia
3
Synfinity Bio Pty. Ltd., Glen Waverley, Melbourne 3150, Australia
4
Counselling and Wellness, New York University Sydney, Sydney 2000, Australia
5
Department of Psychology, University of New South Wales, Sydney 2052, Australia
6
Monash Institute of Medical Engineering, Monash University, Melbourne 3800, Australia
7
Xerion Limited, Brighton, Melbourne 3186, Australia
*
Author to whom correspondence should be addressed.
Current address: The Product Makers, 50-60 Popes Road, Keysborough, Melbourne 3173, Australia.
Appl. Sci. 2021, 11(11), 5163; https://doi.org/10.3390/app11115163
Submission received: 9 April 2021 / Revised: 26 May 2021 / Accepted: 26 May 2021 / Published: 2 June 2021
(This article belongs to the Special Issue Functional Food and Chronic Disease)

Abstract

:
Background: Energy-dense diets have been implicated as a driving force in the global obesity crisis. Sucrose derived from sugar cane (Saccharum officinarum) is a carbohydrate source at the centre of this discussion. However, sugar cane is a complex plant containing a wide variety of phytochemicals that may have anti-obesity properties. The objective of this study was to assess if polyphenols extracted from sugar cane were capable of mitigating the progression of diet-induced obesity. Methods: Forty-five male, six-week-old C57BL/6J mice were divided into groups of 15 and fed a high-fat, high-carbohydrate diet supplemented with 0%, 2% or 4% polyphenol-rich sugarcane extract (PRSE) for twelve weeks. Body weight, food intake, water intake and faecal content were measured in addition to dual energy x-ray absorptiometry (DEXA) of the mice. Gene expression was also assessed for a range of key metabolic pathways in both blood and tissue samples in order to determine PRSE’s potential mechanisms of action. Data was analysed using ANOVA and post-hoc statistical methods. Results: Mice fed 4% PRSE were found to have a significantly lower overall bodyweight and adipose tissue accumulation compared to control (0%). This finding was supported by a reduced plasma leptin concentration and an increased excretion of carbohydrates. Upregulated gene transcriptions of adiponectin, PPARγ, PPARα, UCP2 and fatty acid synthase mRNAs were also observed. Conclusions: These results indicate that reduced carbohydrate absorption is the primary mechanism leading to the reduction of body weight in mice fed a high-fat, high-carbohydrate diet. This is predominately supported by the detection of increased carbohydrate concentration in the faeces of mice that lost weight. Other potential mechanisms, such as feed intake and energy expenditure, did not show significant differences between groups and are less likely to be involved.

1. Introduction

Obesity presents an urgent public health challenge. Whilst obesity is a multi-factorial disease, increased access to energy-dense food is an often-cited factor. However, this type of food is now an integral part of the modern food supply chain across the entire socio-economic spectrum. Therefore, additional strategies to reduce the negative effects of high-carbohydrate and high-fat diets are required.
Polyphenols are plant-derived compounds linked to a variety of health outcomes including weight loss. A number of anti-obesity pathways have been identified which may have a positive influence on weight loss and health [1]. These compounds are abundant in plants and can be safely added to food. Plant-derived compounds from cranberries [2], coffee [3], green tea, [4,5] and cocoa [6], amongst others, have been observed to have an effect against obesity.
The purpose of this study is to understand the effect of polyphenols derived from sugarcane on weight loss. This may seem like a paradoxical botanical source to explore for anti-obesity compounds, due to the notoriety sugar has received for its role in global obesity rates. However, sugarcane polyphenols are quite well characterized in terms of composition [7,8,9,10] and many of these individual compounds have demonstrated anti-obesity effects, as previously reported [11,12,13,14]. It is a globally abundant crop that if shown to be effective against obesity could have a rapid effect on this condition.
Previous studies involving the feeding of sugarcane plant extracts to rodent models indicated the presence of factors in sugarcane that may have anti-obesity effects. An early study on “the non-sugar fraction of crude black sugar” showed positive effects on both carbohydrate and lipid metabolism of rats [15,16]. From this study, specific glucosides were isolated from sugarcane using a detailed extraction regime including methanol, water and charcoal chromatography. These compounds were capable of inhibiting insulin and fructose concentration and reduced the absorption of glucose in the intestine.
The methods outlined by Kimura et al. [15,16], whilst effective at a laboratory scale, are not scalable for industrial and food grade purposes. We have previously reported a food-grade polyphenol-rich sugarcane extract (PRSE) that has distinct regulatory functions on pathways involved in carbohydrate metabolism [17]. It was hypothesised that PRSE may have anti-obesity properties. To explore this hypothesis we measured weight loss, feed intake, energy expenditure, mRNA gene expression, glucose tolerance, leptin and adiponectin concentrations. We demonstrated that 12-weeks supplementation at 4% PRSE is sufficient to induce a significant decrease in body weight. This weight loss appeared to be mediated by a combination of factors including reduction in carbohydrate absorption, feed digestibility and upregulation of a number of metabolic pathways.

2. Materials and Methods

2.1. Preparation of PRSE

PRSE was prepared as described previously [17]. Briefly, sugarcane molasses was diluted 1:4 with water and then centrifuged to remove particulate impurities. The supernatant underwent batch chromatography using the hydrophobic adsorption resin Amberlite XAD 16HP N resins (Rohm and Hass, Philadelphia, PA, USA). The final product was eluted with 70% ethanol and freeze-dried. The chemical composition of the commercially available PRSE extract has been described previously [17]. It was reported that the total polyphenol content of PRSE is 221 mg/GAE/g [17]. Three specific polyphenol compounds have also been quantified in this extract including Apigenin (1.89 µg/g), Luteolin (5.30 µg/g) and Tricin 27.4 (µg/g).

2.2. Animals and Housing

Six-week-old male C57Bl/6J mice (n = 45; Animal Resources Centre, Perth W.A., Australia), a strain of mouse known to be prone to diet-induced obesity, were used in the study [18]. The animals were housed individually at 22 ± 3 °C, and were subjected to a 12:12 h light/dark cycle beginning at 8:00 am.
The mice were assigned to one of three dietary conditions (n = 15 per group) based on the basal diet (Supplementary material Table S1) [19] (20% fat, 20% protein, 50% carbohydrate) (Glen Forrest Stock feeders, W.A., Australia). 2 or 4% of PRSE was substituted (w/w) for 2 or 4% of the basal diet.
The animals were placed on the experimental diets for 10 weeks (Figure 1). Food and water were provided ad libitum and intake of both were measured daily. Body weight was measured bi-weekly for 10 weeks. The trial continued for 2 extra weeks beyond the initial 10 week phase of the trial. These 2 weeks were treated as a separate phase of the trial as the diet from this time onwards was altered due to the contribution of the glucose tolerance tests to the daily energy intake of the mice. However, the additional 2 weeks continued with the same experimental design used in the first 10 weeks of the trial.
The trial was approved by the La Trobe University Animal Ethics Committee (AEC09-46-P) and complied with The Australian Code for the Care and Use of Animals for Scientific Purposes and all other relevant legislation.

2.3. Measurement of Energy Expenditure and Activity

Indirect calorimetry and locomotor activity assessment was performed at the end of the first week on the experimental diets. Mice were placed in the calorimetry cages for 48 h; the first 24 h for acclimation, and data were measured during the second 24 h. A custom built, four-cage, open-circuit calorimetry feeding system also fitted with the InfraMOT activity measurement system was used (Lab Master, TSE systems, Kansas City, MO, USA).

2.4. Measurement of Digestibility by Bomb Calorimetry of Feed and Faeces

Digestibility was determined during the 8th week. Food intake and faecal output were determined over a 7-day period. A sample of the diet and faecal output were dried at 83 °C for 48 h. These samples were used for faecal lipid, carbon and nitrogen analysis. Each sample was ground into a powder using a homogeniser and pressed into a pellet (~0.6 g). The sample was then arranged inside a bomb (Model 1108 oxygen bomb, Parr Instruments, Moline, IL, USA), with 1ml of water, which was flushed of atmospheric nitrogen and refilled with oxygen. Prior to commencement of bombing procedure, the calorimeter was calibrated using a benzoic acid standard. The calorimeter (Model 1261 Parr Instruments, Moline, IL, USA) was filled with two litres of deionised water, and the bomb was gently lowered inside, ensuring that prior to submersion the ignition wires were inserted into the two terminal sockets on the bomb head. The temperature measurement took place directly in the bomb and caloric value was calculated from the heat released during the combustion process. This energy value was calculated in MJ/kg.

2.5. Measurement of Faecal Lipid, Carbon and Nitrogen by Elemental Analyser Method

Faecal lipid content was determined by mixing 100 mg of ground faeces with 4 mL of chloroform/methanol (2:1) and incubating at 600 °C for 30 min. The samples were passed through a Whatman No.1 filter (Sigma-Aldrich Pty. Ltd., Castle Hill, NSW, Australia) and placed under a fume hood to allow solvent evaporation.
Carbon (C) and Nitrogen (N) analysis was carried out from dried homogenized faeces powder. The faecal C and N contents were analysed using the vario EL III CHNOS elemental analyzer (Elementar Analysensysteme GmbH, Donaustraße, Germany). Approximately 20 mg homogenized samples were used. The samples were combusted and CO2 was retarded in an adsorption trap. N2 was then measured directly in the thermal conductivity detector. After the N-measurement, the CO2 was thermally desorbed and measured.

2.6. Measurement of Glycaemic Response by the Glucose Tolerance Test Method

A glucose tolerance test was performed at week 10. The mice were fasted overnight with ad libitum access to water. The following morning a pretreatment blood sample (~5 μL) was collected from the tail and a glucose solution (1 g/kg body weight) was administered by intraperitoneal injection. Blood glucose concentration was measured from samples collected prior to and at 30, 60, 90 and 120 min after injection. The blood glucose concentration was measured with a HemoCue AB glucose analyzer (Hemocue 201+, Medipac Scientific, Sydney, NSW, Australia). Area under the curve (AUC) was calculated using Sigmaplot 9.0 (San Jose, CA, USA).

2.7. Measurement of Body Composition by Dual Energy X-ray Absorptiometry (DEXA) Method

At the conclusion of the trial, in vivo body composition was assessed using dual energy X-ray absorptiometry (DEXA) (Norland pDEXA Sabre; Norland Medical Systems, White Plains, NY, USA). Prior to scanning, the mice were anaesthetized with Ketamine (61 mg/kg; Apex Laboratories, Australia)/Xylazine (9 mg/kg; Bayer, Germany) and were placed in the prone position on the DEXA table, with their tail secured by tape.

2.8. Post Mortem and Tissue Collection

At the end of the treatment period, 33 mice (n = 11/group) were anaesthetized using Ketamine and Xylazine (doses as above). A blood sample (~1 mL) was collected by direct cardiac puncture into an EDTA-treated syringe (20 μL of 0.134 M EDTA solution). The blood samples were centrifuged at 4543× g for 15 min, and plasma was separated and frozen (−80 °C) until further analysis. Epididymal fat was dissected and stored in RNAlater (Sigma-Aldrich, Sydney, Australia) for future genetic analysis.

2.9. Measurement of Adipocyte Hormones in Plasma by ELISA

The concentration of leptin and adiponectin present in the plasma was quantified using a mouse leptin or adiponectin enzyme-linked immunosorbent assay (ELISA) kit (Millipore, Billerica, MA, USA), respectively.

2.10. Analysis of mRNA Expression by RT-PCR

Total RNA was extracted from ~100 mg of adipose tissue using Tri-reagent (PE Applied Biosystems, CA, USA). Nanodrop 1000 (Thermo Fisher Scientific Inc., MA, USA) was used to determine the purity of RNA and the ratio (A260/A280) values were close to 2.0. cDNA was synthesized by the High Capacity cDNA Reverse Transcription Kit (PE Applied Biosystems, CA, USA) using 0.5 µg of adipose tissue RNA in a total of 20 µL of reaction volume. Reverse transcription was performed by incubating the samples at 25 °C for 10 min, 37 °C for 120 min, and 85 °C for 5 s followed by 4 °C for 30 s. RT-PCR amplification was performed using 1 µL of cDNA diluted at 1:10 using gene-specific primer sets (GeneWorks Pty Ltd., SA, Australia).
Each primer set was used at a concentration of 3.75 μM in a final volume of 25 µL using the Brilliant® II SYBR® Green QRT-PCR Master Mix Kit, 1-Step (Agilent Technologies, Inc., CA, USA). Real-time PCR was performed using the MX3000P qPCR machine (Agilent Technologies, Inc., CA, USA) where target expression was normalized to the amount of endogenous control (beta actin) relative to CON value, given by ΔΔCT method.

2.11. Statistical Analysis

A two-way analysis of variance (ANOVA), with repeated measures on one factor, (Statistica, Statsoft, Tulsa, OK, USA) was used to analyze body weight, food and water consumption between each group. DEXA and calorimetry data were analysed using a one-way ANOVA. Results from the ELISA assays were analyzed via univariate ANOVA’s. Sigmaplot 9.0 (San Jose, CA, USA) was utilized to calculate the area under the curve of the glucose tolerance test. This was conducted using the trapezoidal rule and was followed by a one-way ANOVA to assess group differences. Post-hoc Fisher PLSD tests were conducted where appropriate. All results are presented as mean ± SEM. p < 0.05 was considered significant.

3. Results

3.1. Effect of PRSE on Body Weight, Food Intake and Water Intake

Mice fed PRSE at either 2% or 4% had a lower mean weight from week 1 onwards (Figure 2A). At 4 weeks the control mice had significantly higher body weights than both the 2% and 4% PRSE. Fluctuations in food intake also did not show significant differences to the control diet (Figure 2B).
Water intake was significantly higher for the 4% PRSE treatment than the control at weeks 2, 3, 4, 5, 7, 8, 9, 10 (Figure 2C). 2% PRSE was significantly higher than the control at weeks 4, 8, 9 and 10. At week 12 the body weight of 4% PRSE was significantly lower than the control groups (Figure 2A).

3.2. Glucose Tolerance

The fasting blood glucose level of both PRSE treatments was lower than the control group (Figure 2D). In addition to analysis of the fasting values, response to a glucose challenge was also measured as an indication of insulin sensitivity.
The mean area under the curve was lower for both the 2% and 4% PRSE treatment conditions. However, a significant difference was not observed between either treatment groups or in comparison to the control.

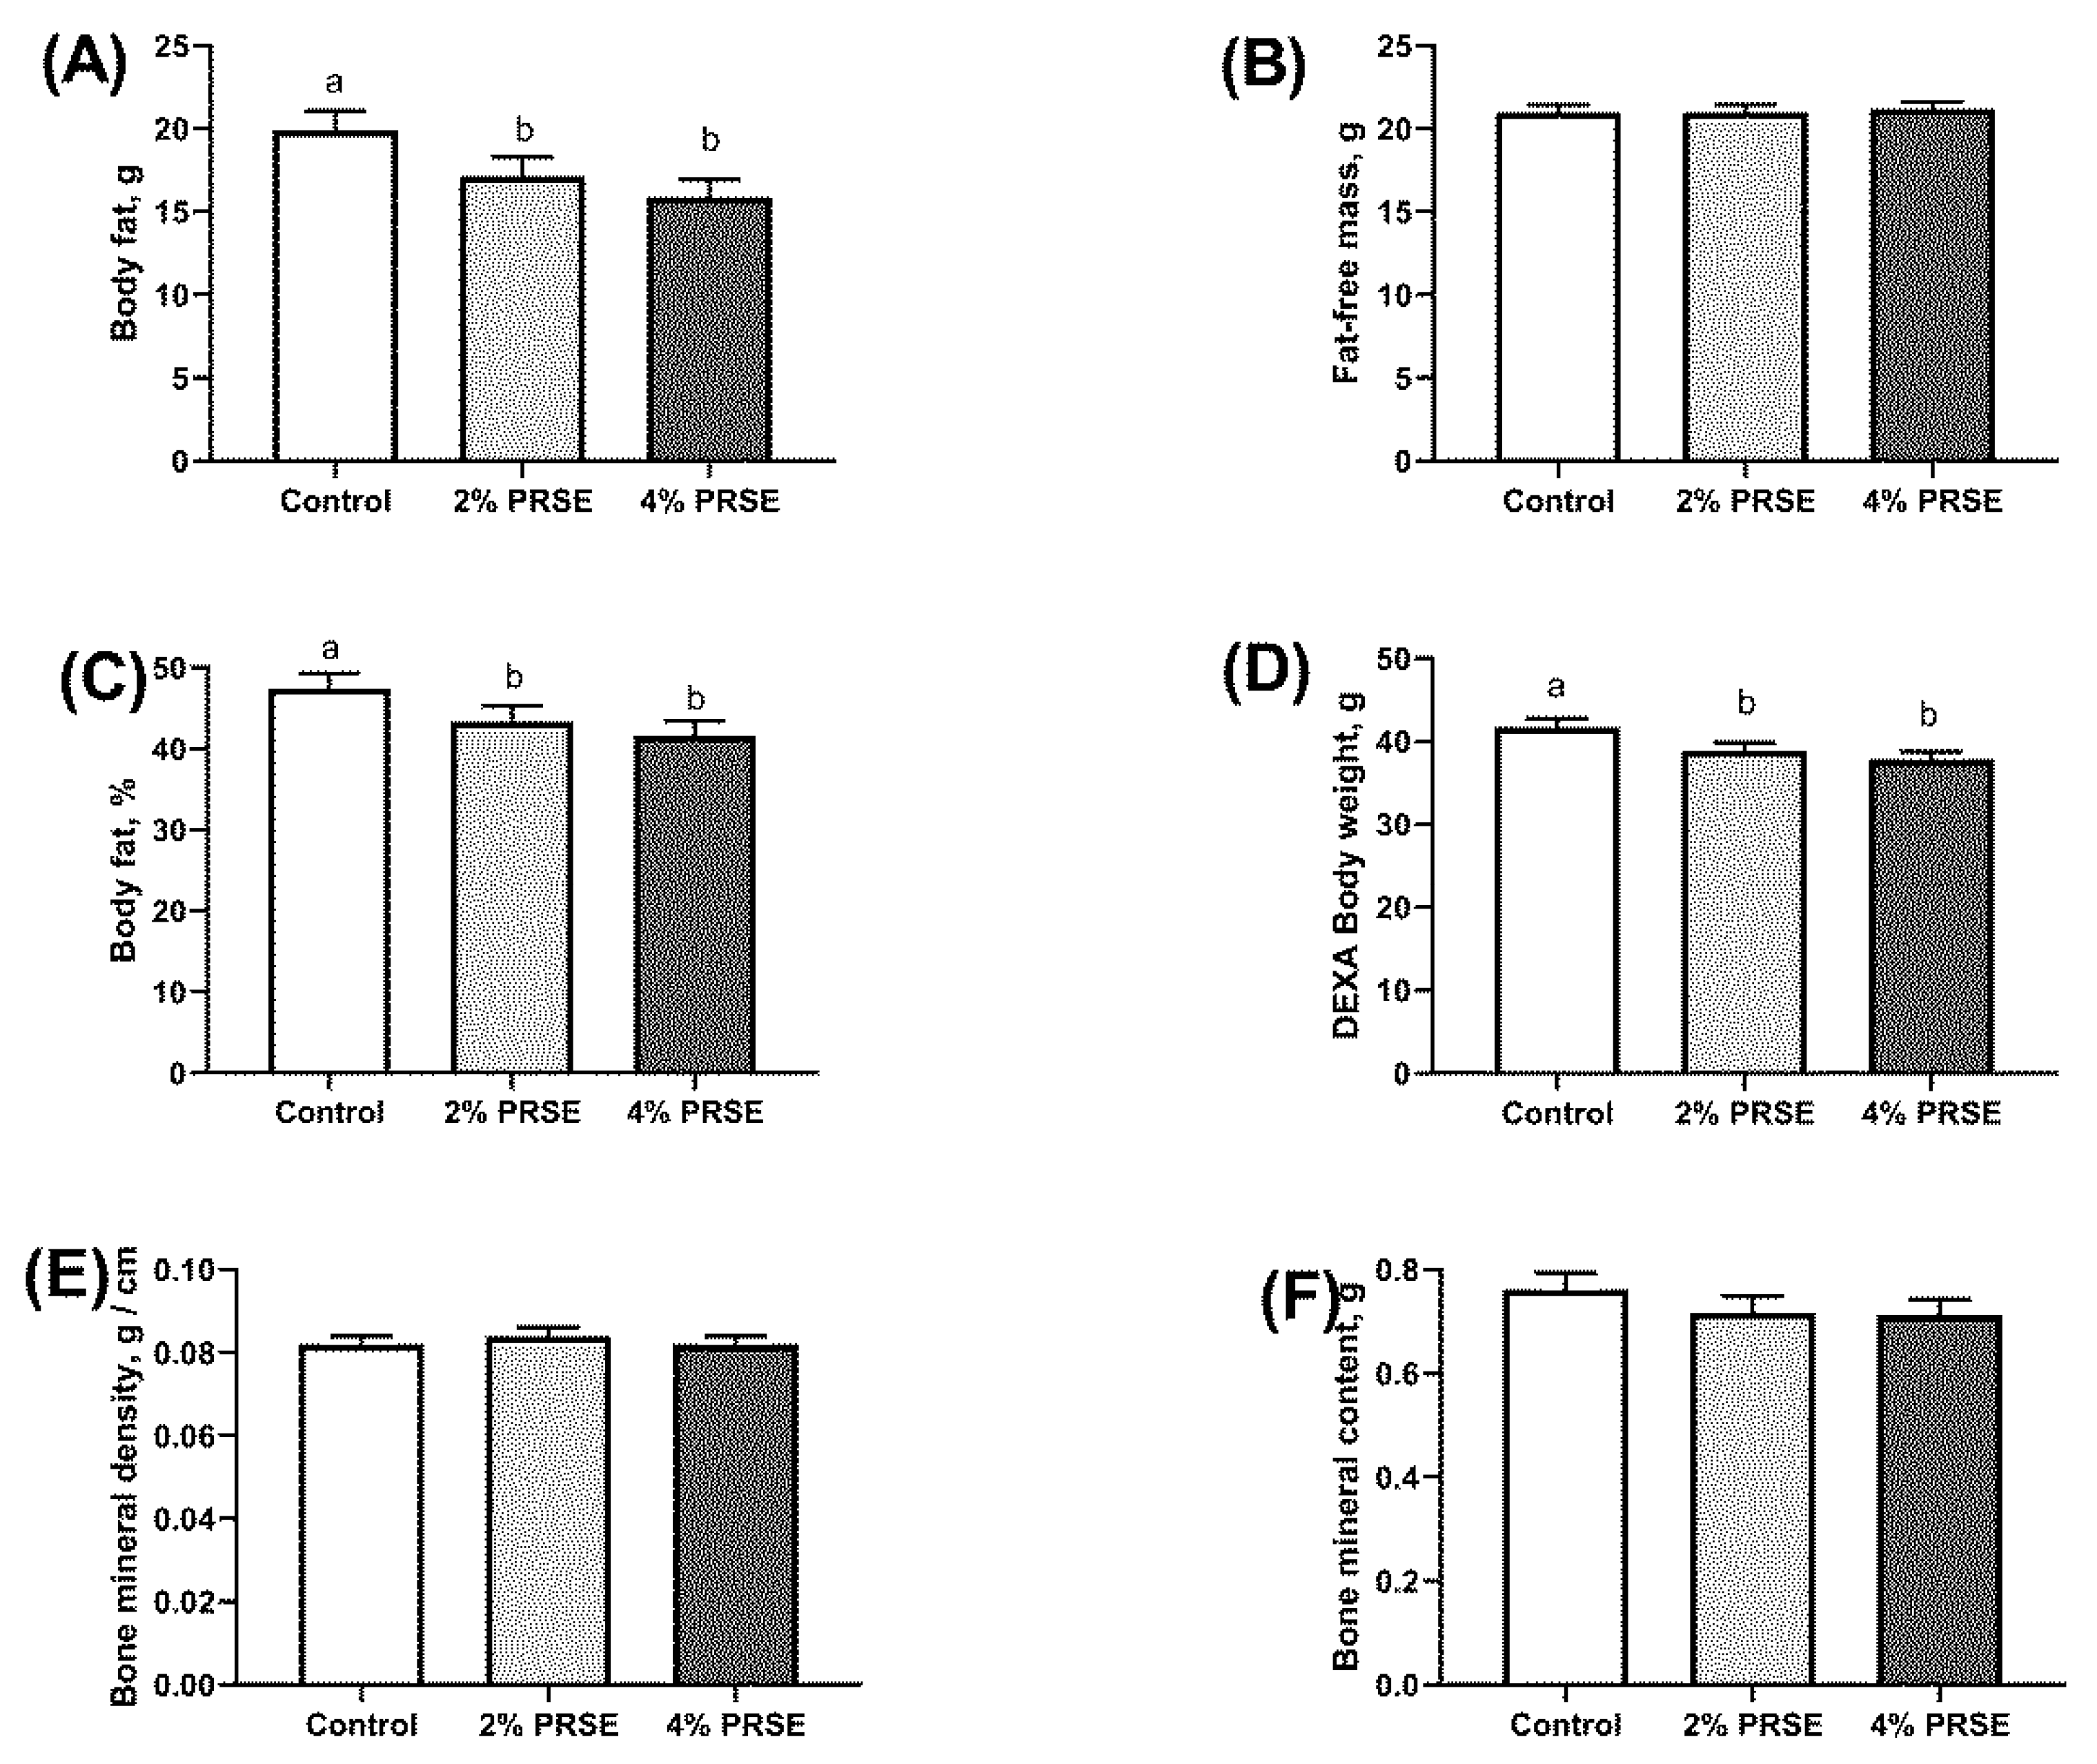
3.3. Dual Energy X-ray Absorptiometry (DEXA) Analysis of Body Composition

At 10 weeks the body weight of mice fed the 4% treatment was significantly lower (Figure 3D,G). From this weight, both the mean differences in fat mass and body fat percentage were also significantly different (p < 0.01). Other measures such as the fat-free mass percentage and bone mineral density and content did not show significant differences.

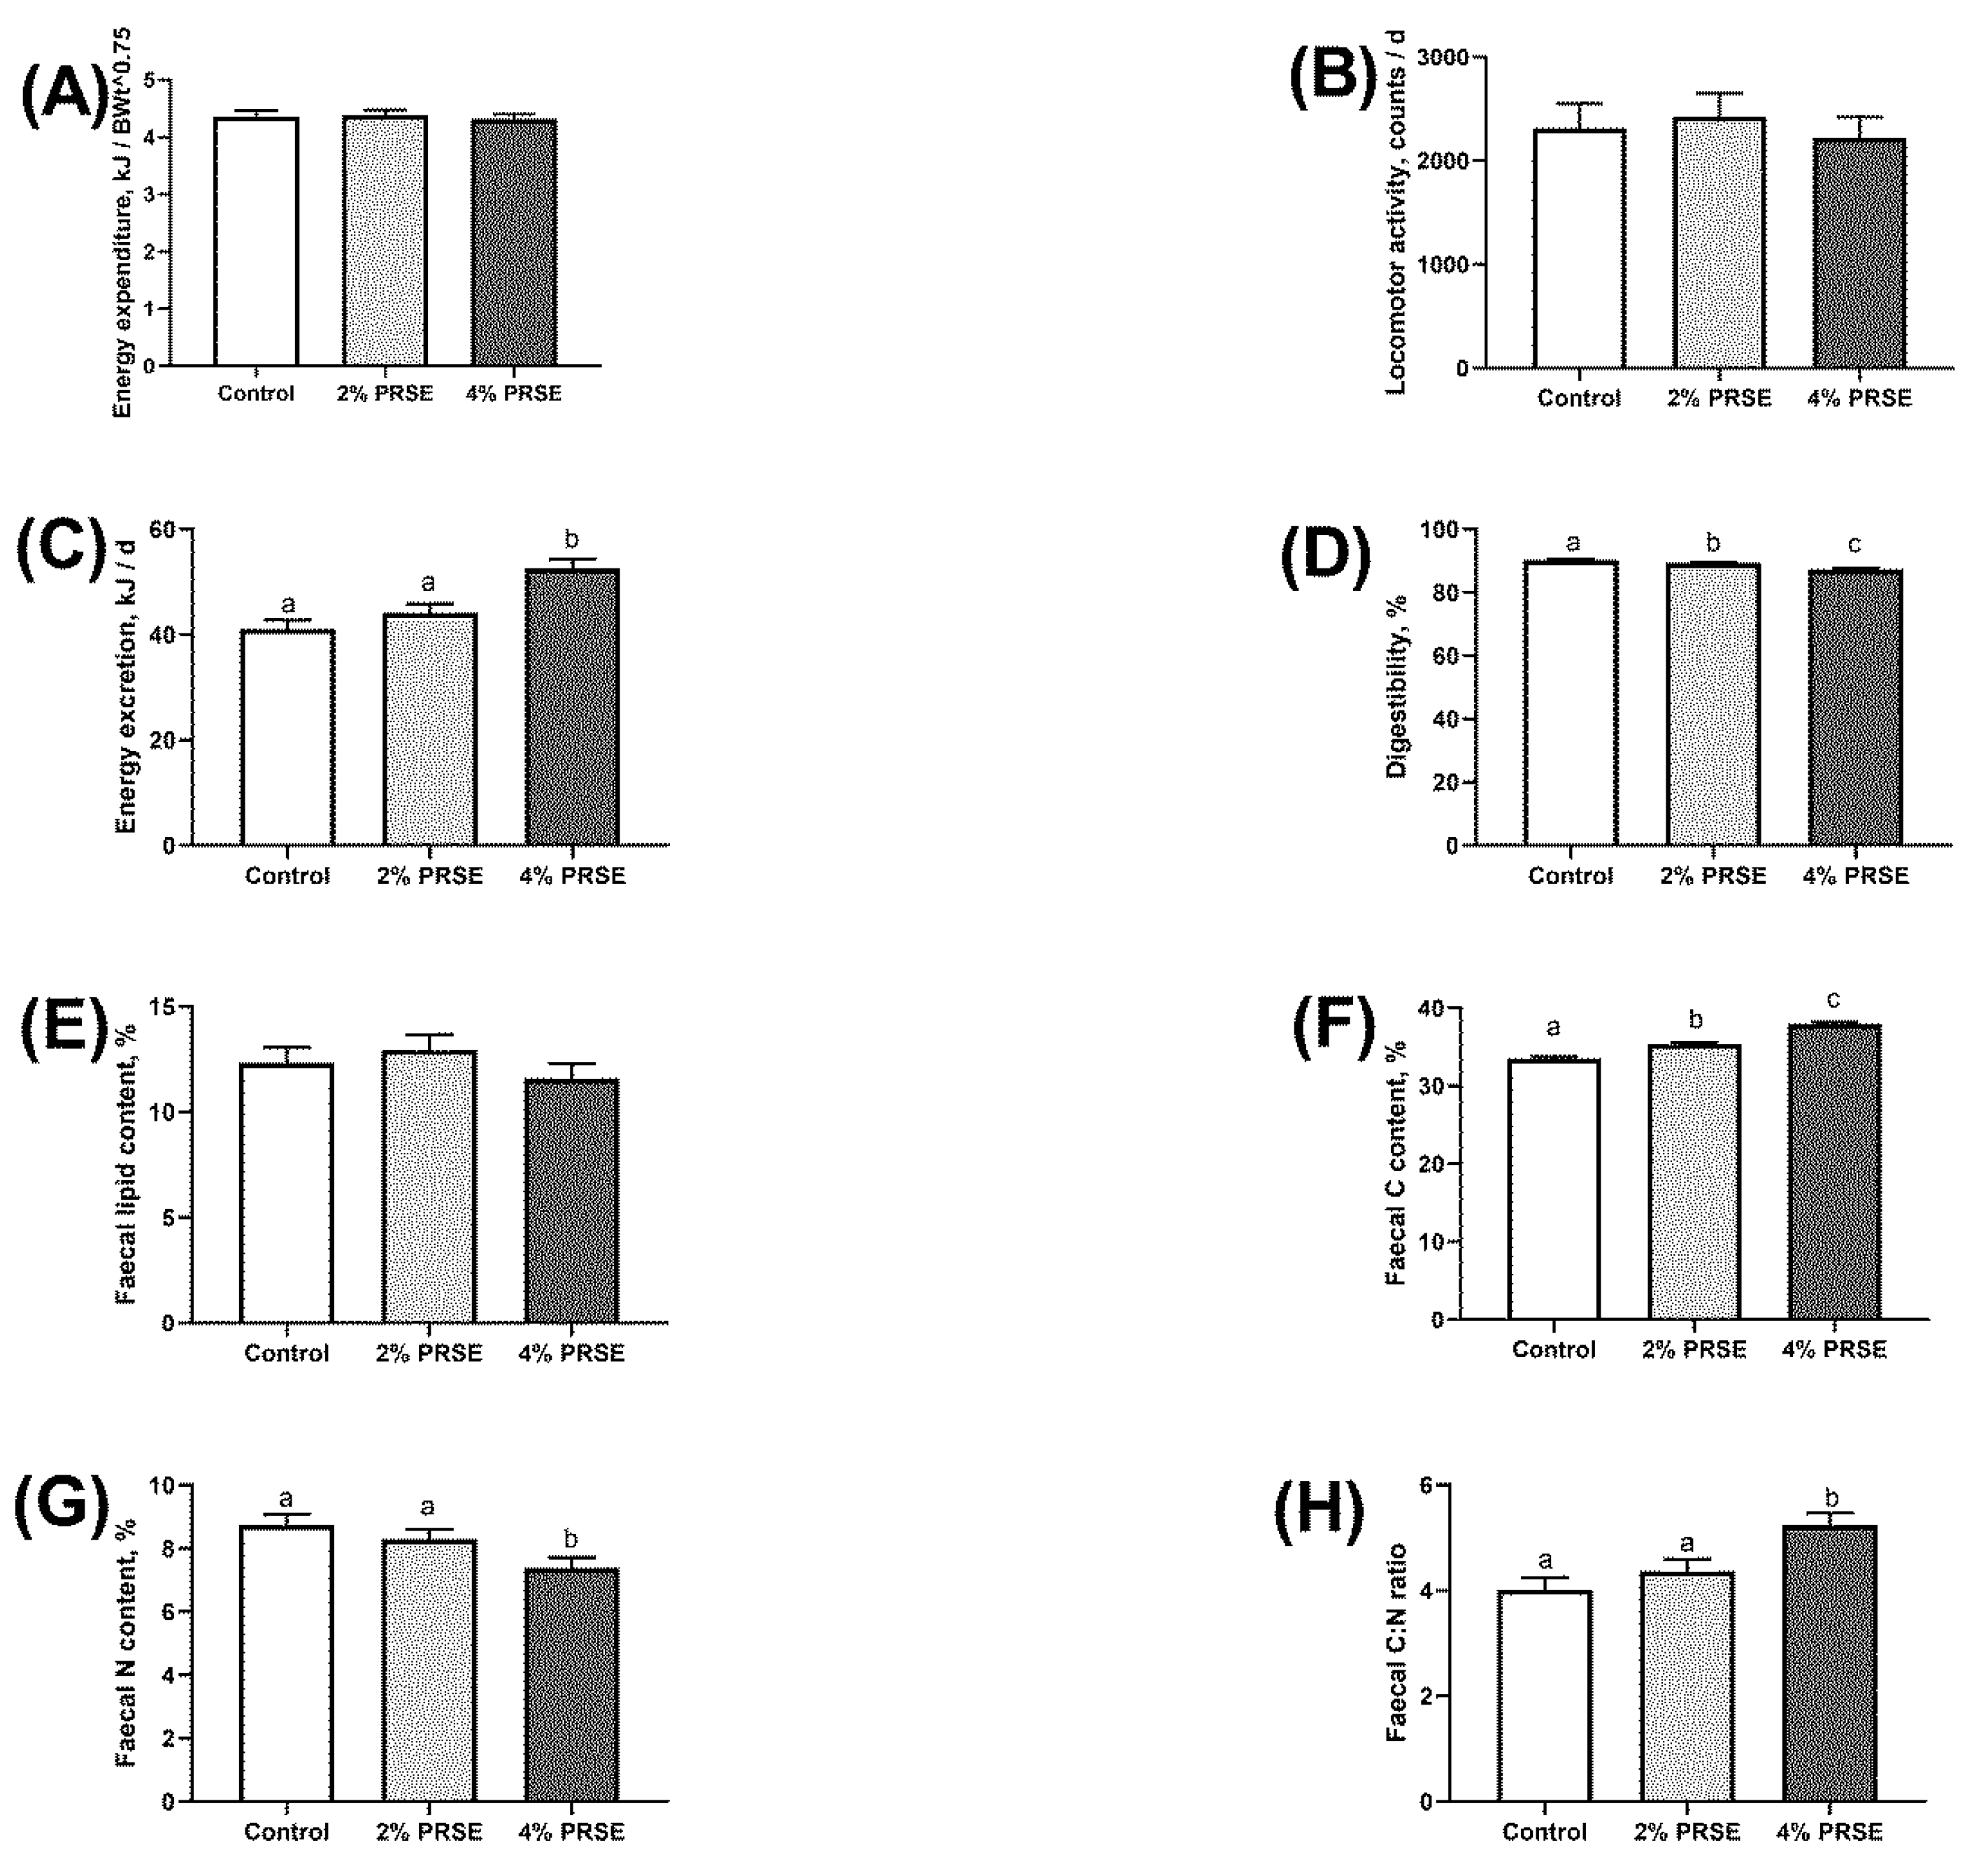
3.4. Energy Expenditure

There was a significant increase (p < 0.001) in the energy excreted in the faeces of the treatment group that received 4% PRSE when compared to the control (Figure 4C). When the total energy intake is taken into account to calculate digestibility both the 2% and 4% treatment groups showed a significant decrease in digestibility (Figure 4D). However, faecal carbon content was significantly higher (p < 0.001) in both 2% and 4% PRSE (Figure 4F). In terms of nitrogen excretion (Figure 4G) only the 4% PRSE treatment was significantly lower than the control (p < 0.05).
The significant differences in both the carbon and nitrogen excretion for 4% PRSE were associated with a significant difference also observed in the carbon-nitrogen ratio of the 4% PRSE treatment (Figure 4H).

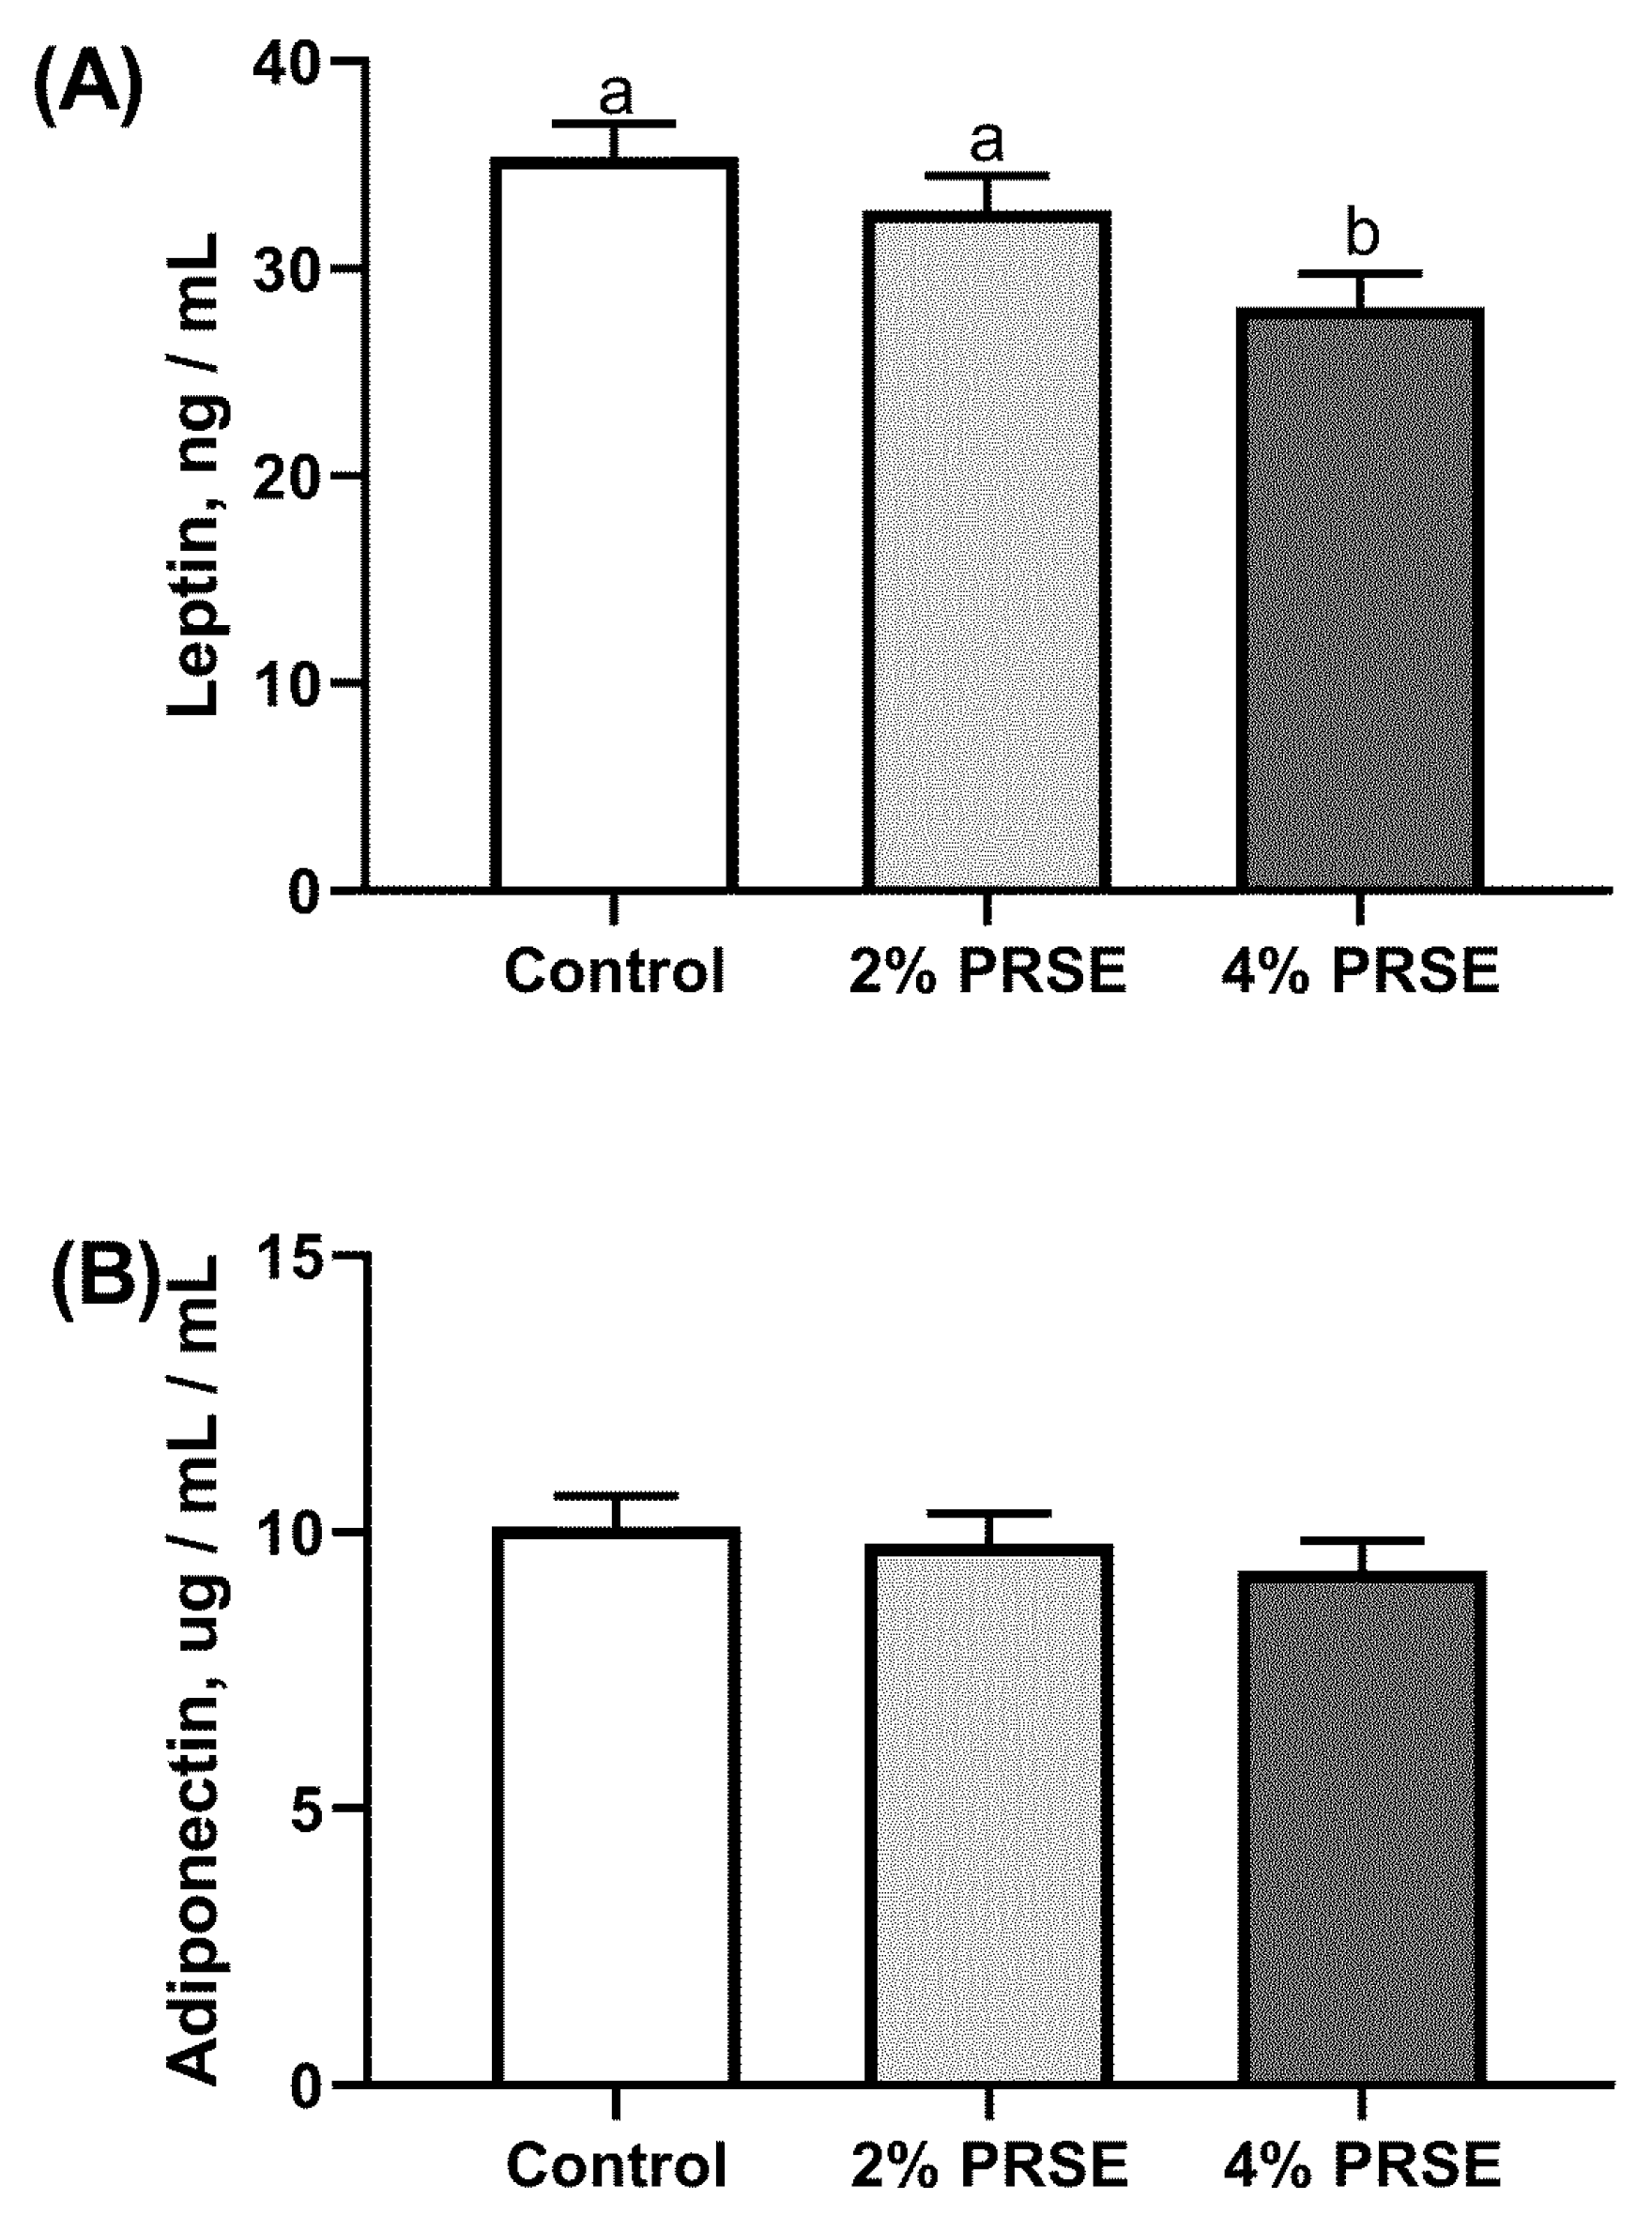
3.5. Plasma Hormone Levels

The 2% PRSE group returned lower leptin levels in plasma than the control (Figure 5A). However, this did not reach a statistically significant reduction. The 4% PRSE dosage had a mean leptin level significantly lower than control (p < 0.01). There was a downward trend in adiponectin plasma levels with increasing PRSE dosages, however no significant differences were detected.

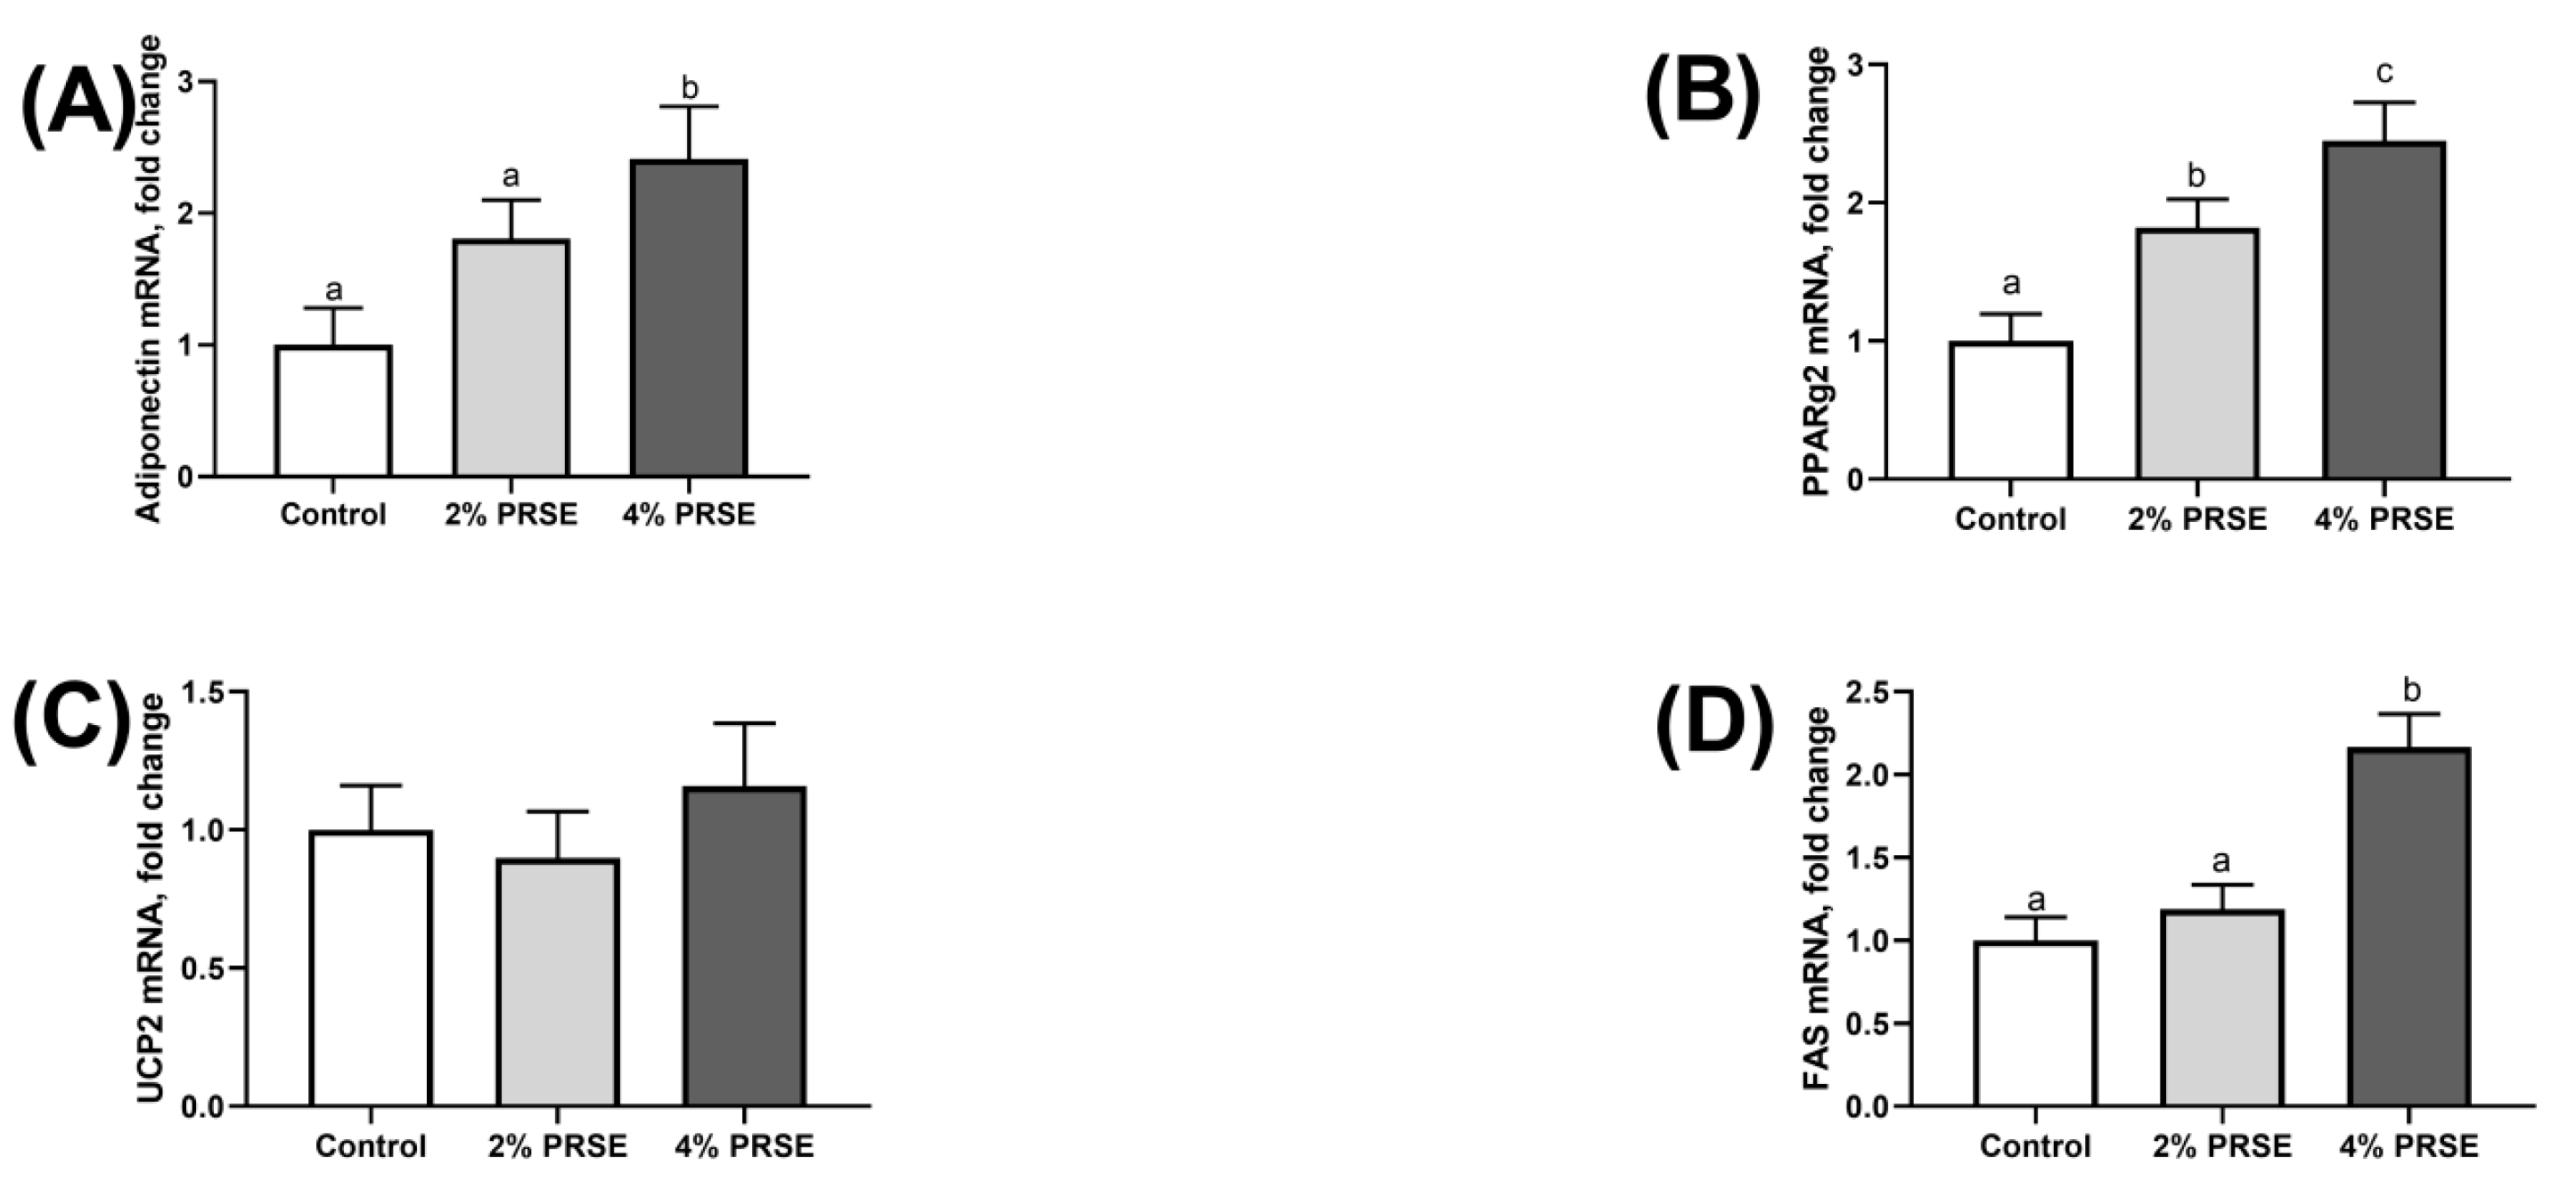
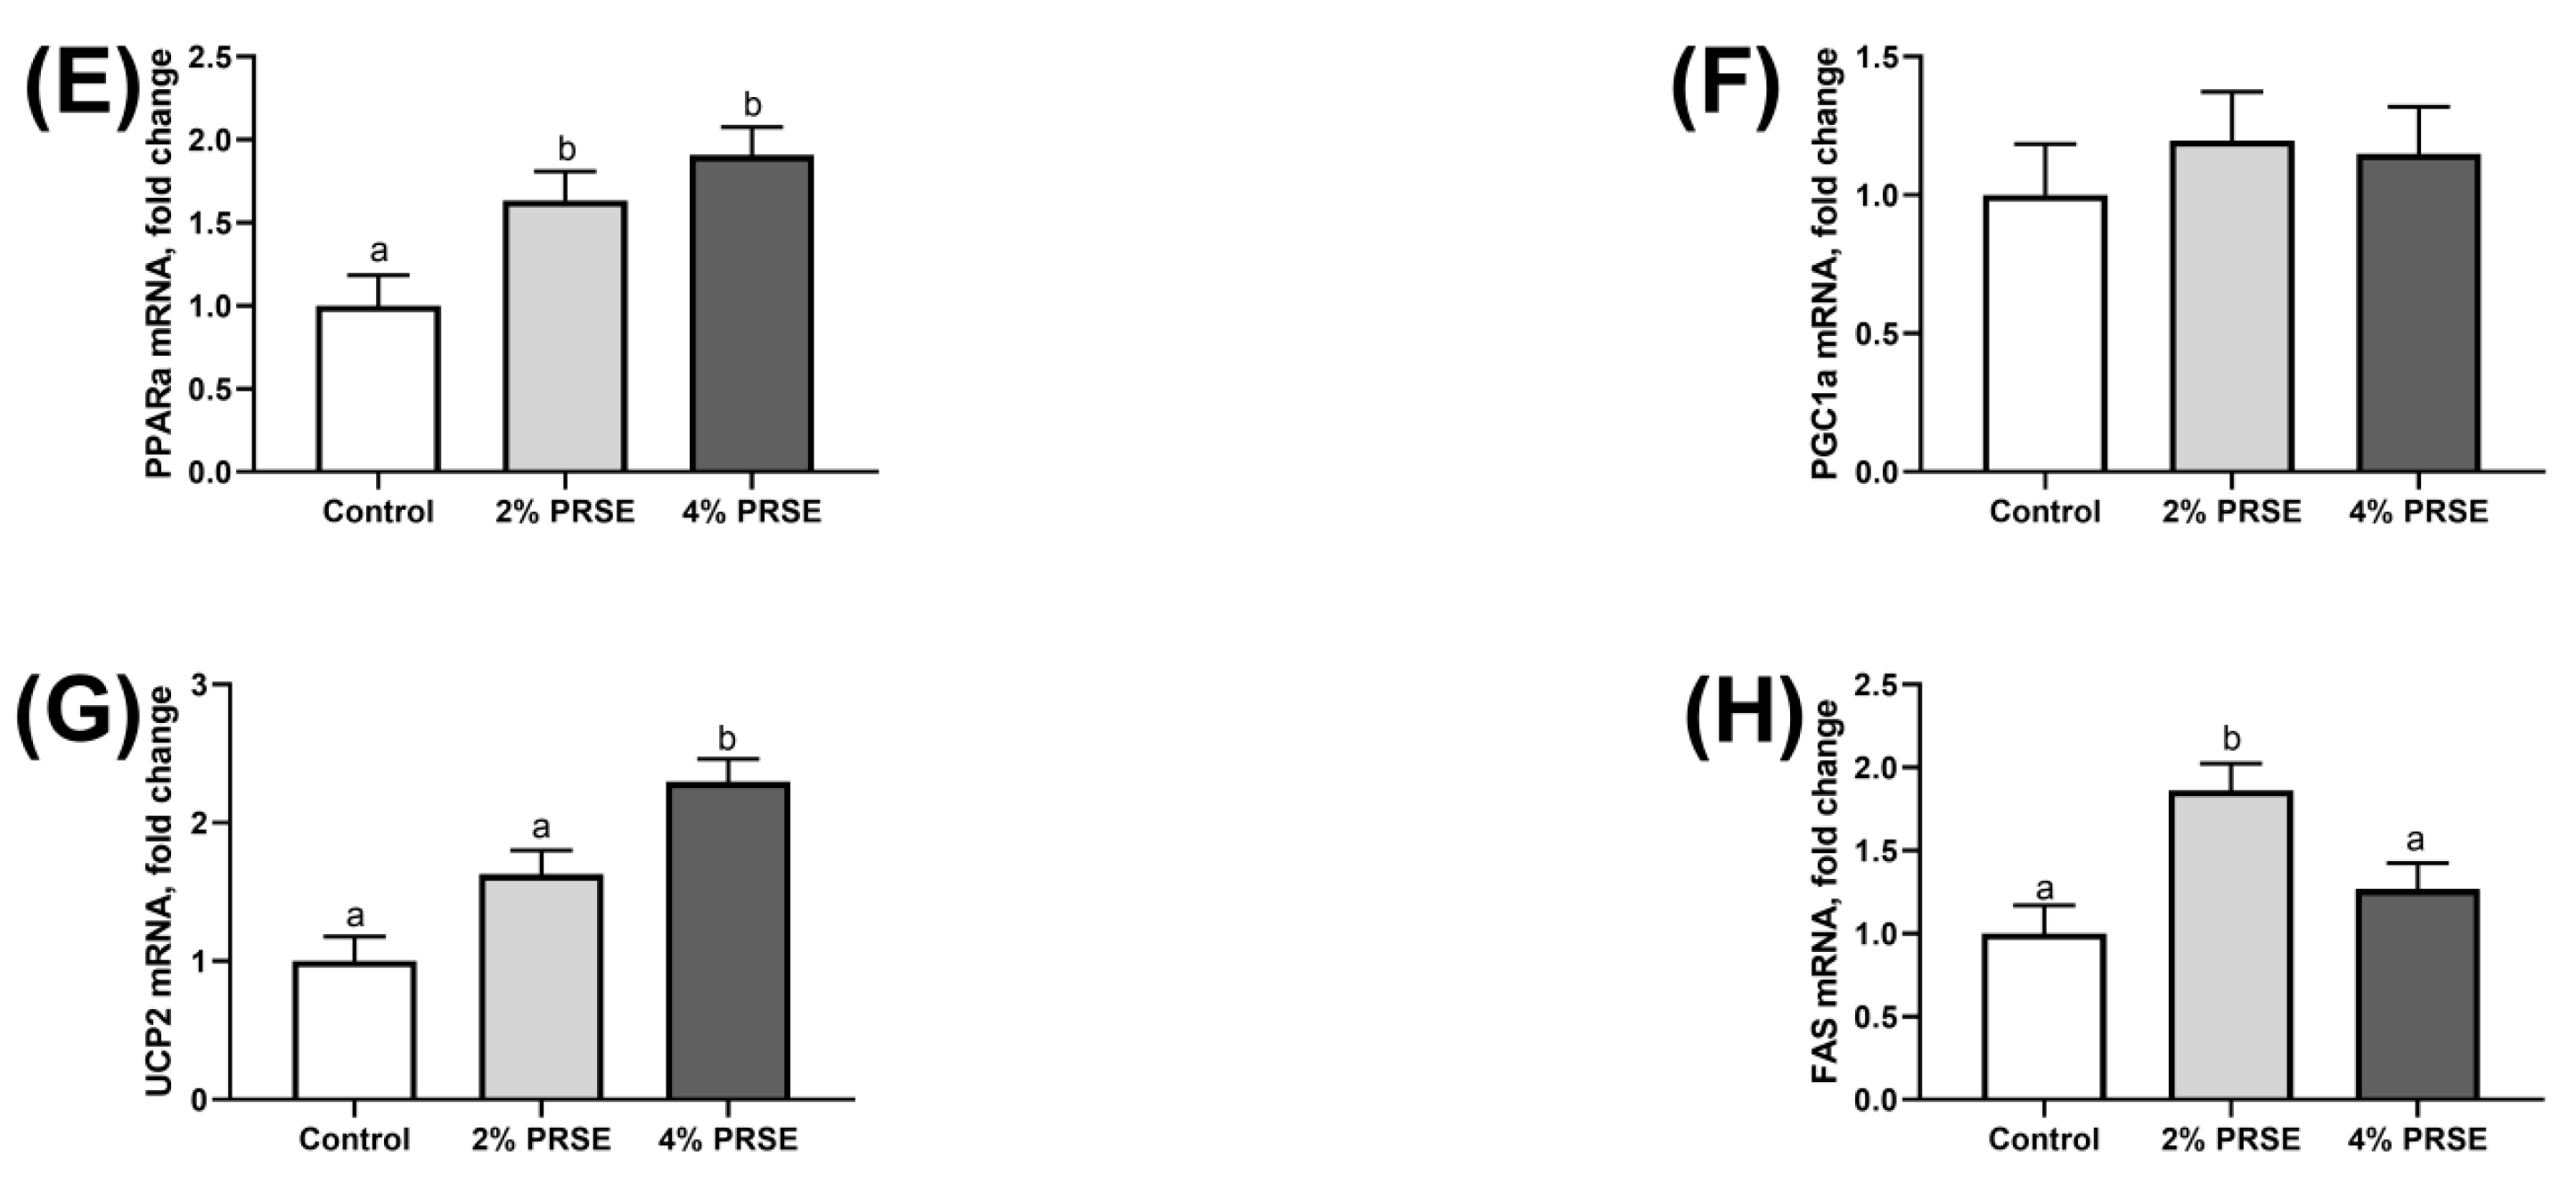
3.6. mRNA Expression

Adiponectin mRNA expression was significantly upregulated in the adipose tissue of both the 2% and 4% compared to the control group (Figure 6A). PPARγ mRNA was also found to be significantly upregulated in the adipose tissue of both the 2% and 4% PRSE treatment groups (Figure 6B). PPARα transcripts were significantly upregulated in the liver at both 2% and 4% (Figure 6E). Fatty acid synthase mRNA expression in adipose tissue was also significantly upregulated in the 4% PRSE group (Figure 6D), but in the liver only the 2% PRSE had a statistically significant fold change (Figure 6H)). Liver expression of Fatty Acid Synthase was significantly upregulated at 2% PRSE (Figure 6G). UCP2 expression was significantly upregulated at 4% in the liver (Figure 6H), but not in adipose tissue (Figure 6E).

4. Discussion

The results of this trial suggest that compounds present in sugarcane possess anti-obesity properties. Due to the negative attention that sugar has received as a factor in the development of obesity, these may be considered surprising findings [20]. However, there is growing scientific evidence indicating a potential ability of other compounds present in sugarcane, such as polyphenols, that may assist in the metabolism of sugars [17,21,22]. It was hypothesized that the effects these compounds have on metabolic pathways may have implications for obesity and weight control. However, this study is the first report of weight loss in an animal model to be correlated with the presence of sugarcane-derived polyphenols. Furthermore, the data collected in this trial provides useful insight into the potential mechanisms driving the observed anti-obesity effects.
The weight reduction does not appear to be mediated by a reduction in food intake. Based on food intake there were no significant differences between the control and PRSE treatments. This is an important finding, as it suggests that the reduction in body weight is not due to a difference in food palatability or increased sensations of satiety that result in a simple reduction in calorie intake.
There were significant differences in water intake over the course of the trial and it is difficult to hypothesize what may have caused this result. Other studies into the effect of natural products that reported decreases in body weight using rodent obesity models have reported either no change to water intake [23] or reduction [24]. It therefore appears that the increased water intake observed in this trial is not required for anti-obesity effects across all plant extracts. It may however be an indicator of a secondary benefit not targeted in this trial. For example, a study on ginger polyphenols showed an improvement in rat kidney function correlated with increased water intake [25]. These same conclusions cannot be made from the data in the present study into sugarcane polyphenols, but further work into this area may be justified.
The anti-obesity effects of PRSE do not appear to be mediated by changes to the metabolic rate or an increase in activity. One of the mechanisms of the weight loss appears to be an interference with nutrient absorption or feed digestibility. This is observed clearly in the increased excretion of energy and carbon in the faeces and reduced digestibility of feed. The increased energy in the faeces is an indicator that more carbohydrates are being stored in the body of mice fed the control diet. There is in vitro evidence that phenolics extracted from sugarcane are capable of inhibiting enzymes in carbohydrate metabolism such as α-glucosidase and α-amylase [26,27]. Previously, we have demonstrated that PRSE is able to inhibit glucose and fructose uptake in cell culture conditions also [17]. However, the data shown in the present study of the shift in faecal carbon content is the strongest evidence to date that these sugarcane-derived compounds have a direct action on carbohydrate metabolism in vivo and that one aspect of the weight loss effect may be attributed to the inhibition of carbohydrate uptake.
It is interesting that no significant differences were observed in the glucose tolerance test, given the significant differences in carbohydrates excreted. However, only one test was given at 10 weeks. It would be worthwhile assessing whether there were significant differences in glucose tolerance at different stages. Given the previous evidence supporting the ability of PRSE to inhibit the uptake of glucose [17] it is also possible that the polyphenols assisted in mitigating the excessive storage of the energy provided to the diet by the glucose tolerance test at week 10.
Whilst leptin is a hormone involved in signaling satiety, detection of high leptin levels correlates with high-fat diets and obesity and therefore has become an indicator of the development of leptin resistance [28]. This hypothesis was supported in the present trial by the significantly higher leptin concentration detected in control mice, compared to the 4% PRSE treatment. Other studies on polyphenols in rodent models that reported reduced obesity have also been associated with similar leptin responses [29,30].
There were no significant differences detected in adiponectin levels in plasma. A similar study that observed weight loss in the presence of lemon polyphenols also found a significant decrease in plasma leptin, without significant differences to adiponectin levels [29]. Surprisingly, in our study the expression of adiponectin mRNA was significantly higher in both treatment groups compared to control, despite no differences observed in the plasma adiponectin hormone levels. Unfortunately, the lemon polyphenol study did not analyse adiponectin mRNA levels to see if the same trend occurred [29]. Whilst it is difficult to be certain why there is a discrepancy between the mRNA levels of adiponectin and the circulating levels of the hormone detected via ELISA, some insights into the physiological effect correlated with an elevated mRNA expression level can be made. Mice with genetically induced overexpression of adiponectin mRNA have been shown to be protected against both the acute and chronic damage caused by exposure to a high-fat diet [31]. It could therefore by hypothesized that upregulation of adiponectin by PRSE treatment may represent an increasing metabolic flexibility that, once activated by PRSE, is better equipped to respond to the challenge of the high-fat diet used in this trial. Alternatively, mRNA does not always correlate with protein adiponectin levels, therefore this discrepancy may be an example of this circumstance [32].
Adiponectin is known to activate PPAR1γ, which was also mirrored in this trial by the upregulation of the PPAR1γ mRNA in a dose-dependent manner to the adiponectin mRNA expression [33]. In contrast, other polyphenols such as compounds derived from green tea [34] and acacia [35] that have been observed to have anti-obesity properties have been suggested to be acting via the downregulation of PPAR1γ. However, other studies have reported weight loss that was attributed to the upregulation of PPAR1γ. A study on lemon verbena polyphenols observed anti-obesity effects induced by a PPAR1γ dependent mechanism [36]. It is likely that the anti-obesity effects of PRSE were also mediated by a similar mechanism. The authors [36] also hypothesized that protection of mitochondrial function, AMPK activation and anti-inflammatory effects were crucial components of the action of the anti-obesity effects of the lemon verbena polyphenols. Therefore, future studies into the underlying mechanisms of PRSE would benefit from the inclusion of these parameters to further understand the bioactivity of PRSE. Another study on peach and plum juice showed an increased PPAR1γ expression alongside polyphenol-induced weight loss [37]. These authors suggested this activation of PPAR1γ via dietary polyphenols as an aspect of the mechanism of action [37]. However, it is surprising that the increased PPAR1γ observed did not lead to an increased plasma adiponectin level [38]. A follow-up study with adiponectin sampling at different time points would be warranted to understand if the observed adiponectin result is simply an artefact of the variation present in a single measurement.
PPARα was significantly upregulated in a dose-dependant manner. PPARα is a key gene involved in fatty-acid metabolism, lipolysis and fatty-acid oxidation. Flavonoids from grapefruit have been demonstrated to cause such effect [39]. However, unlike the response to grapefruit, the PPARα co-activator PGC1α mRNA expression remained unchanged in the present study. These results suggest that PRSE may have a role in reducing the development of obesity via lipolysis and fatty acid oxidation.
Fatty-acid synthase gave significant results in both liver and plasma. However, in the liver only the 4% PRSE treatment was significant and in plasma it was only the 2% PRSE treatment that had significant effects. Therefore, it is unlikely that weight loss would act through this pathway in a dose-dependant manner with feeding of PRSE in the diet. The reason for the significant difference at these specific dosages requires further investigation. UCP2 levels also returned contrasting results. There were no significant differences in adipose tissue UCP levels; however, in the liver a dose-dependant and highly significant relationship was observed. Compounds such as resveratrol have been suggested to have anti-obesity effects due to upregulation of UCP2 in the liver, amongst other things [40].
It is interesting that a rich source of carbohydrates such as sugarcane also contains compounds that are gaining evidence as efficient regulators of carbohydrate metabolism. Individually, some of the compounds identified in PRSE such as tricin, luteolin and apigenin have been demonstrated to have anti-obesity effects [41,42,43]. However, PRSE provides a novel source of these compounds. This trial has demonstrated a range of potential mechanisms for these anti-obesity effects in an animal model. Based on the data collected in this study, delivering these compounds at an optimal dosage may be a useful strategy in the prevention of obesity. The present study has identified mechanisms such as reduced absorption of carbohydrates and changes to pathways, especially those related to leptin, PPARs and liver UCP2 and to some extent adiponectin gene expression as likely candidates for weight loss in the presence of a high-carbohydrate, high-fat diet. There are other potential mechanisms such as the role of the microbiome or other cellular pathways that have not been covered in this trial and further studies that targeting these factors directly may provide valuable insights. These results demonstrate that PRSE is a bioavailable source of phytochemicals that has mitigated the damage of a high-fat, high-carbohydrate diet. Overall, further work will be required to translate these results to clinical trials. However, these initial results suggest that PRSE and sugarcane may have a positive role to play in the reduction of global obesity rates.

Supplementary Materials

The following are available online at https://www.mdpi.com/article/10.3390/app11115163/s1, Table S1: Diet Composition.

Author Contributions

T.P.E., L.S., D.B., J.S., L.L.I., R.S.W. & M.J. were all involved in the initial planning and completion of the trial. M.F. & B.K. drafted the manuscript. All authors were involved with data interpretation. All authors have read and agreed to the published version of the manuscript.

Funding

Work was funded partly by sponsorship from entities owned by The Product Makers Pty Ltd. All extracts described in this publication refer to patented extracts owned by The Product Makers Pty Ltd.

Institutional Review Board Statement

The trial was approved by the La Trobe University Animal Ethics Committee (AEC09-46-P) and complied with The Australian Code for the Care and Use of Animals for Scientific Purposes and all other relevant legislation.

Data Availability Statement

The data presented in this study are available on request from the corresponding author.

Conflicts of Interest

Matthew Flavel and Barry Kitchen are employees of The Product Makers Pty. Ltd. The manufacturer and patent holder of the Polyphenol Rich Extract (PRSE).

Abbreviations

ANOVAAnalysis of Variance
AUCArea Under the Curve
DEXADual energy x-ray absoptiometry
GTTGlucose Tolerance Test
PGC1αPeroxisome proliferator-activated receptor-γ coactivator 1-α
PPARαPeroxisome proliferator-activated receptor alpha
PPARγPeroxisome proliferator-activated receptor gamma
PRSEPolyphenol Rich Sugarcane Extract
UCP2Mitochondrial Uncoupling Protein 2
w/wweight for weight

References

  1. Meydani, M.; Hasan, S.T. Dietary Polyphenols and Obesity. Nutrients 2010, 2, 737–751. [Google Scholar] [CrossRef]
  2. Anhê, F.F.; Roy, D.; Pilon, G.; Dudonné, S.; Matamoros, S.; Varin, T.V.; Garofalo, C.; Moine, Q.; Desjardins, Y.; Levy, E.; et al. A polyphenol-rich cranberry extract protects from diet-induced obesity, insulin resistance and intestinal inflammation in as-sociation with increased Akkermansia spp. population in the gut microbiota of mice. Gut 2015, 64, 872–883. [Google Scholar] [CrossRef] [Green Version]
  3. Murase, T.; Misawa, K.; Minegishi, Y.; Aoki, M.; Ominami, H.; Suzuki, Y.; Shibuya, Y.; Hase, T. Coffee polyphenols suppress di-et-induced body fat accumulation by downregulating SREBP-1c and related molecules in C57BL/6J mice. Am. J. Physiol. Endocrinol. Metab. 2010, 300, E122–E133. [Google Scholar] [CrossRef] [Green Version]
  4. Chen, Y.-K.; Cheung, C.; Reuhl, K.R.; Liu, A.B.; Lee, M.-J.; Lu, Y.-P.; Yang, C.S. Effects of Green Tea Polyphenol (−)-Epigallocatechin-3-gallate on Newly Developed High-Fat/Western-Style Diet-Induced Obesity and Metabolic Syndrome in Mice. J. Agric. Food Chem. 2011, 59, 11862–11871. [Google Scholar] [CrossRef] [Green Version]
  5. Bose, M.; Lambert, J.D.; Ju, J.; Reuhl, K.R.; Shapses, S.A.; Yang, C.S. The Major Green Tea Polyphenol, (-)-Epigallocatechin-3-Gallate, Inhibits Obesity, Metabolic Syndrome, and Fatty Liver Disease in High-Fat–Fed Mice. J. Nutr. 2008, 138, 1677–1683. [Google Scholar] [CrossRef] [PubMed]
  6. Gu, Y.; Yu, S.; Lambert, J.D. Dietary cocoa ameliorates obesity-related inflammation in high fat-fed mice. Eur. J. Nutr. 2014, 53, 149–158. [Google Scholar] [CrossRef] [Green Version]
  7. Duarte-Almeida, J.M.; Novoa, A.V.; Linares, A.F.; Lajolo, F.M.; Genovese, M.I. Antioxidant Activity of Phenolics Compounds From Sugar Cane (Saccharum officinarum L.) Juice. Plant Foods Hum. Nutr. 2006, 61, 187–192. [Google Scholar] [CrossRef] [PubMed]
  8. Duarte-Almeida, J.M.; Salatino, A.; Genovese, M.I.; Lajolo, F.M. Phenolic composition and antioxidant activity of culms and sug-arcane (Saccharum officinarum L.) products. Food Chem. 2011, 125, 660–664. [Google Scholar] [CrossRef]
  9. Kong, F.; Yu, S.; Zeng, F.; Wu, X. Preparation of Antioxidant and Evaluation of the Antioxidant Activities of Antioxidants Extracted from Sugarcane Products. J. Food Nutr. Res. 2015, 3, 458–463. [Google Scholar] [CrossRef] [Green Version]
  10. Feng, S.; Luo, Z.; Zhang, Y.; Zhong, Z.; Lu, B. Phytochemical contents and antioxidant capacities of different parts of two sugar-cane (Saccharum officinarum L.) cultivars. Food Chem. 2014, 151, 452–458. [Google Scholar] [CrossRef]
  11. Lee, D.; Go, G.-W.; Imm, J.-Y. Tricin, a methylated cereal flavone, suppresses fat accumulation by downregulating AKT and mTOR in 3T3-L1 preadipocytes. J. Funct. Foods 2016, 26, 548–556. [Google Scholar] [CrossRef]
  12. Callcott, E.T.; Santhakumar, A.; Luo, J.; Blanchard, C.L. Therapeutic potential of rice-derived polyphenols on obesity-related oxidative stress and inflammation. J. Appl. Biomed. 2018, 16, 255–262. [Google Scholar] [CrossRef]
  13. Ando, C.; Takahashi, N.; Hirai, S.; Nishimura, K.; Lin, S.; Uemura, T.; Goto, T.; Yu, R.; Nakagami, J.; Murakami, S.; et al. Luteolin, a food-derived flavonoid, suppresses adipocyte-dependent activation of macrophages by inhibiting JNK activation. FEBS Lett. 2009, 583, 3649–3654. [Google Scholar] [CrossRef] [Green Version]
  14. Zang, Y.; Igarashi, K.; Li, Y. Anti-diabetic effects of luteolin and luteolin-7-O-glucoside on KK-A y mice. Biosci. Biotechnol. Biochem. 2016, 80, 1580–1586. [Google Scholar] [CrossRef] [PubMed] [Green Version]
  15. Kimura, Y.; Okuda, H.; Arichi, S. Effects of non-sugar fraction in black sugar on lipid and carbohydrate metabolism; Part I. Planta Med. 1984, 50, 465–468. [Google Scholar] [CrossRef] [PubMed]
  16. Kimura, Y.; Okuda, H.; Shoji, N.; Takemoto, T.; Arichi, S. Effects of Non-Sugar Fraction in Black Sugar on Lipid and Carbohydrate Metabolism; Part II New Compounds Inhibiting Elevation of Plasma Insulin. Planta Med. 1984, 50, 469–473. [Google Scholar] [CrossRef] [PubMed]
  17. Ji, J.; Yang, X.; Flavel, M.; Shields, Z.P.; Kitchen, B. Antioxidant and Anti-Diabetic Functions of a Polyphenol-Rich Sugarcane Ex-tract. J. Am. Coll. Nutr. 2019, 20, 1. [Google Scholar]
  18. Montgomery, M.; Hallahan, N.L.; Brown, S.H.; Liu, M.; Mitchell, T.W.; Cooney, G.J.; Turner, N. Mouse strain-dependent variation in obesity and glucose homeostasis in response to high-fat feeding. Diabetologia 2013, 56, 1129–1139. [Google Scholar] [CrossRef]
  19. Reeves, P.G. Components of the AIN-93 Diets as Improvements in the AIN-76A Diet. J. Nutr. 1997, 127, 838S–841S. [Google Scholar] [CrossRef]
  20. Bray, G.A.; Popkin, B.M. Dietary sugar and body weight: Have we reached a crisis in the epidemic of obesity and diabetes?: Health be damned! Pour on the sugar. Diabetes Care 2014, 37, 950–956. [Google Scholar] [CrossRef] [Green Version]
  21. Wang, S.; Moustaid-Moussa, N.; Chen, L.; Mo, H.; Shastri, A.; Su, R.; Bapat, P.; Kwun, I.; Shen, C.L. Novel insights of dietary polyphe-nols and obesity. J. Nutr. Biochem. 2014, 25, 1–8. [Google Scholar] [CrossRef] [PubMed] [Green Version]
  22. Loureiro, G.; Martel, F. The effect of dietary polyphenols on intestinal absorption of glucose and fructose: Relation with obe-sity and type 2 diabetes. Food Rev. Int. 2019, 35, 390–406. [Google Scholar] [CrossRef]
  23. Ono, Y.; Hattori, E.; Fukaya, Y.; Imai, S.; Ohizumi, Y. Anti-obesity effect of Nelumbo nucifera leaves extract in mice and rats. J. Ethnopharmacol. 2006, 106, 238–244. [Google Scholar] [CrossRef]
  24. Luo, H.; Kashiwagi, A.; Shibahara, T.; Yamada, K. Decreased bodyweight without rebound and regulated lipoprotein me-tabolism by gymnemate in genetic multifactor syndrome animal. Mol. Cell. Biochem. 2007, 299, 93–98. [Google Scholar] [CrossRef]
  25. Adekunle, I.A.; Imafidon, C.E.; Oladele, A.A.; Ayoka, A.O. Ginger polyphenols attenuate cyclosporine-induced disturbances in kidney function: Potential application in adjuvant transplant therapy. Pathophysiology 2018, 25, 101–115. [Google Scholar] [CrossRef] [PubMed]
  26. Ali, S.E.; El Gedaily, R.A.; Mocan, A.; Farag, M.A.; El-Seedi, H.R. Profiling Metabolites and Biological Activities of Sugarcane (Saccharum officinarum Linn.) Juice and Its Product Molasses via a Multiplex Metabolomics Approach. Molecules 2019, 24, 934. [Google Scholar] [CrossRef] [PubMed] [Green Version]
  27. Kong, F.; Yu, S.; Zeng, F.; Wu, X. Phenolics Content and Inhibitory Effect of Sugarcane Molasses on α-Glucosidase and α-Amylase In Vitro. Sugar Tech 2016, 18, 333–339. [Google Scholar] [CrossRef]
  28. Myers, M.G., Jr.; Leibel, R.L.; Seeley, R.J.; Schwartz, M.W. Obesity and leptin resistance: Distinguishing cause from effect. Trends Endocrinol. Metab. 2010, 21, 643–651. [Google Scholar] [CrossRef] [Green Version]
  29. Fukuchi, Y.; Hiramitsu, M.; Okada, M.; Hayashi, S.; Nabeno, Y.; Osawa, T.; Naito, M. Lemon Polyphenols Suppress Diet-induced Obesity by Up-Regulation of mRNA Levels of the Enzymes Involved in β-Oxidation in Mouse White Adipose Tissue. J. Clin. Biochem. Nutr. 2008, 43, 201–209. [Google Scholar] [CrossRef] [Green Version]
  30. Rangel-Huerta, O.D.; Pastor-Villaescusa, B.; Aguilera, C.M.; Gil, A. A Systematic Review of the Efficacy of Bioactive Compounds in Cardiovascular Disease: Phenolic Compounds. Nutrients 2015, 7, 5177–5216. [Google Scholar] [CrossRef] [Green Version]
  31. Asterholm, I.W.; Scherer, P.E. Enhanced Metabolic Flexibility Associated with Elevated Adiponectin Levels. Am. J. Pathol. 2010, 176, 1364–1376. [Google Scholar] [CrossRef] [PubMed]
  32. Vogel, C.; Marcotte, E.M. Insights into the regulation of protein abundance from proteomic and transcriptomic analyses. Nat. Rev. Genet. 2012, 13, 227–232. [Google Scholar] [CrossRef] [PubMed]
  33. Ghoshal, K.; Bhattacharyya, M. Adiponectin: Probe of the molecular paradigm associating diabetes and obesity. World J. Diabetes 2015, 6, 151–166. [Google Scholar] [CrossRef] [PubMed]
  34. Chan, C.Y.; Wei, L.; Castro-Muñozledo, F.; Koo, W.L. (−)-Epigallocatechin-3-gallate blocks 3T3-L1 adipose conversion by inhibi-tion of cell proliferation and suppression of adipose phenotype expression. Life Sci. 2011, 89, 779–785. [Google Scholar] [CrossRef] [PubMed]
  35. Ikarashi, N.; Toda, T.; Okaniwa, T.; Ito, K.; Ochiai, W.; Sugiyama, K. Anti-Obesity and Anti-Diabetic Effects of Acacia Polyphenol in Obese Diabetic KKAy Mice Fed High-Fat Diet. Evidence-Based Complement. Altern. Med. 2011, 2011, 1–10. [Google Scholar] [CrossRef] [Green Version]
  36. Herranz-López, M.; Barrajón-Catalán, E.; Segura-Carretero, A.; Menéndez, J.A.; Joven, J.; Micol, V. Lemon verbena (Lippia citriodora) polyphenols alleviate obesity-related disturbances in hypertrophic adipocytes through AMPK-dependent mechanisms. Phytomedicine 2015, 22, 605–614. [Google Scholar] [CrossRef]
  37. Noratto, G.; Martino, H.S.; Simbo, S.; Byrne, D.; Mertens-Talcott, S.U. Consumption of polyphenol-rich peach and plum juice pre-vents risk factors for obesity-related metabolic disorders and cardiovascular disease in Zucker rats. J. Nutr. Biochem. 2015, 26, 633–641. [Google Scholar] [CrossRef]
  38. Maeda, N.; Takahashi, M.; Funahashi, T.; Kihara, S.; Nishizawa, H.; Kishida, K.; Nagaretani, H.; Matsuda, M.; Komuro, R.; Ouchi, N.; et al. PPARγ ligands increase expression and plasma concentrations of adiponectin, an adipose-derived protein. Diabetes 2001, 50, 2094–2099. [Google Scholar] [CrossRef] [Green Version]
  39. Goldwasser, J.; Cohen, P.Y.; Yang, E.; Balaguer, P.; Yarmush, M.L.; Nahmias, Y. Transcriptional Regulation of Human and Rat Hepatic Lipid Metabolism by the Grapefruit Flavonoid Naringenin: Role of PPARα, PPARγ and LXRα. PLoS ONE 2010, 5, e12399. [Google Scholar] [CrossRef] [PubMed] [Green Version]
  40. Poulsen, M.M.; Larsen, J.Ø.; Hamilton-Dutoit, S.; Clasen, B.F.; Jessen, N.; Paulsen, S.K.; Kjær, T.N.; Richelsen, B.; Pedersen, S.B. Resveratrol up-regulates hepatic uncoupling protein 2 and prevents development of nonalcoholic fatty liver disease in rats fed a high-fat diet. Nutr. Res. 2012, 32, 701–708. [Google Scholar] [CrossRef]
  41. Lee, D.; Imm, J.-Y. Antiobesity Effect of Tricin, a Methylated Cereal Flavone, in High-Fat-Diet-Induced Obese Mice. J. Agric. Food Chem. 2018, 66, 9989–9994. [Google Scholar] [CrossRef] [PubMed]
  42. Ono, M.; Fujimori, K. Antiadipogenic Effect of Dietary Apigenin through Activation of AMPK in 3T3-L1 Cells. J. Agric. Food Chem. 2011, 59, 13346–13352. [Google Scholar] [CrossRef] [PubMed]
  43. Xu, N.; Zhang, L.; Dong, J.; Zhang, X.; Chen, Y.G.; Bao, B.; Liu, J. Low-dose diet supplement of a natural flavonoid, luteolin, amelio-rates diet-induced obesity and insulin resistance in mice. Mol. Nutr. Food Res. 2014, 58, 1258–1268. [Google Scholar] [CrossRef] [PubMed]
Figure 1. Experimental design overview.
Applsci 11 05163 g001
Figure 2. Body weight, intake and glucose tolerance test results. (A) Mean (±SEM) body weight, (B) mean food intake (g/day) and (C) mean water intake (mL/day) for animals in the control groupthe group with a diet supplemented with 2% PRSE or 4% PRSE measured weekly for first 10 weeks of study. (D) Glucose tolerance test curves showing changes in blood glucose concentration (mmol/L) prior to and following administration of glucose solution to the control (black), 2% PRSE-supplemented and 4% PRSE-supplemented mice groups after 10 weeks of PRSE-supplemented diet.
Applsci 11 05163 g002
Figure 3. Mouse body composition analysis. Body composition of mice in the control group (black bars) and in the groups with a diet supplemented with 2% (light bars) or 4% PRSE (dark bars) was measured with Dual Energy X-ray Absorptiometry (DEXA) or laboratory scales. (A) Mean differences (±SEM) in fat mass, (B) fat-free mass, (C) body fat percentage, (D) body weight, (E) bone mineral density and (F) bone mineral content between the three experimental groups were measured using DEXA. As verification of the DEXA data final weight of the mice was measured with laboratory scales. Graphs with different superscripts (a, b) differ significantly p < 0.05.
Applsci 11 05163 g003
Figure 4. Energy expenditure and excretion after PRSE supplementation. In all graphs the mice of 2% PRSE dietary supplementation are represented by light bars and the group with 4% PRSE dietary supplementation by dark bars. (A) In the first week of study the metabolic rate of the mice was measured by indirect calorimetry. Data are expressed as mean (±SEM) 24-h energy expenditure. (B) Also in the first week, general locomotor activity was measured. Data are expressed as the mean (±SEM) of the amount of activity in 24 h. (C) In week 8 faecal matter was analysed by bomb calorimetry for the mean (±SEM) of daily excreted energy. (D) Calculation of the mean (±SEM) digestibility percentage (100 × (total energy intake-total energy excreted)/(total energy intake); where total energy intake = diet energy × total food intake; and total energy excretion = faecal energy × total faecal excretion) of the diet consumed for mice in each of the experimental groups. Faecal matter was then analysed to determine mean percentage differences (±SEM) of (E) lipid, (F) carbon and (G) nitrogen levels. (H) Ratio of carbon to nitrogen in the faecal matter. Graphs with different superscripts (a, b, c) differ significantly p < 0.05.
Applsci 11 05163 g004
Figure 5. Plasma concentrations of leptin (A) and adiponectin (B). Enzyme-Linked Immunosorbent Assays (ELISA) were performed on plasma from mice in the control group (black bars) and in the groups with a diet supplemented with 2% (light bars) or 4% PRSE (dark bars). Graphs with different superscripts (a, b) differ significantly p < 0.05.
Applsci 11 05163 g005
Figure 6. Analysis of expression levels of genes associated with lipogenesis/lipolysis in mice with diets supplemented with PRSE. Following the trial mRNA was isolated, RT-PCR performed and products quantified from mice in the control group (black bars) and in the groups with a diet supplemented with 2% (light bars) or 4% PRSE (dark bars). Adipose tissue gene expression analysed included (A) adiponectin mRNA, (B) PPARγ, (C) Uncoupling Protein 2 and (D) Fatty Acid Synthase. Liver gene expression was analysed for (E) PPARα, (F) PGC1α, (G) Uncoupling Protein 2 and (H) Fatty Acid Synthase. Data are expressed as mean (±SEM) fold change in mRNA levels. Graphs with different superscripts (a, b, c, etc.) differ significantly p < 0.05.
Applsci 11 05163 g006aApplsci 11 05163 g006b
Publisher’s Note: MDPI stays neutral with regard to jurisdictional claims in published maps and institutional affiliations.

