1. Introduction
A Smart Grid represents an enhanced energy supply network that relies on information and communication technologies for enhanced energy supply services. It offers greater efficiency than traditional grids, where the latter’s centralized one-way flow direction is replaced with two-way communication and energy flows [
1]. The initial concept of an SG was defined by the National Institute of Standards and Technology (NIST) [
2] and, in fact, it is still under development [
3]. Devices from the operational technologies (OT) side of this critical infrastructure, which were physically segregated in the past, are now more and more connected to the internet in a series of highly-distributed hierarchical network systems. By integrating distributed renewable energy sources, this next generation electric power system offer enhanced efficiency and reliability. In general, SGs are revolutionizing the energy supply sector and this trend is expected to rise [
4,
5].
Unfortunately, these facts make SGs a target of cyber attacks as well. In fact, a short time after its foundation, exploitation attempts by adversaries have been reported [
6]. One of the first large-scale attacks on power systems was carried out against the Iranian nuclear program. A distributed malware caused severe malfunction and self-destruction of the system [
7]. In 2016, a series of cyber attacks was successfully carried out against the power systems in Ukraine. The incident affected 225,000 clients by disconnecting them from the grid system for three hours. The subsequent investigation found out that the attackers possessed sophisticated hacking skills and a broad knowledge about the functionality of the power system [
8]. Furthermore, several attacks were committed against the energy infrastructure and high-profile US organizations and private companies over the years (e.g., [
9,
10]). Apparently, the TRITON attack in 2017 targeted the Triconex safety instrumented system (SIS) of Schneider Electrics. SIS is responsible for safety from a higher level and takes immediate action in case of process control failure [
11]. In addition to that, known attacks like phishing, Denial-of-Service (DoS), malware and eavesdropping are carried out against SGs [
1]. Furthermore, more destructive attacks like BlackEnergy [
12] or WannaCry [
13,
14] are common. Furthermore, another issue for security in the grid domain represents the human factor [
15]. Therefore, fake honey pots can be inserted into the system in order to increase the uncertainty of the attacker [
16]. For this matter, ensuring the security of smart grids represents a critical issue in the domain of power infrastructure.
This paper proposes a formal risk assessment of cyber attacks in SG systems, based on the threat modeling and probabilistic model checking. An extensive literature survey, as one of the contributions of this paper, is provided at the beginning of the paper, in order to determine the state of the art in the related fields. Afterwards, a methodology that systematically describes involved steps and processes is given.
A smart grid demonstration case proposed in this paper serves as the common basis on which further security analysis are carried out. It takes into account the customer, the prosumer and the grid operator perspective, and encompasses three different attack surfaces in a form of three use cases: (i) smart home and HVAC hijacking attack, (ii) smart home and smart meter hijacking attack and (iii) smart grid and black-out attack. Threat modeling is applied on the whole demonstration case in order to identify threats and vulnerabilities within the system architecture. The resulting threat list is used as an input for vulnerability detection and for defining potential attack scenarios. An important parameter in the risk assessment is the exploitation probability–the likelihood that one particular vulnerability will be successfully exploited. While this parameter, in similar approaches, is most commonly determined through extensive literature survey, our approach includes calculation of exploitation probabilities using Common Vulnerability Scoring System (CVSS) [
17]. As the last step, we apply formal verification on defined use cases, in order to perform formal risk analysis and to obtain an indication on how safety and security requirements can be fulfilled within the given environment. Subsequently, a model checker is used to check the probabilistic model against attack properties. In the conclusion, we elaborate on the effects of a security violation with regard to security and privacy of energy clients, and we discuss future considerations for improving security in the critical energy sector.
The remainder of the paper is structured as follows:
Section 2 provides an overview about existing literature in the domain.
Section 3 describes methodology used. Then,
Section 4 describes demonstration case, including three use cases, and included components.
Section 6 includes modeled attack scenarios and results of exploitation probability assessment.
Section 7 describes available probabilistic formal verification tools and includes a description of modeled use cases and scenarios, and resulting attack probabilities.
Section 8 elaborates on implications on security risks in SGs and concludes the paper.
2. Related Work
Ensuring the security of SG systems against cyber attacks represents a great challenge for public infrastructure. Therefore, an important step in this task is the identification of potential security issues. Subsequently, the classification of these attacks serves as a starting point in ensuring effective defense mechanisms. Therefore, several approaches exist that tackle the problem from different angles. In this paper, the existing literature is divided into three distinctive topics. The first topic discusses stochastic methods, including risk assessment, for the estimation of cyber threats in SGs. The second section discusses works on real security exploits against SGs to date. The final topic provides an overview on formal verification methods for the same challenge.
2.1. Stochastic Modeling of Cyber Attacks in Smart Grid Systems
In the context of cyber security, stochastic models are used to estimate the effect of the behavior of an attacker. For this sake, they analyze probability distributions of specific variables for a vulnerability. On the other hand, risk assessment is applied in order to identify existing threats, vulnerabilities or potential risks from potential consequences, as given by Paté-Cornell et al. [
10].
Langer et al. [
18] performs a cyber security risk assessment for attacks in SGs. For this matter, they methodically analyze the impact and likelihood of cyber attacks against such systems. Therefore, they implemented the toolbox Smart Grid Information Security (SGIS), which is applied for the estimation of risks for information assets. The toolbox is applied to two use cases, namely, voltage control and power flow optimization. The authors possible consequences for SGs due to exploitation of information assets.
The paper by Jauhar et al. [
19] introduces a generalized model-based approach to assess realistic security risks for failure scenarios in SGs. The authors apply an assessment tool to analyze several of such scenarios. Each scenario is formalized in a structured model, which contains information about concrete vulnerabilities and attacker characteristics. These models are used in order to reason about failures in every scenario. The authors emphasize the advantage of their tool, namely the re-usability of generated models for different attacker profiles and systems.
Lee [
20] provides a thorough theoretical analysis on risk assessment and failure scenario ranking in the electric sector. The work analyzes vulnerabilities as well as the resulting consequences and possible mitigation mechanisms. These vulnerabilities are listed and suggestions are given to define their naming conventions and classification. In fact, this work couples failure scenarios with security controls from [
21].
Salehi Dobakhshari and Ranjbar [
22] proposes a cloud-based solution for fault location estimation in grid systems. For this matter, the approach relies on a weighted least-squares (WLS) method, which is used to model a fault location estimation problem as a non-linear estimation problem. The authors observe that the probability of inaccuracy estimation increases as a consequence of multiple measurements. However, since the approach detects erroneous measurements, the overall estimation error remains below 1% at different points in the SG system.
The work from Rao et al. [
23] introduces game-theoretic models for the estimation of attack probabilities. For this sake, the authors analyze the interactions between attacker and defender in a grid network. Then, they apply game theory in order to implement a probabilistic model. This represents a systematic Boolean attack–defense model, thereby analyzing the overall infrastructure in a top-down manner. In their example, in authors assume that the attacker obtained information about the target system prior to the attack. In this way, the probabilistic model returns success rates for both the attacker and defender. In the attack scenario, both parties assume certain action after calculating the opponent’s success rate. However, in order to reproduce this approach, broad knowledge about the capabilities of the infrastructure is necessary, which is provided by facility users. For both sides to draft a probabilistic strategy, knowledge about incidental degradation, incurred costs, defender strategies and defense priorities is mandatory.
The approach Gao et al. [
24] applies a Monte Carlo method, which is based on Markov chains for operation reliability in power systems. For this sake, the authors focus on time-dependent state probabilities for state prediction. In this method, a system state is defined in terms of a specific situation of its composite states. In this case, the probability of each state is depicted with corresponding state models. Subsequently, the resulting multi-state Markov model relies on a state transition matrix in order to derive failure and repair rates of a specific state in the system. In this way, security issues in states can be addressed and evaluated in advance.
Hao et al. [
25] focuses on a false-data injection against SG distribution systems. In this approach, false-data injection is used in order to exploit a voltage regulation mechanism. This stealthy attack sends false voltage data to the system in order to cause load disturbances in voltage regulators. Eventually, the attack causes a malfunction in the system. In order counter face the attack, the authors compute the best response strategy by relying on a concept from game theory, namely the adaptive Markov strategy (AMS). This method is especially suitable in situations where a system is attacked by unpredictable attackers. Therefore, the AMS comprehends online learning mechanisms so optimal defense strategies are computed against an estimated behavior of the attacker.
In Leszczyna [
26], the author provides a review on standards for cyber security assessments in Smart Grids. He identifies six relevant standards that provide a general guidance on this matter. However, they do not present a technical specification so far.
2.2. Cyber Security in Smart Grid Systems
As already mentioned, cyber attacks against the SG infrastructure can lead to severe consequences. Due to the complexity of this emerging technology, the behavior of attacker is difficult to predict. Several types of attacks like injection and malware target multiple systems across the network. Until now, several successful exploitations are executed in theory and practice.
Khan et al. [
12] provides a detailed overview on one of the most destructive malwares in the energy sector, namely BlackEnergy. This Trojan horse has a long history with critical infrastructures so its capabilities evolved in time. In general, it targets real-time grid monitoring and control and causes coordinated DoS, eavesdropping, information theft, remote access, etc. Due to its evolving nature, providing effective defense mechanisms represents a difficult challenge. Therefore, the authors explain existing protection strategies and warn about the persistence of the attack in the future.
The work from Sun et al. [
27] presents a description on the impact of coordinated cyber attacks against SG systems. Distributed attacks are usually well-organized and contain an elaborated attack plan before the execution. The latter constitutes an attack pattern, where each step is related to other steps that constitute an attack plan.
On the other hand, Soltan et al. [
28] proposes a new class of potential attacks against SGs, which they call Manipulation of demand via IoT (MadIoT). For this matter, they address inherited vulnerabilities from the technology of IoT in the domain of power grids. In this scenario, attackers compromise less protected IoT devices and disrupt the functionality of an SG. Such attacks cause consequences like frequency instability, line and cascading failures and subsequently, increase in operational costs. Additionally, the authors utilize an IoT botnet that is meant to execute an attack against a power system. They perform the MadIoT attacks against an SG simulator and analyze different scenarios with regard to produced impact.
Security considerations for SCADA systems are discussed in detail by Pliatsios et al. [
29]. First, a broad overview on the technology of SCADA and the underlying communication protocols is given. Then, security incidents are discussed as well as their impacts with regard to public health and safety. In the aftermath, the authors discuss the implementation of defense mechanisms. Thorough surveys of cybersecurity threats and issues in SCADA networks are given by Nazir et al. [
30], Irmak and Erkek [
31], Ghosh and Sampalli [
32] and Antón et al. [
33], respectively.
Furthermore, a broad discussion about cybersecurity issues in Industrial Control Systems is given by McLaughlin et al. [
34]. In their review of theoretical frameworks, the authors assume worst case scenarios, i.e., that attackers are highly competent and in possession of complete knowledge about the system. Security measures are discussed that fit such attacker’s profile for this matter.
A slightly different approach is given by Garcia et al. [
35], which introduces a physics-aware cyber attack against power systems. The analyzed attacks target the system’s underlying embedded programmable logic controller (PLC) by manipulating existing control commands. Thus, the malware is constructed in a way to cause severe impact to the physical power equipment. In order to make the malware functional and more efficient, the authors reverse engineer the central PLC to extract information about its control instructions. In this way, an adversary model is drafted in order to carry out attacks against the control system. Similar to other attack scenarios, the approach assumes that knowledge about the target domain is available prior to the attack. In fact, the attack is very effective because it is executed in a stealthy fashion. In this way, its existence is not obvious and causes a more enduring impact than strong short attacks.
Other attacks against PLCs in power systems are presented by Brüggemann and Spenneberg [
36] and Klick et al. [
37].
The work by Amini et al. [
38] analyzes dynamic load altering attacks (LAAs) in power grids. Such cyber attacks are meant to control and destabilize a system by targeting its unsecured loads. The paper provides a model about the system and an estimation on the consequence of attacks against the system under a specific configuration. For this matter, the authors take into consideration the exposure of parameters to fluctuation and discuss mitigation mechanisms.
Security-related aspects of connected SGs in IoT infrastructures are discussed in the work from Dvorkin and Garg [
39]. In these scenarios, distributed electric loads are interconnected and simultaneously controlled by a supervisory IoT system. For this sake, cybersecurity issues must be considered specifically for IoT-operated loads in order to guarantee undisrupted grid operation. Therefore, the authors provide a hypothetical scenario where an SG is targeted by distributed cyber attacks. Hence, the proposed modeling framework reveals the propagation and impact of cyber attacks on IoT-controlled electrical loads. In the aftermath, an attacker is able to alter the power consumption and cause severe damage to the system. In addition to that, the compromised IoT devices can be exploited further to launch additional attacks, like DoS, against other services. In addition to that, the authors discuss several attack strategies and the resulting consequences.
Li et al. [
40] focuses on challenges for producing efficient defense mechanisms in SGs. For this reason, the authors introduce a sequential detector that is based on an adaptive sampling technique. In order to test their approach, malicious data is submitted to the monitoring systems of an SG. The efficiency of attack detection is compared in centralized and distributed attack detections. The authors claim their method is efficient against a broad variety of attacking strategies and unexpected situations. Furthermore, the proposed method considerably reduces overheads in the system without having a negative impact on the robustness and average detection performance.
Another discussion on coordinated data injection attacks against a power network and appropriate detection methods is given by Cui et al. [
41]. First, the authors analyze an attack model for a stealth attack against an SG network. Therefore, they introduce a system model for state estimation on the example of a linearized model. In this method, the goal is to estimate possible electrical states by dynamically analyzing real-time redundant meter measurement data in a system. Subsequently, the authors provide a survey on common approaches against data injection attacks and discuss future research directions.
A more practical approach is given by Marksteiner et al. [
42]. The paper provides a smart grid-specific methodology based on risk assessment and threat modeling for the development of security requirements. The given approach takes into account cyber threats on different levels, namely the architectural, the protocol and the device level.
Major security challenges and evolving cyber attacks in SGs are described by Li et al. [
43], Rawat and Bajracharya Chandra [
44], Shapsough et al. [
45] and Gunduz and Das [
46]. Yan et al. [
47] summarizes cyber security requirements and existing solutions in communication systems and protocols. Security challenges with regard to technical foundations of SGs are described in detail by El Mrabet et al. [
7].
2.3. Formal Verification in Smart Grids
The application of formal methods for the prevention of cyber attacks in the SG domain is addressed from different perspectives. These include quantitative as well as qualitative properties. On the protocol level, two relevant publications exist for this matter. Rashid et al. [
48] addresses the performance and efficiency of Smart Grids by checking a ZigBee-based routing protocol for the communication network. The focus of this work is the functionality of the protocol. This is confirmed by the conducted verification of collision avoidance and liveness properties. On the other hand, Odelu et al. [
49] focuses on the secure authentication key agreement in the Canetti–Krawczyk adversary model. The authors emphasize the importance of several software components for the security and privacy in the SG domain. Therefore, the authors propose a provable secure authentication key agreement scheme.
In Naseem et al. [
50], PRISM is used for a reliability analysis and investigation of accuracy, stability and efficiency. The analysis was committed in cases where faults were detected in the transmission line system of a Smart Grid. In addition to that, the approach is applicable to calculate failure probabilities in network components. The reliability of a G3-Power Line Communication (PLC) networks is considered by Uddin et al. [
51]. The work puts focus on the accuracy and reliability of the information flow. For this sake, it specially emphasizes the Fault Detection, Isolation and Supply Restoration behavior. Hamman et al. [
52] uses the model checker SPIN in order to check the wide-area backup protection system (WABPS). This is specifically designed to offer a high degree of reliability in different failure scenarios. However, due to the advanced design, the calculation of the fault tolerance proves difficult. Therefore, the authors applied SPIN to check the limits of a failure. Garlapati [
53] applies the model checker UPPAAL for verification of the Agent Aided Distance Relaying Protection Scheme. This represents a hierarchically distributed and non-intrusive concept for decreasing blackout probability. In their work, this scenario occurred due to hidden failures of distance relays in the Advanced Metering Infrastructure.
Bashar et al. [
54] provides a security risk management solution for the protection of Smart Grids in case of cyber attacks. The authors use probabilistic model checking to model the attacker’s behavior in form of a Markov Decision Process. For this sake, they rely on the model checker PRISM. Two types of attacker behaviors are considred, namely non-persistent and persistent behaviors, as well as their effect on critical components in an SG. On the other hand, Diovu and Agee [
55] studies the effects of distributed DoS attacks on the Advanced Metering infrastructure. The authors estimate best and worst case analyses in the context of a cloud-based openflow firewall. In the aftermath, they study DoS attacks with respect to different detection probabilities of the firewall.
Similar to our proposed work, Krivokuća et al. [
56] conduct a risk analysis for Smart Water Distribution use case. The corresponding authors focus on two main scenarios, namely water contamination and water tank overflow. Therefore, risk exposure scores are calculated for both scenarios. Additionally, these scores provide recommendations for system configurations to improve safety and security.
3. Methodology
The methodology for the research presented in this paper is shown on
Figure 1. The steps in the process are sequentially marked in
Figure 1. The first step is the definition of the system architecture, its components and communication channels. The system architecture is used for the threat modeling step, which as a result provides a list of threats. The vulnerabilities of the system and the attack possibilities are identified based on the threat list. Next, the exploitation probabilities for the identified vulnerabilities are calculated and the attacker’s behavior is modeled. The formal system model is created based on the system architecture, the identified vulnerabilities with exploitation probabilities, and the modeled attacks. The formal properties of the attacks are identified next, and the model is checked against the identified properties using the model checker. This finally results in risk exposure scores.
A significant part of this research was the development of a non-deterministic system model as Markov Decision Process (MDP). The Markov model incorporates the system architecture, the attacker’s behavior and the existing vulnerabilities of the system with identified exploitation probabilities. The required input elements for formal verification are the system model, together with the identified attack properties. The chosen tool for formal verification is the PRISM model checker.
4. Demonstration Use Case
The digitized bi-directional power infrastructure connecting production, distribution and prosumer assets offers the attackers different ways to penetrate the LV Grid via the ICT environment. The so called attack vectors, describing the attack route and the attack technique, can be very diverse depending on the hardware, software, communication channels and physical access. This large attack surface built up by different attack vectors and assets under different ownership has to be carefully addressed. Each new component added to such a configuration can introduce new unforeseen risks, both from HW and SW side.
The use case architecture described in this paper (
Figure 2) simplifies the redesign of the energy network, which will be common in the future, towards a decentralized distributed generation and independent islanding. It serves as a starting point for our approach to a differentiated cyber risk assessment and takes into account the customer, the prosumer and the grid operator perspective.
The described architecture consists of various devices and services both on consumer and production/distribution side and, as such, it is analyzed from the cyber security perspective, taking into account three attack surfaces:
UC1: Smart home and HVAC hijacking attack
UC2: Smart home and smart meter hijacking attack
UC3: Smart grid and black-out attack
The components included in each use case are described below. The components are carefully considered in the different steps of the proposed research, including threat modeling, attack assessment and model checking.
4.1. Smart Home and HVAC Hijacking Use Case Components
Humidity, Ventilation and Air Condition (HVAC) system, including actuators controlling heating and cooling, and thermometer, is a technology used to control indoor thermal comfort and air quality. It is used in indoor applications, including for example residential, industrial and professional, environments, as well as in vehicular environments.
Home Energy Management System (HEMS) is a technology platform that introduces and connects sensors within smart home devices, via home networks. It consists of hardware and software components, and it is used to carry out home automation and control processes.
Gateway (G), or a residential gateway, is a consumer-grade system which provides network and internet access to various smart systems connected to a local area network (LAN).
4.2. Smart Home and Smart Meter Hijacking Use Case Components
Smart Meter (SM) is a digital device used in smart home applications, with the main function to collect and record information such as electric energy consumption, current, voltage levels, etc.
In-house display (IHD) is a user interface, in a form of a small monitor, directly connected to a smart meter. It usually shows the current system parameters, like current energy consumption.
This use case also includes distributor side components such as the Data Concentrator Unit (DCU), the Meter Data Collector (MDC) and the Meter Data Management System (MDMS), that are described bellow, in the third use case.
4.3. Smart Grid and Black-Out Attack Use Case Components
Power Electronic Device (PED) consists of an Intelligent Local Energy Manager (ILEM), which is responsible for the management of the device components, a Power Conversion System and a Battery Management System with hybrid energy storage features, based on predefined voltage support actions configured by the operator.
Phasor Measurement Unit (PMU) is a metering and control device for measuring phasor data (voltage and current synchronization), voltage and current waveforms.
Power Quality Monitor (PQM) is a lightweight metering device with a measurement and control unit and enables the calculation of all power quality parameters required according to EN 50160.
Wide Area Monitoring System (WAMS) collects processes and monitors geo- referenced spatial temporal field data coming from distributed PMUs and PQMs located both on low voltage and on the medium voltage side.
The Remote Terminal Unit (RTU) provides communications features to field devices to exchange telemetry data and control messages with the capability of processing data.
Distribution Management System (DMS) provides sophisticated functionality for advanced monitoring and control of the distribution grid to the DSO, which is important to handle increased customer generation and energy storage facilities as well as the management of demand response capabilities.
Supervisory Control and Data Acquisition System (SCADA) is in charge of real-time monitoring and control of the distribution grid and manages diverse remote control systems via a telecommunication network and provides data analytics and data storage functionality.
Enterprize Service Bus (ESB) is a middleware that enables the messaging and routing capabilities as well as the integration of distributed services and applications.
Data Concentrator Unit (DCU) is a unit responsible for the gathering of measurement data from multiple metering devices installed at the substation.
Meter Data Management System (MDMS) stores large quantities of smart meter data performs their validation and analytical processing.
Meter Data Collector (MDC) collects and manages the measurement data received by the data-concentrating units (DCUs) which is then forwarded to MDMS.
Photovoltaic system (PV) is a standalone solar PV with a power conditioning unit, a DC/AC converter and which is connected via the gateway to delivers data.
Switchgear (SwG) is a motorized switchgear which enables coupling and decoupling of the grid sector.
5. Threat Modeling
In general, threat modeling aims to identify threats and vulnerabilities within IT-related system architectures [
57]. Furthermore, it helps to put security and privacy by design into practice. In this paper, a threat modelling approach is meant to secure a project setup with a systematic security analysis. In [
42], a feasible list of requirements obtained by risk assessment for different components. In our paper, however, risk assessment is performed for each individual component, without analyzing their interaction within the overall system.
Figure 3 depicts the threat model based, which is based on the demonstration use case from
Section 4. The model was created by using the Microsoft Threat Modeling Tool [
58], which works on data flow diagrams that describes data stores, processes and communication lines and provides threats based on the STRIDE model [
59]. STRIDE divides threats into the following six categories:
Spoofing: refers to the illegally access and usage of foreign authentication information to obtain illegitimate access.
Tampering: is associated with the malicious modification of data.
Repudiation: denies an action that was performed by an entity without having a possibility to uncover this malicious action.
Information disclosure: denotes the exposure of information to users who are not authorized to have access to this information.
Denial of service: affects the availability of services so that they are not accessible for authorized users.
Elevation of privilege: denotes obtaining privileged access by an unprivileged user and thus ultimately the possibility of compromising the entire system.
The Microsoft Threat Modeling Tool is not limited to a set of threats but offers the possibility to create individual templates for a given domain. Furthermore, we rely on the Azure cloud and IoT templates from Microsoft for the smart home area. We combine these templates with our own, which are based on our research in the smart energy domain. In the model itself, different trust zones were identified according to our use case. First, the trust zone of components is identified within the smart home, then in the outsourced cloud area and the immediate personal area. In the SG environment, the trust zones at the control center include DMS, SCADA and a monitoring system. At the substation level, two zones exist, namely, one that covers the PED and SwG, and a second dealing with metering components. Finally, measurement components that cover additional metering points in the network constitute a separate trust zone.
In total, the modelling approach resulted in the identification of 1137 threats. These are classified according to STRIDE, with additional one that describes threats in smart home components. The latter also cover physical threats, which contribute to the overall number of threats. A list of all categories is given in
Table 1.
However, for the conducted assessment we rely just on the threats from
Table 2.
6. Attack Scenarios and Exploitation Probability Assessment
In this section, three different exploitation attempts against the system architecture are described (
Figure 2). Each scenario describes a sequence of attack steps, which lead from an attacker to the exploitation of the system. In general, the SG system represents an interconnection of devices that are linked in an online infrastructure. Usually, every connection is implemented using different technology and communication protocols. Because of this, each device in the network represents a distinctive security challenge for the attacker. From the outside, the system can be accessed either physically or via a web interface. In the latter case, exploiting such interface represents the first security challenge for an attacker. In fact, connecting to the system and gaining access to an online device remains a challenge in every attack scenario. This paper omits the technological details about the target devices and focuses on the ways to exploit their vulnerabilities. However, it should be noted that advanced hacking skills and domain knowledge are mandatory in order to carry out the described attacks.
6.1. Smart Home and HVAC Hijacking Attack Scenarios
In this use case (UC1), the attacker successfully exploits the vulnerabilities in temperature regulation systems and their sensors. The ultimate target represents the HVAC system, which represents the last link in a chain of devices. As already mentioned, the attacker must gain control over the internet system of the smart home. Then, the attacker must find a way to compromise the gateway of a single smart home. Afterwards, she injects a payload to obtain operational access in the corresponding HEMS system. Finally, by controlling HEMS, instructions can be sent to the targeted HVAC system. The overall attack steps are depicted in
Figure 4.
6.1.1. Attack Scenario 1.1—Hijack Heating
In case the attacker gains control over the heating, she can manipulate the internal thermal sensors at will. The heating can be switched on and off, which eventually leads to discomfort and might cause health issues for inhabitants. Furthermore, extreme overheating can cause irreparable damage to the smart home system or surrounding devices.
6.1.2. Attack Scenario 1.2—Hijack HVAC
In addition to manipulating the heating, a remote attacker can affect ventilation and air conditioning in smart homes as well. By assuming control over the HVAC system, she is able to cause a temperature overload in the system. In this way, the system can be damaged and increases the power consumption. A known intrusion against the HVAC system, called HVACKer [
60], relies on an already installed malware in order to manipulate temperature settings. This attack exploits a vulnerability that is caused by the lack of insights about thermal communication protocols.
6.2. Smart Home and Smart Meter Hijacking Attack Scenarios
The attack in this use case (UC2) exploits vulnerabilities in a household’s smart meters. As already mentioned, this SG device gathers information about energy consumption and monitors user behavior, which is displayed at the IHD interface. In turn, this private information can be linked to real persons on the internet. In our case, we chose a setup where the SM is connected via the HAN to the gateway. In our scenario, the attacker gains via the gateway access to the SM. Afterwards, she is able to interfere with the smart homes’ energy consumption in different ways. The use case for this attack is shown in
Figure 5.
6.2.1. Attack Scenario 2.1—Fraud
In this case, the attacker alters the SM of another smart home in the local network. Subsequently, she increases a neighbor’s power consumption and simultaneously decreases her own. By balancing the energy expenditure in the local network, the attacker conceals the committed fraud at the cost of the neighbor.
6.2.2. Attack Scenario 2.2—Decrease Bill
If the attacker compromises her own SM or concentrator, she might decrease her recorded energy consumption. In this way, the attacker decreases her bill without changing her consumption habits.
6.2.3. Attack Scenario 2.3—Increase Bill
The attacker compromises the SM that is responsible for collecting information about the energy consumption of another user. Therefore, the expenditure of the unsuspecting victim is increased for the time being.
6.2.4. Attack Scenario 2.4—Increase Bill, no Alarm
Similar to the previous case, the attacker hijacks a victim’s SM and alters its consumption for the worst. However, in this scenario, the victim is never alerted about this issue, eventually causing long-lasting consequences.
6.3. Smart Grid and Black-Out Attack Scenarios
The next use case (UC3) differs from the above two scenarios since the attacker targets the main distribution grid. The DMS executes control over a number of distinctive SG devices, which manage and measure energy distribution and exchange information between individual grid components. The goal of this highly sophisticated attack is to disrupt the functionality or to cause a breakdown of the parts designed for islanding and which are supported by storage units. In the most severe case, the attack leads to a complete black-out in an area of the grid network. In order to achieve this ambitious goal, the attacker must get control over the decentralized energy generation and local storage devices. In addition, the attacker must access the switchgear devices to disconnect this section from the grid as well as to disable the monitoring devices to remain unnoticed by the grid control center. In general,
Figure 6 depicts an abstract overview of this attack scenario.
6.3.1. Attack Scenario 3.1
This scenario covers the aspect of manipulating various sensor values without attacking the implemented control functionality itself. After the attacker gained access to the ESB, she proceeds further by trying to confiscate the WAMS and, respectively, use it as gateway to perform a lateral movement to the connected PMUs and PQMs. Besides that, the same appears for SCADA and the connected components RTU, SwG and PED. By doing so, the possibility is given that the SCADA initiates the island mode in order to ensure further functionality. From this moment on, the attacker can proceed in one of the following direction.
Sub scenario 3.1.1
The attacker manipulates the PED to send a message to the SCADA system that it is fully charged, while in fact, the storage units are empty. The metering devices, PMU and PQM, are also targeted, and they report a power undervoltage or bad quality. This will then lead to the attacker’s goal–the SCADA system will initiate islanding in that section by opening the SwG.
Sub scenario 3.1.2
The first steps of this scenario is the same as in the previous scenario. Instead of manipulation of the PMUs and PQMs sensor values, this scenario includes the manipulation of the WAMS functionality, where the power undervoltage telegrams are delivered to the control center.
Sub scenario 3.1.3
In this scenario, the attacker manipulates the RTU of a PED in order to report that the latter is fully charged. The rest of the attack proceeds similarly to scenario 3.1.1, where the PMU and PQM both report undervoltage, and SCADA issues a command to open the SwG.
Sub scenario 3.1.4
The first steps of this scenario are the same as in the scenario 3.1.3. Instead of manipulation of the PMUs and PQMs sensor values, the WAMS functionality is manipulated, and the power undervoltage telegrams are delivered to the control center.
6.3.2. Attack Scenario 3.2
The first few steps of this scenario are similar to the previous example. After the attacker gains access to the ESB network, she proceeds further to the SCADA system and to the connected components RTUs and PED.
Sub scenario 3.2.1
Here, the attacker gathers information about the status of PED by sniffing the Modbus TCP/IP. Then she interrupts the connection to the PMU2, PQM2 and PED by jamming the communication lines so that no status info is transferred to the control center. In the aftermath, the compromised RTU issues a command to open the SwG when the battery of the PED is empty.
Sub scenario 3.2.2
Another option after obtaining information about the status of the PED would be to jam the SCADA system altogether. The RTU will send a SwG open command when the battery is empty.
Sub scenario 3.2.3
Instead, to access the Modbus TCP/IP, the attacker can focus on the IEC 60870_5_104 in order to gather information on PED’s status. In the aftermath, the attacker is capable of disabling the status transfer from PMU2, PQM2 and PED by jamming them. The RTU connected to the SwG behaves in the same way as in the above examples.
Sub scenario 3.2.4
This case is similar to the previous example with the difference that the attacker jams the SCADA system directly instead of the metering and PED control devices.
6.3.3. Attack Scenario 3.3
The first few steps of this scenario are similar to the previous examples. After the attacker gains access to the ESB network, she proceeds further to the WAMs and the SCADA system and the connected components, the PMUs and PQMs, the RTUs and the PED. However, in this case, the attacker is waiting for an undervoltage event by the grid itself. If such an event occurs, the attacker switch of the PV and triggers the battery loading. In this scenario, the attacker gathers information about the status of the grid and the status of the PED by sniffing.
Sub Scenario 3.3.1 In this scenario, the attacker gathers information about the status of PED by sniffing the Modbus TCP/IP. Additionally, the attacker gathers the information about the status of the grid itself by sniffing the PMU2 and PQM2 measurement values. If the attacker detects an undervoltage event and the possibility to load the batteries, the attacker will trigger the battery load process.
Sub Scenario 3.3.2 Instead, to access the Modbus TCP/IP, the attacker can focus on the IEC 60870_5_104 in order to gather information on the PED’s status, and the stability info about the grid is directly collected via the WAMS.
6.3.4. Attack Scenario 3.4
Instead of targeting the different devices, the attacker launch a direct attack on the SCADA system. By doing so, the attacker can trigger via the SCADA system the event to open the SwG and send the battery load command to the PED.
6.4. Exploitation Probability Assessment
In order to effectively address the different threats, and to model detected vulnerabilities, an assessment of the system components from the exploitation probability point of view is very useful. This is reflected in the fact that different vulnerabilities have different security protection mechanisms in place, and that probability to exploit such vulnerabilities differs. The risk assessment of system components outlined by Marksteiner et al. [
42] was obtained by the organization responsible for the specific component. In similar approaches proposed by Mohsin et al. [
61] and Krivokuca et al. [
56] exploitation probabilities were defined through extensive literature research. Their work proposes a new methodology for quantifying the likelihood of the compromise of a cyber component of SG, and includes risk assessment based on direct or indirect impact of the breach.
In our approach, the CVSS tool is adopted for the calculation of exploitation probabilities, with certain methodology modifications compared to the existing approaches. The first step is a mapping of the components in use and their interrelation at the evaluated environment, based on the threats obtained by the threat modeling process of the specified use cases.
The CVSS tool have several modules available, where the base score module, according to Wadhawan et al., provides a good basis for the calculation of the probability of an attack. Base score module have three sub-modules that can be used for calculating probabilities: exploitability, scope and impact sub-modules. Exploitability sub-module reflects how easily a vulnerability can be exploited, while the scope and impact sub-modules quantify the consequences of a successful exploit.
In contrast to [
62], our work takes into account, apart from exploitability of the sub-module, also the core and impact sub-modules, because in penetrating the smart grid, these impact-related parameters are also in the focus of an attacker and, therefore, should be part of the calculation.
The exploitability sub-module takes into account:
The attack vector—reflects the context by which a vulnerability can be exploited;
The attack complexity—outlines how much effort in the preparation or execution of the attack against a vulnerable component the attacker have to invest;
Privileges required—denote the level of privileges an attacker must obtain in order to successfully attack a component;
User interaction—if another human user must be involved for a successful attack.
The scope sub-module rates if a vulnerability in one asset affects other assets, which are outside of this security authority.
The impact sub-module takes into account the CIA Triade:
Confidentiality—to what extent confidentiality is affected;
Integrity—refers to the trustworthiness and correctness;
Availability—rates the impact of a successful attack to the availability of the affected component.
For less complex attacks, the base metric score is higher because such an attack have a higher likelihood. The score obtained from the CVSS system in range 1–10, and is normalised to the range 0–1 for further calculations. In
Table 3,
Table 4 and
Table 5, the exploitation probabilities related to the different threats and for the different use cases are listed.
7. Risk Analysis Using Formal Methods
One of the methods to detect weaknesses and possible vulnerabilities at an early stage is formal verification. Available probabilistic formal verification tools, that found their application in risk analysis, are described at the beginning of this section.
Selected model checker, PRISM, is applied on the three different use cases, in order to perform formal risk analysis and to obtain an indication on how safety and security requirements can be fulfilled within a given environment. Within each use case, several example attack scenarios are modeled. The modeled attacks scenarios are selected from the scenarios outlined in
Section 6. This section includes a description of modeled use cases and scenarios, and resulting attack probabilities.
7.1. Formal Methods Overview
Formal verification relies on a diverse set of mathematical and logical methods. These methods can be used to check different parts of a system, including the functional correctness of implementations, programming bugs, hardware Trojans, and security properties, and they can provide both a qualitative and quantitative analysis [
63,
64,
65,
66].
A survey of probabilistic model checking, including the main probabilistic models, algorithms and abstraction techniques is given in [
67], while more details can also be found in [
68,
69]. In general, there are several different formalisms with difference in the notion of time. Those formalisms can be either non-deterministic or deterministic. When it comes to the notion of time, discrete-time models and continuous-time models have to be distinguished. The basic probabilistic model is the discrete-time Markov chain (DTMC), a deterministic model for discrete time. Its continuous version is called continuous-time Markov chain (CTMC). The Markov decision process (MDP) extends the discrete-time Markov chain with non-determinism. Similarly, its continuous version is called continuous-time Markov decision process (CTMDP). Originally, the MDP was introduced as probabilistic automata (PA). MDP and PA are very similar, with the small difference, that PA allows internal non-determinism, while MDP does not. Probabilistic timed automata (PTA) can be considered as MDP with clock variables. The final probabilistic model, Markov Automata (MA), is a generalization of interactive Markov chains and MDPs, and it is able to express discrete randomness. The selection of probabilistic model depends on the nature of modeled system and processes.
There is a variety of formal verification tools available, covering different aspects. While classic verification gives answers to questions such as “Will a given assertion ever be violated?”, and focus on
qualitative properties, the evaluation of dependability aspects such as, e.g., reliability, availability and performance need a focus on
quantitative properties and models, including probabilistic behavior and real-time aspects [
70]. An extensive overview of quantitative verification, including its different formalisms, modeling languages, properties and verification approaches is given in [
70]. The main approaches for quantitative verification are probabilistic model checking and statistical model checking. There is a wide variety of tools with such a focus, including FACT (
https://www-users.cs.york.ac.uk/~cap/FACT/, accessed on 31 May 2021), MODEST (
http://www.modestchecker.net/, accessed on 31 May 2021), MRMC (
http://mrmc-tool.org/, accessed on 31 May 2021), PASS (
https://depend.cs.uni-saarland.de/tools/pass/, accessed on 31 May 2021), PARAM (
https://depend.cs.uni-saarland.de/tools/param/, accessed on 31 May 2021), PRISM (
http://www.prismmodelchecker.org/, accessed on 31 May 2021), UPPAAL (
http://www.uppaal.org/, accessed on 31 May 2021), STORM (
https://www.stormchecker.org/, accessed on 31 May 2021). The different tools focus on different parts of qualitative model checking. This section describes in more detail the most commonly used tools in the literature–UPPAAL and PRISM, and the most recent tool STORM, and discusses the reasons for the selection of PRISM for the following experiments.
7.1.1. PRISM
The
probabilistic model checker PRISM, developed at the University of Birmingham, focuses on quantitative verification in a wide area of application domains including wireless communication protocols, quantum cryptography and systems biology [
65,
71,
72]. It supports probabilistic models such as DTMCs, CTMCs, MDPs, PAs, and PTAs, including extensions of these models with costs and rewards. Its state-based input language is based on the Reactive Models formalism of Alur and Henzinger [
73].
The tool uses symbolic data structures and algorithms based on Binary Decision Diagrams and Multi-Terminal Binary Decision Diagrams. It has a discrete-event simulation engine providing support for approximation/statistical model checking including different analysis techniques as quantitative abstraction refinement and symmetry reduction.
7.1.2. UPPAAL
The
toolbox UPPAAL was developed by the Department of Information Technology at Uppsala University in Sweden, in cooperation with the Department of Computer Science in Aalborg University in Denmark for the verification of real-time systems [
74,
75]. It is intended for systems modeled as a collection of non-deterministic processes with finite control structure and real-valued clocks, communicating through channels or shared variables. The model checker is based on the theory of timed automata especially suited for checking invariant and reachability properties. UPPAAL SMC (
http://people.cs.aau.dk/~adavid/smc/, accessed on 31 May 2021) [
76,
77] (UPPAAL Statistic Model Checking) is an extension of UPPAAL, used for performance property analysis of networks of priced timed automata. Priced timed automata are timed automata whose clocks can be modeled with different rates in different locations.
7.1.3. STORM
The
probabilistic model checker STORM has been developed at the RWTH Aachen University, Germany for the analysis of systems involving random or probabilistic phenomena [
78,
79]. It is especially suited for checking quantitative aspects of models, e.g., security in randomized key generation, systems biology or embedded systems. STORM supports several different input languages, and has a modular set-up allowing to exchange solvers and symbolic engines easily. STORM supports several models as DTMCs, CTMCs, MDPs and MAs. It focuses on reachability queries and its supports, including probabilistic computation tree logic, continuous stochastic logic, expected rewards, long-run average rewards, conditional probabilities and multi-objective model checking.
7.1.4. Comparison of Probabilistic Model Checkers
A comparison of the described model checkers’ capabilities, and their technical details are given in
Table 6. A comparison of features is presented in
Table 7.
An extensive comparison between the tools UPPAAL and PRISM is given in [
80]. The authors used timed automata and a benchmark study for the modeling and verification in both tools. Another comparison of several tools for probabilistic model checking is given in [
70]. This study also includes the tools PRISM and STORM. The authors state that STORM is clearly the most versatile tool. STORM covered all formalism considered in the most of competition. The authors conclude that PRISM and STORM tools support the widest range of properties, comparing to wide variety of available tools. Moreover, they have a wide range of algorithms implemented. On the other hand, the authors state that the PRISM is the most commonly used tool in research, due to its extensive online documentation, the graphical user interface and since it is independent on the platform used.
Considering all discussed aspects in this section, the PRISM tool is selected for the following experiments.
7.2. UC1: Smart Home and HVAC Hijacking
7.2.1. Probabilistic Model Generation
Figure 7 shows the configuration analyzed in UC1. The system is modeled in the PRISM model checker as MDP (Markov Decision Process) because of the non-deterministic nature of cyber-attacks.
An attack in the modeled system usually leaves traces in a form of unusual values. The response of the system is defined through service policies:
A1 policy: If controller HEMS receives a low temperature reading from sensor ST, it sends a command to actuator A1 to start the heating process;
A2 policy: If controller HEMS receives a high temperature reading from sensor ST, it sends a command to actuator A2 to start the cooling process;
ST policy: ST sends regularly temperature readings to HEMS.
In the modeling process it is assumed that an attacker actively attacks the system, and has skills and means to perform certain attacks by exploiting existing vulnerabilities. An attacker’s skills are measured through the maximum number of vulnerabilities that he can try to exploit in one attack scenario—the cost value. For example, the attacker’s skill level in range one to five () means that a less skilled attacker is able to exploit only one vulnerability in one attack scenario, while a more skilled attacker can exploit up to five vulnerabilities at the same time in one attack scenario.
The threat modeling and attack modeling processes identified the minimum set of vulnerabilities that can be exploited in order to perform a HVAC hijack attack.
Table 8 presents the list of vulnerabilities, which are linked to the threats from
Table 2. It is assumed that the attacker is aware of these vulnerabilities, and that the exploitation of at least one vulnerability is necessary in order to successfully carry out an attack. The model also implies that in one iteration the choice of vulnerabilities that are going to be exploited is random. All listed vulnerabilities have defined exploitation probabilities, described in more detail in
Section 6. The exploitation probability is the likelihood that an attempt to exploit that particular vulnerability is going to be performed and successful, under previously given assumptions.
The next step, after the system modeling is completed, is the definition of the attack properties. These properties are the formal definition and precondition of the successful attempt of an attack within the modeled system. The properties are defined by using the Probabilistic Computation Tree Logic (PCTL) [
81], embedded in the PRISM model checker. The formal verification of the defined attack properties results in the maximum likelihoods of successful attack attempt–risk exposure scores.
Table 9 describes the modeled attack properties.
7.2.2. Results
The results–risk exposure scores are presented in
Figure 8.
Table 10 presents the obtained values of risk exposure scores, under the previously described assumptions.
The presented results show the maximum likelihood of a successful attempt of the attack, considering different cost values. Considering that the goal of an attacker is to carry out an attack by exploiting the smallest amount of vulnerabilities, the presented analysis considers cases where the number of exploited vulnerabilities is in range one to five ().
The results show that the attack 1.2 (hijack HVAC) is less likely to be successful comparing to the attack 1.1 (hijack heating). This is due to the fact that in order to successfully conduct attack 1.2 more vulnerabilities need to be exploited. The attack 1.1 requires exploitation of two vulnerabilities, while the attack 1.2 requires exploitation of at least three vulnerabilities to be successful.
7.3. UC2: Smart Home and Smart Meter Hijacking
7.3.1. Probabilistic Model Generation
The UC2 configuration is presented in
Figure 9. Similarly to the previous use case, the system is modeled in the PRISM model checker as an MDP process.
The following service policies, reflecting the system response, permeate through the system model:
SM1/2 policy: Smart meters SM1 and SM2 measure the power consumption and notify IHD in near real time, and MDMS periodically (every 15 min);
MDMS policy: The MDMS is periodically updated, and checks the consistency of the consumption/billing in the neighborhood;
Service Cloud policy: The MDMS is periodically polled with the credentials provided by customer;
User policy: The service cloud periodically notifies the user about the power consumption;
Maintenance policy: The service cloud notifies responsible actors in case of a consumption inconsistency.
Similarly to the first use case, it is assumed that an attacker actively attacks the system, and that he has skills and means to perform a certain attack by exploiting existing vulnerabilities.
The minimum set of vulnerabilities that can be exploited in order to perform a described attack, identified by the threat modeling and attack modeling processes, is presented in
Table 11. The system is modeled with the assumptions similar to UC1 – the attacker identified vulnerabilities, and the exploitation of one or more vulnerabilities is necessary in order to successfully carry out an attack. Exploitation probabilities are defined for all listed vulnerabilities, and presented in
Table 11.
The attack properties, similarly to UC1, are defined using the PCTL.
Table 12 describes modeled attack properties, with different impacts (medium and high).
7.3.2. Results
Figure 10 presents the results–risk exposure scores for the modeled system and attack properties.
Table 13 presents the resulting values of the risk exposure score.
Similarly to UC1, the presented analysis considers cases where the number of exploited vulnerabilities is in the range one to five ().
The results show that the attack 2.1 (fraud) has the least likelihood to be successful, under given assumptions. Attack 2.1 requires the exploitation of at least three vulnerabilities, while the other three scenarios considered in this use case can be conducted by exploiting only two vulnerabilities. Attack 2.1 requires the exploitation of at least five vulnerabilities for maximum likelihood, attack 2.2 requires exploitation of three, while attacks 2.3 and 2.4 only require the exploitation of two vulnerabilities for the maximum likelihood. It has to be emphasized that although both attacks 2.3 (or 2.2) and 2.4 require the exploitation of a minimum of two vulnerabilities to be successful, the risk exposure scores of 2.4 are lower because this attack requires the exploitation of parts of the system that have a higher security level (reflected in the lower exploitation probability).
7.4. UC3: Smart Grid and Black-Out Attack
7.4.1. Probabilistic Model Generation
Configuration analyzed in UC3 is presented on
Figure 11.
The system response is defined through the following service policies:
PQM/PMU policy: PQM/PMU send regularly Grid Stability (GS) status to WAMS;
WAMS policy: Based on PQM/PMU readings WAMS sends GS value to SCADA; GS value is considered available when at least one PQM and at least on PMU readings are available;
PED policy: PED sends its status to SCADA via RTU, upon request;
SCADA policy: SCADA initiates island mode for the network segment based on GS and PED readings;
SwG actuator policy: SwG opens when island mode is initiated by SCADA.
Table 14 presents the minimum set of vulnerabilities that can be exploited in order to perform described attacks, identified by the threat modeling and attack modeling processes.
The modeled attack properties are described in
Table 15. Modeled attacks include four attack scenarios selected from the attack scenarios described in
Section 6 as the most representative ones. One additional attack scenario,
Grid stability unavailable/jammed, is modeled because it is a part of an other described scenarios as middle step (e.g., 3.2.1, 3.2.3), but it has final outcome and impact, completely masking GS value for the rest of the system.
7.4.2. Results
The resulting risk exposure scores are graphically presented on
Figure 12, and given in
Table 16.
The results show that none of the considered attacks can be successfully conducted by exploiting only one vulnerability. Attacks 3.1.1, 3.1.2 and 3.3 need at least two vulnerabilities exploitations, while attack 3.2.2 requires four and attack 3.2.1 requires five vulnerabilities exploitations. The attack GS jammed has the highest likelihood, due to the fact that it is more simple from the attacker point of view. Additionally, the modeled attack sub scenarios from scenario 3.2 have lower risk exposure scores comparing 3.1 sub scenarios because these attacks require the exploitation of parts of the system that have a higher security level, such as SCADA, reflected in the lower exploitation probability.
8. Conclusions and Discussion
In this paper, we addressed persistent security issues in modern power energy systems. For this sake, we presented a methodology for conducting a risk assessment for cyber attacks in SGs. The assessment takes into consideration the technological aspects of the SG architecture. According to that, we developed a threat model from our research templates from the energy and IoT domains, respectively. Based on the identified threats, we introduced several attack scenarios, which exploit the inferred vulnerabilities. Therefore, we estimated the probability of such exploitations based on CVSS. Afterwards, a formal model of the system was implemented in the form of a Markov Decision Process. This model integrates the attacker behavior and vulnerabilities with the exploitation probabilities. In turn, we applied a probabilistic model checker to verify our model. The obtained results yield to the risk exposure scores for different attack scenarios.
With our methodology, we were able to identify 1137 possible threats that fit our scenarios. It is important to note that our calculations are drawn from just 2% of that number. Furthermore, our results provide information on the exposure of individual devices in the SG system. In this way, prevention mechanisms can be applied to prevent such scenarios. This is especially important in dynamic systems that are under limited control of their owners. With this paper, we tackle an important problem in the field of SG security, namely, the lack of general and automatized approaches. For this sake, we provide a reusable methodology for the calculation of exploitation probabilities in complex systems, as one of the novelties of our approach. An additional contribution of our paper is an extensive analysis of the relevant literature in the smart grid domain, including stochastic modeling of cyber attacks, cyber security and formal verification. We also include a detailed comparison between existing formal verification tools.
Our results show that in a smart home environment, an attacker needs to exploit at least two vulnerabilities to successfully perform an attack, and that more complex attack scenarios requires successful exploitation of at least three vulnerabilities. The results of the risk analysis of the smart grid use case also show that none of the considered attacks can be successfully conducted by exploiting only one vulnerability. Some attack scenarios need to exploit at least two vulnerabilities, while some requires at least five vulnerabilities to be exploited. Additionally, the modeled attack scenarios in a smart grid system have lower risk exposure scores comparing to the smart home scenarios because these attacks require the exploitation of parts of the system that have a higher security level, like SCADA, reflected in the lower exploitation probability. These results clearly indicate that all use cases could benefit from a layered security approach, that includes several protection mechanisms in place.
In the future, we want to introduce automation to the individual layers of our methodology. In practice, processes at each level in the hierarchy of the SG system should be automatized. This can be established, for example, by coupling with other applications, like security scanners or testing tools. Furthermore, the conducted assessment should be extended to comprehend other identified threats. The coupling of our approach with common vulnerability exploitation approach represents another challenge . Since our scenarios do not consider implemented countermeasures, applying defense strategies would lead to other assessment results. In addition to that, the methodology provides guidance to address bigger and more complex scenarios. For example, it can be applied in order to address security in smart cities. Since the formal risk analysis differs with respect to applied model checkers, gaining results from other checkers is of interest as well.
Besides technological challenges for secure SG systems, regulatory implications must be considered as well. Initially, the centralized structure of the electric system left the grid exposed to damage in terms of security and safety [
23]. The progressing use of IT results in greater diversity and a decentralized system structure [
27]. In this way, security issues are diminished by distributing the danger to multiple devices. However, different devices are owned by non-utility stakeholders with different technology choices. This means that security of the overall grid is not imposed by a single organization with a common policy [
3]. In fact, the existence of different regulative standards causes confusion with regard to best practices in handling security issues [
82]. For this sake, a common framework for critical infrastructure is needed, which provides common guidelines for individual organizational profiles [
83].
Author Contributions
Conceptualization, H.V., B.S., J.B. and K.H.-S.; methodology, B.S., H.V. and J.B.; software, B.S.; validation, H.V., B.S. and K.H.-S.; formal analysis, B.S.; investigation, J.B., K.H.-S., B.S. and H.V.; data curation, H.V. and B.S.; writing—original draft preparation, H.V., B.S., J.B. and K.H.-S.; visualization, H.V., B.S. and J.B.; project administration, H.V., B.S., J.B. and K.H.-S.; funding acquisition, H.V. and B.S. All authors have read and agreed to the published version of the manuscript.
Funding
This research has received funding from the European Union’s Horizon 2020 research and innovation programme under grant agreement No 773715, Project RESOLVD H2020-LCE-2017-SGS, and under grant agreement No 830892, Project SPARTA–H2020-SU-ICT-2018-2.
Institutional Review Board Statement
Not applicable.
Informed Consent Statement
Not applicable.
Conflicts of Interest
The authors declare no conflict of interest. The funders had no role in the design of the study; in the collection, analysis, or interpretation of data; in the writing of the manuscript, or in the decision to publish the results.
References
- Dharmesh, F.; Nestoras, C.; Vlachou, S.; Kalopoulou, O.; Leandros, M. Cybersecurity in smart grids, challenges and solutions. AIMS Electron. Electr. Eng. 2021, 5, 24–37. [Google Scholar]
- NIST Framework and Roadmap for Smart Grid Interoperability Standards, Release 1.0. NIST Spec. Publ. 2010, 1108, 1–145.
- Gopstein, A.; Nguyen, C.; O’Fallon, C.; Wollman, D.; Hasting, N. NIST Framework and Roadmap for Smart Grid Interoperability Standards, Release 4.0. NIST Spec. Publ. 2021, 1108r4, 8. [Google Scholar]
- Global Smart Grid Projections for 2020-IEEE Innovation at Work. Available online: https://innovationatwork.ieee.org/global-smart-grid-projections-for-2020/ (accessed on 9 March 2021).
- Butt, O.M.; Zulqarnain, M.; Butt, T.M. Recent advancement in smart grid technology: Future prospects in the electrical power network. Ain Shams Eng. J. 2021, 12, 687–695. [Google Scholar] [CrossRef]
- Metke, A.R.; Ekl, R.L. Smart Grid security technology. In Proceedings of the Innovative Smart Grid Technologies (ISGT), Gaithersburg, MD, USA, 19–21 January 2010. [Google Scholar]
- El Mrabet, Z.; Kaabouch, N.; El Ghazi, H.; El Ghazi, H. Cyber-security in smart grid: Survey and challenges. Comput. Electr. Eng. 2018, 67, 469–482. [Google Scholar] [CrossRef]
- Lee, R.M.; Assante, M.J.; Conway, T. Analysis of the Cyber Attack on the Ukrainian Power Grid; SANS Industrial Control Systems: Washington, DC, USA, 2016. [Google Scholar]
- Goel, S.; Hong, Y. Security Challenges in Smart Grid Implementation. In Smart Grid Security; SpringerBriefs in Cybersecurity; Springer: London, UK, 2015. [Google Scholar]
- Paté-Cornell, M.E.; Kuypers, M.; Smith, M.; Keller, P. Cyber Risk Management for Critical Infrastructure: A Risk Analysis Model and Three Case Studies. Risk Anal. 2018, 38, 226–241. [Google Scholar] [CrossRef] [PubMed]
- Di Pinto, A.; Dragoni, Y.; Carcano, A. TRITON: The First ICS Cyber Attack on Safety Instrument Systems. Black Hat USA 2018, 2018, 1–26. [Google Scholar]
- Khan, R.; Maynard, P.; McLaughlin, K.; Laverty, D.; Sezer, S. Threat Analysis of BlackEnergy Malware for Synchrophasor based Real-time Control and Monitoring in Smart Grid. In Proceedings of the 4th International Symposium for ICS & SCADA Cyber Security Research 2016 (ICS-CSR), Belfast, UK, 23–25 August 2016. [Google Scholar]
- Kao, D.Y.; Hsiao, S.C. The Dynamic Analysis of WannaCry Ransomware. In Proceedings of the International Conference on Advanced Communications Technology (ICACT), Chuncheon, Korea, 11–14 February 2018; pp. 159–166. [Google Scholar]
- Wannacry Ransomware. Available online: https://www.europol.europa.eu/wannacry-ransomware (accessed on 9 March 2021).
- Han, Q.; Molinaro, C.; Picariello, A.; Sperli, G.; Subrahmanian, V.S.; Xiong, Y. Generating Fake Documents using Probabilistic Logic Graphs. IEEE Trans. Dependable Secur. Comput. 2021. [Google Scholar] [CrossRef]
- Esposito, C.; Moscato, V.; Sperlí, G. Trustworthiness Assessment of Users in Social Reviewing Systems. IEEE Trans. Syst. Man Cybern. Syst. 2021. [Google Scholar] [CrossRef]
- Common Vulnerability Scoring System SIG. Available online: https://www.first.org/cvss/ (accessed on 17 May 2021).
- Langer, L.; Smith, P.; Hutle, M. Smart grid cybersecurity risk assessment. In Proceedings of the International Symposium on Smart Electric Distribution Systems and Technologies (EDST), Vienna, Austria, 8–11 September 2015; pp. 475–482. [Google Scholar]
- Jauhar, S.; Chen, B.; Temple, W.G.; Dong, X.; Kalbarczyk, Z.; Sanders, W.H.; Nicol, D.M. Model-Based Cybersecurity Assessment with NESCOR Smart Grid Failure Scenarios. In Proceedings of the 21st Pacific Rim International Symposium on Dependable Computing (PRDC), Zhangjiajie, China, 18–20 November 2015; pp. 319–324. [Google Scholar] [CrossRef]
- Lee, A. Electric Sector Failure Scenarios and Impact Analyses-Version 3.0; National Electric Sector Cybersecurity Organization Resource (NESCOR) Technical Working Group: Palo Alto, CA, USA, 2015. [Google Scholar]
- Pillitteri, V.Y.; Brewer, T.L. Guidelines for Smart Grid Cybersecurity. NIST Interagency/Internal Report (NISTIR)-7628 Rev 1; National Institute of Standards and Technology: Gaithersburg, MD, USA, 2014.
- Salehi Dobakhshari, A.; Ranjbar, A.M. A Novel Method for Fault Location of Transmission Lines by Wide-Area Voltage Measurements Considering Measurement Errors. IEEE Trans. Smart Grid 2015, 6, 874–884. [Google Scholar] [CrossRef]
- Rao, N.S.V.; Poole, S.W.; Ma, C.Y.T.; He, F.; Zhuang, J.; Yau, D.K.Y. Defense of Cyber Infrastructures Against Cyber-Physical Attacks Using Game-Theoretic Models. Risk Anal. 2016, 36, 694–710. [Google Scholar] [CrossRef] [PubMed]
- Gao, J.; Bai, H.; Wang, D.; Wang, L.; Huo, C.; Hou, Y. Rapid Security Situation Prediction of Smart Grid Based on Markov Chain. In Proceedings of the 3rd Information Technology Networking, Electronic and Automation Control Conference (ITNEC), Chengdu, China, 15–17 March 2019; pp. 2386–2389. [Google Scholar] [CrossRef]
- Hao, J.; Kang, E.; Sun, J.; Wang, Z.; Meng, Z.; Li, X.; Ming, Z. An Adaptive Markov Strategy for Defending Smart Grid False Data Injection From Malicious Attackers. IEEE Trans. Smart Grid 2018, 9. [Google Scholar] [CrossRef]
- Leszczyna, R. Standards on cyber security assessment of smart grid. Int. J. Crit. Infrastruct. Prot. 2018, 22, 70–89. [Google Scholar] [CrossRef]
- Sun, C.C.; Hahn, A.; Liu, C.C. Cyber security of a power grid: State-of-the-art. Int. J. Electr. Power Energy Syst. 2018, 99, 45–56. [Google Scholar] [CrossRef]
- Soltan, S.; Mittal, P.; Poor, H.V. BlackIoT: IoT Botnet of High Wattage Devices Can Disrupt the Power Grid. In Proceedings of the 27th USENIX Security Symposium, Baltimore, MD, USA, 15–17 August 2018; pp. 15–32. [Google Scholar]
- Pliatsios, D.; Sarigiannidis, P.; Lagkas, T.; Sarigiannidis, A.G. A Survey on SCADA Systems: Secure Protocols, Incidents, Threats and Tactics. IEEE Commun. Surv. Tutor. 2020, 22, 1942–1976. [Google Scholar] [CrossRef]
- Nazir, S.; Patel, S.; Patel, D. Assessing and augmenting SCADA cyber security: A survey of techniques. Comput. Secur. 2017, 70, 436–454. [Google Scholar] [CrossRef]
- Irmak, E.; Erkek, I. An overview of cyber-attack vectors on SCADA systems. In Proceedings of the International Symposium on Digital Forensic and Security (ISDFS), Antalya, Turkey, 22–25 March 2018; pp. 1–5. [Google Scholar] [CrossRef]
- Ghosh, S.; Sampalli, S. A Survey of Security in SCADA Networks: Current Issues and Future Challenges. IEEE Access 2019, 7, 135812–135831. [Google Scholar] [CrossRef]
- Antón, S.D.; Fraunholz, D.; Lipps, C.; Pohl, F.; Zimmermann, M.; Schotten, H.D. Two Decades of SCADA Exploitation: A Brief History. In Proceedings of the 2017 IEEE Conference on Application, Information and Network Security (AINS), Miri, Malaysia, 13–14 November 2017; pp. 98–104. [Google Scholar] [CrossRef]
- McLaughlin, S.; Konstantinou, C.; Wang, X.; Davi, L.; Sadeghi, A.R.; Maniatakos, M.; Karri, R. The Cybersecurity Landscape in Industrial Control Systems. Proc. IEEE 2016, 104, 1039–1057. [Google Scholar] [CrossRef]
- Garcia, L.; Brasser, F.; Cintuglu, M.H.; Sadeghi, A.R.; Mohammed, O.; Zonouz, S.A. Hey, My Malware Knows Physics! Attacking PLCs with Physical Model Aware Rootkit. In Network and Distributed System Security Symposium (NDSS); Internet Society: San Diego, CA, USA, 2017. [Google Scholar]
- Spenneberg, R.; Brüggemann, M.; Schwartke, H. PLC-Blaster: A Worm Living Solely in the PLC. Available online: https://www.blackhat.com/docs/asia-16/materials/asia-16-Spenneberg-PLC-Blaster-A-Worm-Living-Solely-In-The-PLC-wp.pdf (accessed on 31 May 2021).
- Klick, J.; Lau, S.; Marzin, D.; Malchow, J.O.; Roth, V. Internet-facing PLCs-A New Back Orifice. Black Hat USA 2015, 2015, 22–26. [Google Scholar]
- Amini, S.; Mohsenian-Rad, H.; Pasqualetti, F. Dynamic Load Altering Attacks in Smart Grid. In Proceedings of the IEEE Power & Energy Society Innovative Smart Grid Technologies Conference (ISGT), Washington, DC, USA, 18–20 February 2015; pp. 1–5. [Google Scholar] [CrossRef]
- Dvorkin, Y.; Garg, S. IoT-enabled Distributed Cyber-attacks on Transmission and Distribution Grids. In Proceedings of the 2017 Annual North-American Power Symposium (NAPS), Morgantown, WV, USA, 17–19 September 2017; pp. 1–6. [Google Scholar] [CrossRef]
- Li, S.; Yılmaz, Y.; Wang, X. Quickest Detection of False Data Injection Attack in Wide-Area Smart Grids. IEEE Trans. Smart Grid 2015, 6, 2725–2735. [Google Scholar] [CrossRef]
- Cui, S.; Han, Z.; Kar, S.; Kim, T.T.; Poor, H.V.; Tajer, A. Coordinated Data-Injection Attack and Detection in the smart grid: A detailed look at enriching detection solutions. IEEE Signal Process. Mag. 2012, 29, 106–115. [Google Scholar]
- Marksteiner, S.; Vallant, H.; Nahrgang, K. Cyber security requirements engineering for low-voltage distribution smart grid architectures using threat modeling. J. Inf. Secur. Appl. 2019, 49, 102389. [Google Scholar] [CrossRef]
- Li, X.; Liang, X.; Lu, R.; Shen, X.; Lin, X.; Zhu, H. Securing Smart Grid: Cyber Attacks, Countermeasures, and Challenges. IEEE Commun. Mag. 2012, 50, 38–45. [Google Scholar] [CrossRef]
- Rawat, D.B.; Chandra, B. Cyber Security for Smart Grid Systems: Status, Challenges and Perspectives. In Proceedings of the IEEE SoutheastCon, Fort Lauderdale, FL, USA, 9–12 April 2015; pp. 1–6. [Google Scholar] [CrossRef]
- Shapsough, S.; Qatan, F.; Aburukba, R.; Aloul, F.; Al Ali, A.R. Smart Grid Cyber Security: Challenges and Solutions. In Proceedings of the International Conference on Smart Grid and Clean Energy Technologies, Offenburg, Germany, 20–23 October 2015; pp. 170–175. [Google Scholar] [CrossRef]
- Gunduz, M.Z.; Das, R. Analysis of cyber-attacks on smart grid applications. In Proceedings of the International Artificial Intelligence and Data Processing Symposium (IDAP), Malatya, Turkey, 28–30 September 2018; pp. 1–5. [Google Scholar] [CrossRef]
- Yan, Y.; Qian, Y.; Sharif, H.; Tipper, D. A Survey on Cyber Security for Smart Grid Communications. IEEE Commun. Surv. Tutor. 2012, 14, 998–1010. [Google Scholar] [CrossRef]
- Rashid, A.; Hasan, O.; Saghar, K. Formal analysis of a ZigBee-based routing protocol for smart grids using UPPAAL. In Proceedings of the 2015 12th International Conference on High-capacity Optical Networks and Enabling/Emerging Technologies (HONET), Islamabad, Pakistan, 21–23 December 2015; pp. 1–5. [Google Scholar] [CrossRef]
- Odelu, V.; Das, A.K.; Wazid, M.; Conti, M. Provably Secure Authenticated Key Agreement Scheme for Smart Grid. IEEE Trans. Smart Grid 2018, 9, 1900–1910. [Google Scholar] [CrossRef]
- Naseem, S.A.; Eslampanah, R.; Uddin, R. Probability estimation for the fault detection and isolation of pmu-based transmission line system of smart grid. In Proceedings of the 2018 5th International Conference on Electrical and Electronic Engineering (ICEEE), Istanbul, Turkey, 3–5 May 2018; pp. 284–288. [Google Scholar] [CrossRef]
- Uddin, R.; Naseem, S.A.; Iqbal, Z. Formal reliability analyses of power line communication network-based control in smart grid. Int. J. Control. Autom. Syst. 2019, 17, 3047–3057. [Google Scholar] [CrossRef]
- Hamman, S.T.; Hopkinson, K.M.; Fadul, J.E. A Model Checking Approach to Testing the Reliability of Smart Grid Protection Systems. IEEE Trans. Power Deliv. 2017, 32, 2408–2415. [Google Scholar] [CrossRef]
- Garlapati, S.K.R. Enabling Communication and Networking Technologies for Smart Grid. Ph.D. Thesis, Virginia Tech, Blacksburg, VA, USA, 2014. [Google Scholar]
- Bashar, A.; Muhammad, S.; Mohammad, N.; Khan, M. Modeling and Analysis of MDP-based Security Risk Assessment System for Smart Grids. In Proceedings of the 2020 Fourth International Conference on Inventive Systems and Control (ICISC), Coimbatore, India, 8–10 January 2020; pp. 25–30. [Google Scholar] [CrossRef]
- Diovu, R.C.; Agee, J.T. Quantitative analysis of firewall security under DDoS attacks in smart grid AMI networks. In Proceedings of the 2017 IEEE 3rd International Conference on Electro-Technology for National Development (NIGERCON), Owerri, Nigeria, 7–10 November 2017; pp. 696–701. [Google Scholar] [CrossRef]
- Krivokuća, S.; Stojanović, B.; Hofer-Schmitz, K.; Nešković, N.; Nešković, A. Smart Water Distribution System Communication Architecture Risk Analysis Using Formal Methods. In Proceedings of the 2020 28th Telecommunications Forum (TELFOR), Belgrade, Serbia, 24–25 November 2020; pp. 1–4. [Google Scholar] [CrossRef]
- Shostack, A. Threat Modeling: Designing for Security; John Wiley & Sons: Indianapolis, IN, USA, 2014. [Google Scholar]
- Microsoft Threat Modeling Tool. Available online: https://docs.microsoft.com/en-us/azure/security/develop/threat-modeling-tool (accessed on 26 April 2021).
- LeBlanc, D.; Howard, M. Writing Secure Code; Microsoft Press: Redmond, DC, USA, 2014. [Google Scholar]
- Mirsky, Y.; Guri, M.; Elovici, Y. HVACKer: Bridging the Air-Gap by Attacking the Air Conditioning System. arXiv 2017, arXiv:1703.10454. [Google Scholar]
- Mohsin, M.; Sardar, M.U.; Hasan, O.; Anwar, Z. IoTRiskAnalyzer: A Probabilistic Model Checking Based Framework for Formal Risk Analytics of the Internet of Things. IEEE Access 2017, 5, 5494–5505. [Google Scholar] [CrossRef]
- Wadhawan, Y.; AlMajali, A.; Neuman, C. A Comprehensive Analysis of Smart Grid Systems against Cyber-Physical Attacks. Electronics 2018, 7, 249. [Google Scholar] [CrossRef]
- Keerthi, K.; Roy, I.; Hazra, A.; Rebeiro, C. Formal Verification for Security in IoT Devices. In Security and Fault Tolerance in Internet of Things; Springer: Cham, Switzerland, 2019; pp. 179–200. [Google Scholar]
- Basin, D.; Cremers, C.; Meadows, C. Model Checking Security Protocols. In Handbook of Model Checking; Springer: Cham, Switzerland, 2018; pp. 727–762. [Google Scholar]
- Kwiatkowska, M.; Norman, G.; Parker, D. PRISM: Probabilistic Symbolic Model Checker. In International Conference on Modelling Techniques and Tools for Computer Performance Evaluation; Springer: Berlin/Heidelberg, Germany, 2002; pp. 200–204. [Google Scholar]
- Hofer-Schmitz, K.; Stojanović, B. Towards formal verification of IoT protocols: A Review. Comput. Netw. 2020, 174, 107233. [Google Scholar] [CrossRef]
- Katoen, J.P. The Probabilistic Model Checking Landscape. In Proceedings of the 31st Annual ACM/IEEE Symposium on Logic in Computer Science LICS’16, New York, NY, USA, 5–8 July 2016; Association for Computing Machinery: New York, NY, USA, 2016; pp. 31–45. [Google Scholar] [CrossRef]
- Bartels, F.; Sokolova, A.; de Vink, E. A hierarchy of probabilistic system types. Theor. Comput. Sci. 2004, 327, 3–22. [Google Scholar] [CrossRef]
- Hartmanns, A.; Hermanns, H. In the quantitative automata zoo. Fundamentals of Software Engineering (selected papers of FSEN 2013). Sci. Comput. Program. 2015, 112, 3–23. [Google Scholar] [CrossRef]
- Hahn, E.M.; Hartmanns, A.; Hensel, C.; Klauck, M.; Klein, J.; Křetínskỳ, J.; Parker, D.; Quatmann, T.; Ruijters, E.; Steinmetz, M. The 2019 comparison of tools for the analysis of quantitative formal models. In International Conference on Tools and Algorithms for the Construction and Analysis of Systems; Springer: Cham, Switzerland, 2019; pp. 69–92. [Google Scholar]
- Hinton, A.; Kwiatkowska, M.; Norman, G.; Parker, D. PRISM: A Tool for Automatic Verification of Probabilistic Systems. In Tools and Algorithms for the Construction and Analysis of Systems; Hermanns, H., Palsberg, J., Eds.; Springer: Berlin/Heidelberg, Germany, 2006; pp. 441–444. [Google Scholar]
- Kwiatkowska, M.; Norman, G.; Parker, D. PRISM 4.0: Verification of Probabilistic Real-Time Systems. In International Conference on Computer Aided Verification; Springer: Berlin/Heidelberg, Germany, 2011; pp. 585–591. [Google Scholar]
- Alur, R.; Henzinger, T.A. Reactive Modules. Form. Methods Syst. Des. 1999, 15, 7–48. [Google Scholar] [CrossRef]
- Bengtsson, J.; Larsen, K.; Larsson, F.; Pettersson, P.; Yi, W. UPPAAL—A Tool Suite for Automatic Verification of Real-Time Systems; Hybrid, S., III, Alur, R., Henzinger, T.A., Sontag, E.D., Eds.; Springer: Berlin/Heidelberg, Germany, 1996; pp. 232–243. [Google Scholar]
- Behrmann, G.; David, A.; Larsen, K.G. A Tutorial on UPPAAL 4.0; Department of Computer Science, Aalborg University: Aalborg, Denmark, 2006. [Google Scholar]
- David, A.; Larsen, K.G.; Legay, A.; Mikučionis, M.; Poulsen, D.B.; Van Vliet, J.; Wang, Z. Statistical model checking for networks of priced timed automata. In International Conference on Formal Modeling and Analysis of Timed Systems; Springer: Berlin/Heidelberg, Germany, 2011; pp. 80–96. [Google Scholar]
- Ma, X.; Rinast, J.; Schupp, S.; Gollmann, D. Evaluating Online Model Checking in UPPAAL-SMC using a laser tracheotomy case study. In 5th Workshop on Medical Cyber-Physical Systems; Schloss Dagstuhl–Leibniz-Zentrum für Informatik: Wadern, Germany, 2014; pp. 100–112. [Google Scholar]
- Dehnert, C.; Junges, S.; Katoen, J.P.; Volk, M. A storm is coming: A modern probabilistic model checker. In International Conference on Computer Aided Verification; Springer: Cham, Switzerland, 2017; pp. 592–600. [Google Scholar]
- Hensel, C.; Junges, S.; Katoen, J.P.; Quatmann, T.; Volk, M. The Probabilistic Model Checker Storm. arXiv 2020, arXiv:2002.07080. [Google Scholar]
- Naeem, A.; Azam, F.; Amjad, A.; Anwar, M.W. Comparison of Model Checking Tools Using Timed Automata-PRISM and UPPAAL. In Proceedings of the 2018 IEEE International Conference on Computer and Communication Engineering Technology (CCET), Beijing, China, 18–20 August 2018; pp. 248–253. [Google Scholar] [CrossRef]
- Hansson, H.; Jonsson, B. A logic for reasoning about time and reliability. Form. Asp. Comput. 1994, 6, 512–535. [Google Scholar] [CrossRef]
- Glenn, C.; Sterbentz, D.; Wright, A. Cyber Threat and Vulnerability Analysis of the U.S. Electric Sector. 2021. Available online: https://www.osti.gov/servlets/purl/1337873/ (accessed on 31 May 2021). [CrossRef]
- Framework for Improving Critical Infrastructure Cybersecurity: Version 1.1; National Institute of Standards and Technology: Gaithersburg, MD, USA, 2018.
Figure 1.
Risk analysis based on threat modeling and formal methods methodology.
Figure 1.
Risk analysis based on threat modeling and formal methods methodology.
Figure 2.
Smart energy system cyber security use case architecture.
Figure 2.
Smart energy system cyber security use case architecture.
Figure 4.
Attack scenario for hijacking of heating and the HVAC system.
Figure 4.
Attack scenario for hijacking of heating and the HVAC system.
Figure 5.
Attack scenario for hijacking of smart meters in smart homes.
Figure 5.
Attack scenario for hijacking of smart meters in smart homes.
Figure 6.
Attack scenario for black-outs in an SG.
Figure 6.
Attack scenario for black-outs in an SG.
Figure 7.
Smart home and HVAC hijacking use-case architecture.
Figure 7.
Smart home and HVAC hijacking use-case architecture.
Figure 8.
Smart home and HVAC hijack use case results.
Figure 8.
Smart home and HVAC hijack use case results.
Figure 9.
Smart home and smart meter hijacking use-case architecture.
Figure 9.
Smart home and smart meter hijacking use-case architecture.
Figure 10.
Smart home and smart meter hijacking use case results.
Figure 10.
Smart home and smart meter hijacking use case results.
Figure 11.
Smart grid and black-out attack use case architecture.
Figure 11.
Smart grid and black-out attack use case architecture.
Figure 12.
Smart grid and black-out attack use case results.
Figure 12.
Smart grid and black-out attack use case results.
Table 1.
Threat asignment to category.
Table 1.
Threat asignment to category.
| | Category | Amount |
|---|
| S | Spoofing identity | 51 |
| T | Tampering with data | 15 |
| R | Repudiation | 38 |
| I | Information disclosure | 33 |
| D | Denial of Service | 85 |
| E | Elevation of privilege | 116 |
| – | Smart energy components related | 798 |
Table 2.
List of threats.
Table 2.
List of threats.
| Id | Title | Category | Description |
|---|
| 51 | Elevation by Changing the Execution Flow in WAMS | Elevation Of Privilege | Gateway may be able to remotely execute code for WAMS. |
| 187 | PQM May be Subject to Elevation of Privilege Using Remote Code Execution | Elevation Of Privilege | Gateway may be able to remotely execute code for PQM. |
| 230 | Data Flow MODBUS TCP IP Secure Is Potentially Interrupted | Denial Of Service | An external agent interrupts data flowing across a trust boundary in either direction. |
| 353 | Data Flow IEEE C37.118 over IEC 61850-8-1 Is Potentially Interrupted | Denial Of Service | An external agent interrupts data flowing across a trust boundary in either direction. |
| 478 | Data Flow IEEE C37.118 over IEC 61850-8-1 Is Potentially Interrupted | Denial Of Service | An external agent interrupts data flowing across a trust boundary in either direction. |
| 593 | Data Flow MODBUS TCP IP Secure Is Potentially Interrupted | Denial Of Service | An external agent interrupts data flowing across a trust boundary in either direction. |
| 597 | Spoofing the ESB Adaper Processd | Spoofing | ESB Adaper may be spoofed by an attacker and this may lead to unauthorized access to ESB. |
| 618 | Data Flow IEC 60870-5-104 Is Potentially Interrupted | Denial Of Service | An external agent interrupts data flowing across a trust boundary in either direction. |
| 621 | Elevation by Changing the Execution Flow in RTU | Elevation Of Privilege | An attacker may pass data into RTU in order to change the flow of program execution within RTU to the attacker’s choosing. |
| 640 | Data flowing sniffing across MODBUS TCP IP | Information Disclosure | Data flowing across MODBUS TCP IP may be sniffed by an attacker. Information may may be used to attack other parts of the system or simply be a disclosure of information leading to compliance violations. |
| 647 | Elevation by Changing the Execution Flow in PED | Elevation Of Privilege | RTU may be able to remotely execute code for PED. |
| 661 | Elevation by Changing the Execution Flow in SCADA System | Elevation Of Privilege | An attacker may pass data into SCADA System in order to change the flow of program execution within SCADA System to the attacker’s choosing. |
| 672 | Data Flow IEC 60870-5-104 Is Potentially Interrupted | Denial Of Service | An external agent interrupts data flowing across a trust boundary in either direction. |
| 686 | Elevation by Changing the Execution Flow in RTU | Elevation Of Privilege | An attacker may pass data into RTU in order to change the flow of program execution within RTU to the attacker’s choosing. |
| 857 | Elevation by Changing the Execution Flow in DCU | Elevation Of Privilege | An attacker may pass data into DCU in order to change the flow of program execution within DCU to the attacker’s choosing. |
| 880 | Spoofing the In-house display External Entity | Spoofing | In-house display may be spoofed by an attacker and this may lead to unauthorized access to Smart Meter. |
| 903 | An adversary may block access to the application or API hosted on In-house display through a denial of service attack | Denial Of Service | An adversary may block access to the application or API hosted on In-house display through a denial of service attack |
| 1005 | An adversary may gain elevated privileges and execute malicious code on HEMS host | Elevation Of Privilege | If an application runs under a high-privileged account, it may provide an opportunity for an adversary to gain elevated privileges and execute malicious code on host machines |
| 1013 | An adversary may execute unknown code on Heating/Cooling | Tampering | An adversary may launch malicious code into Heating and execute it |
| 1028 | Potential Excessive Resource Consumption for IoT Gateway or Thermometer | Denial Of Service | Resource consumption attacks can be hard to deal with, and there are times that it makes sense to let the OS do the job. |
| 1052 | Elevation by Changing the Execution Flow in PMU | Elevation Of Privilege | An attacker may pass data into PMU in order to change the flow of program execution within PMU to the attacker’s choosing. |
| 1057 | Data Flow Sniffing | Information Disclosure | Data flowing across IEEE C37.118 over IEC 61850 8 1 may be sniffed by an attacker. Information may be used to attack other parts of the system or simply be a disclosure of information leading to compliance violations |
| 1111 | Elevation by Changing the Execution Flow in IoT Gateway | Elevation Of Privilege | An attacker may pass data into IoT Gateway in order to change the flow of program execution within IoT Gateway to the attacker’s choosing. |
Table 3.
UC1 Exploitation probabilities.
Table 3.
UC1 Exploitation probabilities.
| Threat Id | Title | Expl. Prob. |
|---|
| 1005 | An adversary may gain elevated privileges and execute malicious code on HEMS host | 0.57 |
| 1013 | An adversary may execute unknown code on heating/cooling | 0.59 |
| 1028 | Potential excessive resource consumption for IoT gateway or thermometer | 0.65 |
| 1111 | Elevation by changing the execution flow in IoT gateway | 0.59 |
Table 4.
UC2 Exploitation probabilities.
Table 4.
UC2 Exploitation probabilities.
| Threat Id | Title | Expl. Prob. |
|---|
| 857 | Elevation by changing the execution flow in DCU | 0.57 |
| 880 | Spoofing the in-house display external entity | 0.68 |
| 903 | An adversary may block access to the application or API hosted on in-house display through a denial of service attack | 0.65 |
Table 5.
UC3 Exploitation probabilities.
Table 5.
UC3 Exploitation probabilities.
| Threat Id | Title | Expl. Prob. |
|---|
| 51 | Elevation by changing the execution flow in WAMS | 0.59 |
| 187 | PQM may be subject to elevation of privilege using remote code execution | 0.59 |
| 230 | Data flow MODBUS TCP IP secure is potentially interrupted | 0.75 |
| 353 | Data flow IEEE C37.118 over IEC 61850-8-1 is potentially interrupted | 0.75 |
| 478 | Data flow IEEE C37.118 over IEC 61850-8-1 is potentially interrupted | 0.75 |
| 593 | Data flow MODBUS TCP IP secure is potentially interrupted | 0.75 |
| 618 | Data flow IEC 60870-5-104 is potentially interrupted | 0.65 |
| 621 | Elevation by changing the execution flow in RTU | 0.59 |
| 640 | Data flowing sniffing across MODBUS TCP IP | 0.53 |
| 647 | Elevation by changing the execution flow in PED | 0.57 |
| 661 | Elevation by changing the execution flow in SCADA system | 0.64 |
| 672 | Data flow IEC 60870-5-104 is potentially interrupted | 0.65 |
| 686 | Elevation by changing the execution flow in RTU | 0.59 |
| 1052 | Elevation by changing the execution flow in PMU | 0.59 |
| 1057 | Data flow sniffing | 0.53 |
Table 6.
Comparison of probabilistic model checking tools.
Table 6.
Comparison of probabilistic model checking tools.
| | PRISM | UPPAAL | STORM |
|---|
| Operating System | Windows, Linux, Mac | Windows, Linux, Mac | Linux (min Debian 9, Ubuntu 16.10), Mac (min 10.12) |
| Last Version | version 4.7 (March 2021) | official release 4.0.15 (Nov. 2019) | version 1.6.3 (Nov. 2020) |
| Licence | GNU GPL 2 | free for non-commercial applications in academia only | GNU GPL 3 |
| Type of input | PRISM language | XTA and XML | PRISM, JANI, GSPNs, DFTs, cpGCL, explicit |
| Simulator | yes | yes | no |
| GUI | ✓ | ✓ | ✗ |
| Case Studies | ✓ | ✓ | ✗ |
Table 7.
Probabilistic model checkers’ feature comparison.
Table 7.
Probabilistic model checkers’ feature comparison.
| | PRISM | UPPAAL | STORM |
|---|
| Statistical model checking | ✓ | ✓ | ✗ |
| Probabilistic model checking | ✓ | ✗ | ✓ |
| DTMC | ✓ | ✗ | ✓ |
| CTMC | ✓ | ✗ | ✓ |
| MDP | ✓ | ✗ | ✓ |
| MA | ✗ | ✗ | ✓ |
| PA | ✓ | ✗ | ✗ |
| PTA | ✓ | ✗ | ✗ |
| priced TA | ✗ | ✓ | ✗ |
Table 8.
Vulnerabilities, exploitation probabilities and associated threats for UC1.
Table 8.
Vulnerabilities, exploitation probabilities and associated threats for UC1.
| Vulnerability | Associated Threat | Threat Id | Expl. Prob. |
|---|
| ST–G1 link | Link jammed: denied transmission | 1028 | 0.65 |
| HVAC (actuation A1/A2) | Tailored context/incorrect actuation | 1013 | 0.59 |
| G (gain control) | Tailored context/incorrect reading | 1111 | 0.59 |
| HEMS (actuation A1/A2) | Tailored context/incorrect actuation | 1005 | 0.57 |
Table 9.
Modeled attacks, their impact and properties for UC1.
Table 9.
Modeled attacks, their impact and properties for UC1.
| Attack | Impact | Attack Properties |
|---|
| Attack scenario 1.1: Hijack heating | High | Attacker takes control over heating, high or optimal temperature is detected, heating is switched on, resulting in damage |
| Attack scenario 1.2: Hijack HVAC | High | Attacker takes control over HVAC, optimal temperature is detected, both cooling and heating are switched on, resulting in damage and high power consumption |
Table 10.
Smart home and HVAC hijack use case risk exposure scores.
Table 10.
Smart home and HVAC hijack use case risk exposure scores.
| Attack | | | | | |
|---|
| 1.1 Hijack heating | 0.0000 | 0.3481 | 0.4908 | 0.5473 | 0.5473 |
| 1.2 Hijack HVAC | 0.0000 | 0.0000 | 0.2054 | 0.3709 | 0.4365 |
Table 11.
Vulnerabilities, exploitation probabilities and associated threats for UC2.
Table 11.
Vulnerabilities, exploitation probabilities and associated threats for UC2.
| Vulnerability | Associated Threat | Threat Id | Expl. Prob. |
|---|
| IHD–SM link | Link jammed: denied transmission | 903 | 0.65 |
| SM1, SM2 (reading) | Tailored context/incorrect reading | 880 | 0.68 |
| C (reading SM1/SM2) | Tailored context/incorrect reading | 857 | 0.57 |
| G (gain control) | Tailored context/incorrect reading | 1111 | 0.59 |
Table 12.
Modeled attacks, their impact and properties for UC2.
Table 12.
Modeled attacks, their impact and properties for UC2.
| Attack | Impact | Attack Properties |
|---|
| Attack scenario 2.1: Fraud | High | The user takes control over their and neighbor’s smart meter or concentrator, decreases their own power consumption, increases their neighbor’s power consumption, responsible actors are not alerted |
| Attack scenario 2.2: Decrease bill | Medium | The attacker takes control over their own smart meter or concentrator, and decreases the power consumption |
| Attack scenario 2.3: Increase bill | Medium | The attacker takes control over the user’s smart meter or concentrator, and increases the power consumption |
| Attack scenario 2.4: Increase bill, no alarm | Medium | The attacker takes control over the user’s smart meter or concentrator, increases the power consumption, the user is not alerted |
Table 13.
Smart home and smart meter hijacking use case risk exposure scores.
Table 13.
Smart home and smart meter hijacking use case risk exposure scores.
| Attack | | | | | |
|---|
| 2.1 Fraud | 0.0000 | 0.0000 | 0.2287 | 0.4098 | 0.4851 |
| 2.2 Decrease bill | 0.0000 | 0.4012 | 0.5390 | 0.6467 | 0.6467 |
| 2.3 Increase bill | 0.0000 | 0.4012 | 0.6467 | 0.6467 | 0.6467 |
| 2.4 Increase bill, no alarm | 0.0000 | 0.3363 | 0.5063 | 0.5063 | 0.5063 |
Table 14.
Vulnerabilities, exploitation probabilities and associated threats for UC3.
Table 14.
Vulnerabilities, exploitation probabilities and associated threats for UC3.
| Vulnerability | Associated Threat | Threat Id | Expl. Prob. |
|---|
| PQM1/2–SCADA link | Link jammed: denied transmission | 230/353 | 0.75 |
| PMU1/2–SCADA link | Link jammed: denied transmission | 478/593 | 0.75 |
| WAMS | Tailored context/incorrect reading | 51 | 0.59 |
| SCADA–RTU(SwG) link | Link jammed: denied transmission | 618 | 0.65 |
| RTU(PED)–SCADA link | Link jammed: denied transmission | 672 | 0.65 |
| RTU(SwG) | Tailored context/incorrect actuation | 621 | 0.59 |
| RTU(PED) | Tailored context/incorrect reading | 686 | 0.59 |
| PED | Tailored context/incorrect reading | 647 | 0.57 |
| PED sniffing | Sniffing | 1057 | 0.53 |
| PQM/PMU sniffing | Sniffing | 640 | 0.53 |
| PMU | Tailored context/incorrect reading | 1052 | 0.59 |
| PQM | Tailored context/incorrect reading | 187 | 0.59 |
| SCADA | Highjacking | 672 | 0.64 |
Table 15.
Modeled attacks, their impact and properties for UC3.
Table 15.
Modeled attacks, their impact and properties for UC3.
| Attack | Impact | Attack Properties |
|---|
| Attack scenario 3.1.1: Black-out | High | The attacker causes network segment black-out by manipulating status reading on PED, and GS reading on WAMS; |
| Attack scenario 3.1.2: Black-out | High | The attacker causes network segment black-out by manipulating PED status reading on RTU, and GS reading on WAMS; |
| Attack scenario 3.2.1: Black-out | High | The attacker causes network segment black-out while PED is discharged by sniffing PED status, and jamming PMU2, PQM2 and PED communication lines; |
| Attack scenario 3.2.2: Black-out | High | The attacker causes network segment black-out while PED is discharged by sniffing PED status, and jamming SCADA communication lines; |
| Attack scenario: Grid stability jammed | Medium | Grid stability (GS) value is jammed, and there is no reliable sensor reading for that network segment. |
Table 16.
Smart grid and black-out attack use case risk exposure scores.
Table 16.
Smart grid and black-out attack use case risk exposure scores.
| Attack | | | | | |
|---|
| 3.1.1 Black out | 0.0000 | 0.3363 | 0.3363 | 0.3363 | 0.3363 |
| 3.1.2 Black out | 0.0000 | 0.3481 | 0.3481 | 0.3481 | 0.3481 |
| 3.2.1 Black out | 0.0000 | 0.0000 | 0.0000 | 0.0000 | 0.1337 |
| 3.2.2 Black out | 0.0000 | 0.0000 | 0.0000 | 0.1545 | 0.1545 |
| GS jammed | 0.0000 | 0.5625 | 0.7031 | 0.8086 | 0.8086 |
| Publisher’s Note: MDPI stays neutral with regard to jurisdictional claims in published maps and institutional affiliations. |
© 2021 by the authors. Licensee MDPI, Basel, Switzerland. This article is an open access article distributed under the terms and conditions of the Creative Commons Attribution (CC BY) license (https://creativecommons.org/licenses/by/4.0/).


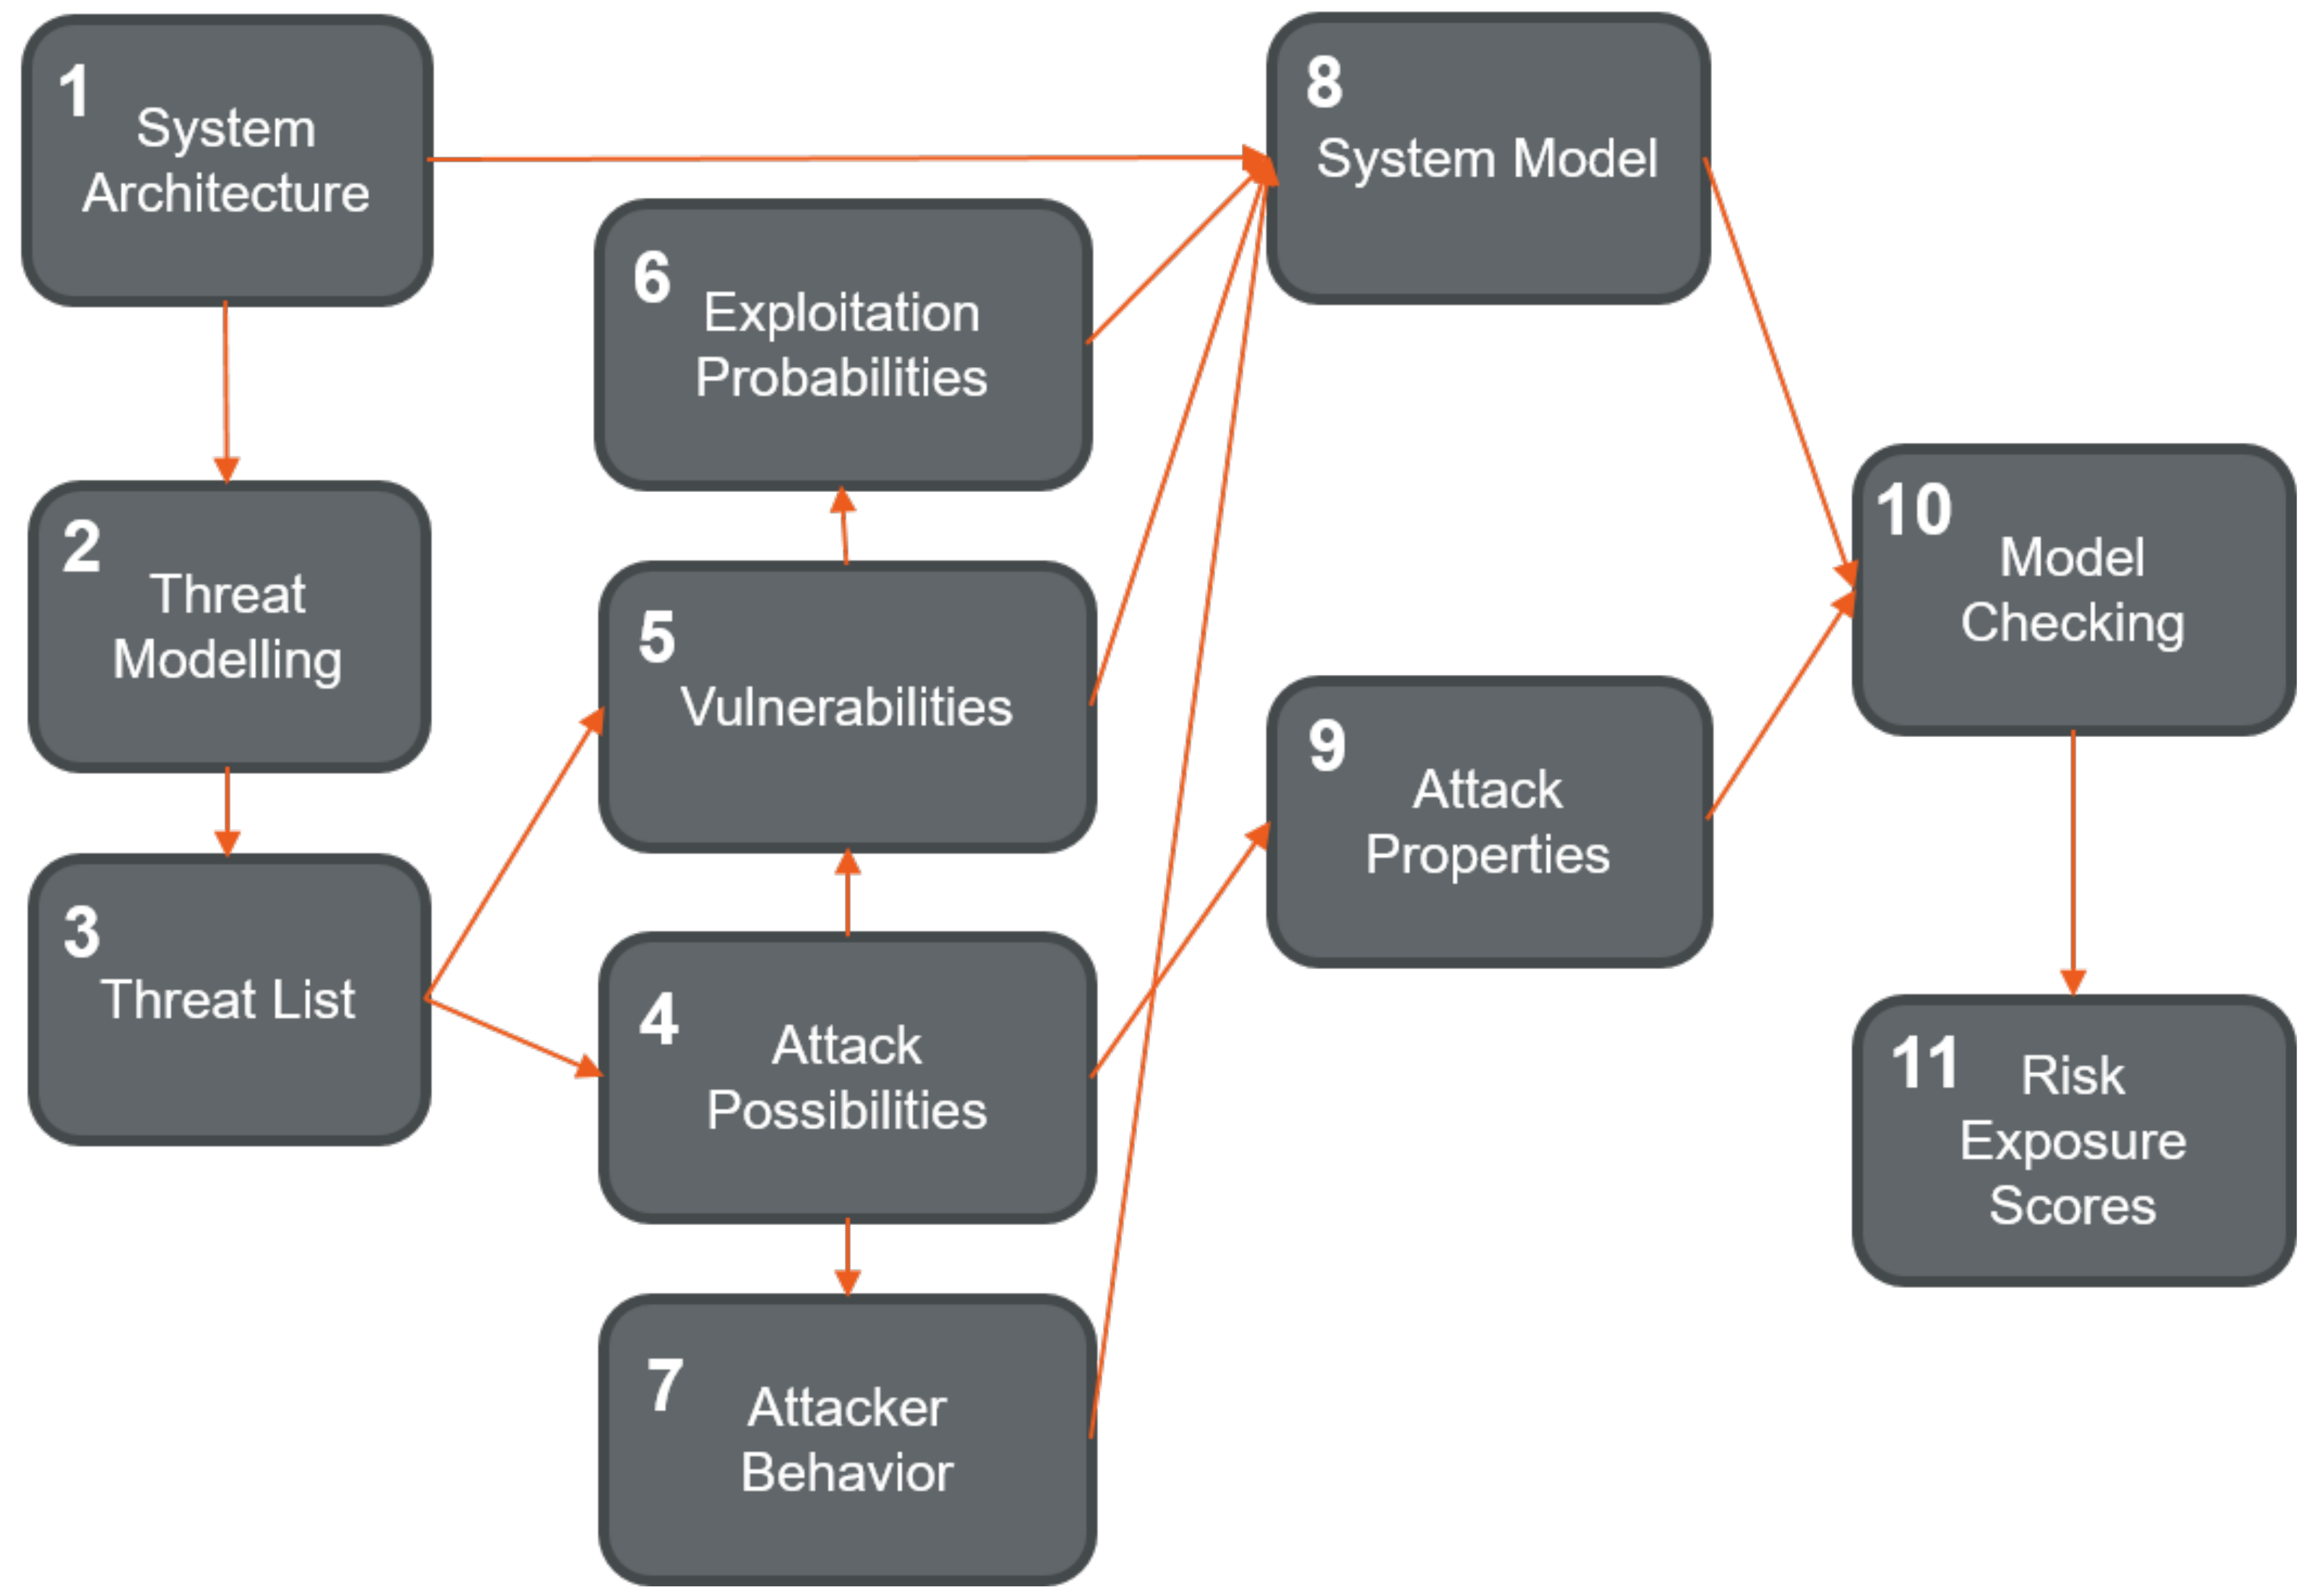
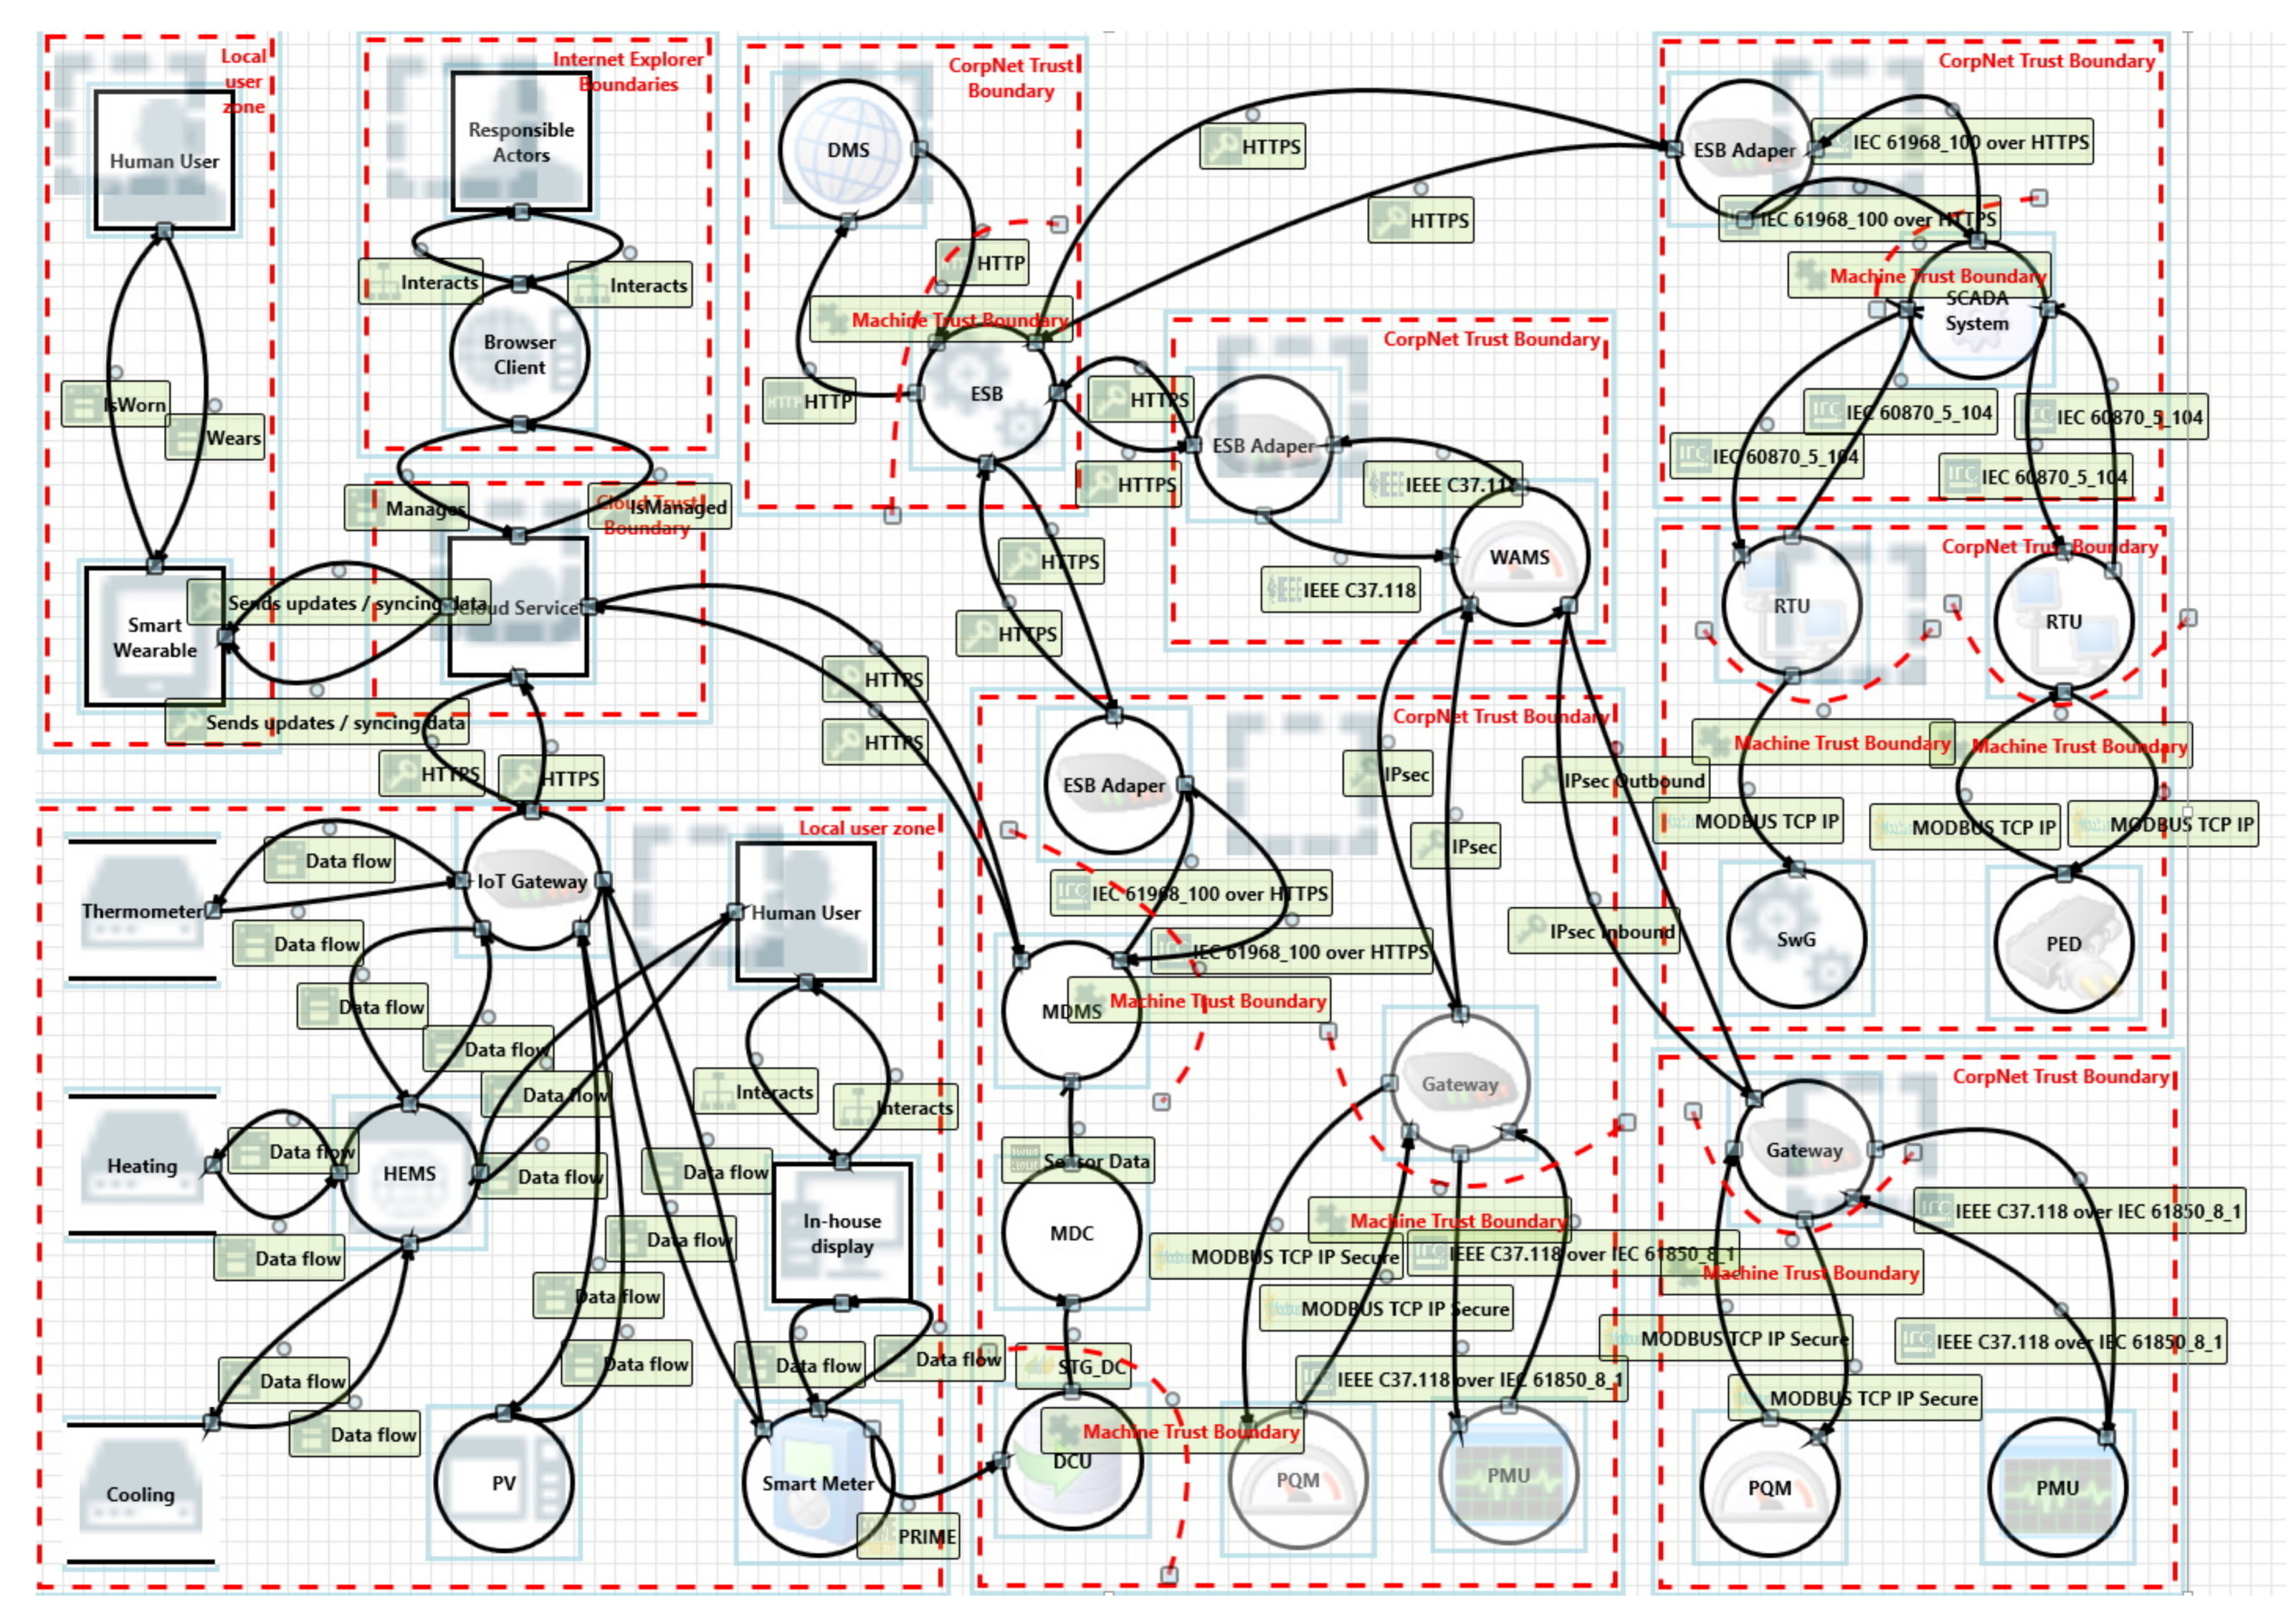
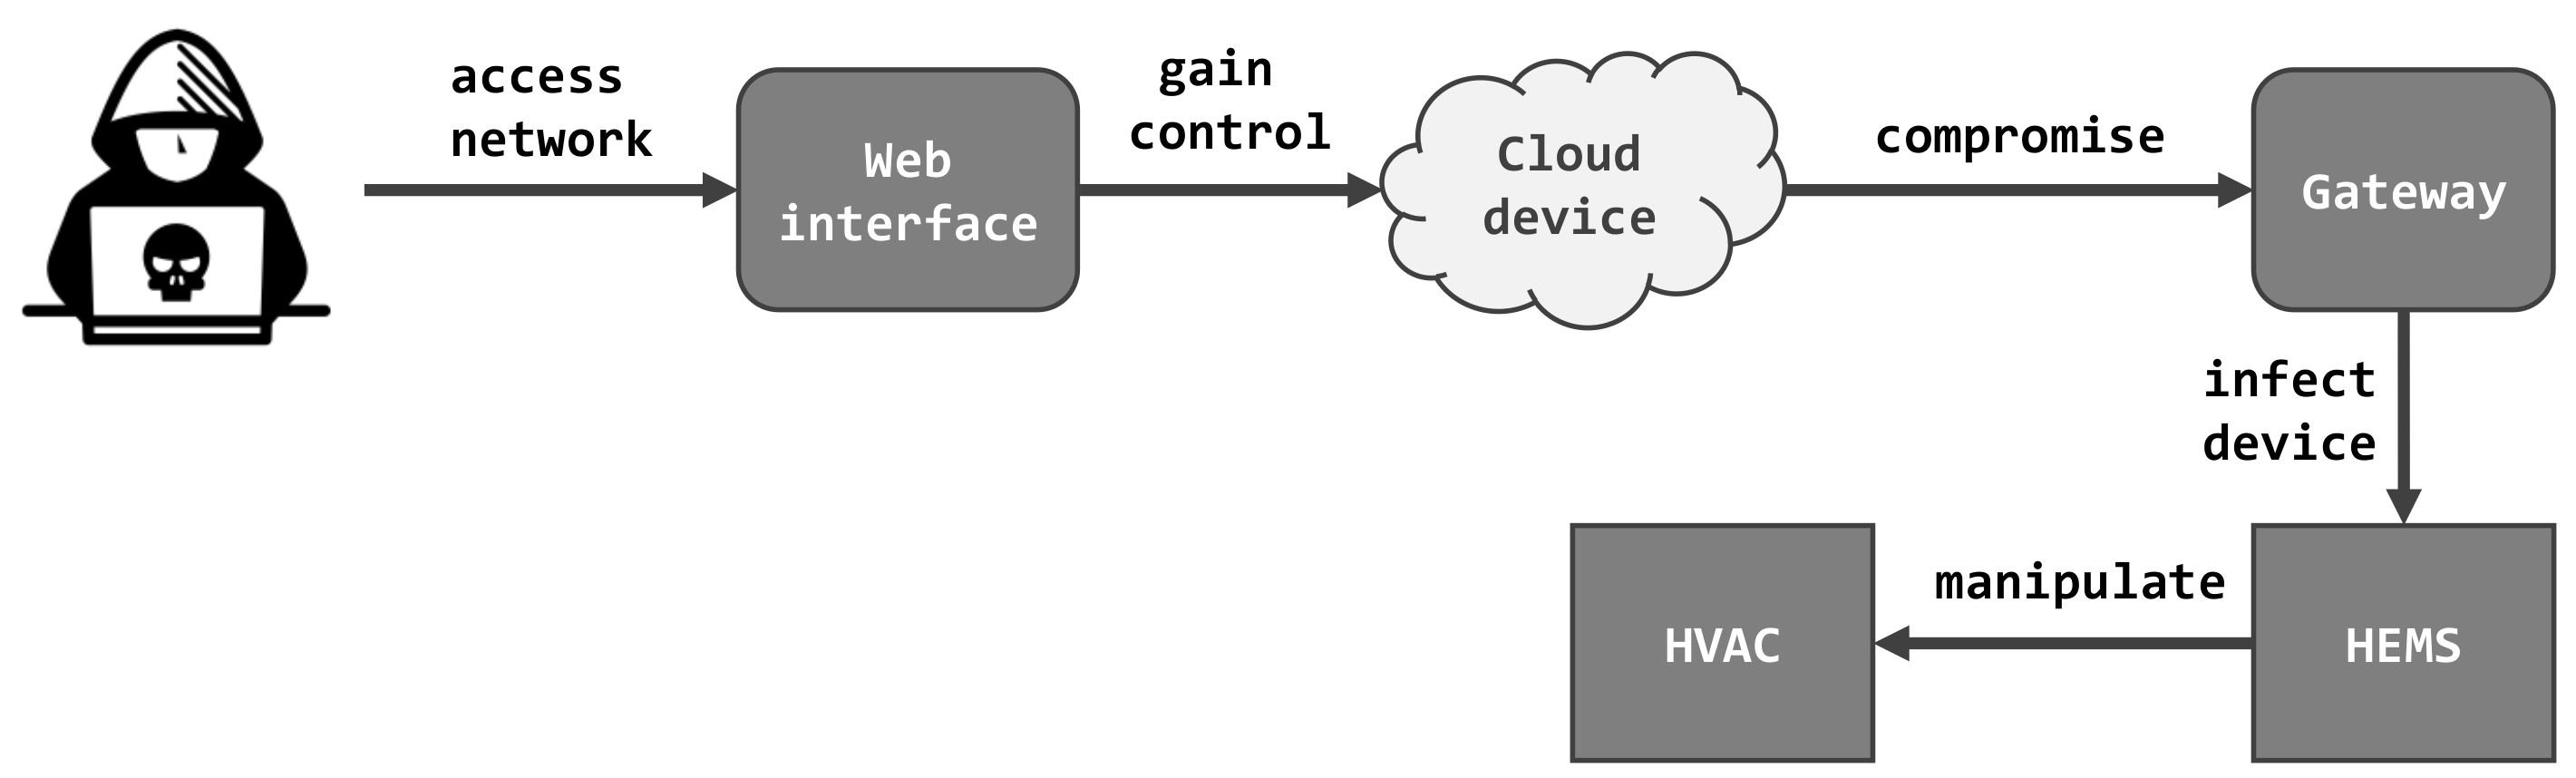
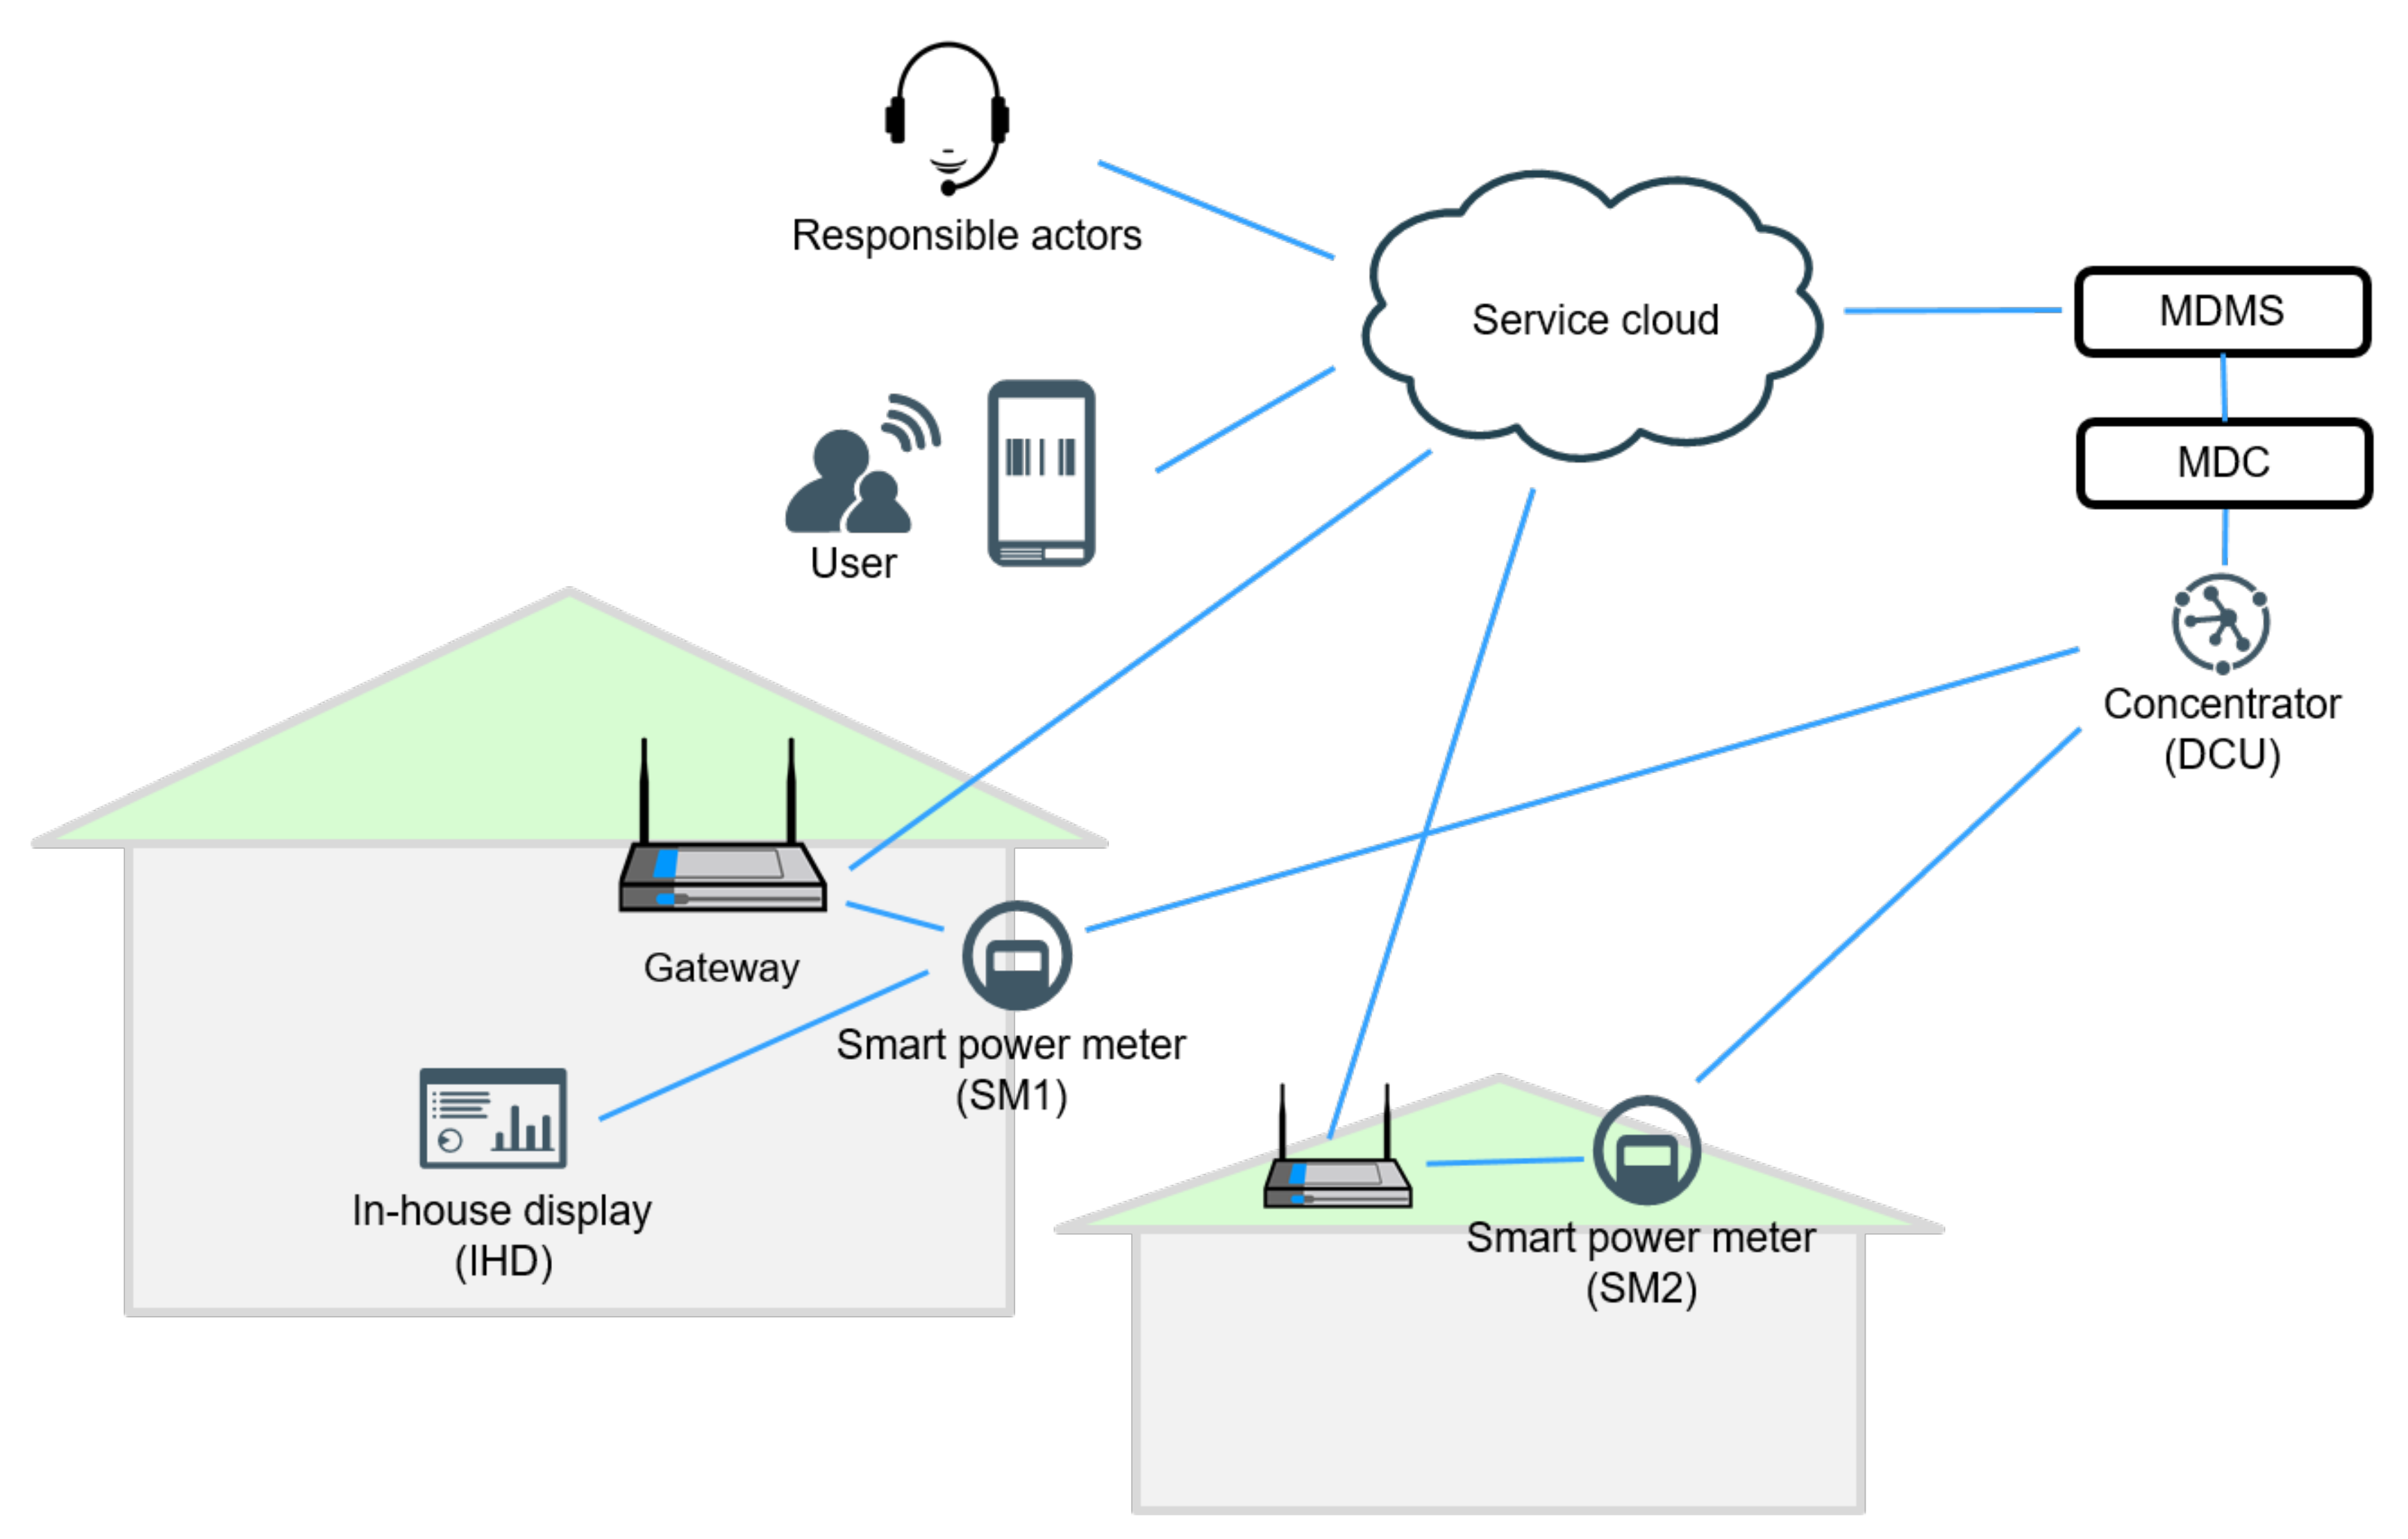
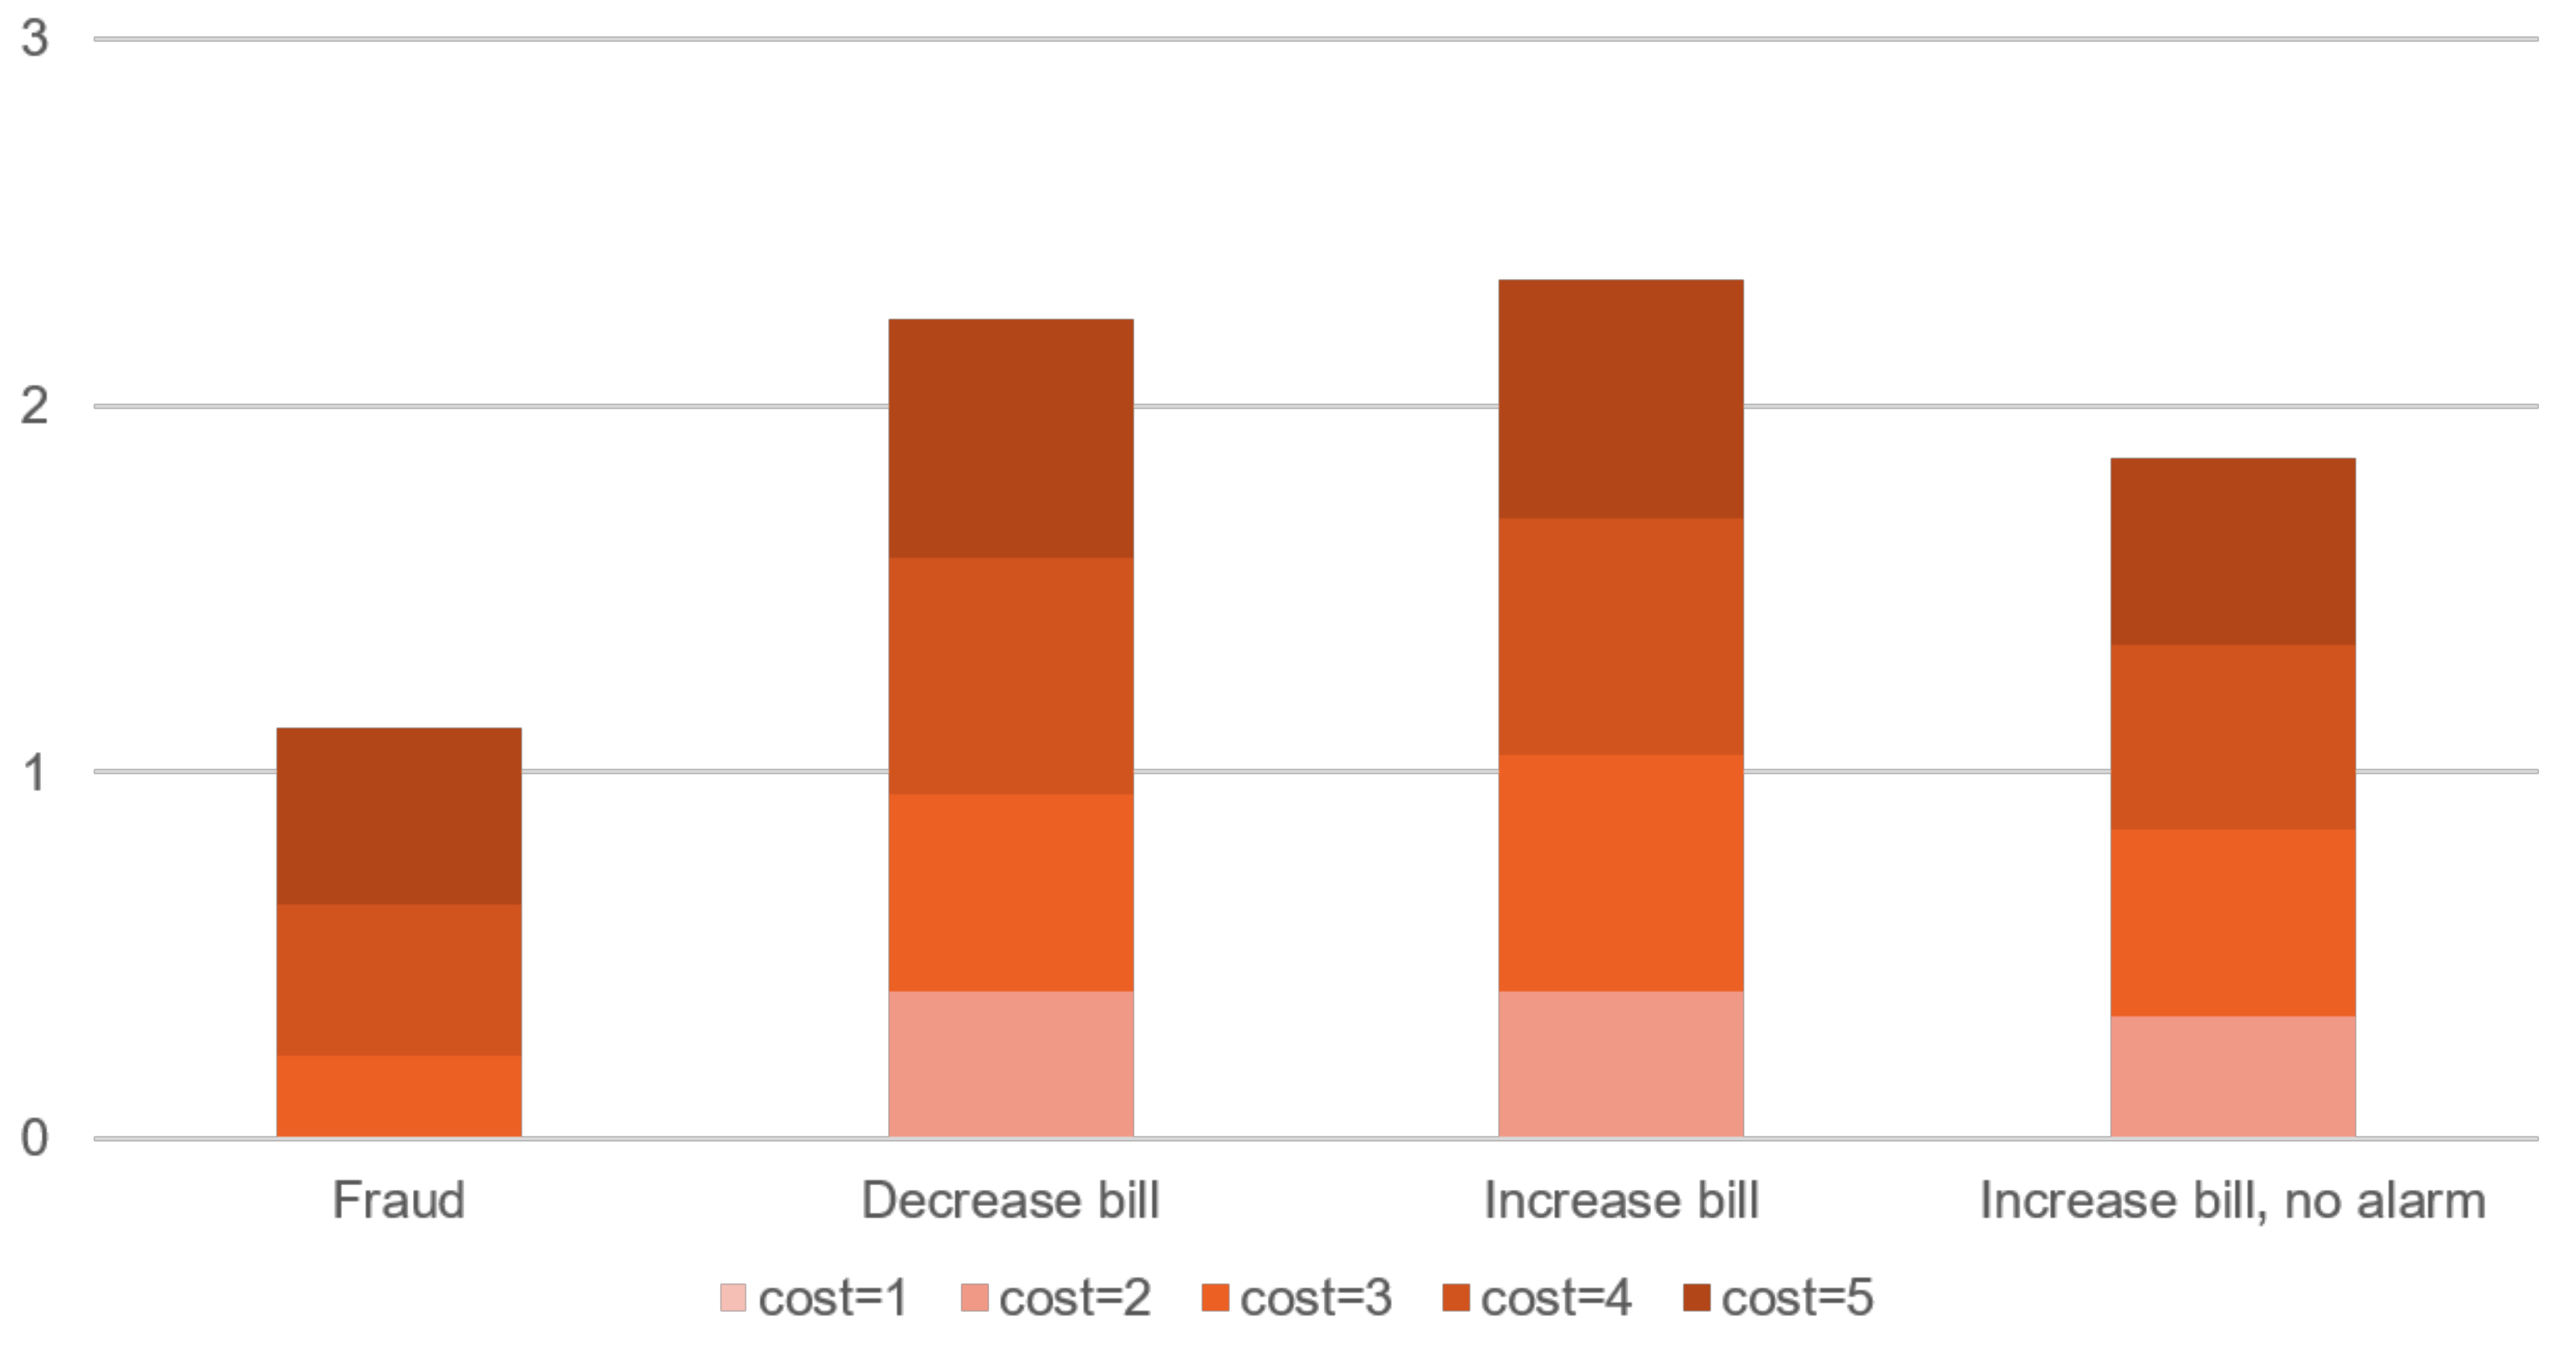
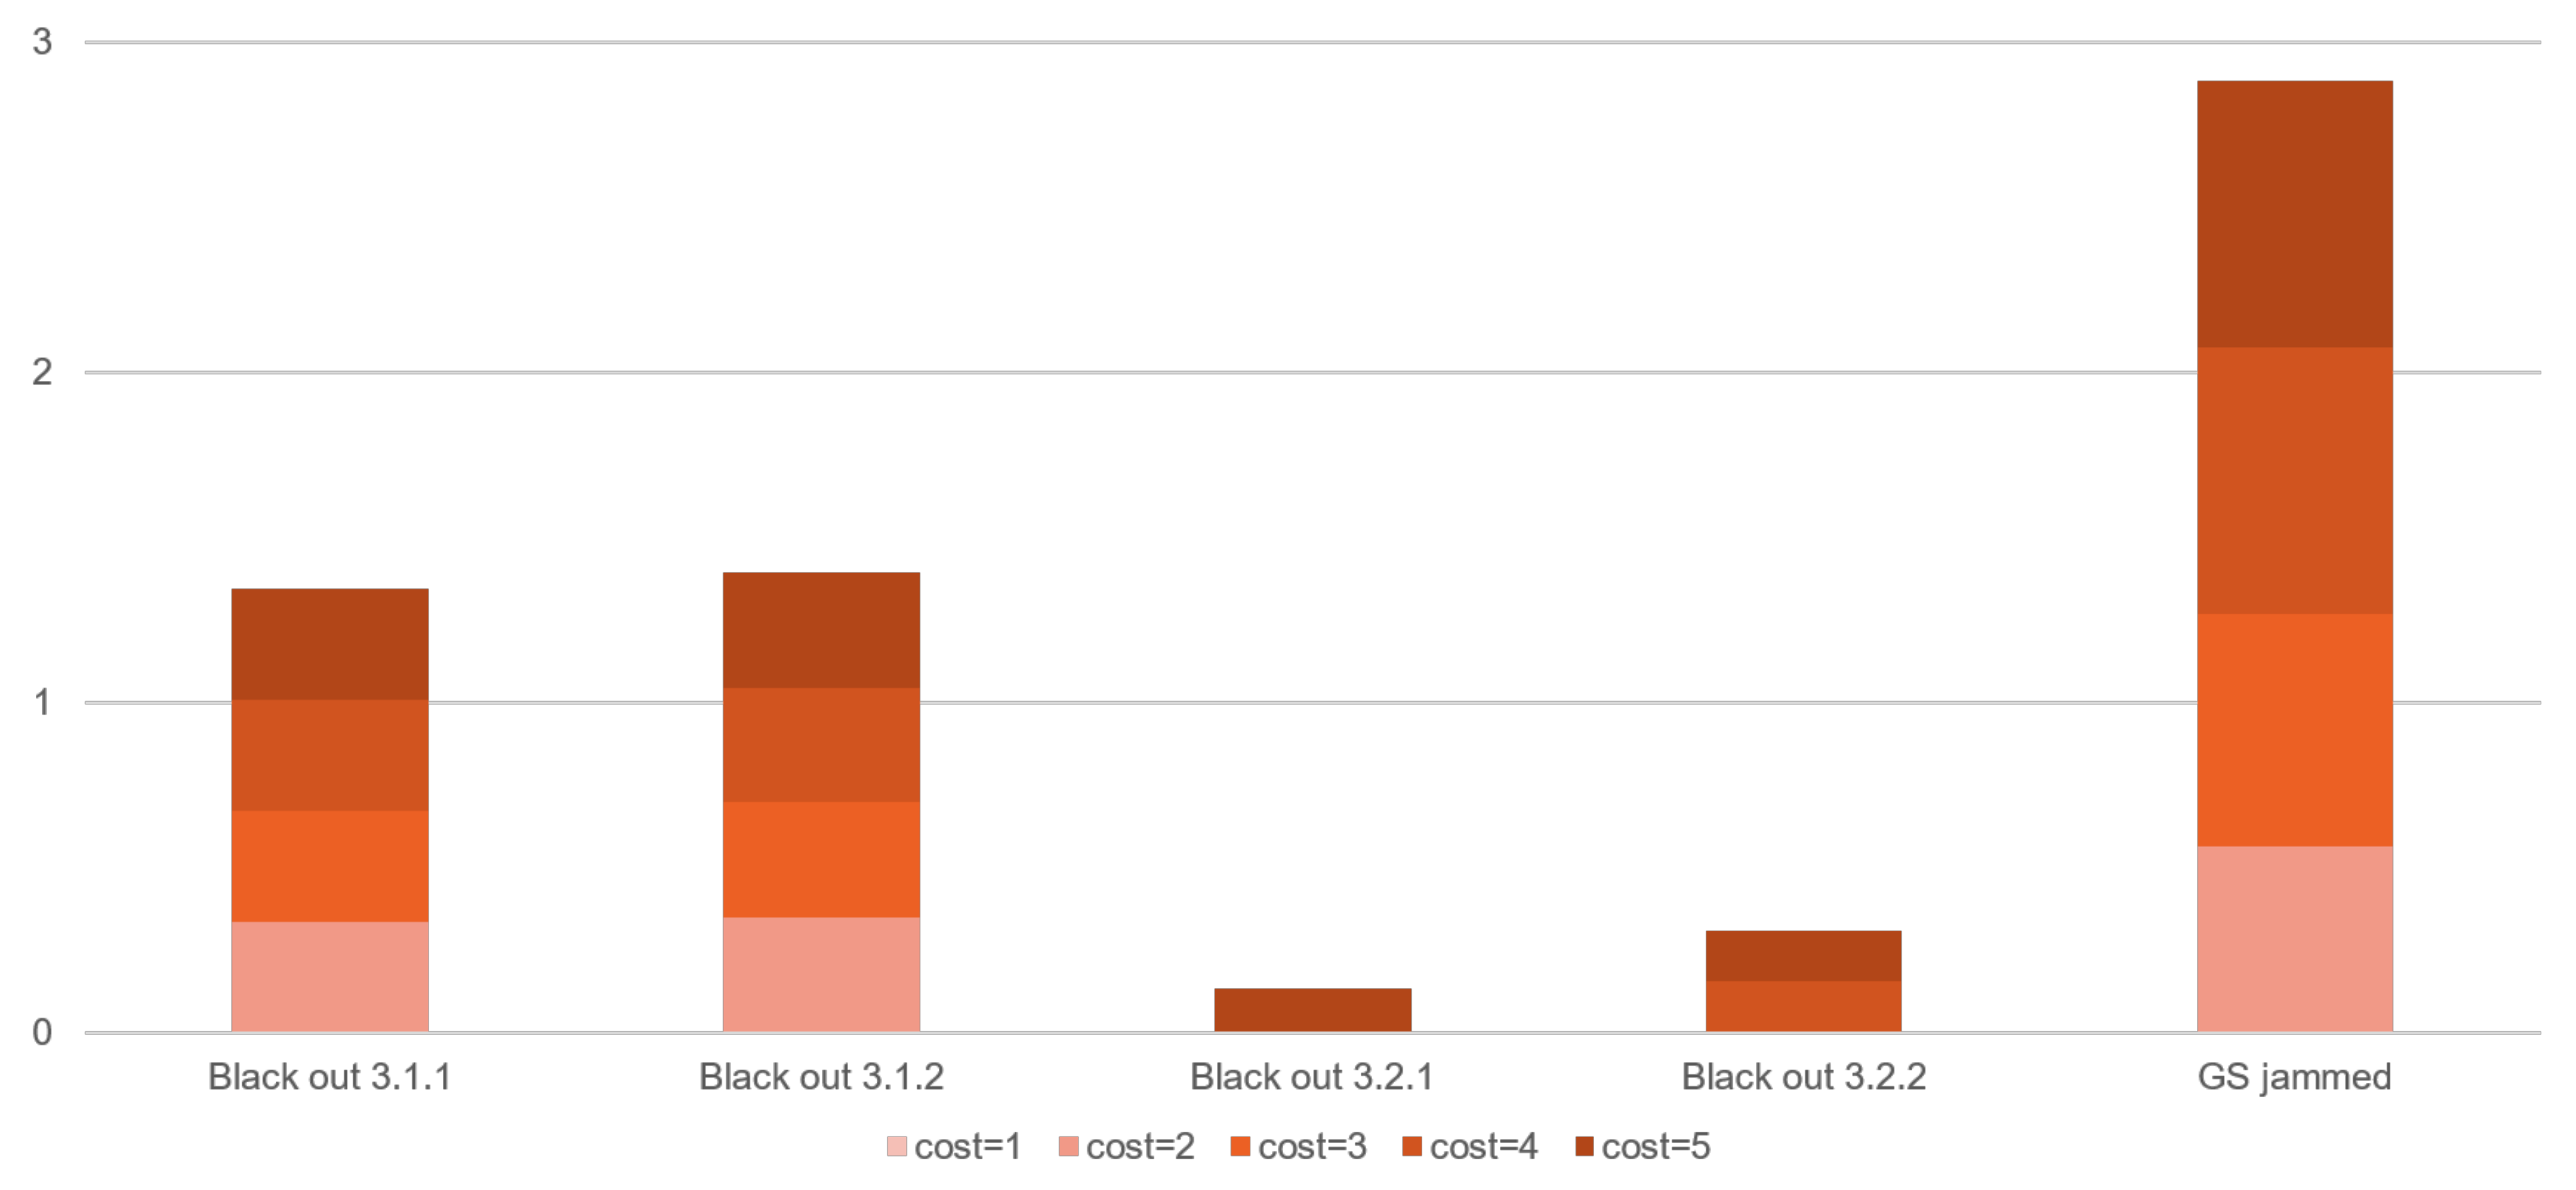