Article

Flexible Sample Environments for the Investigation of Soft Matter at the European Spallation Source: Part III—The Macroscopic Foam Cell

1
Institut für Physik Kondensierter Materie, Technische Universität Darmstadt, Hochschulstraße 8, 64289 Darmstadt, Germany
2
Lehrstuhl für Funktionelle Materialien, Physik Department, Technische Universität München, James-Franck-Str. 1, 85748 Garching, Germany
3
Fakultät für Chemie, Physikalische und Biophysikalische Chemie, Universität Bielefeld, Universitätsstr. 25, 33615 Bielefeld, Germany
4
Jülich Centre for Neutron Science JCNS at Heinz Maier-Leibnitz Zentrum (MLZ), Forschungszentrum Jülich GmbH, Lichtenbergstr, 85748 Garching, Germany
5
European Spallation Source ERIC, P.O. Box 176, SE-221 00 Lund, Sweden
6
Heinz Maier-Leibnitz Zentrum (MLZ), Technische Universität München, Lichtenbergstr. 1, 85748 Garching, Germany
*
Author to whom correspondence should be addressed.
Current address: Bundesanstalt für Materialforschung Und-Prüfung (BAM), Unter den Eichen 87, 12205 Berlin, Germany.
Appl. Sci. 2021, 11(11), 5116; https://doi.org/10.3390/app11115116
Submission received: 30 April 2021 / Revised: 21 May 2021 / Accepted: 25 May 2021 / Published: 31 May 2021
(This article belongs to the Special Issue Recent Advances in Small-Angle Neutron Scattering)

Abstract

:
The European Spallation Source (ESS), which is under construction in Lund (Sweden), will be the leading and most brilliant neutron source and aims at starting user operation at the end of 2023. Among others, two small angle neutron scattering (SANS) machines will be operated. Due to the high brilliance of the source, it is important to minimize the downtime of the instruments. For this, a collaboration between three German universities and the ESS was initialized to develop and construct a unified sample environment (SE) system. The main focus was set on the use of a robust carrier system for the different SEs, which allows setting up experiments and first prealignment outside the SANS instruments. This article covers the development and construction of a SE for SANS experiments with foams, which allows measuring foams at different drainage states and the control of the rate of foam formation, temperature, and measurement position. The functionality under ESS conditions was tested and neutron test measurement were carried out.

1. Introduction

Neutrons play an important role for current fundamental science. Investigation of soft matter in the submicrometer range relies on neutron science due to the possibility of an unique contrast variation based on hydrogen–deuterium exchange. The European Spallation Source (ESS), which is under construction in Lund (Sweden), will be the leading neutron source in terms of flux and brilliance in the future [1,2]. This high flux will lead to decreasing measurement times and, therefore, will reduce the amount of beam time allocated to the individual users. This benefit also comes with a challenge, since the installation of sample environments (SEs) and the time required for preparation of the experiment will become a crucial factor for an efficient use of the beamtime. Consequently, the design of SEs should have a strong emphasis on the reduction of down time during sample and SE changes. The FlexiProb project (funded by the Federal Ministry of Education and Research of Germany, BMBF) is a collaborative effort of three research groups to design and construct three SEs in the field of soft matter research for implementation at the two small angle neutron scattering (SANS) instruments at the ESS, namely LoKI [3] and SKADI [4,5]. The SEs include an in situ SANS/DLS setup [6], a GISANS setup [7], and a SE for SANS experiments on aqueous foams, which is presented in this paper. In principle, the SEs are also compatible with beamlines at other neutron sources. However, the carrier system was designed to specifically fit into the sample areas of the instruments mentioned above. Every SE is assembled on an optical breadboard, which will be mounted on the kinematic mounting system, which is currently developed by the ESS. The whole setup is then transferred to the sample area of SANS instrument with a pallet truck. This approach allows preparing the experimental setup outside the instrument before the actual experiment. In addition, the ESS is planning offline alignment stations at which prealignment can be done within the ESS Universal Sample Coordinate System (USCS) [8]. All of this will allow for an exchange of the whole SE in a single step. This should enable fast and easy changes between different SEs and, therefore, should reduce down time between different experiments and users.
Foams are ubiquitous in everyday life in detergents, cosmetics, and food. In addition, foams are used in industrial processes such as mineral flotation, oil recovery, and fire fighting. Given their large abundance in everyday life and industrial processes, foams are the subject of numerous scientific studies and books [9,10,11,12,13,14,15]. However, some fundamental parameters such as foam stability or foamablity (foaming capability) are still difficult to predict [16]. The reason for this lies in the complexity of the foam structure and the vast variety of foam stabilizers ranging from surfactants, ionic and nonionic, to polyelectrolyte/surfactant mixtures, inorganic particles, and proteins. Depending on the system, different parameters seem to govern the overall properties of the resulting macroscopic foam. These parameters include surface elasticity and viscosity [17,18], maximum disjoining pressure in individual foam films [19,20], the formation of aggregates [21,22], and the composition at the interface [23]. The reason for this broad variety of parameters associated with macroscopic foam properties lies not only in the distinct differences between foam stabilizers, but also in the complex structure of the foam itself. All of the above mentioned parameters were studied at single air/water interfaces, bubbles, or foam lamellae, which is a drastic simplification of the complex structure of foams. Although they are challenging, measurements on entire foams can address the structural complexity and dynamics. The dynamics inside of nanoparticle stabilized foams were studied by diffusing wave spectroscopy [24,25]. Here, two dynamic processes were observed: a fast one caused by the nanoparticle diffusion and a slow one reflecting the foam dynamics. The internal structure of foams can be investigated by SANS [26,27,28,29,30,31]. The main measurable feature here is the thickness of foam lamellae inside of the foam. In this context, specific salt and pH effects [29], the chemical nature of the surfactant [31,32], and different drainage states of the foam [26,29,32] were studied. Furthermore, it is possible to detect objects inside the foam such as micelles [26,27], solid nanoparticles [30], or polymer sufactant complexes [33]. In such experiments, contrast variation is especially powerful, because it allows to selectively mask or unmask objects or structures inside the foam [30]. Since foams are thermodynamically unstable by nature and, with the specific example of aqueous foams, are highly dynamic at a timescale of minutes, SANS experiments were limited to rather stable foams.
Different cell designs for SANS on foams were reported in literature [26,28,29,31]. In all of these cells, foam formation is realized by bubbling gas through a porous plate either made of steel or sintered glass. The first cell of this type was designed by Axelos et al. and consists of a Plexiglas cylinder with a single quartz window for the neutron beam [26]. Taking into account the changing liquid volume fraction along the height of a foam column, Micheau et al. used a cell with three plane parallel windows at different positions along the foam cylinder [29]. This made it possible to probe the foam at different (gravitational) drainage stages. Following this approach, we designed a foam cell that allows SANS measurements at any desired height along the foam cylinder. Since the foam formation before each SANS experiment takes several minutes, the presented SE includes a sample changer for up to three foam cells, allowing foaming the next sample during the measurement of the previous one. As stated above, this is especially important for highly brilliant neutron sources such as the ESS in order to reduce the downtime between sample changes. The high flux and reduced measurement time at the ESS will also enable measurements with more dynamic and less stable foams and will allow studies with high time resolution, which is especially appealing for highly dynamic foams. In order to use the full potential of the ESS from day one, it is crucial to design and test SEs for various experiments before the start of operation.
In this article, we present the design and construction of the FlexiProb SE for SANS experiments on foams. Detailed technical aspects of the measurement cell itself and the peripheral components such as temperature control, gas flow control, and sample positioning, as well as first benchmarks for measurements with neutrons, are shown.

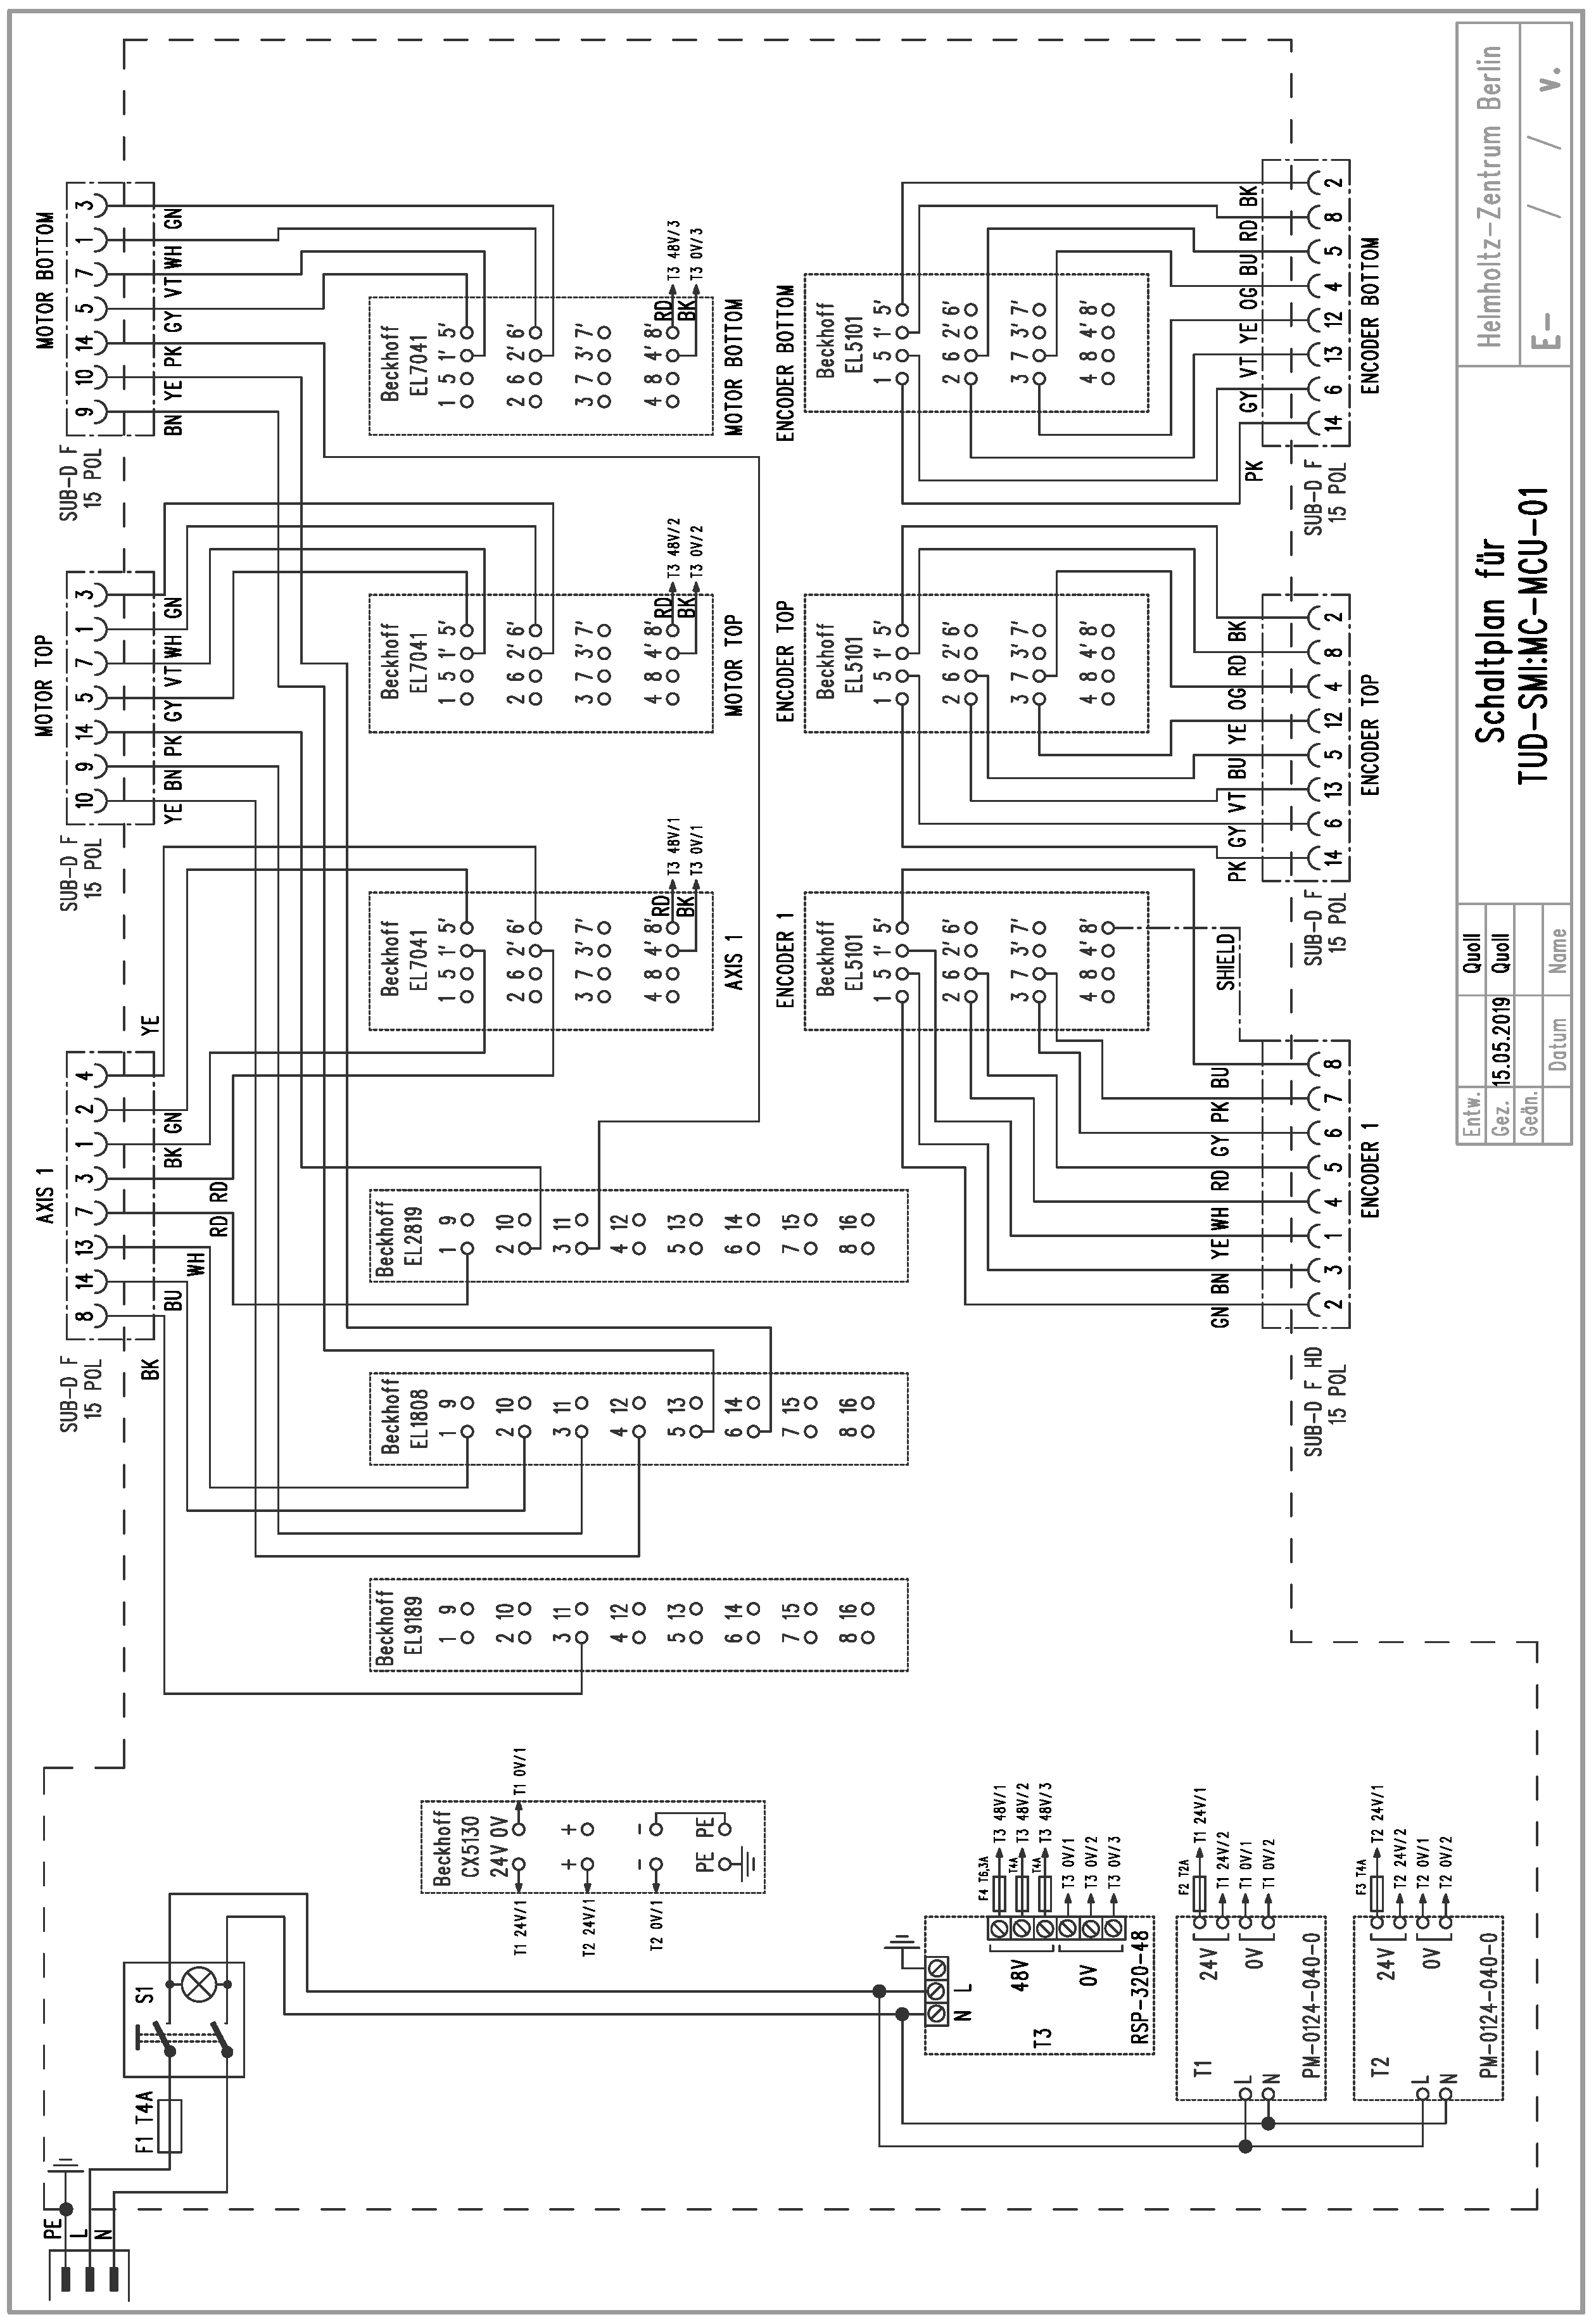
2. Instrumental Concept and Performance

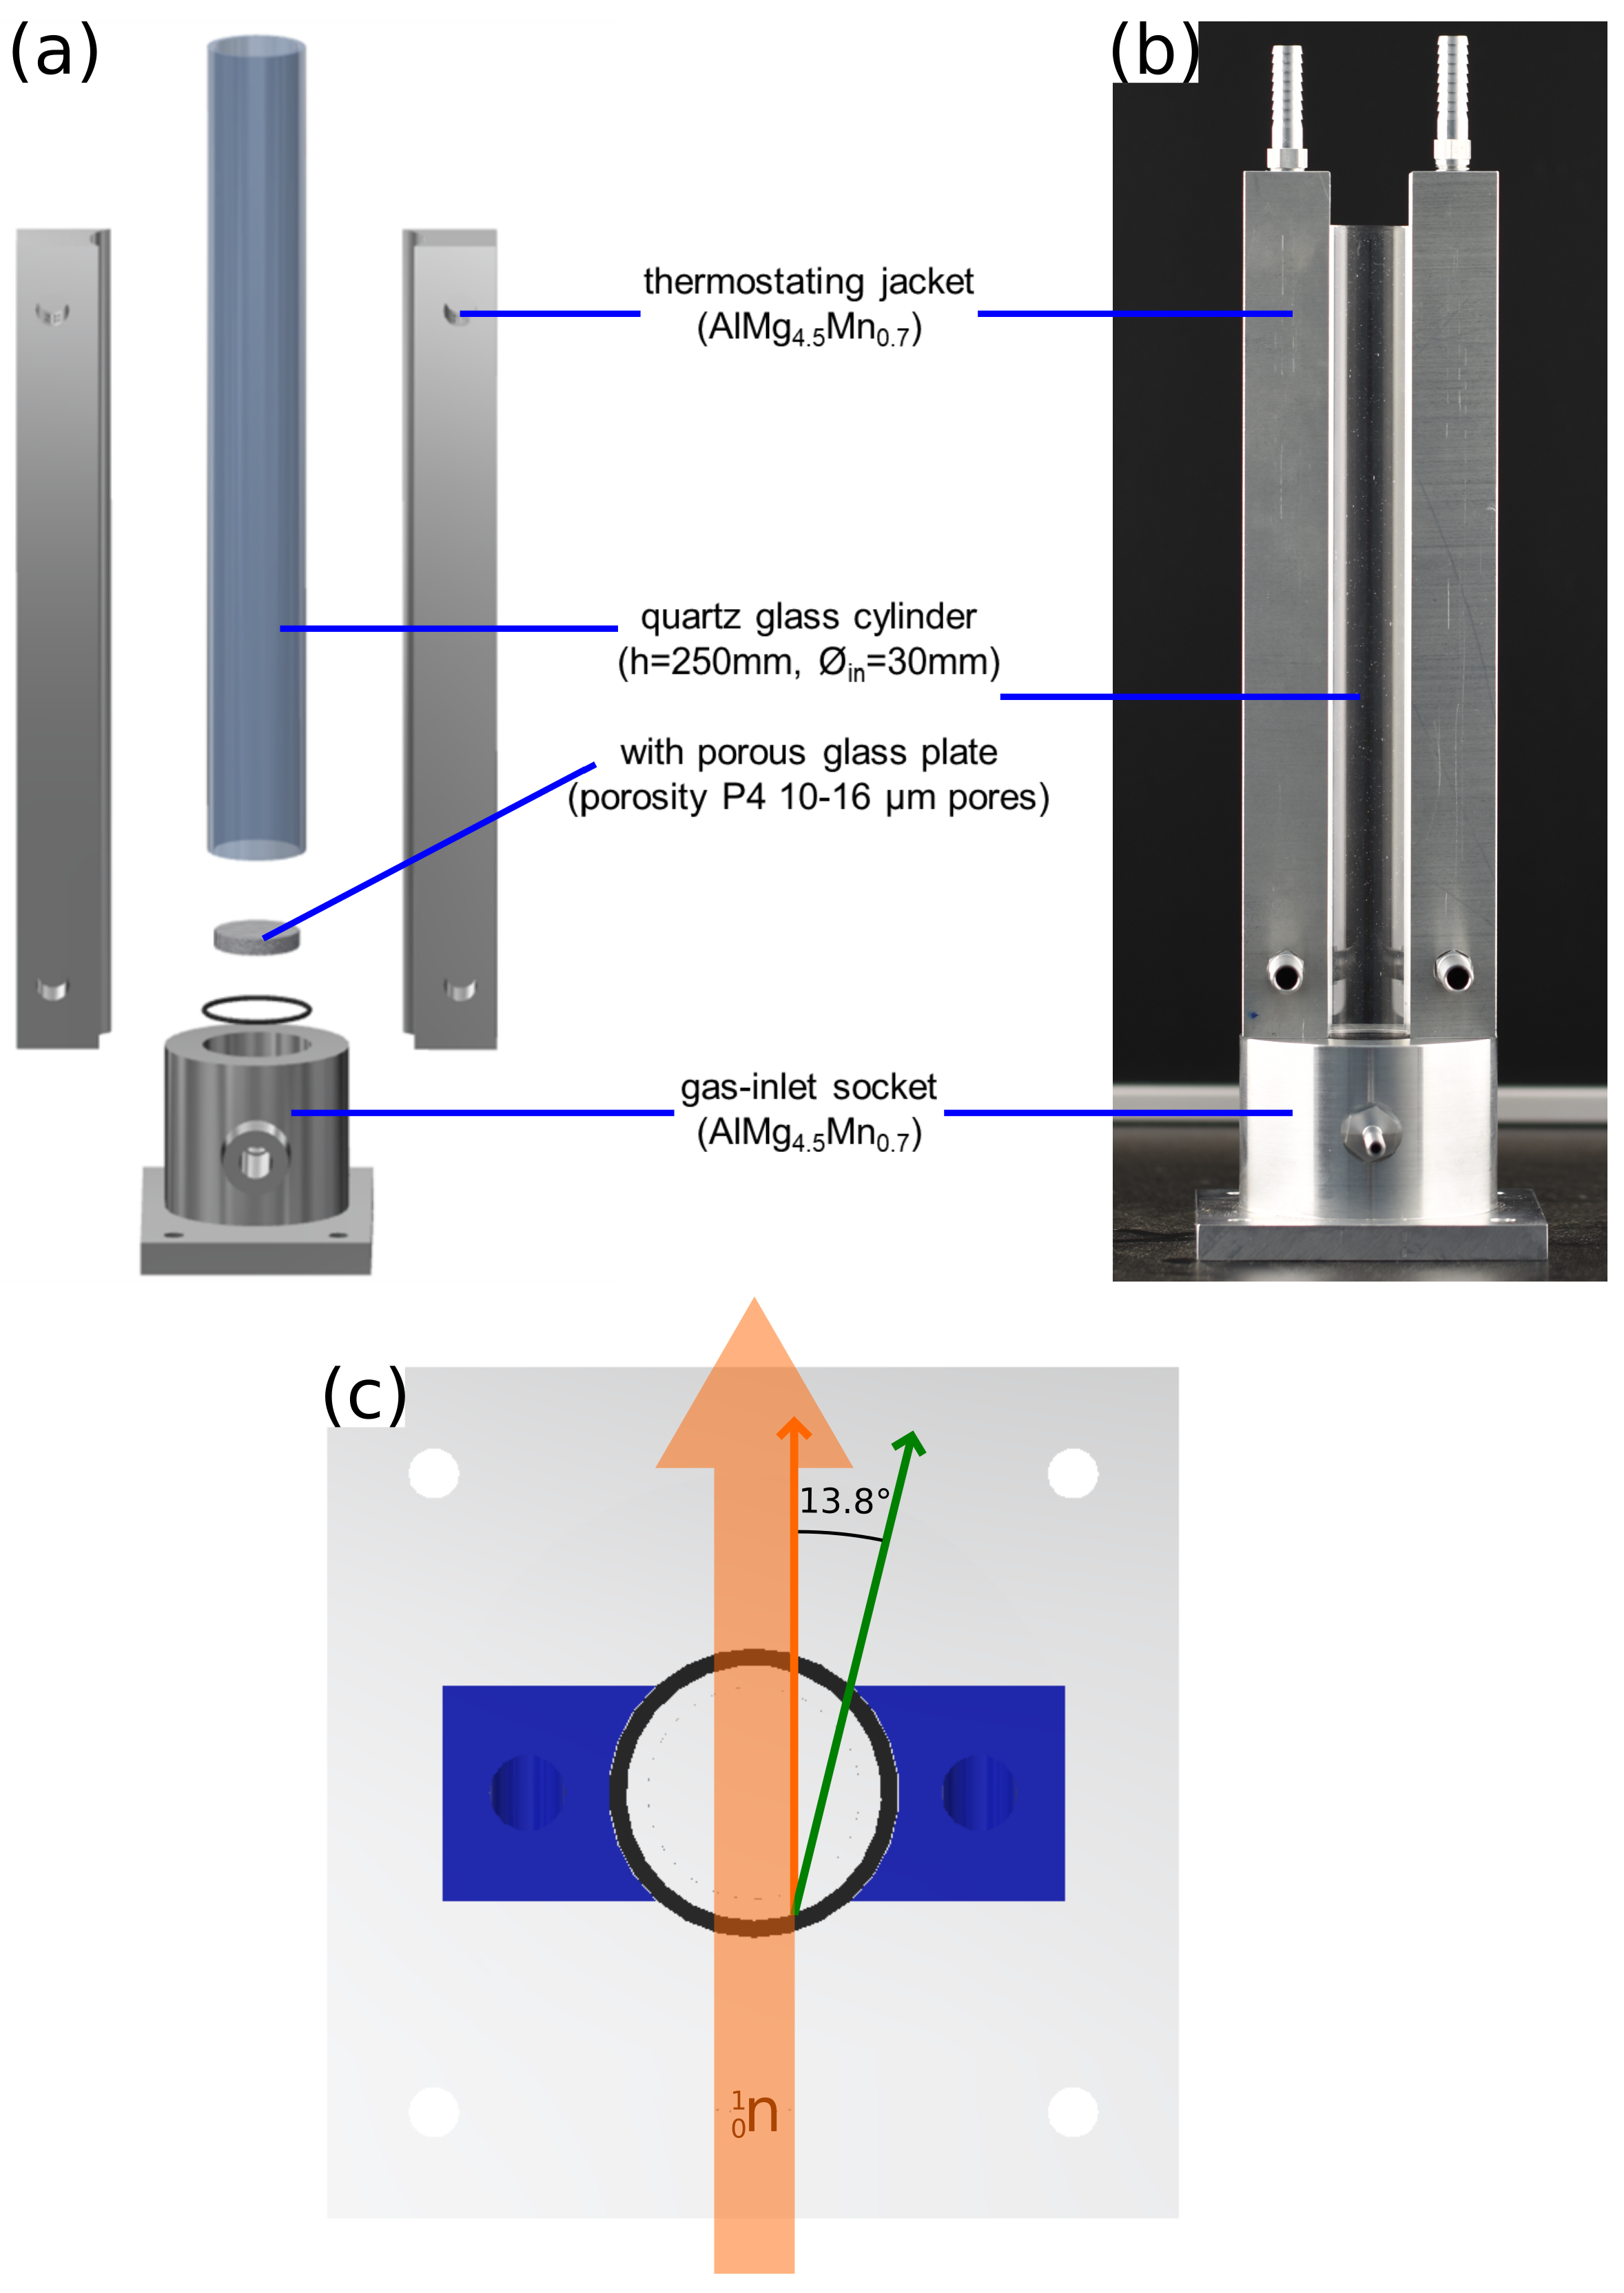
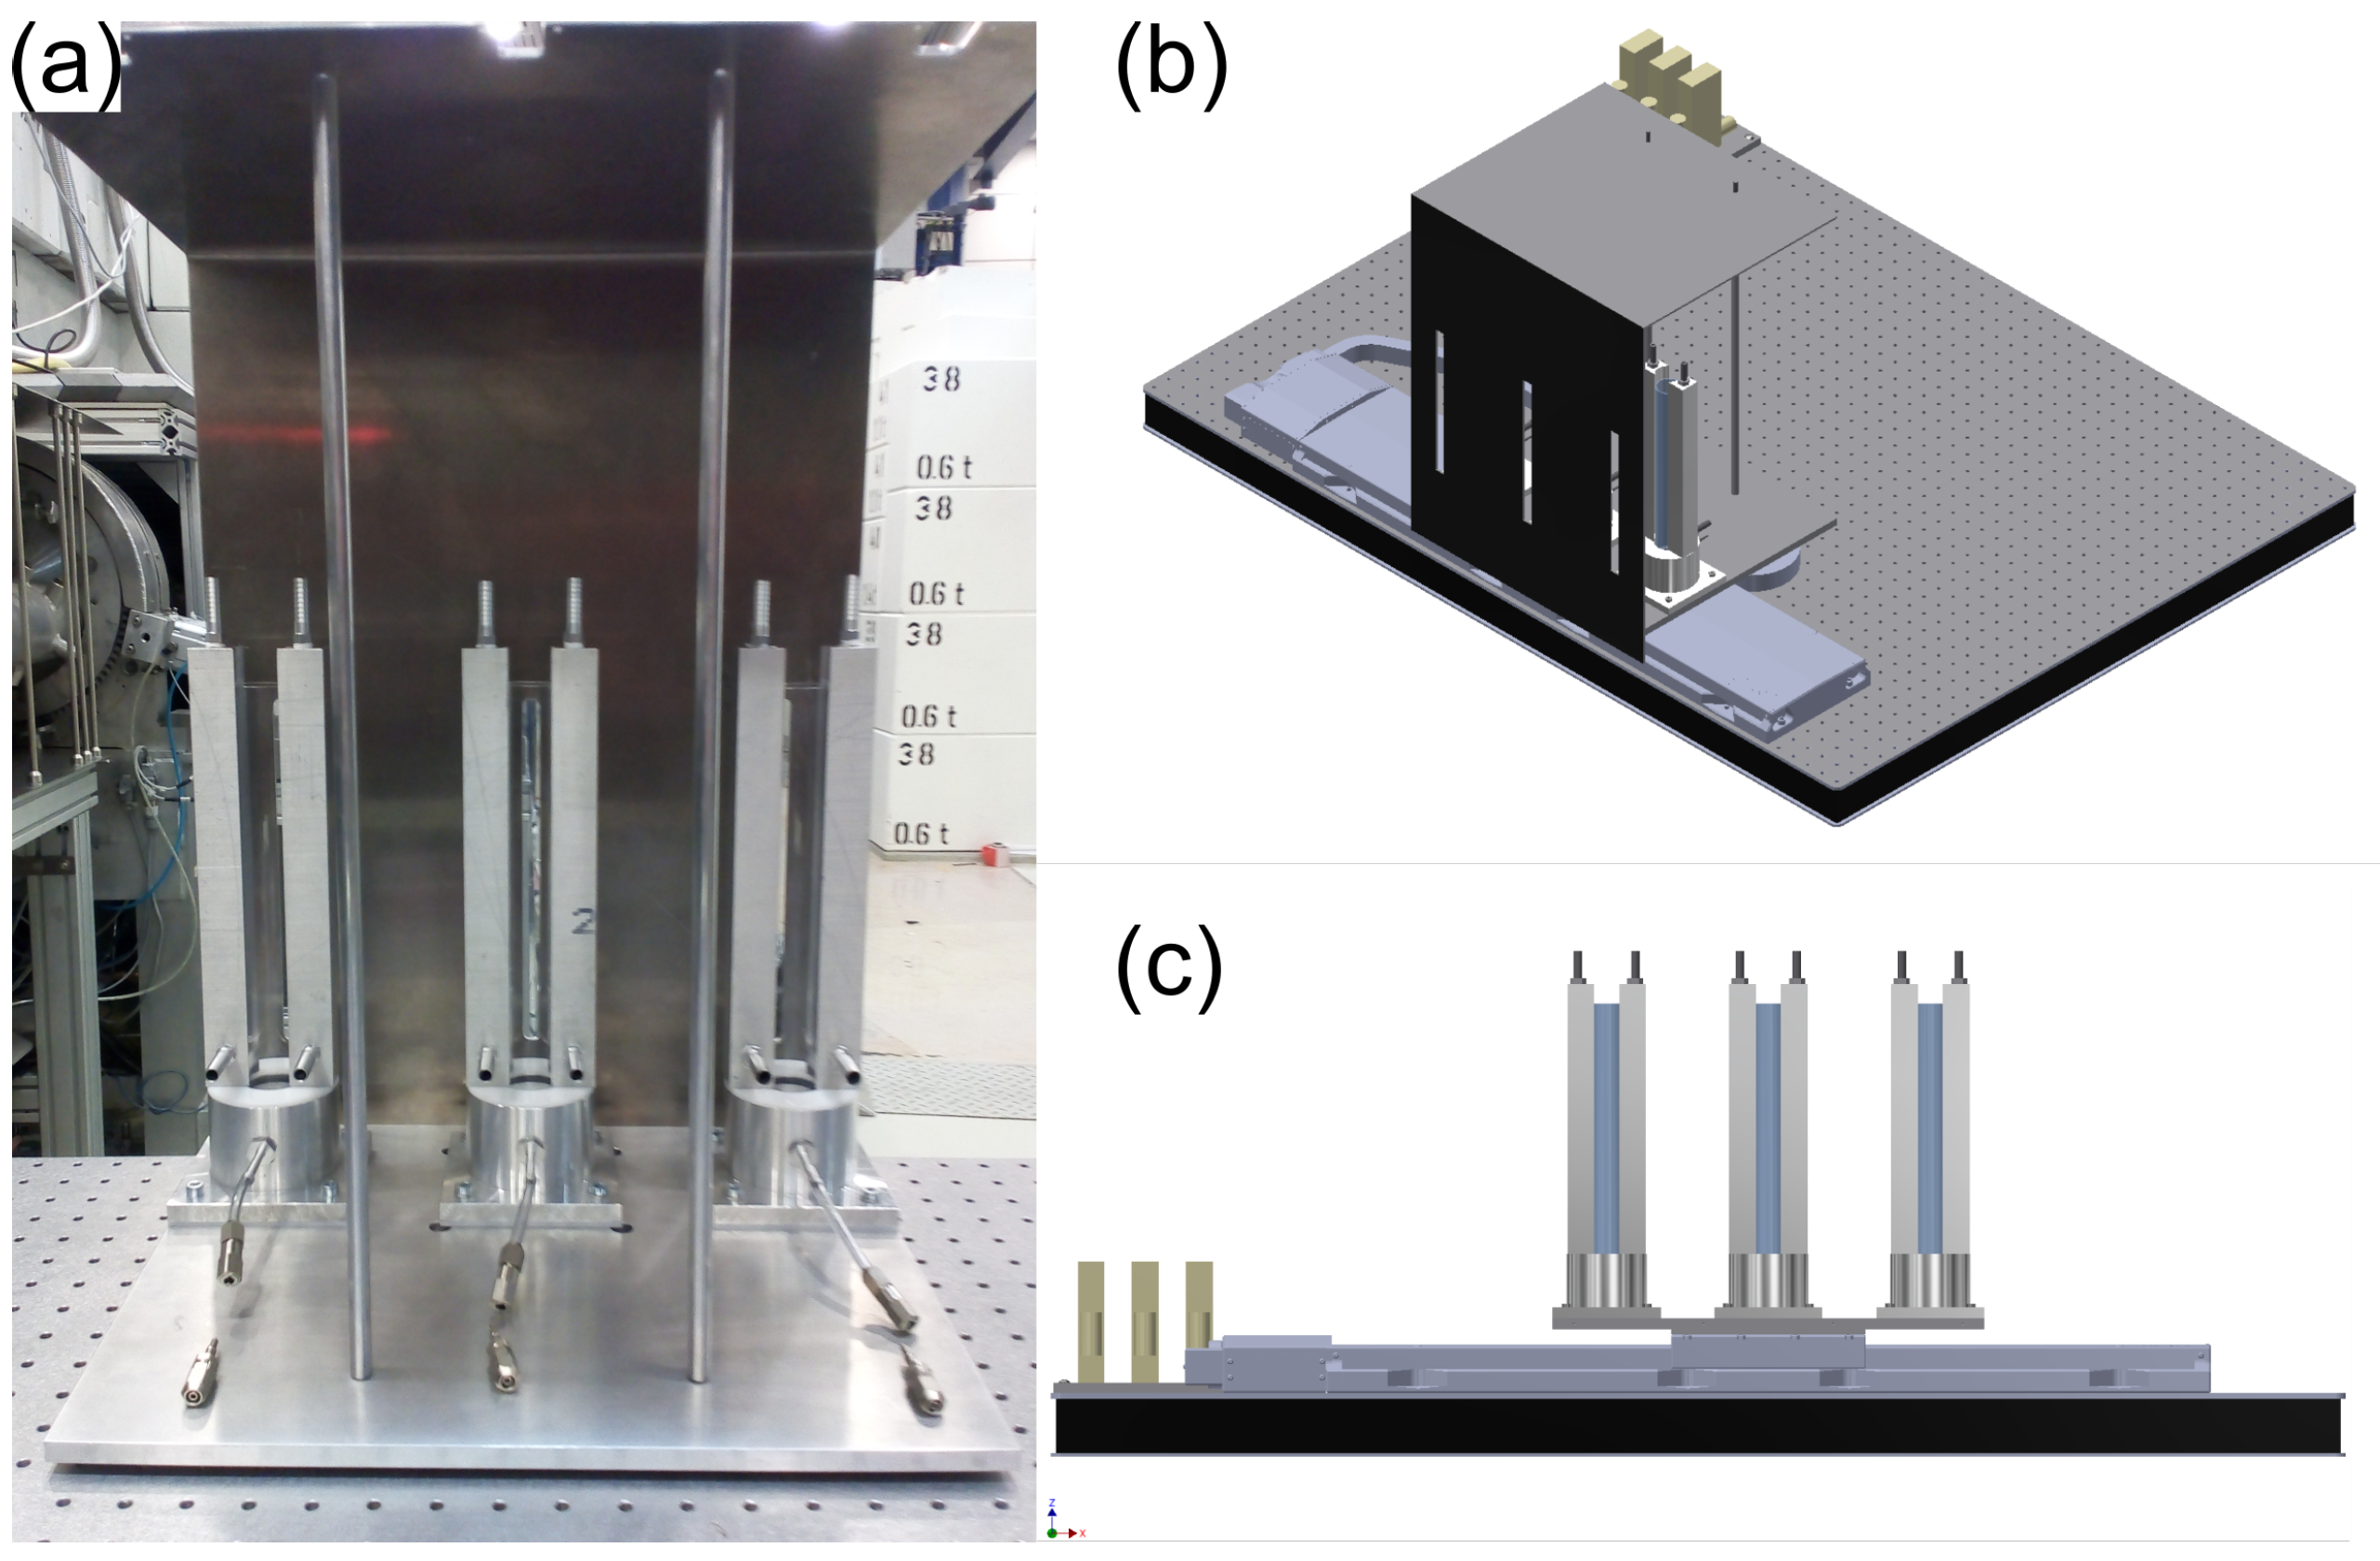
2.1. General Construction

The main parts of the sample environment are three foam cells, in which the foam will form. Figure 1a,b show an engineering drawing and a photograph of a single foam cell. Each cell consists of a 250 mm long quartz glass cylinder with an inner diameter of 30 mm and a wall thickness of 2 mm. Quartz is almost transparent to neutrons and the circular design avoids the rupture of lamellae at edges. A porous quartz glass plate (pore size 10–16 µm, porosity P16 (ISO 4793)) is fused to the bottom of the cylinder. The whole cylinder is mounted to a gas-inlet socket via an O-ring in a crimp connection. From below, a gas (e.g., air or nitrogen) is pressed through the porous plate, which breaks the continuous gas flow into small bubbles. This results in the formation of foam, when an appropriate foaming solution is poured into the cylinder. Finally, the gas exits the cylinder at the open top, which ensures pressure equilibrium. For temperature control, two thermostating jackets are fitted to each foam cylinder, using titanium screws from the bottom of the gas-inlet socket. One of the main features and advantages of this foam cell is the possibility to measure at any position along the height of the foam cylinder. Therefore, the thermojackets are designed in a way to leave a slit-shaped gap between them. The width of this gap governs the maximum scattering angle accessible. Figure 1c shows a sketch in top view for the estimation of the maximum scattering angle at the geometrically least favorable position. For a scattering event occurring at the edge of a 10 mm wide primary neutron beam (highlighted in orange) at the side facing the primary beam, the scattering angle limit 2 θ l i m is 13.8°. Assuming a neutron wavelength of λ = 5   Å , the maximum scattering vector q m a x is calculated by
q m a x = 4 π λ sin ( θ l i m ) 0.3   Å 1
This corresponds to a minimum measurable size of 2 nm in real space, which is sufficient to resolve structures such as foam films or incorporated objects such as micelles or nanoparticles. It is worth noting that the SANS instruments LoKI and SKADI at the ESS will be operated with a predicted neutron wavelength band of 2   Å to 22   Å and 3   Å to 21   Å , respectively [2]. We expect an accessible q range of 0.005–0.6 Å 1 for our foam cell at these ESS instruments. The lower limit is governed by the instrument’s design and the upper limit by the cell geometry. This will lead to a range of measurable sizes of ca. 1–125 nm. The gas-inlet socket and thermostating cylinder are made of AlMg 4.5 Mn 0.7 , a special aluminum alloy that is easy to process and not activated by neutrons. The hose connectors are made of AlMg 4.5 and, therefore, are also not activated by neutrons. All three foam cells are placed in a folded AlMg 4.5 socket.
The side facing the primary neutron beam is protected by an aluminum plate covered with 1 mm B 4 C including rectangular slits at the respective positions of the foam cells. Since the cells are open to the top, an aluminum cover was placed above the cells to avoid dust incorporation. A backview of the mounted cells is shown in Figure 2a. The setup is placed on a translation stage (travel range 508 mm), which allows remote controlled sample changes between the different foam cells as shown in Figure 2b,c. The entire setup is mounted on a breadboard ( 900 × 1200   mm 2 , Newport Spectra-Physics GmbH, Darmstadt, Germany). Later on at the ESS, the entire setup will be mounted on a lifting table, which is also part of the unified carrier system used by all FlexiProb SEs. This will ensure fast setup changes by removing the entire setup including the board. The lifting table installed at LoKI and SKADI will have a vertical displacement range of >300 mm with a 0.1 mm positional accuracy, which is sufficient for the foam cell SE.

2.2. Gas Flow Control

The flow of the foaming gas is controlled by a FG-201CV mass flow controller (Bronkhorst, AK Ruurlo, The Netherlands) operating at an upstream pressure of 3 bar. The gas flow rate can be adjusted between 0–30 mL min 1 . The three foam cells have separate gas circuits with individual mass flow controllers. This opens the possibility to prepare foams while another is measured or to define different foam states with a fast shift between different columns. The devices are connected via RS232 connections to a serial device server (NPort 5450, Moxa, Taipei, Taiwan). Here, the RS232 signal is converted into an Ethernet signal, which is transmitted via LAN to the instrument control. Communication is realized on a dynamic data exchange (DDE) server implemented in the supplier’s FlowDDE software (Version 4.81). With this connection established, the devices are controlled using the DDE client program FlowView (Version 1.23) also distributed by the supplier.
Figure 3 shows the results of a foaming experiment in which 12 mL of tetradecyltrimethylammonium bromide (C14TAB) ( c = 3.5   mM ) surfactant solution were foamed with synthetic air at a flow rate of V ˙ = 30   mL min 1 . Pictures of the foam column were taken in a time interval of 80 s and the respective foam heights extracted by image analysis. Neglecting foam decay, a theoretical foam height h t h ( t ) was calculated using Equation (2) for comparison, which is based on the volumetric gas flow rate and the cross-sectional area of the foam cell.
h t h ( t ) = V ˙ · t A
Here, V ˙ is the volumetric gas flow rate, t is the foaming time, and A is the cross-sectional area of the foaming cylinder.
The measured values are in good agreement with the theoretical foam height as shown in Figure 3b. This shows that the gas flow system works and the foam is formed as intended.

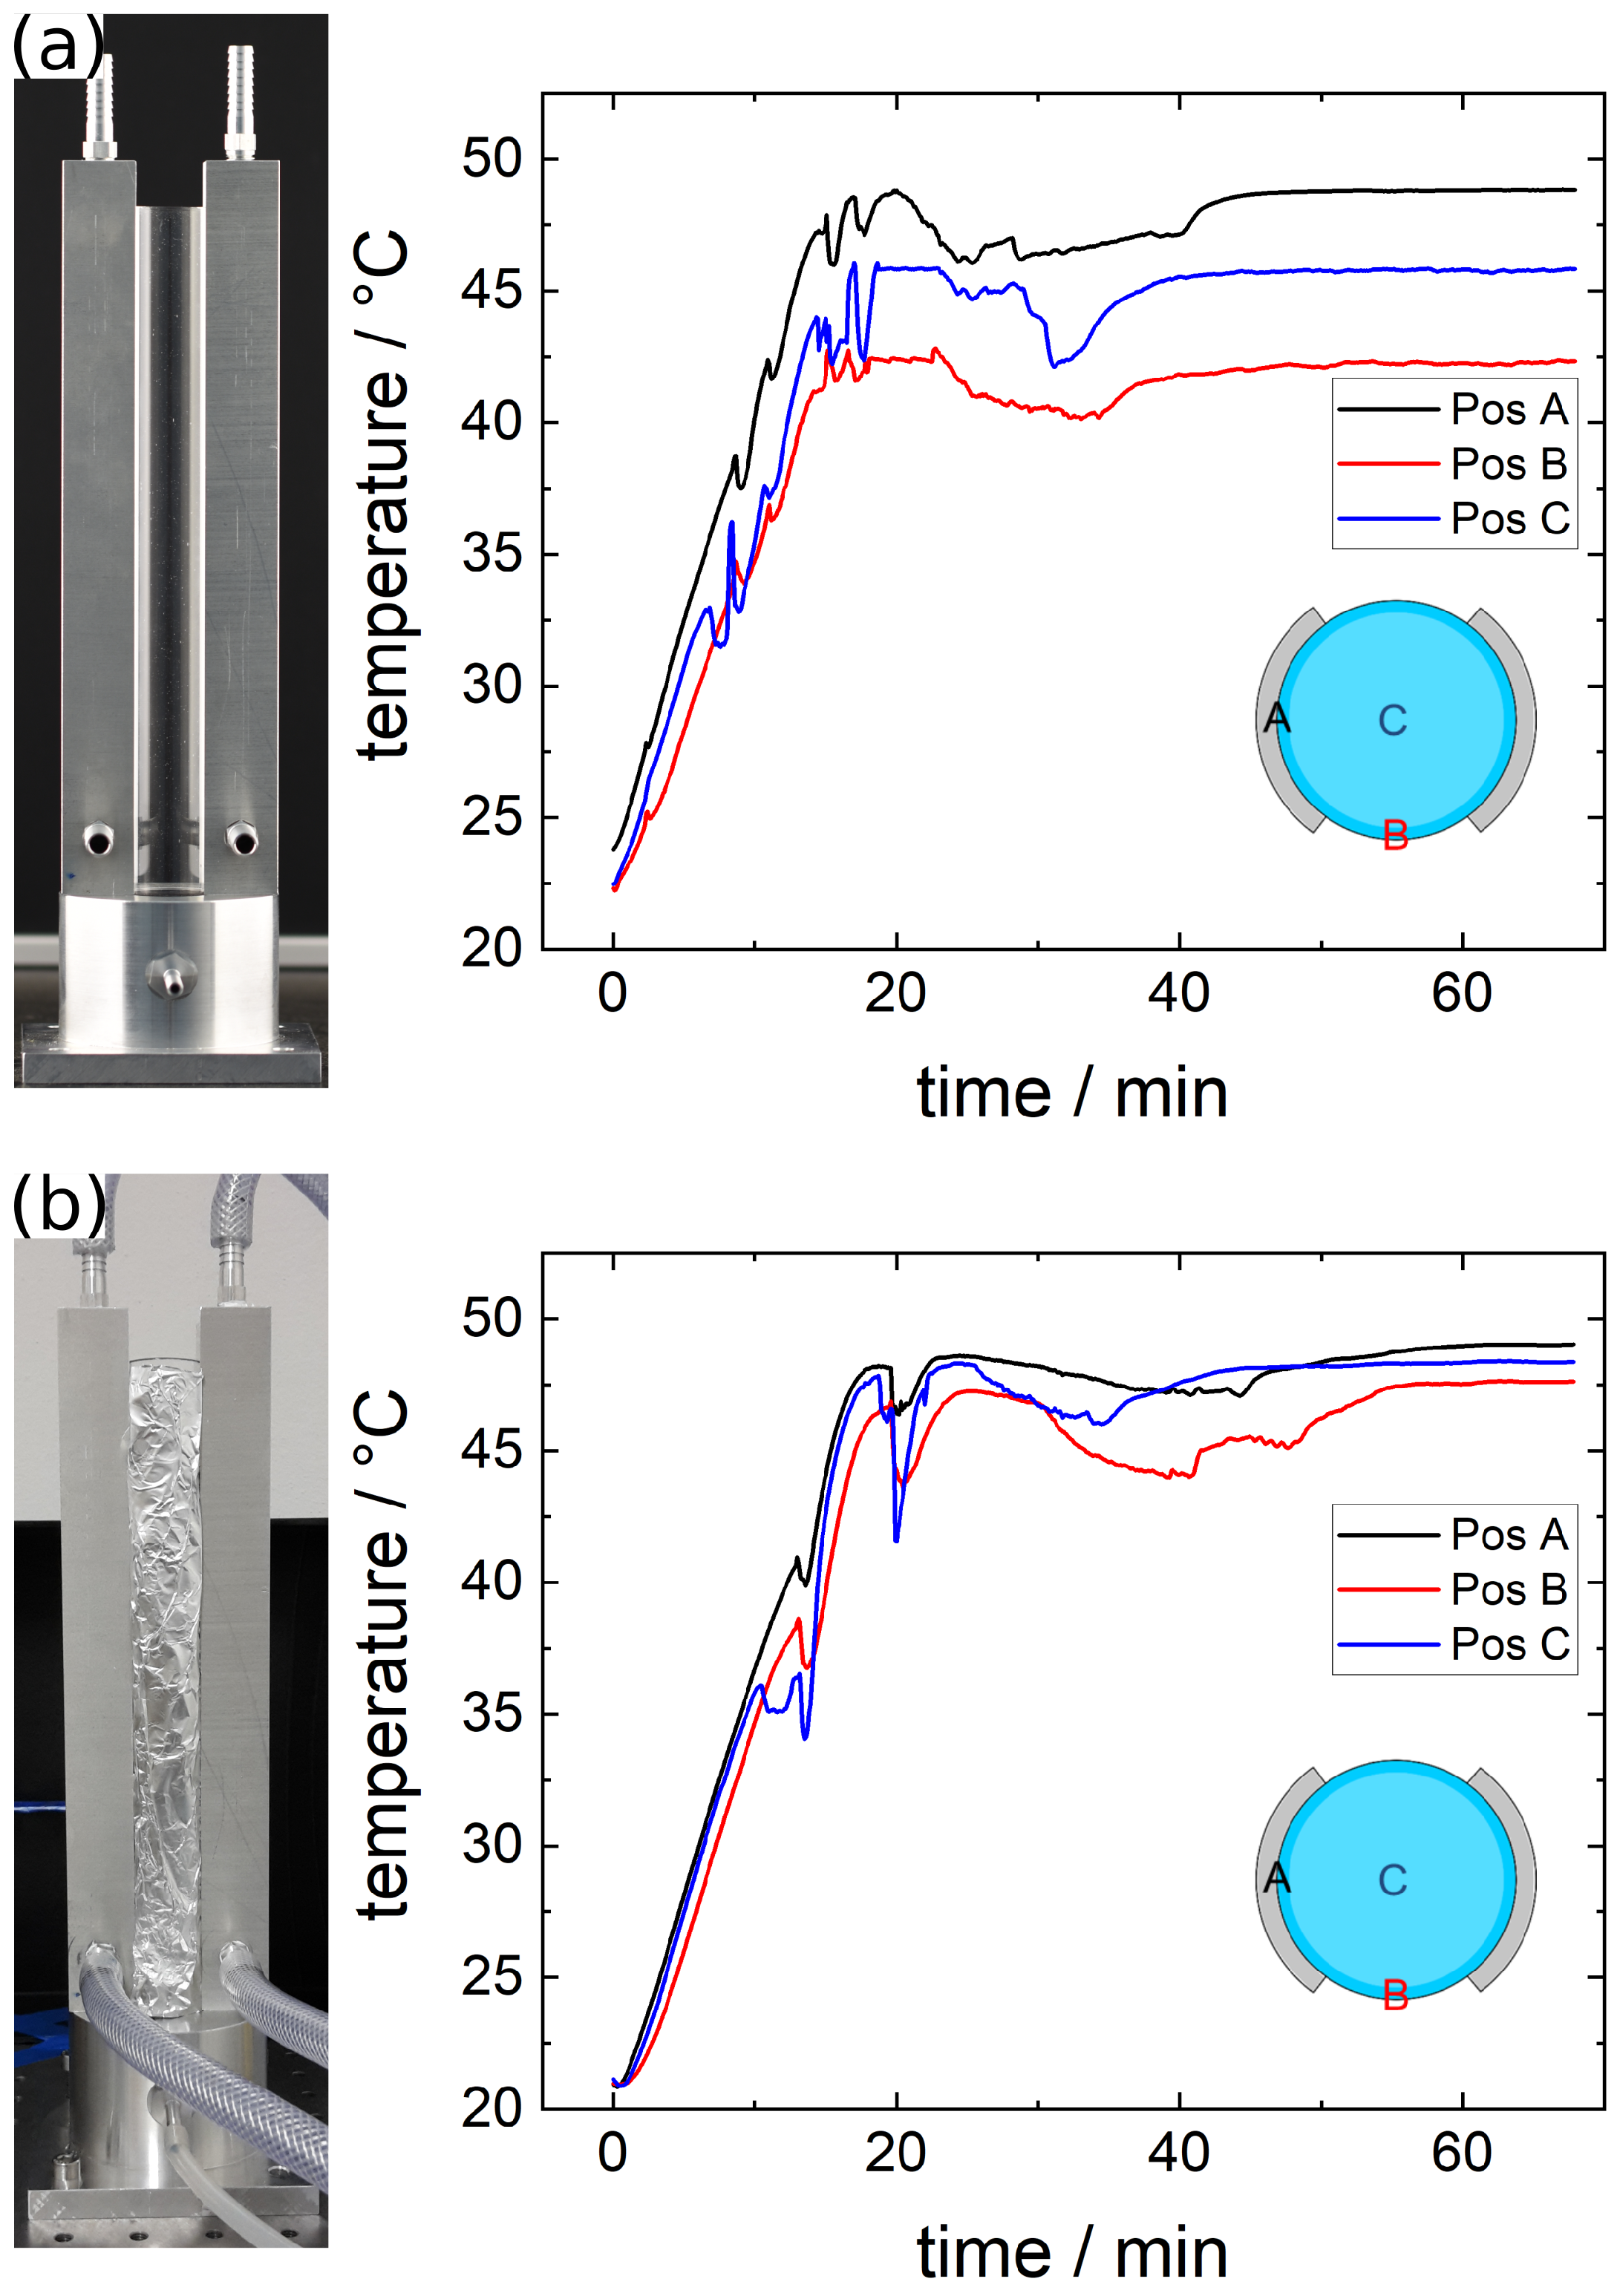
2.3. Temperature Control

Temperature change of the foams is achieved by two AlMg 4.5 Mn 0.7 thermostating jackets at both sides of each foam cylinder. The thermostating jackets of all three sample cells are connected via appropriate distributors to a Julabo FP50-HL circulating thermostat (Julabo GmbH, Seelbach, Germany) with a temperature range of −50 °C to 200 °C when the appropriate thermofluid is used. For studying aqueous foams, however, an achievable temperature range of 10 °C to 80 °C is typically sufficient, allowing the use of water as thermofluid. To validate the performance of the heat input by the thermostating jackets, tests with a foam stabilized by C14TAB at its critical micelle concentration of c = 3.5 mM were performed [34]. Therefore, 12 mL of the surfactant solution were foamed at ambient temperature with a synthetic air flow of 15   mL min 1 . After the foam reached the top of the quartz cylinder, the gas flow was stopped and the setpoint of the water bath thermostat was adjusted to 50 °C. The evolution of the temperature was monitored by three Pt-100 temperature sensors (model PT-102-3S-QT, Lake Shore Cryotronics, Inc., Westerville, OH, USA) at different positions at a height of 11.5 cm inside of the foam cylinder. The positions were chosen in a way to reflect the asymmetric shape of the thermostating jacket around the foam cylinder as indicated by A, B, and C in Figure 4. One sensor was put in the center of the cylinder (C), while the remaining two sensors were placed on the rim of the foam column, one in close proximity to the thermostating jacket (A) and one right behind the neutron window slit (B). The evolution of the temperature and a schematic sketch of the different positions are shown in Figure 4a.
Following an initial increase, the temperature reaches a plateau at all three positions after around 20 min. The final temperatures were 48 °C at position A (close to thermostating jacket), 42 °C at position B (behind neutron window slit), and 45 °C at position C (center). This temperature gradient is explained by the asymmetric shape of the thermostating jacket around the foam cell and the low heat conductivity of foams. As explained in Section 2.1, this asymmetric shape was chosen to allow SANS measurements at any height along the foam cylinder, accepting the drawback of a potential temperature gradient. The temperature jumps observed at every position are most likely due to air bubbles passing by the sensors, changing the heat conductivity next to them.
In order to reduce this temperature gradient, the experiment was repeated with the foam cylinder wrapped in aluminum foil (see Figure 4b). Again, the temperature reaches a plateau after around 20 min with final temperatures of 49 °C at position A, 47 °C at position B, and 48 °C at position C. Wrapping the cylinder in aluminum foil decreases the temperature gradient inside the foam because of the improved thermal contact between the quartz cylinder and the thermostating jackets. In addition, aluminum is almost transparent to neutrons and is also often used as a material for neutron windows. A drawback of this approach is that it is no longer possible to observe the foam during a SANS experiment with a camera. Detecting the formation of holes at the measuring position is sometimes beneficial, especially when dealing with rather unstable foams where holes may form randomly. Depending on the requirements regarding the accuracy of temperature control, one of the two methods described can be used.

2.4. Sample Positioning

Horizontal sample alignment is achieved with a linear translation stage (LS-180, Physik Instrumente GmbH & Co. KG, Karlsruhe, Germany) with a maximum load of 100 kg, an operating displacement of 508 mm at a maximum speed of 150   mm   s 1 , and a bidirectional repetition accuracy of ±0.1 μm. The linear stage is driven by a two-phase bipolar half-coil stepper motor (model PK-258-02B, Oriental Motor, Tokyo, Japan). The position is monitored with a linear optical encoder with RS-422 quadrature signal transmission (LIA-20, Numerik Jena, Jena, Germany). The entire setup will be placed on an optical breadboard based on a lifting table, which ensures the vertical sample alignment. The control unit was built according to ESS specifications ensuring compatibility with ESS control standards. Figure 5 shows the corresponding circuit diagram for the custom built crate. The translation stage is labeled with “AXIS 1”. For testing purposes, a two-axis goniometer was also integrated (motor top, motor bottom, encoder top, and encoder bottom). However, in the framework of the foam cell SE, this goniometer is not used.
The custom built 19-inch crate is equipped with 24 V (BLOCK Transformatoren-Elektronik GmbH, Verden, Germany) and 48 V (Mean Well Enterprises, New Taipei City, Taiwan) power supplies. The latter one provides power for the motors while the first one provides the power for the control unit. The control unit is based on an Ethernet fieldbus system (EtherCAT, Beckhoff Automation GmbH & Co. KG, Verl, Germany). An embedded PC (CX5130) is connected to a potential distribution terminal (EL9189) and a stepper motor terminal (EL7041), which ensure the motor movement. A digital input terminal (EL1808) and a digital output terminal (EL2819) are connected, sending and reading the motor positions. Additionally, an incremental encoder interface terminal (EL5101) is added to read the encoder signal out.
The embedded PC communicates with the hardware of the linear stage via the TwinCAT 3 software. This signal is forwarded to the Experimental Physics and Industrial Control System (EPICS) [35], which will be the unified control software for beamline devices at the ESS and is able to control the devices and monitor their state. The EPICS is used by the Networked Instrument Control System (NICOS) [36], which offers a graphical interface for users and is the outermost layer of the instrument control structure at the ESS. Further details regarding instrument control and data streaming are described elsewhere [37].
From 2015 until 2019, the ESS operated a dedicated testbeamline at the Helmholtz-Zentrum Berlin, also known as V20 [38,39]. Here, a fully workable environment, mimicking a future ESS instrument, was built up for testing and development. The linear stage was successfully tested at this instrument, proving the compatibility with the ESS standards in terms of control, interaction with other devices, and data logging.
The integration of the peripheral SE components into NICOS also allows programmable measurements with automated changes between the three foam cells and the measurement height along each cell, varying temperature, and gas flows.

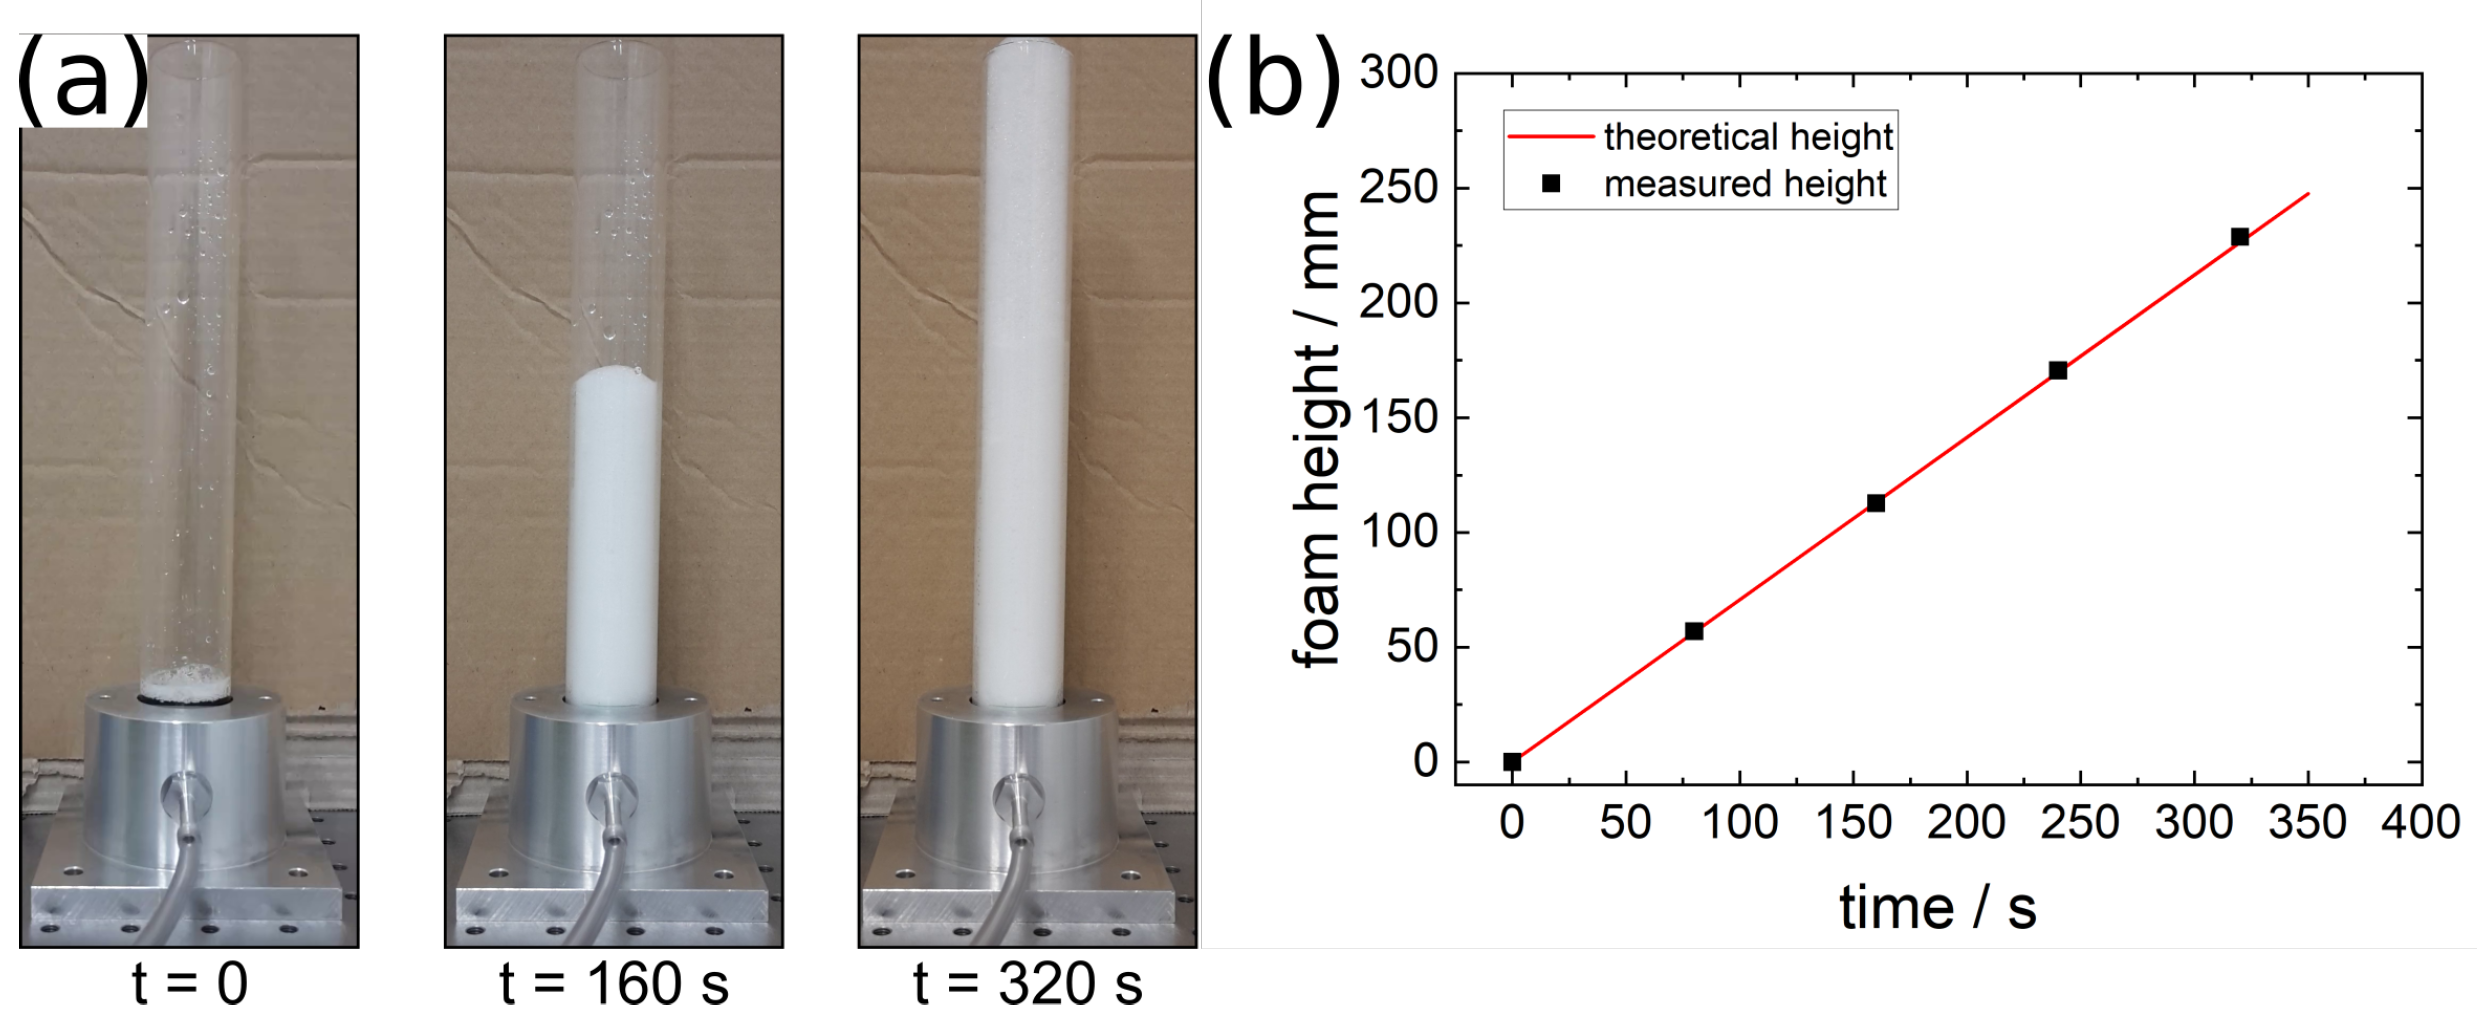
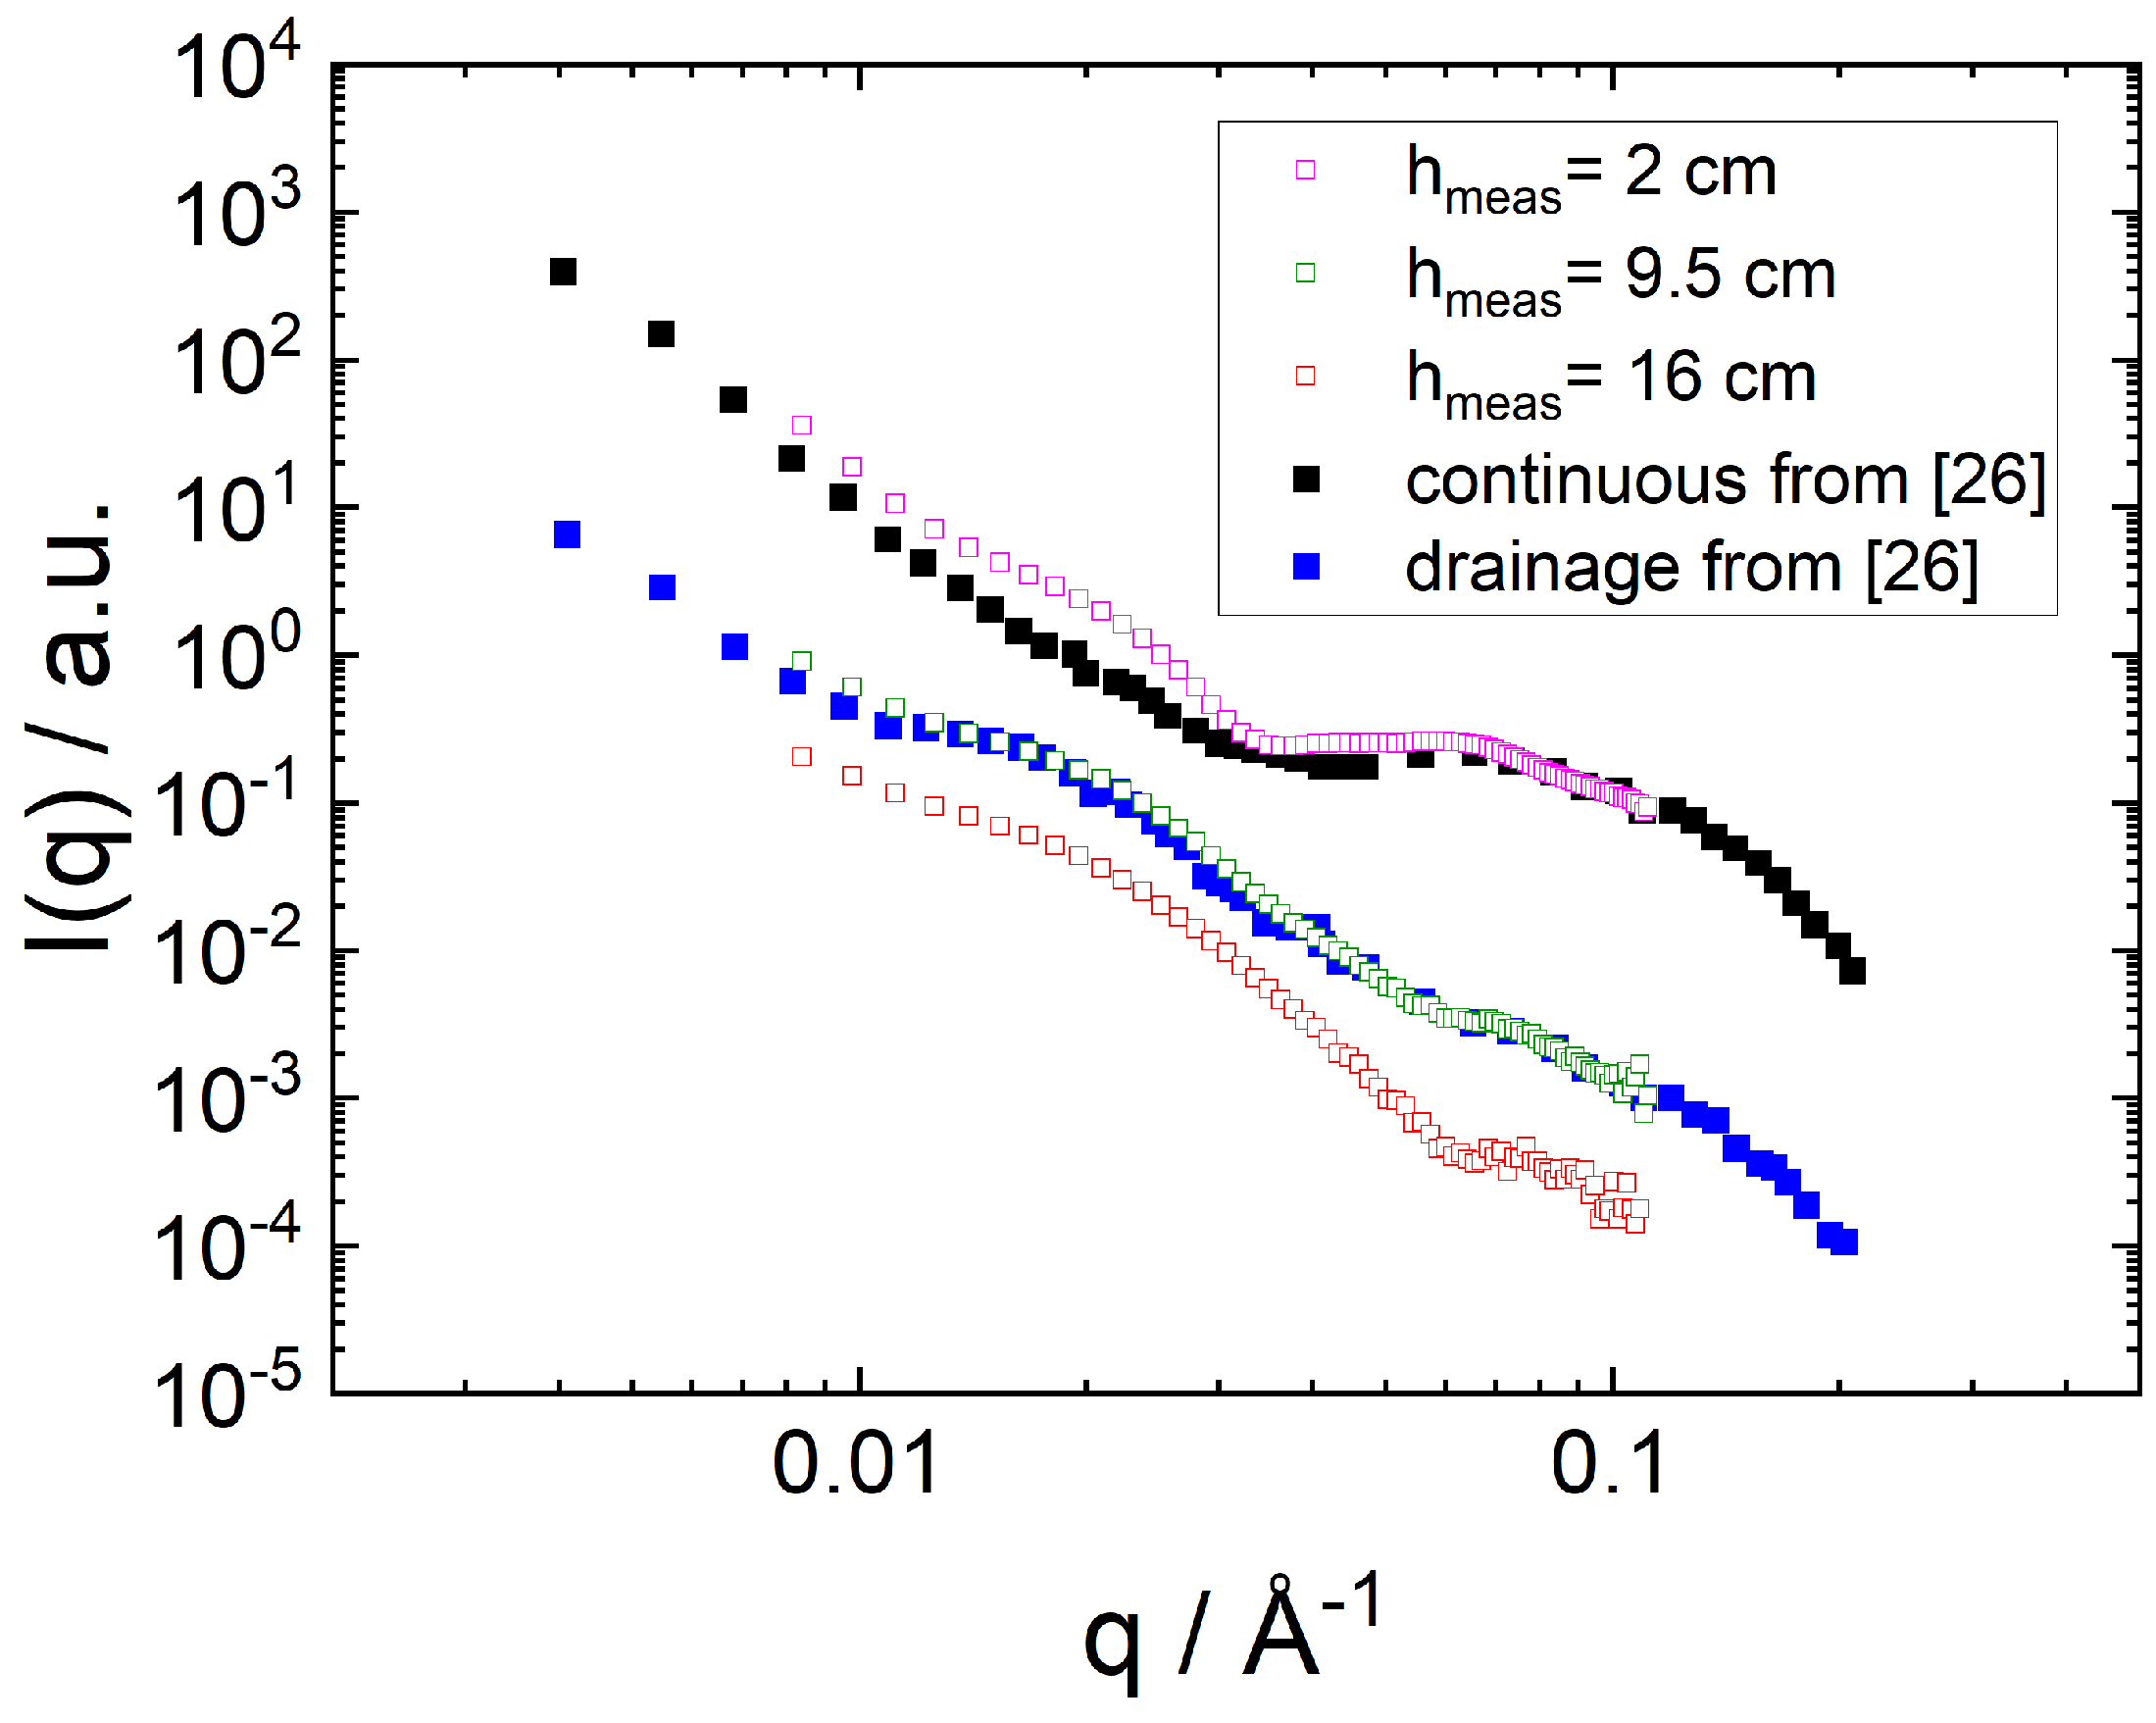
3. Neutron Test Measurements

Test measurements with a single foam cell were carried out at the KWS-1 small angle scattering diffractometer at the Heinz Maier-Leibnitz-Zentrum (MLZ, Garching, Germany) [40,41]. Figure 6a shows the foam cell at the beamline. All measurements were performed at a wavelength of 4.92   Å with a 10% wavelength resolution (FWHM), a squared neutron beam of 10 × 10   mm , and a data acquisition time of 5 min. Scattering patterns were recorded with a 6Li-scintillation detector with photomultiplier tubes and a spatial resolution of 5.3 × 5.3   mm 2 . All measurements were background corrected due to dark current. The foam measurements were also corrected for the scattering by the empty cell. The sample–detector distance was determined using an optical theodolite. Figure 6b shows the 2D detector image of the empty foam cell recorded at a sample–detector distance of 7.615 m. As expected, the empty quartz cylinder provides a low background with no significant secondary scattering.
Test measurements were conducted with a foam stabilized by 25   g   L 1 (86.7 mM) sodium dodecyl sulfate (SDS), which is well above the critical micelle concentration of 8 mM [42], at different foam heights. This system was chosen because of the high foam stability and the fact that the first study ever performed on SANS on foams also used a SDS foam at this concentration, making it a reference system [26]. 12 mL of the surfactant solution were initially foamed with a nitrogen gas flow rate of 10   mL   min 1 . After the foam level reached a height of around 18 cm, the gas flow was reduced to 1   mL   min 1 . At this flow rate the foam height does not change anymore, meaning that the foam formation at the bottom and the foam decay at the top of the column are balanced. This results in a steady-state foam, in which the foam height corresponds to the age of the foam (i.e., the time passed after its formation at the bottom of the cylinder) and therefore its drainage state.
Figure 6c–e shows the corresponding 2D detector images recorded at 16 cm, 9.5 cm and 2 cm above the foaming solution. All images exhibit an isotropic scattering signal around the primary beam. This reveals that the neutron path length through the cell is long enough to average over all orientations of the foam structure, namely the liquid films, within the measuring window. The scattered intensity decreases with increasing measurement height. This is explained by the decreasing liquid volume fraction of the foam with increasing foam age (or height) and proves that different states of the foam can be accessed with a steady-state foam in one experiment.
Axelos et al. studied the same system using a similar foam cell with a single quartz window for the neutron beam in the lower third of the cylinder and the reported values are shown for comparison (closed squares in Figure 7) [26]. They performed two types of measurements. The first type of measurement was a continuous foaming experiment, in which the SANS data were recorded while nitrogen was continuously bubbled through the foaming solution. This resulted in a wet foam at the measuring position. The second type of measurement was a drainage experiment, in which the gas flow was stopped after foam formation. After some time, this led to a dry foam at the measuring position at the bottom of the foam column. These two types of foams are related to different foam heights in a steady-state foam. Here, a wet and fresh foam is observed at the bottom while a dry and aged foam is observed at the top of the steady-state foam.
The measured radial averaged scattering curves are plotted in Figure 7 (open squares). The data were shifted in intensity for better comparison. Normalization of SANS data of foams is still challenging and was not an aim of this experiment. The determination of the foam’s liquid volume fraction based on the neutron transmission is prone to errors, since most foams show a high transmission close to 1 [26,29]. In general, the trend of measured scattering curves are in good agreement with the literature data, showing that there are no intrinsic artefacts caused by the foam cell. Data recorded at a height of 2 cm are similar to the one of a wet foam reported in literature and the data recorded at a height of 9.5 cm are in good agreement with the one of a drained foam. The data measured at a height of 16 cm correspond to a foam in an even more drained state. The shoulder at q 0.08   Å 1 is attributed to surfactant micelles present in the liquid foam films. Consequently, the intensity of this shoulder decreases with increasing foam height, as the liquid drains out of the foam films over time. The shoulder at q 0.02   Å 1 occurs due to scattering at the liquid foam films and is related to their thickness [26]. The fact that this shoulder was not observed by Axelos et al. in their wet continuous foam could be explained by an even lower measuring position or higher gas flow rate in the steady-state. Both factors would results in a wetter foam, leading to a less ordered foam structure with a higher polydispersity regarding the film thickness and, therefore, in a smearing out of the corresponding scattering feature. Since it was possible to reproduce two different experiments reported in the literature by scanning along the foam height of a steady-state foam, the presented approach is valid for accessing the foam in different drainage stages with varying liquid volume fractions in one experiment.

4. Conclusions

We successfully designed, constructed, and tested a sample environment (SE) for SANS measurements on liquid foams. The SE allows the control of the gas flow rate used for foam formation and offers the possibility to control the temperature. The complete foam cylinder is made from neutron-transparent quartz glass, which enables SANS measurements at any position along the foam height and the possibility to study different drainage stages in a single experiment. Additionally, a sample changer on the basis of a linear stage was constructed and completely integrated into the foreseen ESS control structure at the ESS test beamline V20 at the HZB. Finally, SANS test measurements were successfully performed at the KWS-1 beamline at the MLZ with a model foam already reported in literature.
The presented SE is well-suited for studying liquid foams with SANS and should meet the special requirements of neutron sources with high brilliance such as the ESS, where an efficient use of the allocated beamtime becomes more important and the time required for sample changes should be reduced to an absolute minimum. This is accounted for by the sample changer for up to three foam cells and the possibility to access different states of the same foam in a single measurement cell. In return, a neutron source such as the ESS will allow new and/or more detailed SANS experiments using foams. The high neutron flux at the ESS will reduce the data acquisition time for a similar experiment as presented above at least by one order of magnitude to below 1 min. This will enable experiments with less stable foams or studies investigating structural changes in foams caused by external stimuli.

Author Contributions

Conceptualization, T.H., P.M.-B., and R.v.K.; planning and discussion of setup components, M.K., O.L., T.W., L.P.K., A.J.S., L.W., S.J., H.F., H.S., and A.H.; construction and test of setup components, M.K. and O.L.; software integration, M.K., O.L., T.B., and P.B.; SANS measurements, M.K., O.L., and H.F.; writing—original draft preparation, M.K.; writing—review and editing, O.L., T.W., L.P.K., A.J.S., L.W., S.J., H.F., T.B., P.B., H.S., A.H., T.H., P.M.-B., and R.v.K.; visualization, M.K.; supervision, O.L. and R.v.K.; project administration, T.H.; funding acquisition, T.H., P.M.-B., and R.v.K. All authors have read and agreed to the published version of the manuscript.

Funding

This research was funded by the German Federal Ministry for Education and Research (BMBF) within the project “FlexiProb” sample environment grant number 05K2016.

Institutional Review Board Statement

Not applicable.

Informed Consent Statement

Not applicable.

Data Availability Statement

Derived data supporting the findings of this study are available from the corresponding author upon reasonable request.

Acknowledgments

We thank Judith Houston (ESS) for valuable discussions and Dirk Oppermann (TU Darmstadt) for help with constructing the foam cell. Furthermore, We thank Ibrahim El-Idrisi (TU Darmstadt) and Konstantin Quoll (HZB) for wiring and testing the motion control crate. We would also like to acknowledge Robin Woracek (ESS) and Peter Kadletz (ESS) for the help at the ESS test beamline.

Conflicts of Interest

The authors declare no conflict of interest.

References

  1. Garoby, R.; Vergara, A.; Danared, H.; Alonso, I.; Bargallo, E.; Cheymol, B.; Darve, C.; Eshraqi, M.; Hassanzadegan, H.; Jansson, A.; et al. The European Spallation Source Design. Phys. Scr. 2017, 93, 014001. [Google Scholar] [CrossRef]
  2. Andersen, K.; Argyriou, D.; Jackson, A.; Houston, J.; Henry, P.; Deen, P.; Toft-Petersen, R.; Beran, P.; Strobl, M.; Arnold, T.; et al. The instrument suite of the European Spallation Source. Nucl. Instrum. Methods Phys. Res. Sect. A 2020, 957, 163402. [Google Scholar] [CrossRef]
  3. Jackson, A.J.; Kanaki, K. ESS Construction Proposal LoKI—A Broad-Band SANS Instrument. 2013. Available online: https://europeanspallationsource.se/sites/default/files/files/document/2017-09/loki_proposal_stc_sept2013.pdf (accessed on 12 April 2021).
  4. Jaksch, S.; Martin-Rodriguez, D.; Ostermann, A.; Jestin, J.; Duarte Pinto, S.; Bouwman, W.G.; Uher, J.; Engels, R.; Frielinghaus, H. Concept for a time-of-flight Small Angle Neutron Scattering instrument at the European Spallation Source. Nucl. Instrum. Methods Phys. Res. Sect. A 2014, 762, 22–30. [Google Scholar] [CrossRef] [Green Version]
  5. Jaksch, S.; Chennevière, A.; Désert, S.; Kozielewski, T.; Feilbach, H.; Lavie, P.; Hanslik, R.; Gussen, A.; Butterweck, S.; Engels, R.; et al. Technical Specification of the Small-Angle Neutron Scattering Instrument SKADI at the European Spallation Source. Appl. Sci. 2021, 11, 3620. [Google Scholar] [CrossRef]
  6. Schmid, A.J.; Wiehemeier, L.; Jaksch, S.; Schneider, H.; Hiess, A.; Bögershausen, T.; Widmann, T.; Reitenbach, J.; Kreuzer, L.P.; Löhmann, O.; et al. Flexible Sample Environments for the Investigation of Soft Matter at the European Spallation Source: Part I—The In Situ SANS/DLS Setup. Appl. Sci. 2021, 11, 4089. [Google Scholar] [CrossRef]
  7. Widmann, T.; Kreuzer, L.P.; Kühnhammer, M.; Schmid, A.J.; Wiehemeier, L.; Jaksch, S.; Frielinghaus, H.; Löhmann, O.; Schneider, H.; Hiess, A.; et al. Flexible Sample Environment for the Investigation of Soft Matter at the European Spallation Source: Part II—The GISANS Setup. Appl. Sci. 2021, 11, 4036. [Google Scholar] [CrossRef]
  8. Guthrie, M.; Perez, B. ESS Sample Environment Mechanical Interfaces for Instruments. 2015. Available online: https://indico.esss.lu.se/event/915/attachments/7041/10120/ESS-0038078_Mech_Int_20170919_V2_for_distribution.pdf (accessed on 18 May 2021).
  9. Weaire, D.; Hutzler, S. The Physics of Foams; Oxford University Press: Oxford, UK; New York, NY, USA, 1999. [Google Scholar]
  10. Exerowa, D.R.; Gochev, G.; Platikanov, D.; Liggieri, L.; Miller, R. Foam Films and Foams—Fundamentals and Applications; CRC Press: Boca Raton, FL, USA, 2019. [Google Scholar]
  11. Langevin, D. Aqueous foams: A field of investigation at the Frontier between chemistry and physics. ChemPhysChem 2008, 9, 510–522. [Google Scholar] [CrossRef]
  12. Fameau, A.L.; Carl, A.; Saint-Jalmes, A.; von Klitzing, R. Responsive aqueous foams. ChemPhysChem 2015, 16, 66–75. [Google Scholar] [CrossRef]
  13. Hill, C.; Eastoe, J. Foams: From nature to industry. Adv. Colloid Interface Sci. 2017, 247, 496–513. [Google Scholar] [CrossRef] [Green Version]
  14. Horozov, T. Foams and foam films stabilised by solid particles. Curr. Opin. Colloid Interface Sci. 2008, 13, 134–140. [Google Scholar] [CrossRef]
  15. Drenckhan, W.; Saint-Jalmes, A. The science of foaming. Adv. Colloid Interface Sci. 2015, 222, 228–259. [Google Scholar] [CrossRef]
  16. Braun, L.; Kühnhammer, M.; von Klitzing, R. Stability of aqueous foam films and foams containing polymers: Discrepancies between different length scales. Curr. Opin. Colloid Interface Sci. 2020, 50, 101379. [Google Scholar] [CrossRef]
  17. Hofmann, M.J.; Motschmann, H. A parameter predicting the foam stability of mixtures of aqueous ionic amphiphile solutions with indifferent electrolyte. Colloids Surf. A Physicochem. Eng. Asp. 2017, 529, 1024–1029. [Google Scholar] [CrossRef]
  18. Stubenrauch, C.; Miller, R. Stability of foam films and surface rheology: An oscillating bubble study at low frequencies. J. Phys. Chem. B 2004, 108, 6412–6421. [Google Scholar] [CrossRef]
  19. Stubenrauch, C.; Klitzing, R.V. Forces and structure in thin liquid soap films Disjoining pressure in thin liquid foam and emulsion films—New concepts and perspectives. J. Phys. Condens. Matter 2003, 15, R1197–R1232. [Google Scholar] [CrossRef]
  20. Fauser, H.; von Klitzing, R. Effect of polyelectrolytes on (de)stability of liquid foam films. Soft Matter 2014, 10, 6903–6916. [Google Scholar] [CrossRef] [Green Version]
  21. Carl, A.; Bannuscher, A.; Von Klitzing, R. Particle stabilized aqueous foams at different length scales: Synergy between silica particles and alkylamines. Langmuir 2015, 31, 1615–1622. [Google Scholar] [CrossRef] [PubMed]
  22. Braunschweig, B.; Schulze-Zachau, F.; Nagel, E.; Engelhardt, K.; Stoyanov, S.; Gochev, G.; Khristov, K.; Mileva, E.; Exerowa, D.; Miller, R.; et al. Specific effects of Ca2+ ions and molecular structure of β-lactoglobulin interfacial layers that drive macroscopic foam stability. Soft Matter 2016, 12, 5995–6004. [Google Scholar] [CrossRef] [PubMed] [Green Version]
  23. Uhlig, M.; Löhmann, O.; Vargas Ruiz, S.; Varga, I.; von Klitzing, R.; Campbell, R.A. New structural approach to rationalize the foam film stability of oppositely charged polyelectrolyte/surfactant mixtures. Chem. Commun. 2020, 56, 952–955. [Google Scholar] [CrossRef]
  24. Crassous, J.; Saint-Jalmes, A. Probing the dynamics of particles in an aging dispersion using diffusing wave spectroscopy. Soft Matter 2012, 8, 7683–7689. [Google Scholar] [CrossRef]
  25. Carl, A.; Witte, J.; von Klitzing, R. A look inside particle stabilized foams—Particle structure and dynamics. J. Phys. D Appl. Phys. 2015, 48, 434003. [Google Scholar] [CrossRef]
  26. Axelos, M.A.V.; Boué, F. Foams as Viewed by Small-Angle Neutron Scattering. Langmuir 2003, 19, 6598–6604. [Google Scholar] [CrossRef]
  27. Fameau, A.L.; Saint-Jalmes, A.; Cousin, F.; Houinsou Houssou, B.; Novales, B.; Navailles, L.; Nallet, F.; Gaillard, C.; Boué, F.; Douliez, J.P. Smart foams: Switching reversibly between ultrastable and unstable foams. Angew. Chem. Int. Ed. 2011, 50, 8264–8269. [Google Scholar] [CrossRef] [PubMed] [Green Version]
  28. Hurcom, J.; Paul, A.; Heenan, R.K.; Davies, A.; Woodman, N.; Schweins, R.; Griffiths, P.C. The interfacial structure of polymeric surfactant stabilised air-in-water foams. Soft Matter 2014, 10, 3003–3008. [Google Scholar] [CrossRef] [Green Version]
  29. Micheau, C.; Bauduin, P.; Diat, O.; Faure, S. Specific Salt and pH Effects on Foam Film of a pH Sensitive Surfactant. Langmuir 2013, 29, 8472–8481. [Google Scholar] [CrossRef] [PubMed]
  30. Mikhailovskaya, A.; Zhang, L.; Cousin, F.; Boué, F.; Yazhgur, P.; Muller, F.; Gay, C.; Salonen, A. Probing foam with neutrons. Adv. Colloid Interface Sci. 2017, 247, 444–453. [Google Scholar] [CrossRef]
  31. Yada, S.; Shimosegawa, H.; Fujita, H.; Yamada, M.; Matsue, Y.; Yoshimura, T. Microstructural Characterization of Foam Formed by Hydroxy Group–Containing Amino Acid Surfactant Using Small-Angle Neutron Scattering. Langmuir 2020. [Google Scholar] [CrossRef] [PubMed]
  32. Mansour, O.T.; Cattoz, B.; Beaube, M.; Montagnon, M.; Heenan, R.K.; Schweins, R.; Appavou, M.S.; Griffiths, P.C. Assembly of small molecule surfactants at highly dynamic air-water interfaces. Soft Matter 2017, 13, 8807–8815. [Google Scholar] [CrossRef]
  33. Mansour, O.T.; Cattoz, B.; Beaube, M.; Heenan, R.K.; Schweins, R.; Hurcom, J.; Griffiths, P.C. Segregation versus interdigitation in highly dynamic polymer/surfactant layers. Polymers 2019, 11, 109. [Google Scholar] [CrossRef] [Green Version]
  34. Domínguez, A.; Fernández, A.; Gonzalez, N.; Iglesias, E.; Montenegro, L. Determination of critical micelle concentration of some surfactants by three techniques. J. Chem. Educ. 1997, 74, 1227–1231. [Google Scholar] [CrossRef]
  35. EPICS. Available online: https://epics-controls.org/ (accessed on 12 April 2021).
  36. NICOS. Available online: https://nicos-controls.org/ (accessed on 12 April 2021).
  37. Löhmann, O.; Silvi, L.; Kadletz, P.M.; Vaytet, N.; Arnold, O.; Jones, M.D.; Nilsson, J.; Hart, M.; Richter, T.; von Klitzing, R.; et al. Wavelength frame multiplication for reflectometry at long-pulse neutron sources. Rev. Sci. Instrum. 2020, 91, 125111. [Google Scholar] [CrossRef]
  38. Strobl, M.; Bulat, M.; Habicht, K. The wavelength frame multiplication chopper system for the ESS test beamline at the BER II reactor—A concept study of a fundamental ESS instrument principle. Nucl. Instrum. Methods Phys. Res. Sect. A 2013, 705, 74–84. [Google Scholar] [CrossRef]
  39. Woracek, R.; Hofmann, T.; Bulat, M.; Sales, M.; Habicht, K.; Andersen, K.; Strobl, M. The test beamline of the European Spallation Source—Instrumentation development and wavelength frame multiplication. Nucl. Instrum. Methods Phys. Res. Sect. A 2016, 839, 102–116. [Google Scholar] [CrossRef]
  40. Frielinghaus, H.; Feoktystov, A.; Berts, I.; Mangiapia, G. KWS-1: Small-angle scattering diffractometer. J. Large-Scale Res. Facil. JLSRF 2015, 1, 26–29. [Google Scholar] [CrossRef] [Green Version]
  41. Feoktystov, A.V.; Frielinghaus, H.; Di, Z.; Jaksch, S.; Pipich, V.; Appavou, M.S.; Babcock, E.; Hanslik, R.; Engels, R.; Kemmerling, G.; et al. KWS-1 high-resolution small-angle neutron scattering instrument at JCNS: Current state. J. Appl. Crystallogr. 2015, 48, 61–70. [Google Scholar] [CrossRef]
  42. Danov, K.D.; Kralchevsky, P.A.; Ananthapadmanabhan, K.P. Micelle-monomer equilibria in solutions of ionic surfactants and in ionic-nonionic mixtures: A generalized phase separation model. Adv. Colloid Interface Sci. 2014, 206, 17–45. [Google Scholar] [CrossRef] [PubMed]
Figure 1. Individual foam cell. (a) Explosion-view drawing and (b) photograph in front view. (c) Schematic top view. The individual foam cells consist of a quartz glass cylinder, thermojackets, and a gas-inlet socket. The neutron beam (highlighted in orange) passes the cell perpendicular to the thermojackets in variable height. For the estimation of the minimal range of scattering angles accessible, a scattering event at the (geometrically) least favorable position is considered (green arrow).
Applsci 11 05116 g001
Figure 2. Overview of the sample environment (SE). (a) Backview of three foam cells on folded aluminum construction. (b) Technical drawing of the complete SE mounted on the breadboard. (c) Front view of the SE (technical drawing) without shielding.
Applsci 11 05116 g002
Figure 3. Test of the foaming procedure and tightness of the gas flow system. (a) Three pictures of a foaming C14TAB ( c = 3.5   mM ) solution at different times. (b) Foam height as a function of time (black squares) and the theoretical height (red line) according to Equation (2).
Applsci 11 05116 g003
Figure 4. Evolution of the temperature of a tetradecyltrimethylammonium bromide (C14TAB, c = 3.5   mM ) foam in the foam cylinder without (a) and with (b) aluminum foil cover. The temperature was monitored using three Pt-100 temperature sensors at positions depicted by the inset. The setpoint of the water bath thermostat was adjusted to 50 °C at the beginning of the experiment and was reached after ca. 8 min.
Applsci 11 05116 g004
Figure 5. Circiut diagram of the motion control crate. Beside the translation stage, a two-axis goniometer is also controlled by this crate.
Applsci 11 05116 g005
Figure 6. (a) Single foam cell installed at the KWS-1 beamline at the MLZ. (b) 2D SANS data of an empty quartz foam cylinder. (ce) 2D SANS data of a steady-state foam produced from a 25   g   L 1 SDS solution at 16 cm (c), 9.5 cm (d), and 2 cm (e) foam height above the foaming solution. All experiments were carried out at a sample–detector distance of 7.615 m. Data acquisition time was 5 min.
Applsci 11 05116 g006
Figure 7. Radial averaged scattering data from a 25   g   L 1 SDS foam (86.7 mM) at three different foam heights in a steady-state foam (open symbols) and comparison with reference data of a wet continuous foam and a foam after drainage [26].
Applsci 11 05116 g007
Publisher’s Note: MDPI stays neutral with regard to jurisdictional claims in published maps and institutional affiliations.

