Abstract
Assessing the damage level in concrete infrastructures over time is a critical issue to plan their timely maintenance with proper actions. Self-sensing concretes offer new opportunities for damage assessment by monitoring their electrical properties and relating their variations to damage levels. In this research, fatigue tests were conducted to study the response of a self-sensing concrete under high-cycle dynamic loading. The concept of G-value was defined as the slope of the voltage response baseline of the self-sensing concrete over time that reflects the damage created under the fatigue-loading test. Based on this definition, log (G)–log (N) curves were obtained using a linear regression approach, with N representing the number of cycles during the fatigue tests. While traditional fatigue curves S-log (N) are used to estimate the remaining life under fatigue loading, log (G)–log (N) diagrams can be used to determine the damage level based on the voltage response of the self-sensing concrete as a function of the loading history. This finding can be useful for the estimation of the lifetime and remaining life of self-sensing concrete structures and infrastructure, eventually helping to optimize the related maintenance operations.
1. Introduction
Structural health monitoring (SHM) is a convenient way to obtain knowledge for the assessment of various structures and infrastructure, which require inspection, monitoring, and management of the proper maintenance strategies to ensure adequate safety levels and sustainability in civil engineering []. Dynamic loading, especially at high-stress levels, is one of the main causes of damage accumulation in concrete structures. In these cases, the use of proper damage monitoring tools is crucial for hazard mitigation. In general, damage sensing, which is a key factor in infrastructural health monitoring, can be obtained by means of either external evaluation techniques or internal ones [,]. Besides, the are numerous non-destructive evaluation (NDE) methods for the assessment of the infrastructure behavior [,]. In situ sensing can be performed using attached or embedded damage sensors, such as optical fibers, acoustic sensors, etc. Gawel et.al. mentioned that the two complementary methods, i.e., acoustic emission and resistance measurements in cement/CNF composites, can be used for sensing the stress state in materials []. These sensors may present some drawbacks related to their durability, cost, sensing volume, and spatial resolution []. A new strategy for detecting damage in real-time is providing infrastructures with self-sensing capabilities, generated by adding carbon materials such as carbon fibers (CFs) [,,,] or non-carbon materials as conductive fillers to the concrete [,,] and monitoring the related electrical response in time.
Many studies were conducted independently upon the damage mechanisms in self-sensing concretes [,,,,]. They divided the damage phenomenology into minor and major events. Major damage can be seen by visual inspection while minor occurrences are due to the degradation of the structural properties []. Under low-cycle fatigue loading, they found that the fractional change in resistance decreased. They attributed this decrease to a deterioration of the cement matrix separating adjacent fibers at their junction: this type of damage enhanced the chance for adjacent fibers to touch one another. This behavior qualifies the extent of damage in the regime of low damage [,,,,,,]. Chu and Chen investigated the correlation of conductivity and damage in carbon-fiber-reinforced conductive concrete (CFRCC) under axial static loading and quasi-static cycle loading. They found that the real-time damage that is detected by ultrasonic technique and resistivity had a cubic polynomial correlation under the static load condition []. Suchorzewski et al. mentioned that the resistivity measurement in multifunctional concrete was able to capture multiple discrete cracks and material degradation at the micro-level due to fatigue [].
Chung et al. tested CFRC specimens under dynamic compression and measured their strain and electrical response. The electrical resistance increased as the stress increased in each cycle. The resistance baseline increased significantly cycle by cycle and continued to increase after the stress level had reached its maximum. They believed that, at low-stress levels, the resistance baseline decreased irreversibly and gradually cycle by cycle []. The same effect was observed and reported by Fu and Chung [] and was attributed to a damage mechanism affecting the cement matrix, with a consequent increased chance for adjacent fibers to touch one another. At high-stress levels, this effect is overshadowed by the damage-induced resistance increase, the occurrence of which causes the baseline resistance to increase irreversibly cycle by cycle as the stress level increases []. These two opposing baseline effects caused the baseline to have a positive, zero, or negative slope.
Different studies mentioned that fatigue life and damage are strongly affected by matrix cracks [,,], and a lot of them find relationships between crack propagation and electrical changes in self-sensing concrete []. Nevertheless, a few studies focused on finding the damage assessment model based on self-sensing ability [,].
Continuous structural health monitoring of concrete pavements and deciding on appropriate actions for maintenance at the right time and place due to budget constraints is one of the main goals in the field of sustainable development of any country. Estimating the life of concrete pavement helps to forecast its remaining life and is a key step to defining a proper maintenance plan that leads to pavement efficiency. In general, the methods for estimating remaining pavement life can be divided into two categories: functional and structural []. These methods have been developed for use at different levels of a project or network []. Generally, each of these methods uses specific pavement data such as PCI [], PSR, severity, and extent of a particular type of distresses such as edge faulting, fatigue cracking, roughness levels [], pavement deflection [], layer thickness, layer modulus, and so forth. Many different methods of analysis have been found in the literature accordingly, including empirical studies based on field data [], probabilistic methods [,], mechanistic–empirical methods [], or methods based on soft computing analysis using pavement history data []. In all these methods, pavement data have been collected in different time steps and have been the basis for presenting different models. Collecting structural or functional pavement data in different periods reduces the model precision levels due to differences in the data-gathering process, which come from variations in the instrumentation, location, and pavement conditions. To tackle this issue, one of the main novelty aspects of this research is that the authors present here a novel continuous pavement data-gathering technique by using self-sensing concrete sensors that have the potential to provide a more accurate estimate of pavement conditions.
This paper proposes a novel concept in multifunctional smart concrete that can be used as a new NDT technique to monitor damage propagation in concrete media. In this regard, a relationship between the slope of the electrical response of the concrete sensor as a function of the number of cycles, denoted as G-value, and the damage level was experimentally observed, which constitutes the main original finding of this research. Subsequently, the study proposes to model the damage level and remaining life based on the classical hypothesis of linear cumulative damage by Palmgren-Miner [].
2. Materials and Methods
In this study, prismatic concrete sensors suitable to be embedded in self-sensing concrete elements were produced. To this purpose, multi-walled carbon nanotubes (MWCNTs) obtained from the Iranian Research Institute of Petroleum Industry (RIPI) were used and added to the concrete mix in a 0.15% proportion by weight of cement content, in analogy with previous studies [,]. Using MWCNTs instead of carbon fibers (CFs) helps to increase the sensor’s ability to detect crack initiation and propagation under fatigue conditions. This allows the use of a lower amount of MWCNTs than CFs so that lesser reinforcement is introduced and the mechanical properties of the sensors are more similar to those of the plain concrete they should be embedded into, with respect to the sensors using CFs. The main properties of the MWCNTs used are given in Table 1 and their microstructure is shown in Figure 1. Figure 2 summarizes the aggregate grading specifications for the concrete. The concrete mix design adopted is shown in Table 2. The aggregates were mixed to minimize the voids and hence maximize the density based on the Fuller curve. Type II Portland cement from Abyek Cement Company was used. Besides, 0.02 wt% tributyl phosphate produced by Sigma-Aldrich Co. was used as a defoamer. A dark brown solution of polycarboxylate-based superplasticizer (Sarapush construction chemical manufacture) with 36% solid contents and a density of 1.1 g/cm3 was used for workability purposes. A combination of polycarboxylate superplasticizer and sodium dodecyl sulfate (SDS) with a ratio of 9:1 was used as a surfactant [,].

Table 1.
Properties of MWCNTs.
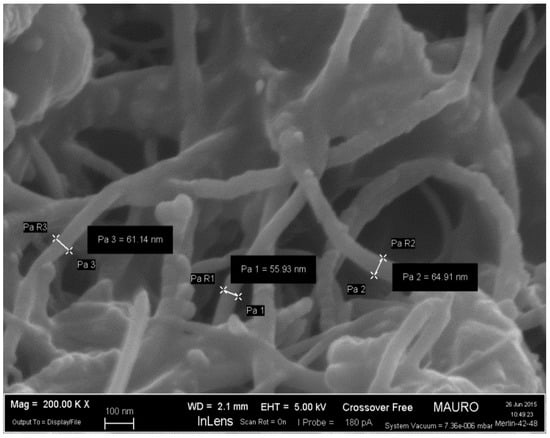
Figure 1.
MWCNTs SEM images and their measured diameters.
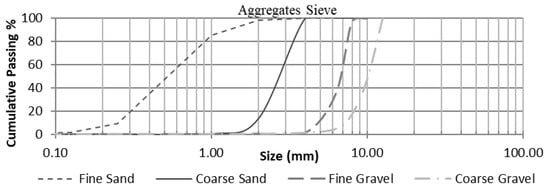
Figure 2.
Different aggregate grading test results according to Standard ASTM C136/C136M-14 [].
Table 2.
Mix design.
MWCNTs and surfactants were weighted and mixed in water and the solution was stirred for 10 min with a magnetic stirrer (WIFESTEER MSH-20B); then it was sonicated in an ultrasonic bath for 2 h and afterward with an ultrasonic probe for a further 90 min. The temperature was controlled during sonication to prevent damage to the MWCNTs structure []. The cement was added to the mixture in a high-speed mixer (3600 rpm—Pars-Khazar Co.). To eliminate the air bubble formation in the mix, tributyl phosphate was used as a defoamer. The aggregate fraction was added during the mixing process and the concrete was cast in molds (10 × 10 × 40 cm3) by applying a proper vibration. The concrete specimens were removed from the molds after 24 h and subsequently, they were cured in water at 25 °C for 28 days according to ASTM C192 []. In Figure 3 [] these steps are presented.
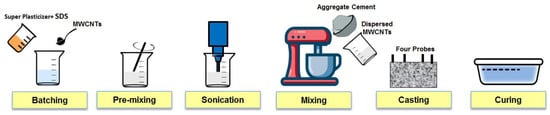
Figure 3.
Cement-based concrete sensor preparation steps.
Two types of circuits have been used to measure the response of concrete sensors in previous studies, either with direct current (DC) or alternating current (AC) [,,,], combined with two types of electrode schemes consisting of two-probe [,,,,] and four-probe setups [,,]. The use of direct current circuits is responsible for a resistance variation over time due to a polarization effect, as exemplified in Figure 4, where the evolution of the electrical resistance and deflection of the sensor in a three-point-bending fatigue test is presented (normalized values). The polarization effect changes the sensor resistivity response over time under constant low-cycle load in the DC circuit. The polarization effect occurs when the concrete sensor works as a capacitor. In the polarization effect, the reverse current generated in the concrete sensor due to sensor charging causes the reduction of the electrical current over time []. In this study, an alternating current generator was used with a four-probe set-up in the concrete sensor circuit that is an effective solution to eliminate the polarization effect, suggested by some works [,].
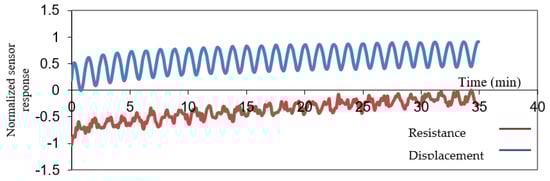
Figure 4.
Polarization effect in normalized sensor resistivity response over time (minutes) under low-cycle load in a DC circuit.
One of the factors affecting the output of the sensor is the frequency of the alternating voltage applied to the concrete specimen. With a high enough AC waveform frequency, the reactance can be minimized from the impedance readings, and the true resistance of the concrete samples is conveyed []. Based on the results obtained at different frequencies, as presented in Figure 5, it can be seen that the measured sensor output voltage under a constant input voltage with 8-volt magnitude (Vpp = 8 V), varies. The results showed that, at low and high frequencies, the voltage output of the sensor decreases, and at 2.5 kHz, this value increases to its maximum. Finding the proper frequency is critical as an increase in waveform frequency can result in higher power consumption and circuit complexity [].
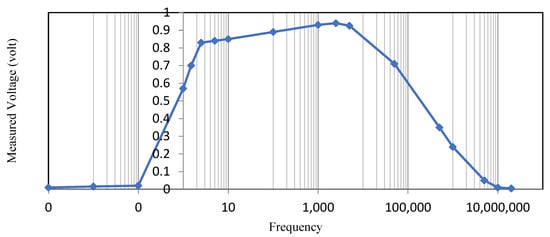
Figure 5.
Measured alternating voltage (AV) versus frequency between the heads of the concrete sensor at constant input alternating voltage (AV).
The electrical property changes are very sensitive to temperature, water, and humidity [,], ingress of chemical elements that are commonly used in infrastructures service (such as deicing salts), and several other factors encountered in real-field applications. Previous studies demonstrated that temperature can affect the sensor output voltage in three ways: (a) thermal deformation of concrete; (b) thermally activated charge carriers (ions, holes, and electrons), when the MWCNTs concentration in concrete sensors is lower than percolation threshold; and (c) thermal-fluctuation-induced tunneling conduction [,]. To mitigate the temperature effect on the results during a high-cycle fatigue test, which is generally accompanied by an increase in temperature, an air conditioning system was used in the present research, which ensured that a continuous air stream at 23 °C was directed to the concrete sensor specimens during the fatigue tests.
Demircilioğlu et al. demonstrated that concrete resistivity changes as a function of the moisture content in smart concrete media. They observed that by decreasing the moisture level from 5.2% to 4.8%, the resistivity decrease due to the water layer between fibers was lost and therefore direct contact between fibers was achieved. The higher the decrease in moisture level, the higher the increase in resistivity because water acting as electrolyte was lost []. Based on these findings, in the present study, to eliminate moisture effects on the test results, the concrete sensors specimens were dried in an oven for 1 week at 80 °C and then rapidly covered by waterproofing epoxy resin. In this way, concrete was isolated from outside moisture effects.
The presence of free ions in the micro-pores of concrete is another factor that may affect the sensor conductivity and increase test errors. To eliminate this effect, the specimens were cured for 28 days, stored for 90 days, and finally dried in an oven for 7 days (as mentioned above) to ensure that the most suitable and repeatable conditions for the hydration process were carried out.
Probe detachment from the concrete medium in each loading cycle is another problem that may occur during the test and alter the results. To avoid probe disconnection in the fatigue setup, the probes were embedded within the concrete sensor specimen at a short distance from the specimen edges. In addition, the probes were fixed in properly. Moreover, the probes were located out of the mechanically stressed region of the concrete sensor specimen, as presented in Figure 6, to ensure that the probes remained always adherent to the concrete. To avoid the surface connection between concrete sensors and test apparatus, insulation sheets were used between the concrete specimen and any metal parts of the test apparatus.
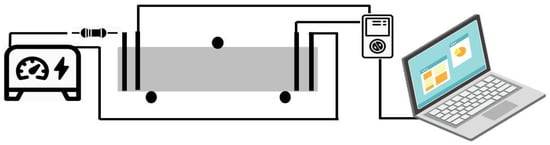
Figure 6.
Scheme of the three-point-bending test under static and dynamic loading and circuit setup.
An alternating current circuit with a four-probe electrodes setup was used, as depicted in Figure 6. The electrical sensor response in this circuit was defined as the potential difference across the two inner probes of the sensor (Vs) which was measured by a multimeter at regular intervals.
In accordance with previous literature, and also following the indications of the Portland Cement Association (PCA) [,], three-point-bending fatigue tests were performed on prismatic specimens with the aid of a 250 kN servo-controlled hydraulic material testing machine by MTS. The test was carried out pursuant to ASTM C78, which is the essential reference for static loading []. To perform unlimited cyclic fatigue tests, three stress levels (S) were selected (corresponding to 70%, 80%, and 90% of the modulus of rupture) and six specimens were tested per each stress level. They were loaded under a sinusoidal dynamic load pattern, with a frequency of 7.5 Hz and stress ratio (R = 0.25) up to failure.
3. Results and Discussion
3.1. Fatigue Tests
To define the concrete fatigue test settings, six specimens were broken under standard static three-point-bending stress to estimate the modulus of rupture (MOR). The results are presented in Table 3.
Table 3.
Flexural strength of concrete beams under the three-point bending test.
Based on the estimated MOR value, unlimited fatigue tests were performed according to three stress levels (S), as anticipated in Section 2. The number of cycles to failure (N), was recorded per each stress level, thus allowing the calibration of the S-log (N) model. Results are presented in Figure 7.
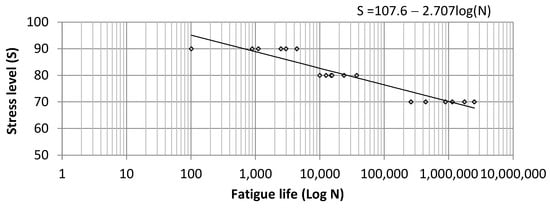
Figure 7.
(S-log N) straight line interpolating the experimental data.
The results were compared with previous studies []. As shown in Figure 8, data from nine previous studies of fatigue tests on plain concrete and eight studies on fiber-reinforced concrete were used for comparison. The results demonstrated that the fatigue life of concrete containing 0.15% wt MWCNT is longer compared to plain concrete and shorter compared to fiber-reinforced concrete with a higher dosage of fibers. Based on Figure 8, the regression model fitted on this study fatigue data could be properly validated by comparison with the other research data.
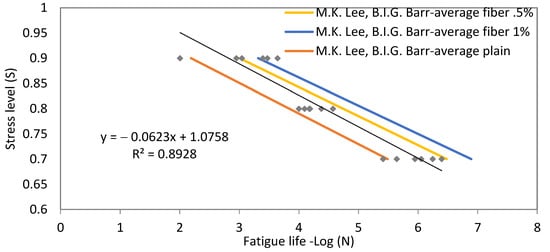
Figure 8.
Validation of fatigue results with respect to the average results of several studies [].
3.2. Sensing Capability under Fatigue Test Conditions
Figure 9 reports an example of a sensor electrical response (in Volts) recorded under a cyclic test. In the fatigue test setup, a small pre-load was applied to the specimens before the test started. In this condition, the upper side of the specimen experiences compression, and the opposite side experiences tension during the cyclic testing in the three-point-bending configuration. In the area subjected to compression, there is an increased chance for adjacent MWCNTs to connect each other or reduce the gap between them. As a result, the system conductivity increases, i.e., the potential difference between two probes of the sensor (Delta V) decreases. On the other hand, in the area subjected to tension, the tensile stress causes MWCNTs slipping, pulling off, and cutting along with cracking of the concrete matrix. These flaws disconnect the MWCNTs conductive network and cause a decrease in the system conductivity. Hun et al. [,,,] mentioned that the sensing behavior under flexural loading is a composition of sensing properties under compression and tension. Furthermore, the sensing behavior heavily depends on the components of the self-sensing concrete and the layout of the electrodes. Therefore, different sensing behaviors of self-sensing concrete under flexural loading were observed in previous research. As shown in Figure 9, for the specific settings used in the present study, the electrical response of the concrete sensor undergoes a decrease during fatigue loading. In fact, dominant behavior in flexural is near compression and not tension.
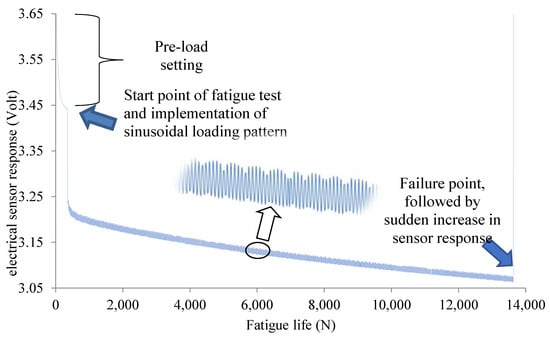
Figure 9.
Electrical response of self-sensing concrete during the fatigue test.
Chung et al. reported a very similar finding in some of their research studies as detailed in [,]. They mentioned that damage in the fatigue process was observed in the FRC composite and an irreversible decrease in the electrical resistivity response of the composite was observed. They assumed that the resistivity decrease could be attributed to damage in the composite matrix. They concluded that the greater the stress level, the greater the damage, and the greater the resistivity decrease [,].
By investigating the sensor behavior, it appears that a relation between the fractional change in electrical resistance and stress can be found in each cycle. Indeed, the electrical response of the sensor decreased with loading and increased during unloading. However, when a large number of loading cycles are applied, another superimposed trend can be observed, as shown in Figure 9. According to this trend, the baseline of the electrical response of the sensor decreases irreversibly and gradually cycle by cycle and it is approximately linear up to failure, apart from the initial rapid drop. Investigation of previous literature studies [,,] showed that this trend (descending or ascending trend of the electrical response of the sensor over time) is also visible in their results.
3.3. G-Value Concept and Its Relationship with Damage
The decrease in the electrical resistance as a function of the number of cycles described in Section 3.2 was observed in all of the 18 specimens that were tested under cyclic load patterns. To find a possible correlation between the average electrical responses of the sensor over time in each cycle with the different levels of stress (S) in the fatigue test, the best linear regression model fitted to each sensor response at any stress levels is presented in Figure 10 and the slope of the model is called the G-value. The greater the stress level, the greater the damage; therefore, the absolute value of the G-value represents the damage rate per cycle in fatigue loading.
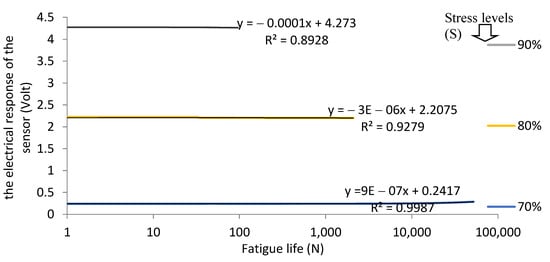
Figure 10.
Average electrical responses of self-sensing concrete specimens during the fatigue test under different stress levels.
This study results can be validated by Chung’s [] results, who found similar relationships between stress level and the fractional change in the resistance response Delta R/R0 of self-sensing concrete. According to Chung, the irreversible part of Delta R/R0 increased with the increase in stress level and fatigue cycle number []. By taking a closer look at Chung’s results, it can be seen that the slopes of the baseline of the Delta R/R0 response at different stress levels are approximately the same among different fatigue cycles, but the baseline slopes between two constant stress levels increase by increasing the number of fatigue cycles. This means that the irreversible Delta R/R0 increases in each cycle in the constant stress level, so the slope increases.
As Bontea mentioned [], this variation in the slope of the baseline of the fractional change in the resistance (G-value) can be attributed to the damage propagation rate in the cement matrix. Based on literature findings, the G-value can be positive or negative related to two opposite mechanisms. One is the reduction of the gap between adjacent MWCNTs or the enhancement of the chance of touching one another, which contributes to a decrease in the resistivity of the self-sensing concrete. Such a mechanism is strongly related to the loading pattern (i.e., static or dynamic), the number of conductive fibers and their properties (i.e., length, diameter, and surface activity), dispersion quality, etc. The other is damage in the cement matrix, in the form of flaws and cracks, which can cut the MWCNTs and increase the resistivity of the self-sensing concrete. Chen and Liu verified the presence of these two opposite mechanisms by acoustic emission technique []. Based on their findings in comparison with this research results, it can be concluded that when an external load is applied to the concrete, the interaction of these two opposite mechanisms will result in different amounts of G-value. As illustrated in Figure 10, for higher stress levels (i.e., 90% and 80%), the G-value is negative. By increasing the stress level in the three-point bending fatigue test, the intensity of stress in the compression and tension area will increase. The experimental evidence that the G-value is negative in these cases seems to indicate that for the specific concrete sensor composition and settings adopted, the compression behavior is the dominant effect at 90% and 80% stress levels, so the response variation is mainly due to the variation in connectivity between MWCTNs in the compression region. For lower stress levels (i.e., 70%), the G-value is positive. For this stress level, it can be assumed that the compression is not high enough to decrease the distance between MWCTNs and increase the conductivity for the specific concrete characteristics of the sensor studied. Therefore, the effect observed for S = 90% and 80% cannot be sufficiently manifested, and micro-cracking and cutting MWCTNs connections are the dominant effects that cause the decrease in conductivity and positive G-value.
3.4. Fatigue Life Model Based on G-Value
Regardless of the origin of the parameters affecting the G-value, the logarithm of its absolute value shows a good correlation with the logarithm of the different stress levels (Log (S)), with R2adj. = 0.89 (see plot presented in Figure 11).
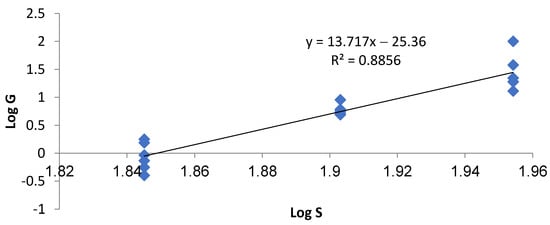
Figure 11.
Correlation between the slopes of the sensors’ response baselines (G-value) and the corresponding stress levels (S) in fatigue tests.
This correlation is quite valuable because it can correlate the damage levels in concrete sensors with the fatigue life of the concrete under dynamic loading, provided that the composition and the overall characteristics of the concrete are comparable with those considered in the present research. Therefore, the damage occurring inside the material can be monitored in real-time by measuring the change in electrical resistance or voltage of the sensor during loading and unloading. This finding rolls the way to use this type of concrete sensor for structural health monitoring in concrete structures. Estimation of the life span in a concrete structure is a key point for the management system. Based on this finding, a log (G)–log (N) description can be used instead of traditional S-log (N) fatigue curves (also known as Wöhler curves), as depicted in Figure 12.
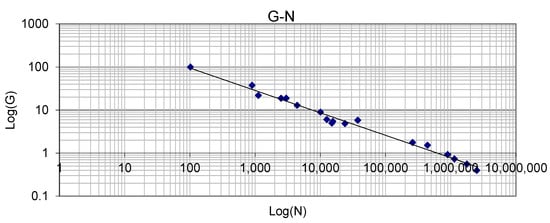
Figure 12.
Relationship between the slope of the sensors’ response baseline and fatigue life for different stress levels.
In fact, Figure 12 indicates a good correlation between the concrete sensors’ electrical output responses (i.e., resistance or voltage) under fatigue loading versus the life of the concrete structure (i.e., time of loading or number of load cycles). In Table 4, the parameters for two different fatigue models are reported. The model in the form of Log (G) = a − b × log (N) was selected as the most reliable one.
Table 4.
Calibrating different fatigue models.
This finding helps to define a continuous and online monitoring system and it could be useful in estimating the damage propagation in time. Besides, different loading conditions and any other destructive phenomena have a cumulative effect on the G-value in time. Therefore, by monitoring the G-value, all destructive effects are considered and the total life of concrete members under these effects can be estimated.
3.5. Remaining Life Model Based on G-Value
The remaining life of a concrete structure is defined as the useful life of that structure from the present time to the end of life, where the structure reaches an unacceptable condition that involves reconstruction or major rehabilitation []. To evaluate the remaining life of a concrete structure, different methodologies have been developed. Most of them are based on massive literature data and estimate the remaining life empirically; others are based on statistics, due to the wide range of uncertainty caused by the different parameters that may affect the deterioration of concrete structures. Destructive factors of concrete pavements can be divided into two categories: structural and environmental. Fatigue, due to traffic or consecutive changes in environmental conditions, is one of the main structurally destructive factors of concrete pavements. Various standards have used the Miner method to estimate the level of fatigue failure in concrete pavements [,]. In addition, some of the most recent methods are based on live monitoring of the concrete structures []. Self-sensing concrete sensors embedded in concrete structures can monitor different parameters such as temperature, stress, strain, and damage during time continuously. These abilities will help to assess the remaining life based on proper models. As it is presented in Equation 1, the remaining life (RL) can be obtained by subtracting the partial number of load repetitions (n) from the total fatigue life (N). The number and intensity of loads applied to the structure can be counted by smart concrete sensors [,,,]. Besides, total fatigue life can be estimated with different common methods or the model suggested from this study.
RL = N − n
In this study, to evaluate the remaining life concrete structure by a self-sensing concrete sensor embedded in it, the G-N model presented in Table 4 is used to estimate total life (N). On the other hand, the self-sensing concrete sensors can count the number of load repetitions on the structure (n). Therefore, by replacing the equation presented in Table 4 with Equation (1), the remaining life (in years or number of applied loads) is calculated based on sensor response in Equation (2).
If the loading pattern on structure varies over time, the above equation is not helpful. To generalize the concept of the remaining life model to the real world where loads are varied over time, a solution could be to break down the time-history sensors’ response into sub-segments (ti) to achieve a constant (Gi) in each segment which represents constant damage rate. In this case, the remaining life is presented in Equation (3) as a percentage of total life (N). In equation (3), “i” is the sub-segment number that ranges from 1 to c, where c is greater than zero and is a member of the set of natural numbers.
The present model has been developed based on the results of the concrete beam fatigue test that presents the relationship between the slope of electrical changes of concrete sensor and fatigue life in the laboratory condition. Certainly, the arrangement of the concrete sensors inside the slab, including the number, location, and depth of the sensors and their relationship with the fatigue life of the slab (which is fundamentally different from the life of the concrete beam fatigue [,]) is one of the major challenges that need to be faced to further improve the model and make it suitable for full-size structural applications. This is the goal of some in-progress research activities which are currently being carried out by the authors of this study.
4. Conclusions
In this study, concrete containing MWCNTs was fabricated, and self-sensing concrete specimens were tested under a fatigue setup. Tests were performed to check the possible correlation between different stress levels and damage-sensing abilities during concrete fatigue life. Based on the results obtained, the following conclusions can be drawn:
- −
- The concept of the G-value was defined as the slope of the electrical response baseline of the self-sensing concrete as a function of the number of cycles. It reflects the rate of the damage created in the concrete per each cycle at the specific stress level in the fatigue test.
- −
- Higher absolute values of the G-value indicate that more severe damage growth conditions occur, and more destructive external effects affect the concrete member.
- −
- A novel damage curve, log (G)–log (N), was developed as an alternative to traditional fatigue curves, S-log (N), based on the electrical response of self-sensing concrete estimated through a linear regression approach.
- −
- The log (G)–log (N) diagram can be used to determine the level of damage in concrete infrastructure members based on the continuous monitoring of the electrical response in time. This result can be useful to monitor the infrastructure behavior under different loading conditions and any other destructive effects. This highlights the potential of using this type of material as an embedded sensor for estimating the remaining life of concrete infrastructure and helping to decide the proper structural maintenance action.
Author Contributions
Conceptualization, M.A.; Data curation, M.A. and P.A.; Formal analysis, M.A. and P.A.; Funding acquisition, G.L. and M.A.; Investigation, M.A., J.-M.T., G.L., and P.A.; Methodology, M.A.; Project administration, M.A.; Resources, M.A., J.-M.T., G.L., and P.A.; Writing—original draft, M.A.; Writing—review and editing, J.-M.T., G.L., and P.A. All authors have read and agreed to the published version of the manuscript.
Funding
This work was supported by the Iran National science foundation: INSF under contract number 99022755, also this work was supported by Shahid Rajaee Teacher Training University under contract number 181931.
Institutional Review Board Statement
Not applicable.
Conflicts of Interest
The authors declare no conflict of interest.
References
- Kot, P.; Muradov, M.; Gkantou, M.; Kamaris, G.S.; Hashim, K.; Yeboah, D. Applied sciences recent advancements in non-destructive testing techniques for structural health monitoring. Appl. Sci. 2021, 11, 2750. [Google Scholar] [CrossRef]
- Tian, Z.; Li, Y.; Zheng, J.; Wang, S. A state-of-the-art on self-sensing concrete: Materials, fabrication and properties. Compos. Part B Eng. 2019, 177, 107437. [Google Scholar] [CrossRef]
- Xue, W.; Wang, L.; Wang, D.; Druta, C. Pavement health monitoring system based on an embedded sensing network. J. Mater. Civ. Eng. 2014, 26, 04014072. [Google Scholar] [CrossRef]
- Ren, W.; Liu, J.; Tian, G.Y.; Gao, B.; Cheng, L.; Yang, H. Quantitative non-destructive evaluation method for impact damage using eddy current pulsed thermography. Compos. Part B Eng. 2013, 54, 169–179. [Google Scholar] [CrossRef]
- Behnia, A.; Chai, H.K.; Shiotani, T. Advanced structural health monitoring of concrete structures with the aid of acoustic emission. Constr. Build. Mater. 2014, 65, 282–302. [Google Scholar] [CrossRef]
- Gawel, K.; Szewczyk, D.; Cerasi, P.R. Self-sensing well cement. Materials 2021, 14, 1235. [Google Scholar] [CrossRef]
- Chen, B.; Liu, J.; Wu, K. Electrical responses of carbon fiber reinforced cementitious composites to monotonic and cyclic loading. Cem. Concr. Res. 2005, 35, 2183–2191. [Google Scholar] [CrossRef]
- Chung, D.D.L. Strain sensors based on the electrical resistance change accompanying the reversible pull-out of conducting short fibers in a less conducting matrix. Smart Mater. Struct. 1995, 4, 59. [Google Scholar] [CrossRef]
- Fu, X.; Chung, D.D.L. Self-monitoring of fatigue damage in carbon fiber reinforced cement. Cem. Concr. Res. 1996, 26, 15–20. [Google Scholar] [CrossRef]
- Chen, B.; Liu, J. Damage in carbon fiber-reinforced concrete, monitored by both electrical resistance measurement and acoustic emission analysis. Constr. Build. Mater. 2007, 22, 2196–2201. [Google Scholar] [CrossRef]
- Chen, P.-W.; Chung, D.D.L. Carbon fiber reinforced concrete as an intrinsically smart concrete for damage assessment during static and dynamic loading.pdf. ACI Mater. J. 1996, 93, 341–350. [Google Scholar]
- Nguyen, D.L.; Song, J.; Manathamsombat, C.; Kim, D.J. Comparative electromechanical damage-sensing behaviors of six strain-hardening steel fiber-reinforced cementitious composites under direct tension. Compos. Part B Eng. 2015, 69, 159–168. [Google Scholar] [CrossRef]
- Kim, M.K.; Kim, D.J.; An, Y. Electro-mechanical self-sensing response of ultra-high-performance fiber-reinforced concrete in tension. Compos. Part B 2017, 134, 254–264. [Google Scholar] [CrossRef]
- Kwon, D.; Wang, Z.; Choi, J.; Shin, P.; Devries, K.L.; Park, J. Damage sensing and fracture detection of CNT paste using electrical resistance measurements. Compos. Part B 2016, 90, 386–391. [Google Scholar] [CrossRef]
- Wen, S.; Chung, D.D.L. Cement-based materials for stress sensing by dielectric measurement. Cem. Concr. Res. 2002, 32, 1429–1433. [Google Scholar] [CrossRef]
- Wen, S.; Chung, D.D.L. Electric polarization in carbon fiber-reinforced cement. Cem. Concr. Res. 2001, 31, 141–147. [Google Scholar] [CrossRef]
- Sixuan, H. Multifunctional Graphite Nanoplatelets (GNP) Reinforced Cementitious Composites. Master’s Thesis, Tsinghua University, Beijing, China, 2012. [Google Scholar]
- Shi, Z.Q.; Chung, D.D.L. Carbon fiber-reinforced concrete for traffic monitoring and weighing in motion. Cem. Concr. Res. 1999, 29, 435–439. [Google Scholar] [CrossRef]
- Abbood, I.S.; Weli, S.S.; Hamid, F.L. Cement-based materials for self-sensing and structural damage advance warning alert by electrical resistivity. Mater. Today Proc. 2021. [Google Scholar] [CrossRef]
- Bontea, D.M.; Chung, D.D.L.; Lee, G.C. Damage in carbon fiber-reinforced concrete, monitored by electrical resistance measurement. Cem. Concr. Res. 2000, 30, 651–659. [Google Scholar] [CrossRef]
- Galao, O.; Baeza, F.J.; Zornoza, E.; Garcés, P. Strain and damage sensing properties on multifunctional cement composites with CNF admixture. Cem. Concr. Compos. 2014, 46, 90–98. [Google Scholar] [CrossRef]
- Wen, S.; Chung, D.D.L. Self-sensing of flexural damage and strain in carbon fiber reinforced cement and effect of embedded steel reinforcing bars. Carbon N. Y. 2006, 44, 1496–1502. [Google Scholar] [CrossRef]
- Han, B.; Ding, S.; Yu, X. Intrinsic self-sensing concrete and structures: A review. Measurement 2015, 59, 110–128. [Google Scholar] [CrossRef]
- Han, B.; Sun, S.; Ding, S.; Zhang, L.; Yu, X.; Ou, J. Review of nanocarbon-engineered multifunctional cementitious composites. Compos. Part A Appl. Sci. Manuf. 2015, 70, 69–81. [Google Scholar] [CrossRef]
- Sun, S.; Yu, X.; Han, B. Sensing mechanism of self-monitoring CNT cementitious composite. J. Test. Eval. 2014, 42, 20120302. [Google Scholar] [CrossRef]
- Suchorzewski, J.; Prieto, M.; Mueller, U.; Malaga, K. Damage and stress detection (self-sensing) in concrete with multi-walled carbon nanotubes. Proceedings 2019, 34, 17. [Google Scholar] [CrossRef]
- Gliozzi, A.S.; Scalerandi, M.; Anglani, G.; Antonaci, P.; Salini, L. Correlation of elastic and mechanical properties of consolidated granular media during microstructure evolution induced by damage and repair. Phys. Rev. Mater. 2018, 2, 13601. [Google Scholar] [CrossRef]
- Anglani, G.; Tulliani, J.M.; Antonaci, P. Behaviour of pre-cracked self-healing cementitious materials under static and cyclic loading. Materials 2020, 13, 1149. [Google Scholar] [CrossRef] [PubMed]
- Thostenson, B.E.T.; Chou, T. Carbon nanotube networks: Sensing of distributed strain and damage for life prediction and self healing. Adv. Mater. 2006, 18, 2837–2841. [Google Scholar] [CrossRef]
- Ding, Y.; Liu, G.; Hussain, A.; Pacheco-torgal, F.; Zhang, Y. Effect of steel fiber and carbon black on the self-sensing ability of concrete cracks under bending Effect of steel fiber and carbon black on the self-sensing ability of concrete cracks under bending. Constr. Build. Mater. 2019, 207, 630–639. [Google Scholar] [CrossRef]
- Xu, J.; Butler, L.J.; Elshafie, M.Z.E.B. Experimental and numerical investigation of the performance of self-sensing concrete sleepers. Struct. Health Monit. 2019, 19, 66–85. [Google Scholar] [CrossRef]
- Vepa, T.; George, K.; Shekharan, A. Prediction of pavement remaining life. Transp. Res. Rec. 2014, 1524, 137–144. [Google Scholar] [CrossRef]
- Elkins, G.E.; Thompson, T.M.; Groeges, J.L.; Visintine, B.; Rada, G.R. Reformulated Pavement Remaining Service Life Framework; U.S. Department of Transportation: Washington, DC, USA, 2013.
- Setyawan, A.; Nainggolan, J.; Budiarto, A. Predicting the remaining service life of road using pavement condition index. Procedia Eng. 2015, 125, 417–423. [Google Scholar] [CrossRef]
- NCHRP1-37A. PCC Rehabilitation Design of Existing Pavements; NCHRP: Washington, WA, USA, 2004. [Google Scholar]
- Usman, R.S.; Setyawan, A.; Suprapto, M. Prediction of pavement remaining service life based on repetition of load and permanent deformation. IOP Conf. Ser. Mater. Sci. Eng. 2018, 333, 012089. [Google Scholar] [CrossRef]
- AASTHO. AASHTO Guide for Design of Pavement Structures; AASTHO: Washington, WA, USA, 1986. [Google Scholar]
- Ragab, A.; Ouali, M.S.; Yacout, S.; Osman, H. Remaining useful life prediction using prognostic methodology based on logical analysis of data and Kaplan–Meier estimation. J. Intell. Manuf. 2016, 27, 943–958. [Google Scholar] [CrossRef]
- Chen, C.; Williams, R.C.; Marasinghe, M.G.; Ashlock, J.C.; Smadi, O.; Schram, S.; Buss, A. Assessment of composite pavement performance by survival analysis. J. Transp. Eng. 2015, 141, 04015018. [Google Scholar] [CrossRef]
- Nabipour, N.; Karballaeezadeh, N.; Dineva, A.; Mosavi, A.; Mohammadzadeh, D.S.; Shamshirband, S. Comparative analysis of machine learning models for prediction of remaining service life of flexible pavement. Mathematics 2019, 7, 1198. [Google Scholar] [CrossRef]
- Zhang, B.; Phillips, D.V.; Wu, K. Further research on fatigue properties of plain concrete. Mag. Concr. Res. 1997, 49, 241–252. [Google Scholar] [CrossRef]
- Adresi, M.; Hassani, A.; Javadian, S.; Tulliani, J. Determining the surfactant consistent with concrete in order to achieve the maximum possible dispersion of multiwalled carbon nanotubes in keeping the plain concrete properties. J. Nanotechnol. 2016, 2016, 2864028. [Google Scholar] [CrossRef]
- Adresi, M.; Hassani, A.; Tulliani, J.M.; Lacidogna, G.; Antonaci, P. A study on the main factors affecting the performance of self-sensing concrete. Adv. Cem. Res. 2017, 29, 216–226. [Google Scholar] [CrossRef]
- ASTM. Standard Test Method for Sieve Analysis of Fine and Coarse Aggregates; ASTMC136/C136M-14; ASTM International: West Conshohocken, PA, USA, 2014. [Google Scholar]
- ASTM. Standard Practice for Making and Curing Concrete Test Specimens in the Laboratory; ASTMC192/C192M-13; ASTM International: West Conshohocken, PA, USA, 2013; Volume 4, pp. 1–8. [Google Scholar]
- Adresi, M. Concrete Pavement Prediction Life Model Based on Electrical Response Of Concrete—CNTs Sensors under Fatigue Loading; Politecnico di Torino: Turin, Italy, 2017. [Google Scholar]
- Hou, T.-C.; Lynch, J.P. Conductivity-based strain monitoring and damage characterization of fiber reinforced cementitious structural components. Proc. SPIE Vol. 2005, 5765, 419–429. [Google Scholar]
- Vossoughi, F. Electrical Resistivity of Carbon Fiber Reinforced Concrete; Department of Civil Engineering, University of California: Berkeley, CA, USA, 2004. [Google Scholar]
- D’Alessandro, A.; Rallini, M.; Ubertini, F.; Materazzi, A.L.; Kenny, J.M. Investigations on scalable fabrication procedures for self-sensing carbon nanotube cement-matrix composites for SHM applications. Cem. Concr. Compos. 2016, 65, 200–213. [Google Scholar] [CrossRef]
- Han, B.; Yu, X.; Ou, J. Chapter 4—Self-Sensing Concrete in Smart Structures; Elsevier: Amsterdam, The Netherlands, 2015; Volume 1. [Google Scholar]
- Baeza, F.J.; Galao, O.; Zornoza, E.; Garcés, P. Multifunctional cement composites strain and damage sensors applied on reinforced concrete (RC) structural elements. Materials 2013, 6, 841–855. [Google Scholar] [CrossRef] [PubMed]
- Fu, X.; Ma, E.; Chung, D.D.L.; Anderson, W.A. Self-monitoring in carbon fiber reinforced mortar by reactance measurement. Cem. Concr. Res. 1997, 27, 845–852. [Google Scholar] [CrossRef]
- Chung, D.D.L. Self-monitoring structural materials. Mater. Sci. Eng. R Rep. 1997, 22, 57–78. [Google Scholar] [CrossRef]
- Qu, J.; Han, B. Piezoresistive cement-based strain sensors and self-sensing concrete components. J. Intell. Mater. Syst. Struct. 2008, 20, 329–336. [Google Scholar]
- Banthia, S.D.N.; Pigeon, M. Electrical resistivity of carbon and steel micro-fiber reinforced cements. Cem. Concr. Res. 1992, 22, 804–814. [Google Scholar] [CrossRef]
- Han, B.; Zhang, K.; Yu, X.; Kwon, E.; Ou, J. Electrical characteristics and pressure-sensitive response measurements of carboxyl MWNT/cement composites. Cem. Concr. Compos. 2012, 34, 794–800. [Google Scholar] [CrossRef]
- Corva, D.M.; Hosseini, S.S.; Collins, F.; Kouzani, A.Z. Miniature resistance measurement device for concrete infrastructure. Sensors 2020, 20, 4313. [Google Scholar] [CrossRef]
- Demircilioğlu, E.; Teomete, E.; Schlangen, E.; Baeza, J. Temperature and moisture effects on electrical resistance and strain sensitivity of smart concrete. Constr. Build. Mater. J. 2019, 224, 420–427. [Google Scholar] [CrossRef]
- Maier, M. The effect of moisture and reinforcement on the self-sensing properties of hybrid-fiber-reinforced concrete. Eng. Res. Express 2020, 2, 025026. [Google Scholar] [CrossRef]
- Ding, S.; Dong, S.; Ashour, A.; Han, B. Development of sensing concrete: Principles, properties and its applications. J. Appl. Phys. 2019, 126, 241101. [Google Scholar] [CrossRef]
- Slabs, O.F.C.; Pavement, E.C.; Equations, F. Fatigue and static testing of concrete slabs. Transp. Res. Rec. 2014, 1684, 71–80. [Google Scholar]
- Griffiths, G.; Thom, N. Concrete Pavement Design Guidance Notes; Taylor &Francis: Abingdon, UK, 2007. [Google Scholar]
- ASTM. Standard Test Method for Flexural Strength of Concrete (Using Simple Beam with Center-Point Loading); ASTM C78; ASTM International: West Conshohocken, PA, USA, 2012; pp. 12–14. [Google Scholar]
- Lee, M.K.; Barr, B.I.G. An overview of the fatigue behaviour of plain and fibre reinforced concrete. Cem. Concr. Compos. 2004, 26, 299–305. [Google Scholar] [CrossRef]
- Han, B.; Yu, X.; Ou, J. Chapter 5—Sensing properties of self-sensing concrete. In Self-Sensing Concrete in Smart Structures; Elsevier: Amsterdam, The Netherlands, 2014; pp. 95–162. [Google Scholar]
- Packard, R.G. New PCA Thickness Design Procedure for Concrete Highway and Street Pavements; AA Balkema: Rotterdam, The Netherlands, 1984. [Google Scholar]
- Konsta-Gdoutos, M.S.; Aza, C.A. Self sensing carbon nanotube (CNT) and nanofiber (CNF) cementitious composites for real time damage assessment in smart structures. Cem. Concr. Compos. 2014, 53, 162–169. [Google Scholar] [CrossRef]
- Birgin, H.B.; D’alessandro, A.; Laflamme, S.; Ubertini, F. Smart graphite–cement composite for roadway-integrated weigh-in-motion sensing. Sensors 2020, 20, 4518. [Google Scholar] [CrossRef]
- Birgin, H.B.; Laflamme, S.; D’alessandro, A.; Garcia-Macias, E.; Ubertini, F. A weigh-in-motion characterization algorithm for smart pavements based on conductive cementitious materials. Sensors 2020, 20, 659. [Google Scholar] [CrossRef] [PubMed]
- Frniak, M.; Markovic, M.; Kamencay, P.; Dubovan, J.; Benco, M.; Dado, M. Vehicle classification based on fbg sensor arrays using neural networks. Sensors 2020, 20, 4472. [Google Scholar] [CrossRef]
- Zhang, C.; Shen, S.; Huang, H.; Wang, L. Estimation of the vehicle speed using cross-correlation algorithms and mems wireless sensors. Sensors 2021, 21, 1721. [Google Scholar] [CrossRef] [PubMed]
- Okada, K.; Okamura, H.; Sonoda, K. Fatigue failure mechanism of reinforced concrete bridge deck slabs. Transp. Res. Board 1978, 664, 136–144. [Google Scholar]
Publisher’s Note: MDPI stays neutral with regard to jurisdictional claims in published maps and institutional affiliations. |
© 2021 by the authors. Licensee MDPI, Basel, Switzerland. This article is an open access article distributed under the terms and conditions of the Creative Commons Attribution (CC BY) license (https://creativecommons.org/licenses/by/4.0/).