2. Parameters and Description
The four design parameters listed in
Table 1 were selected based on previous research [
13,
15], IAB monitoring results [
5,
26,
27], and transportation agency input [
35]. In addition to the four design parameters, four uncontrollable environmental parameters including construction timeline, thermal expansion coefficient, backfill stiffness, and soil–pile interaction were considered in this study.
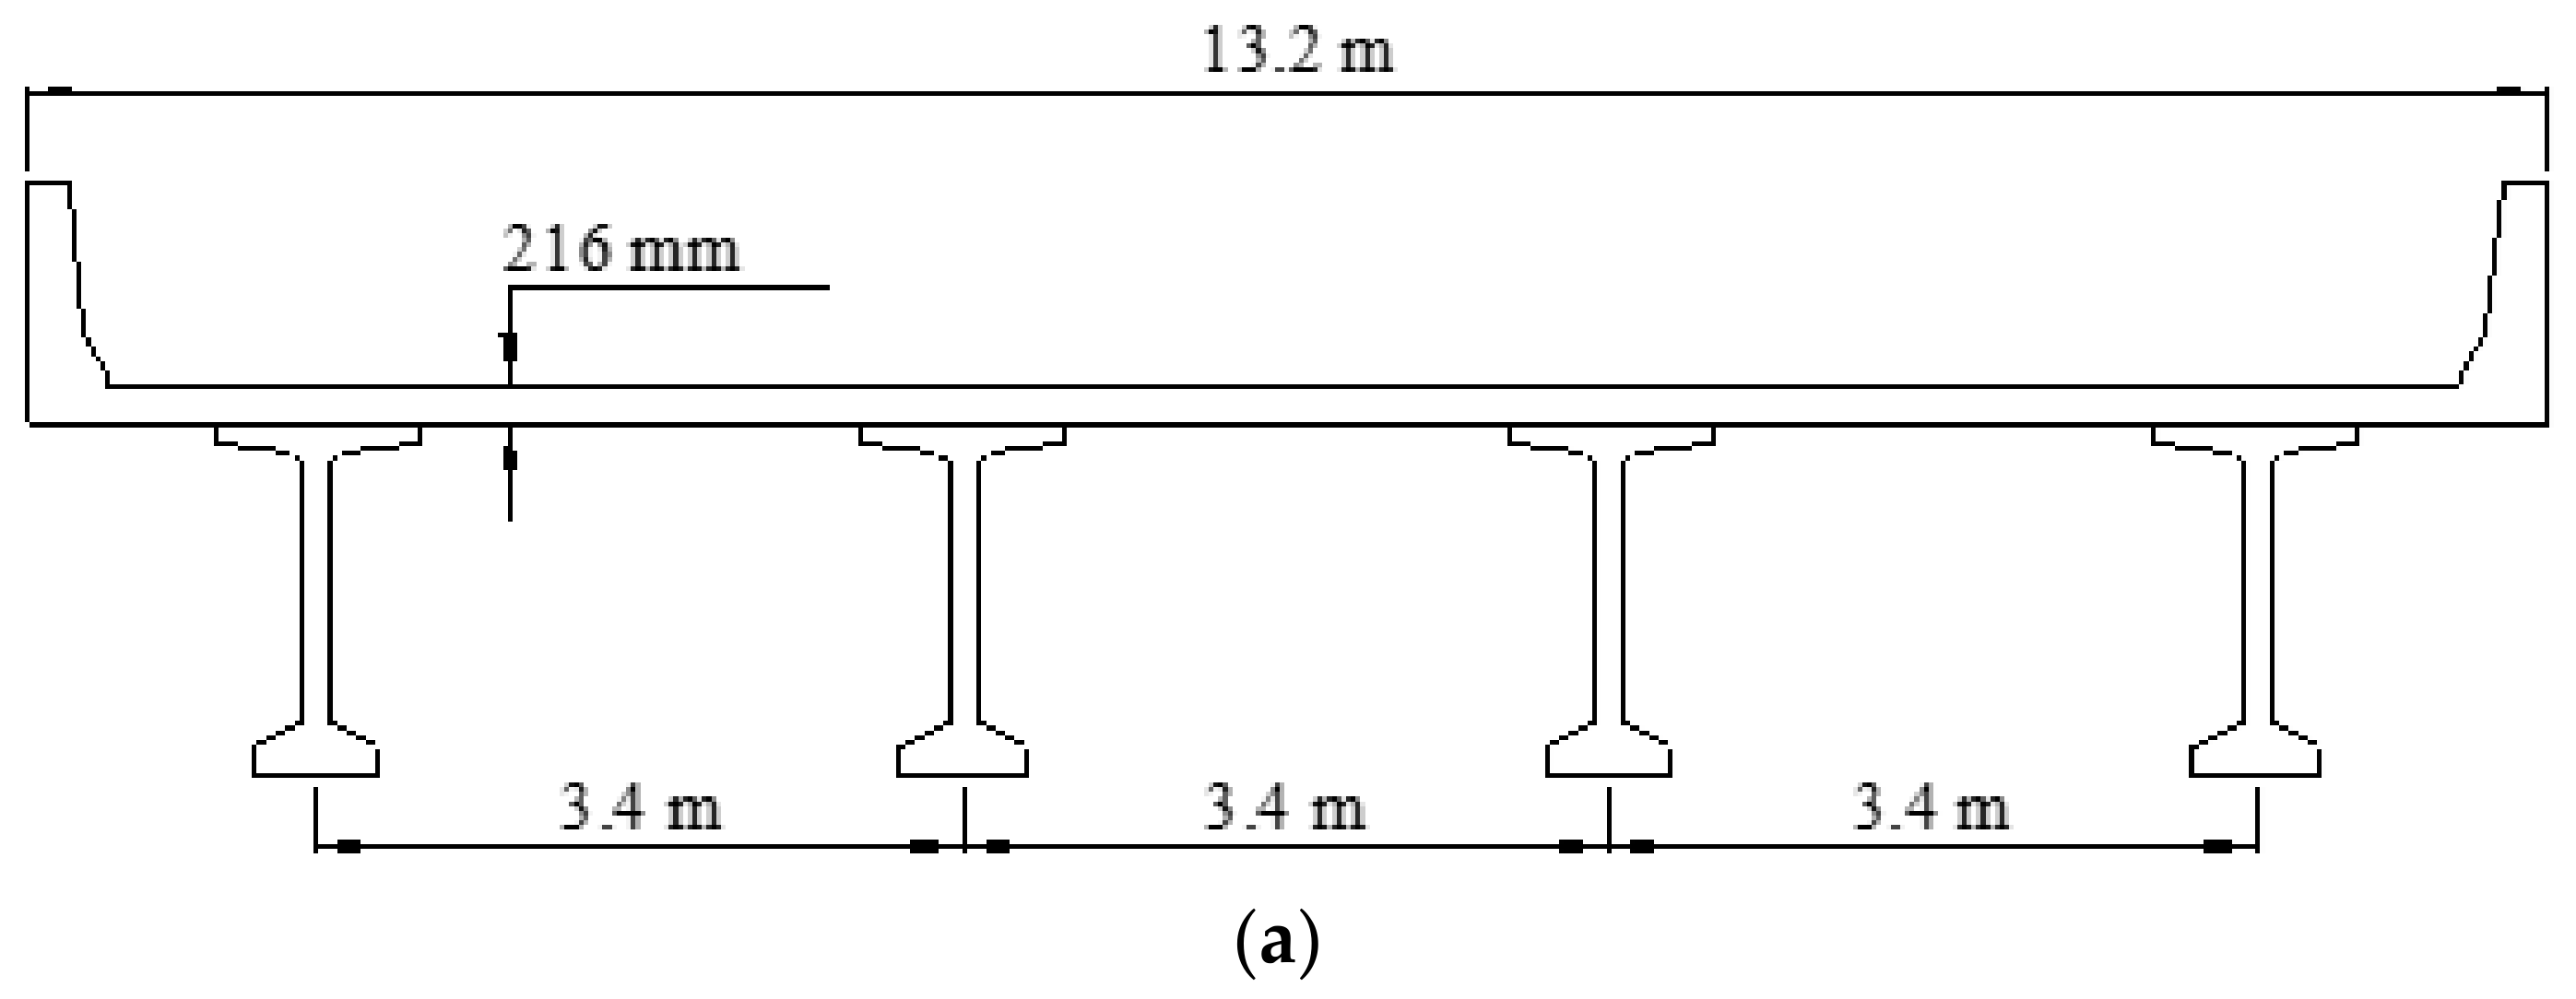
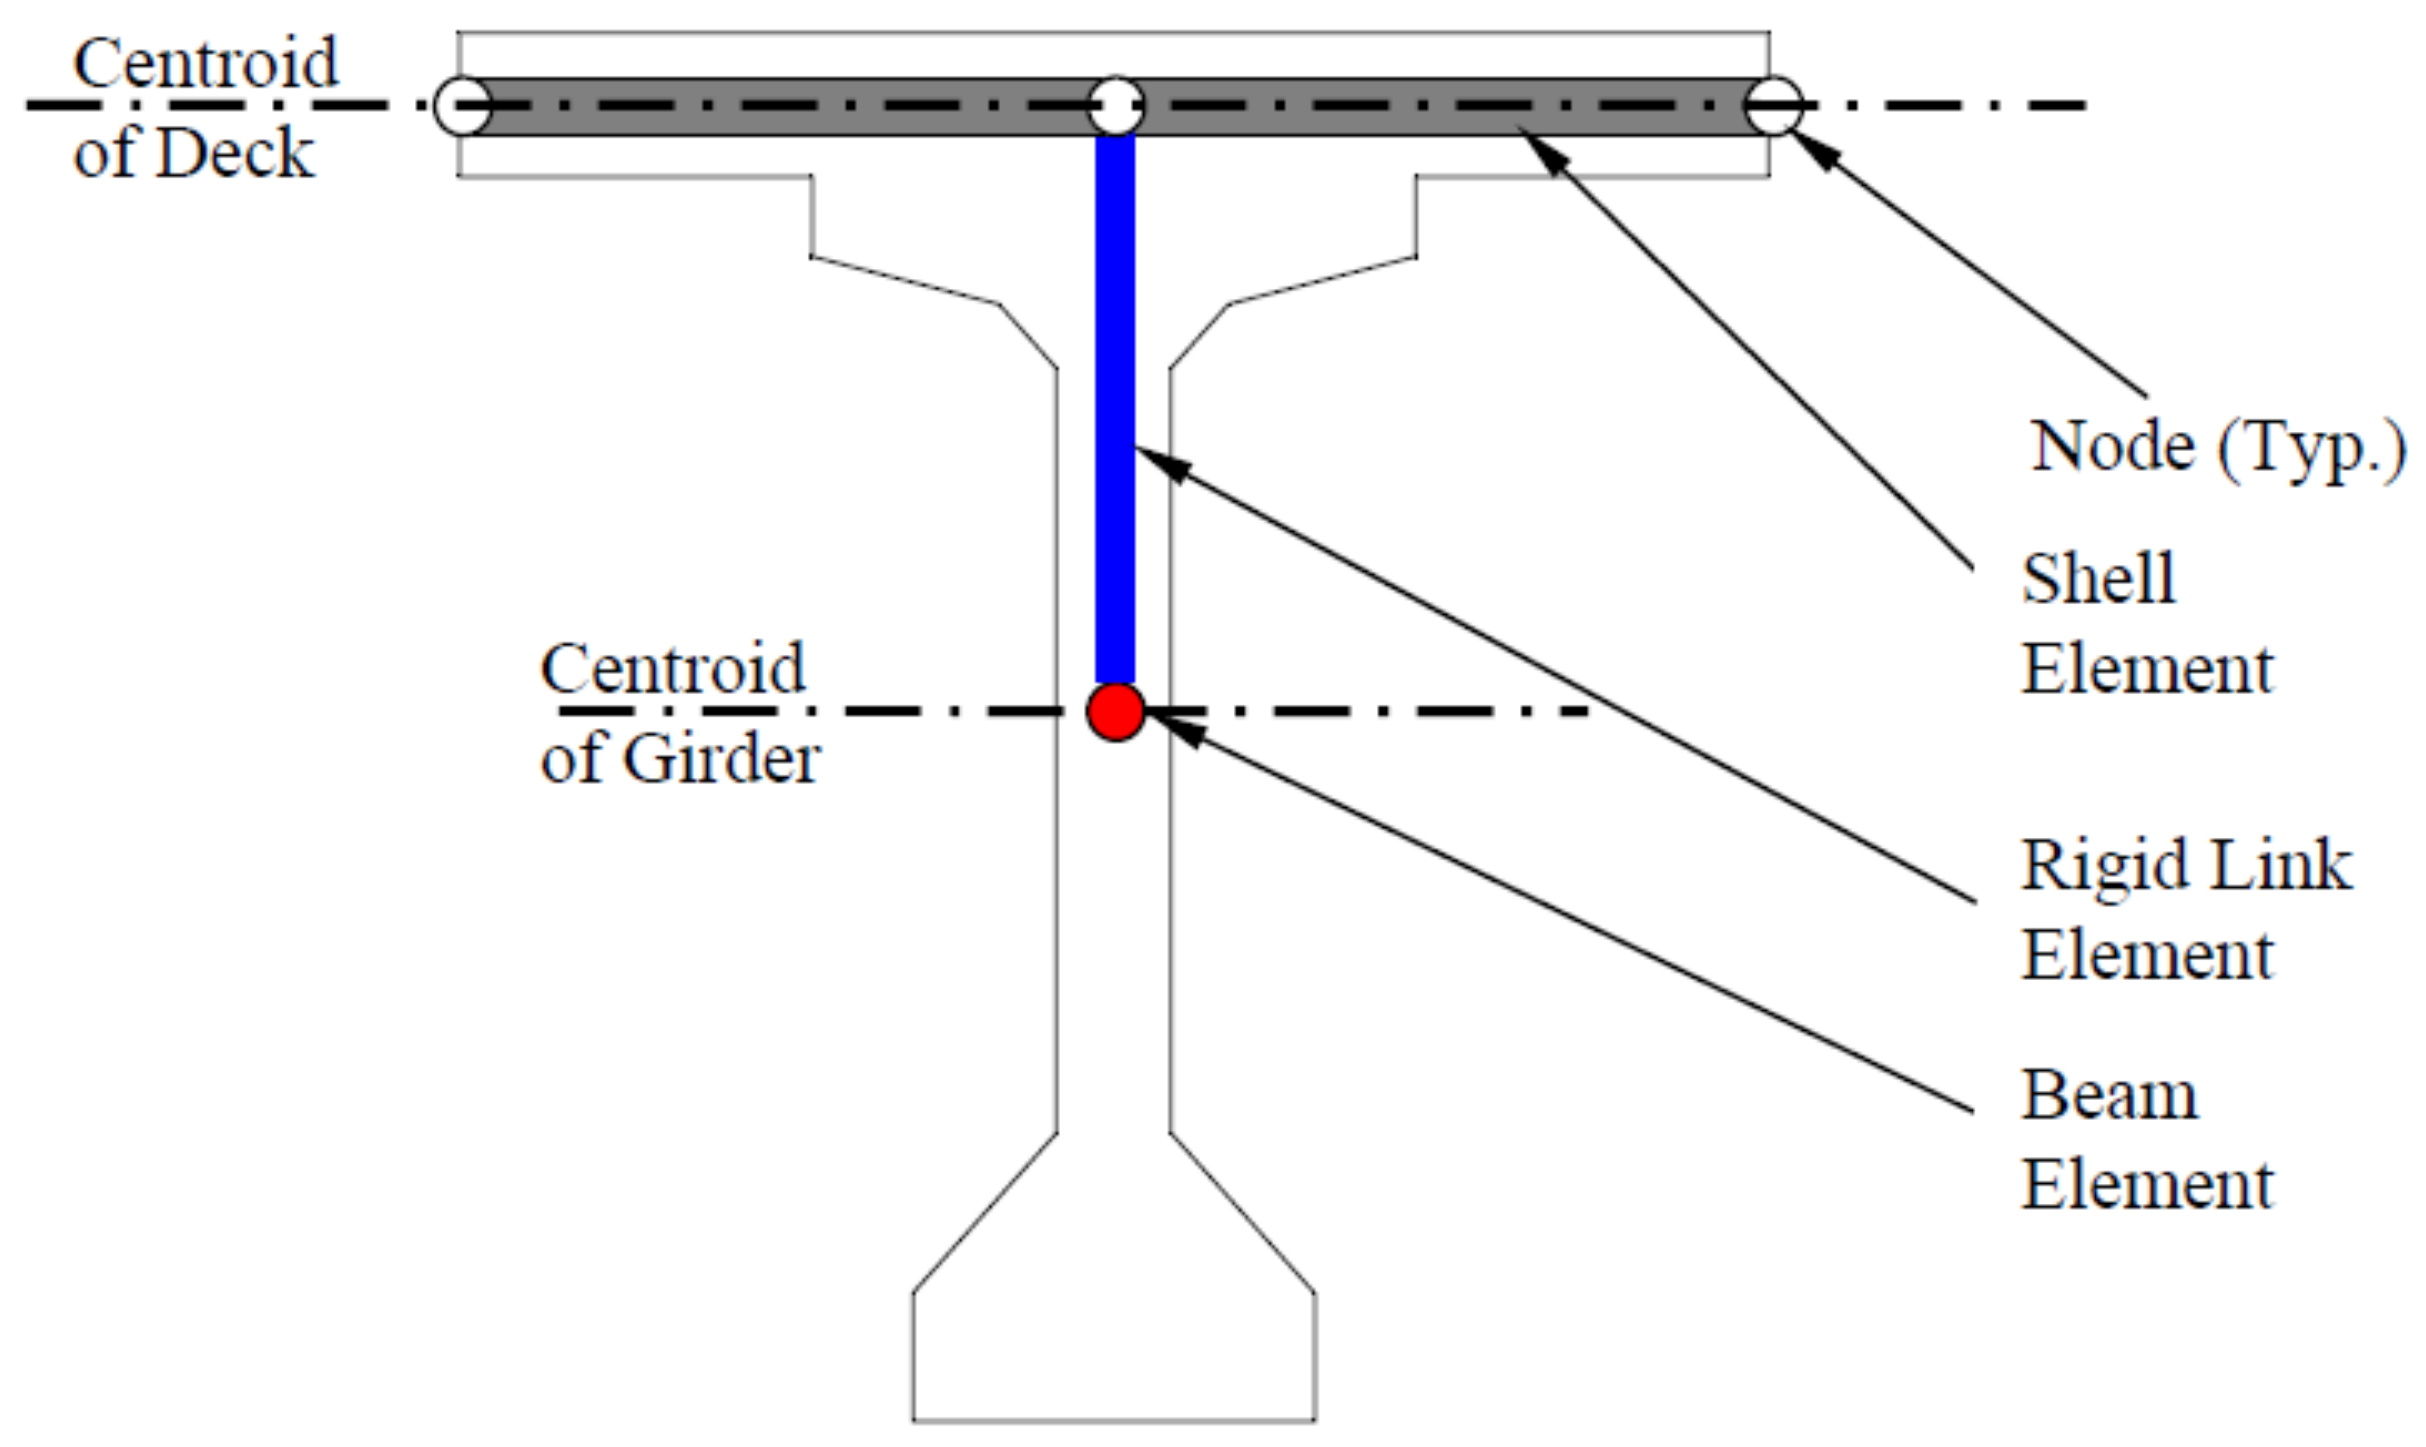
Each bridge girder for varying bridge lengths and spans was designed in accordance with AASHTO LRFD Bridge Design Specifications (2014). The prestressed concrete (PSC) girder superstructure cross-section selected for this study consists of four or five girders with concrete compressive strength
= 55.2 MPa and a cast-in-place concrete deck of
= 27.6 MPa, as shown in
Figure 1. The steel girder bridges have four or five steel plate girders of yield strength (
) = 345 MPa with a cross-section similar to that presented in
Figure 1, and a detailed cross section for each bridge is presented in
Table 2.
2.1. Bridge Design Parameters
2.1.1. Bridge Length ()
The dimensional parameters evaluated in the study are bridge length (
) and abutment backfill height (
). Bridge lengths were selected as representative of short to medium length bridges with one, two, three, and four spans. Both steel and PSC girders were designed for each span length in accordance with AASHTO LRFD [
25]. For 30.5, 61.0, 121.9, and 182.9 m bridges, AASHTO PCI BT-72, BT-72, BT-81, and BT-90 girders were adopted, respectively. For steel plate girders, 122, 104, 145, and 176 mm high built-up sections were designed.
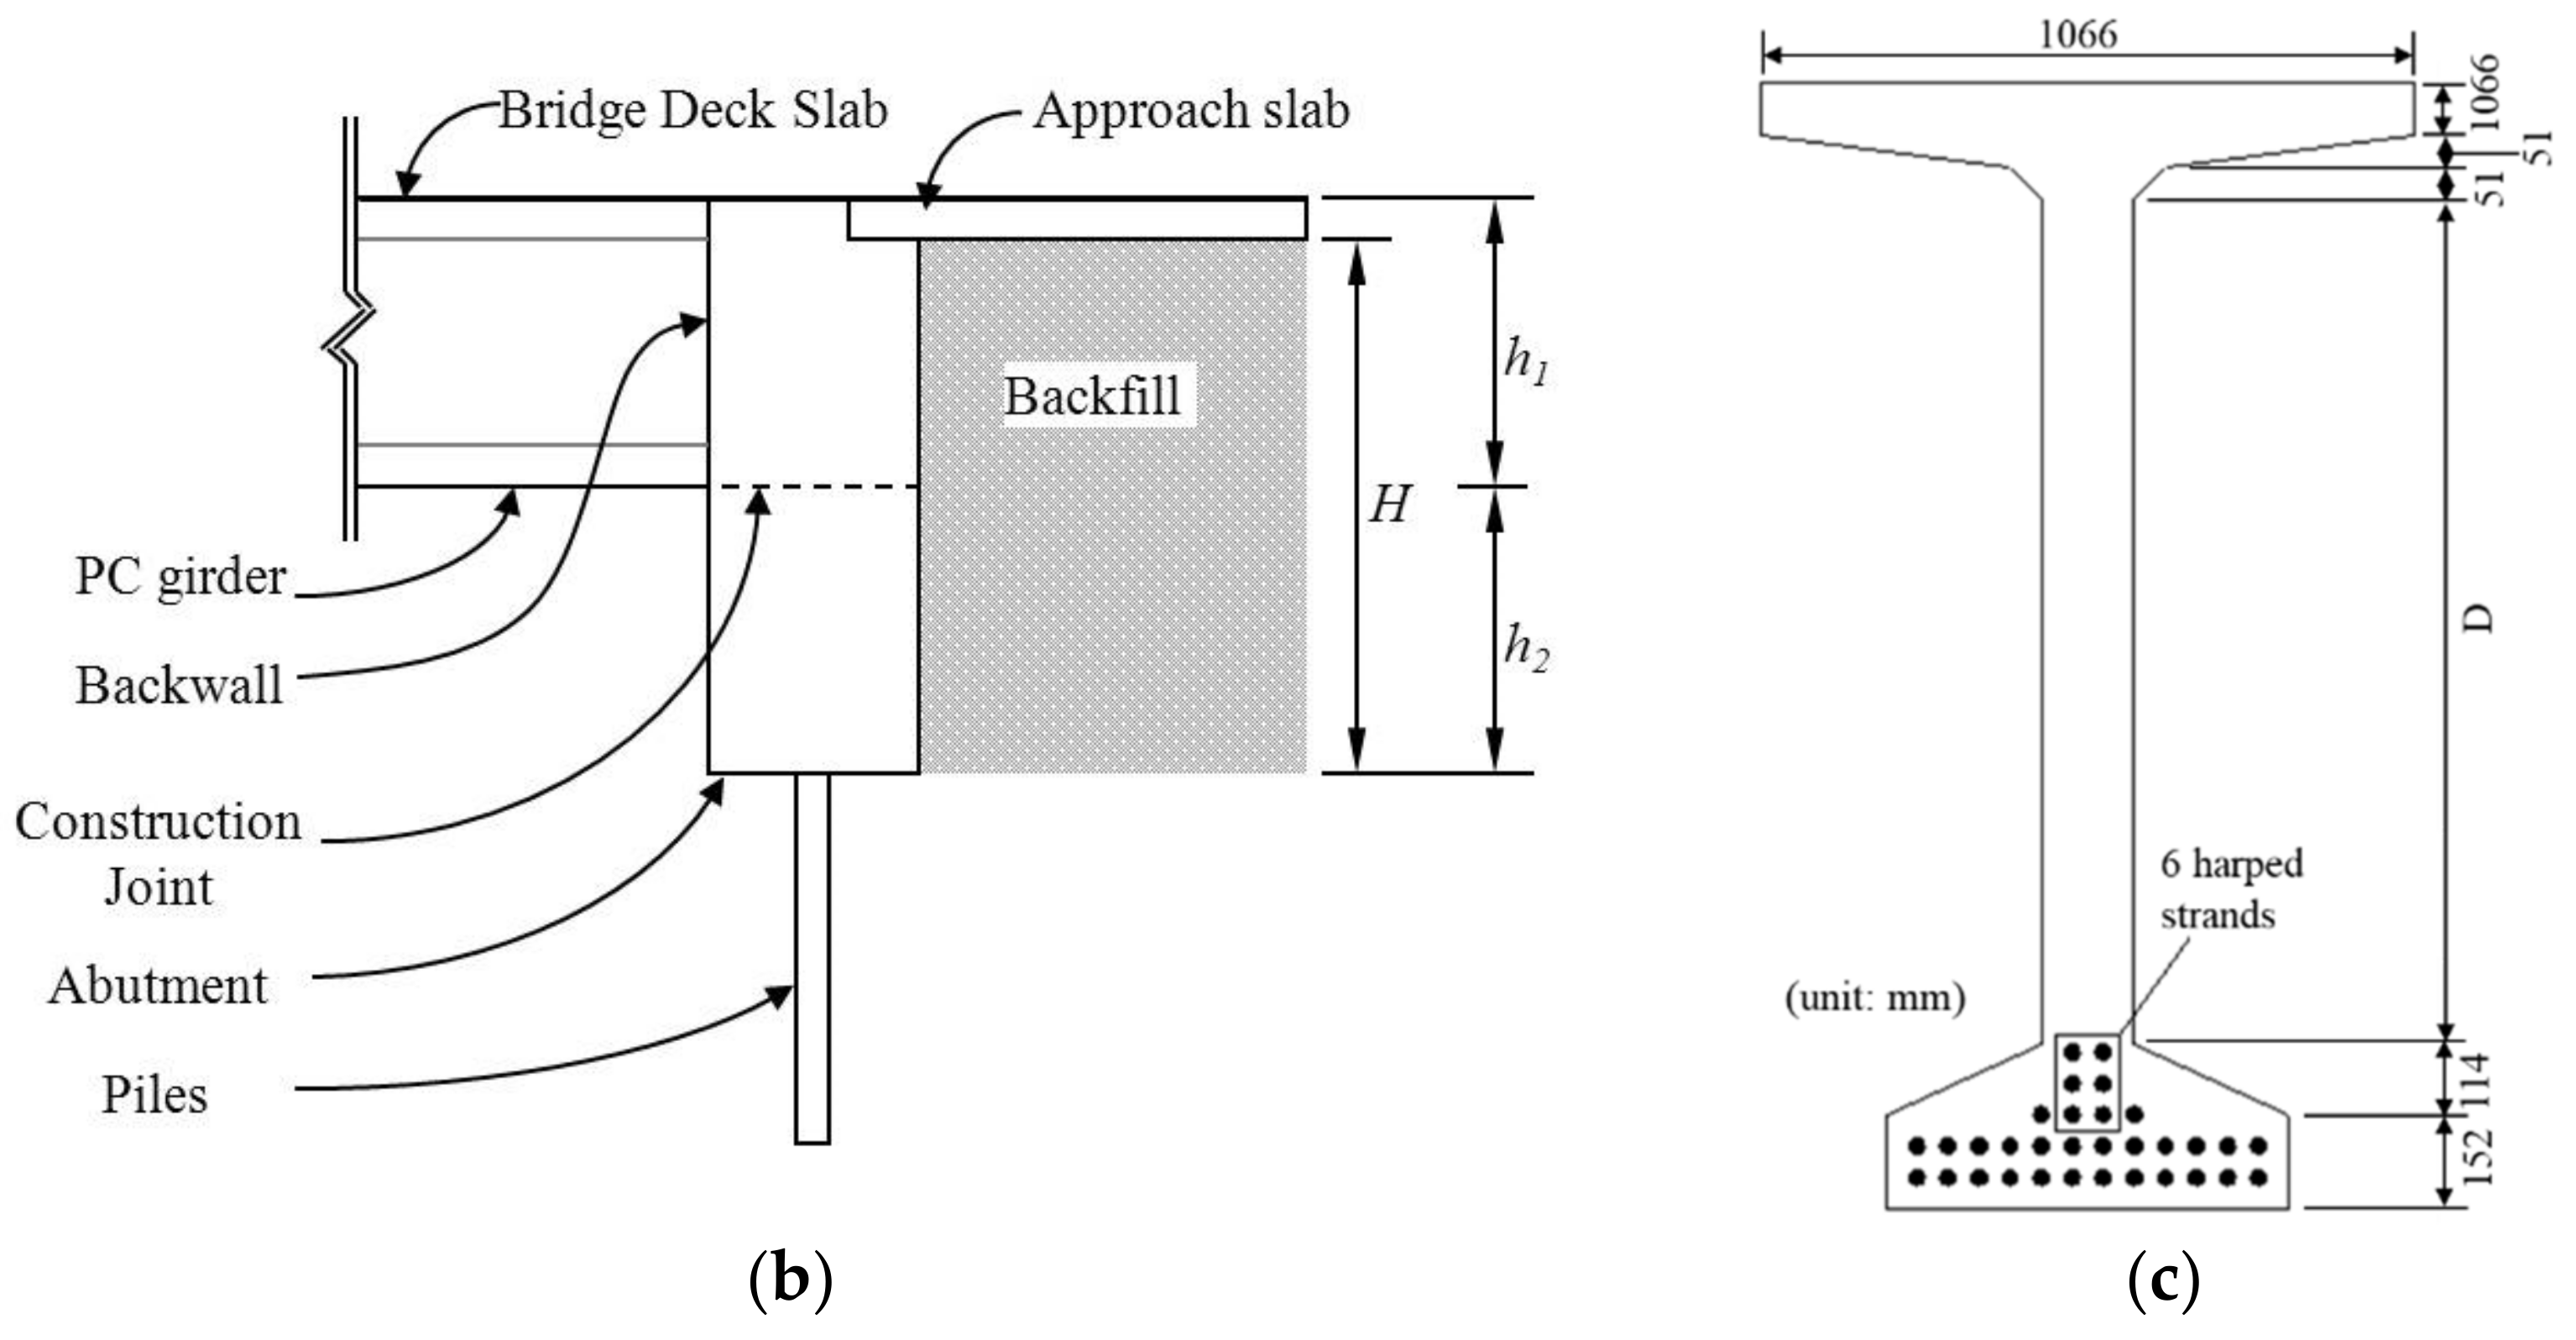
2.1.2. Backfill Height ()
Abutment height is one of the most strongly influencing parameters [
38]. In this study, abutment height was considered as a backfill height, which is a direct factor influencing backfill pressure. All abutment and pile configurations consist of a single row of 13 steel H-piles supporting a cast-in-place wall abutment; this eliminates any performance difference due to the number of piles. Cast-in-place abutment concrete with
= 20.7 MPa and a backwall with
= 24.1 MPa is used, which is the same as the strength of concrete deck slab. As presented in
Figure 1b,
represents the total backfill height from the bottom of the abutment to the bottom of the approach slab. The roadway elevation was maintained for each IAB, while the abutment below the girder seat height (
in
Figure 1b) varies because of the different girder heights (
in
Figure 1b) for different bridge lengths. As a result, the construction joints between the backwall and abutment are located at different elevations.
2.1.3. Abutment to Backwall Joint Stiffness
The abutment to backwall (AB) joint stiffness significantly influences abutment response [
15] and, therefore, has been considered as a design parameter. Paul et al. [
38] investigated AB joint influence in terms of abutment displacement and rotation and concluded that both pinned and fixed AB joint models exhibited very little differences under uniform temperature rise and fall. Considering that the abutment displacement is mainly determined by the superstructure length [
25], this result is reasonable. However, the consideration of AB joint is still necessary to identify forces in the superstructure and substructure because AB joint is a gateway through which force is transmitted from top to bottom.
The specified reinforcement ratio of bars crossing the joint is often meager. PennDOT DM4 [
35] specifies #16@500 mm U-shaped reinforcing bars, resulting in joint reinforcement ratios generally less than 25 percent of the recommended AASHTO LRFD [
25] minimum reinforcement ratio. Many other state agencies use similar reinforcement details, but this reinforcement guideline still varies between hinge and rigid connection. This low reinforcing ratio permits rotation in response to superstructure expansion and contraction. In analysis, however, the joint is often ignored with the abutment and backwall modeled as a single monolithic element [
8,
11,
36,
37]. Four IABs’ field monitoring results [
5] revealed differential rotations between the backwall and abutment where this flexible AB joint is present. Because of the significance of the AB joint, three joint stiffnesses were considered: (1) hinged (free rotation); (2) PA (Pennsylvania) Standard (#16@500 mm U-shaped reinforcing bars); and (3) monolithic (rigid).
2.2. Uncontrollable Parameters
Bridge designers consider, but cannot control several important variables during the bridge design process. In this study, the construction timeline, thermal expansion coefficient of the superstructure, backfill stiffness, and pile-soil stiffness were considered. These variables are generally uncontrollable during the design stage, and thus were assumed to be constant variables in this study.
2.2.1. Construction Timeline
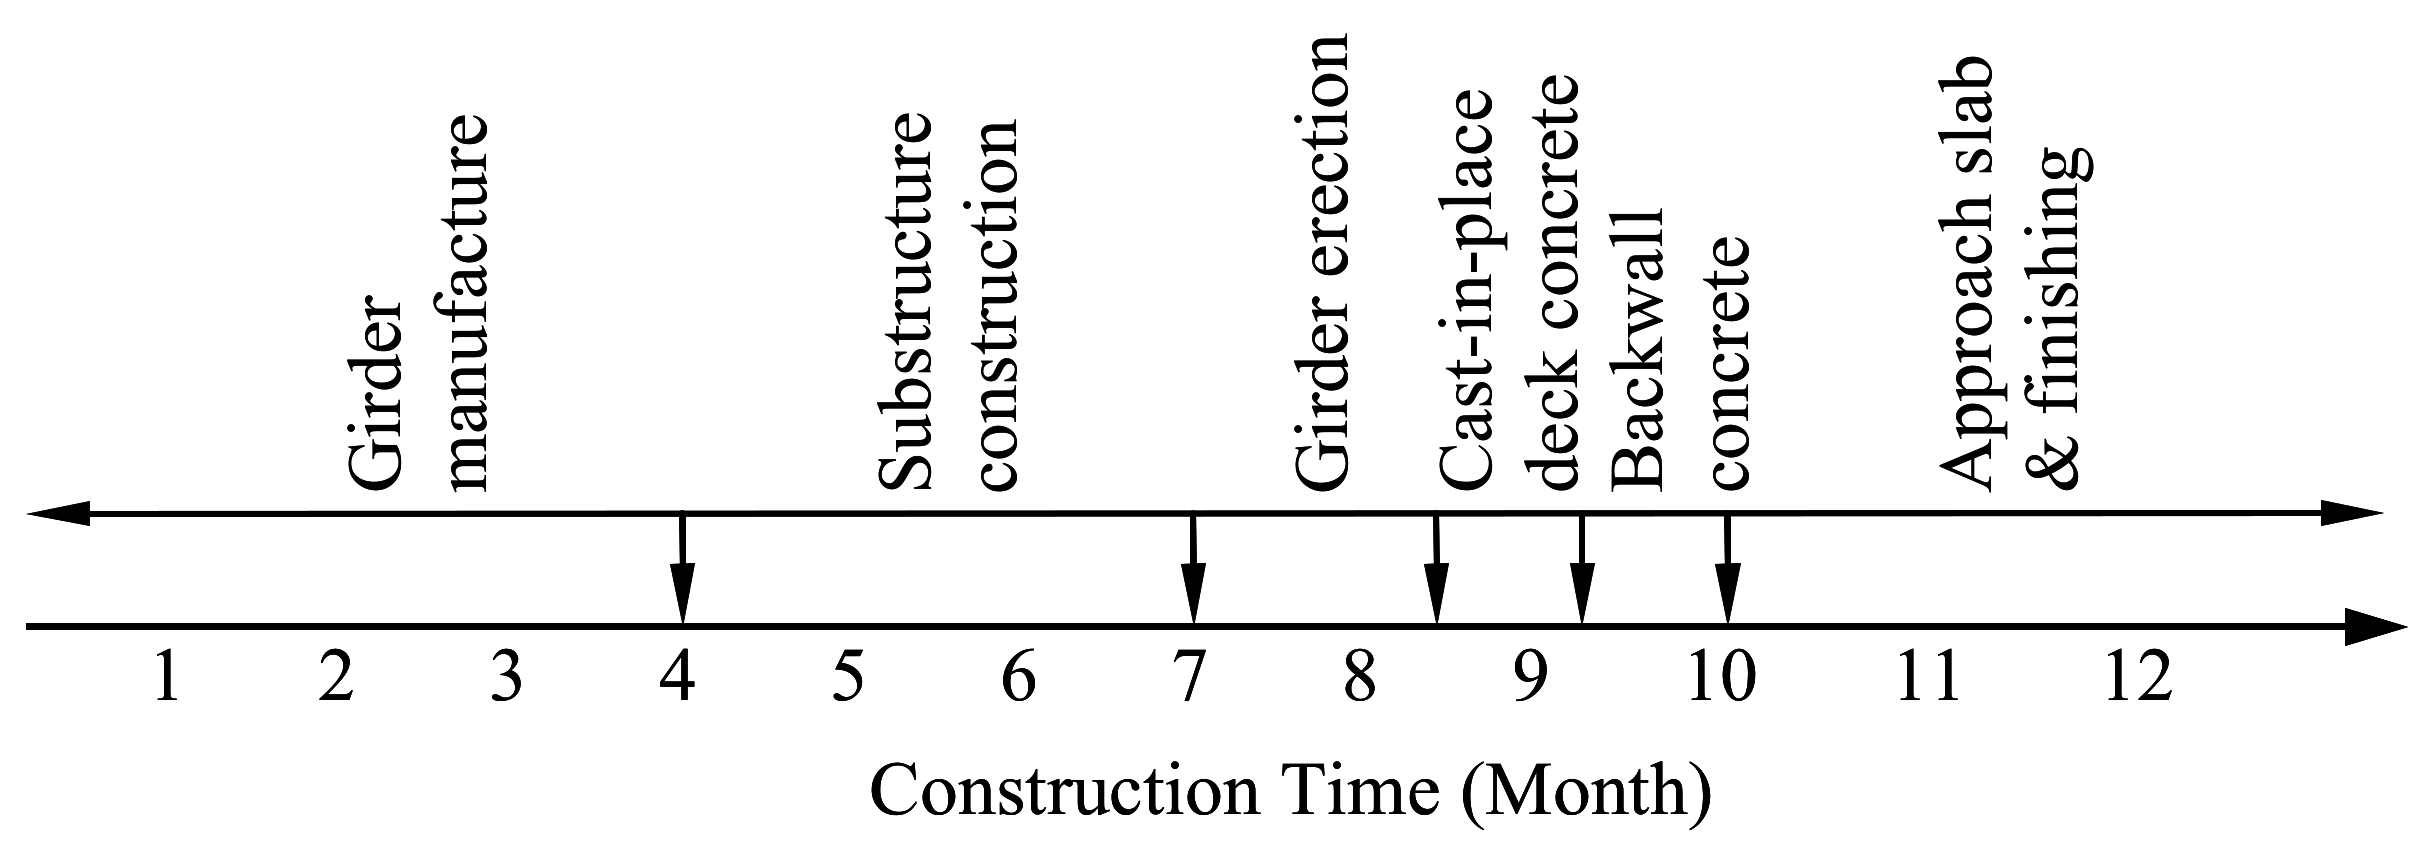
The construction timeline influences behavior owing to time-dependent effects inherent in the concrete deck slab, prestressed girders, and backwall. The long-term influence of the construction timeline has already been shown by Kim and Laman [
29]. Prior to completion of construction, all structural elements are substantially free to undergo creep and shrinkage with no significant effect on the assembled bridge. After the construction of concrete backwall, girders and deck are structurally integrated; the bridge superstructure and substructure elements behave as a unit, developing complex interactions in resisting vertical loads (dead loads and live loads) as well as horizontal loads (thermal loads, time-dependent effects, and temperature).
The construction timeline assumed for this study is presented in
Figure 2. The assumed construction timeline developed based on the previous field monitoring of four IABs [
5] met an average construction timeline of the four IABs. Typical ranges are as follows: deck concrete placement lags girder manufacture by 60 to 180 days and backwall placement lags deck placement by 10 to 100 days. Deck and backwall placement are the final components constructed; therefore, it has been assumed that deck concrete is placed 100 days after girder manufacture and the backwall is placed 20 days after the deck placement.
2.2.2. Thermal Expansion Coefficient
The thermal expansion coefficient,
α, directly influences superstructure strain in response to material temperature changes, and is the primary cause of the difference in response between steel and concrete girder IABs. The range of
α for concrete widely varies owing to variations in concrete mixes that include aggregate properties and proportions, water-to-cement ratio, relative humidity, concrete age, and other factors. When test data are not available, AASHTO LRFD [
25] recommends
α for concrete of 10.8 × 10
−6/°C with a range of 5.4 to 14.4 × 10
−6/°C. However, the AASHTO recommendation is conservative compared with other research findings [
25]. Therefore, the present study has selected α for concrete equal to 10.0 × 10
−6/°C. The thermal expansion coefficient of steel is well established and predictable; therefore, an
α equal to 11.7 × 10
−6/°C was used in the numerical models for the thermal expansion coefficient of steel.
2.2.3. Soil–Structure Interaction
The soil–structure interaction is one of the main sources of the nonlinear behavior of IABs. Two types of soil–structure interaction should be considered to understand IAB behavior: (1) abutment–backfill interaction and (2) soil–pile interaction. Abutment–backfill interaction significantly influences IAB response to thermal and time-dependent loads [
12,
15,
37]. For the purposes of this study, typical backfill soil properties—standard backfill material variations are limited—were adopted in the study and are presented in
Table 3.
Soil–pile interaction is another source of nonlinear behavior of IABs. Soil–pile interaction is usually exerted by the interaction between pile stiffness and sounding soil stiffness. Many previous studies [
2,
8,
10,
11,
13,
15,
26,
27,
33,
34,
37,
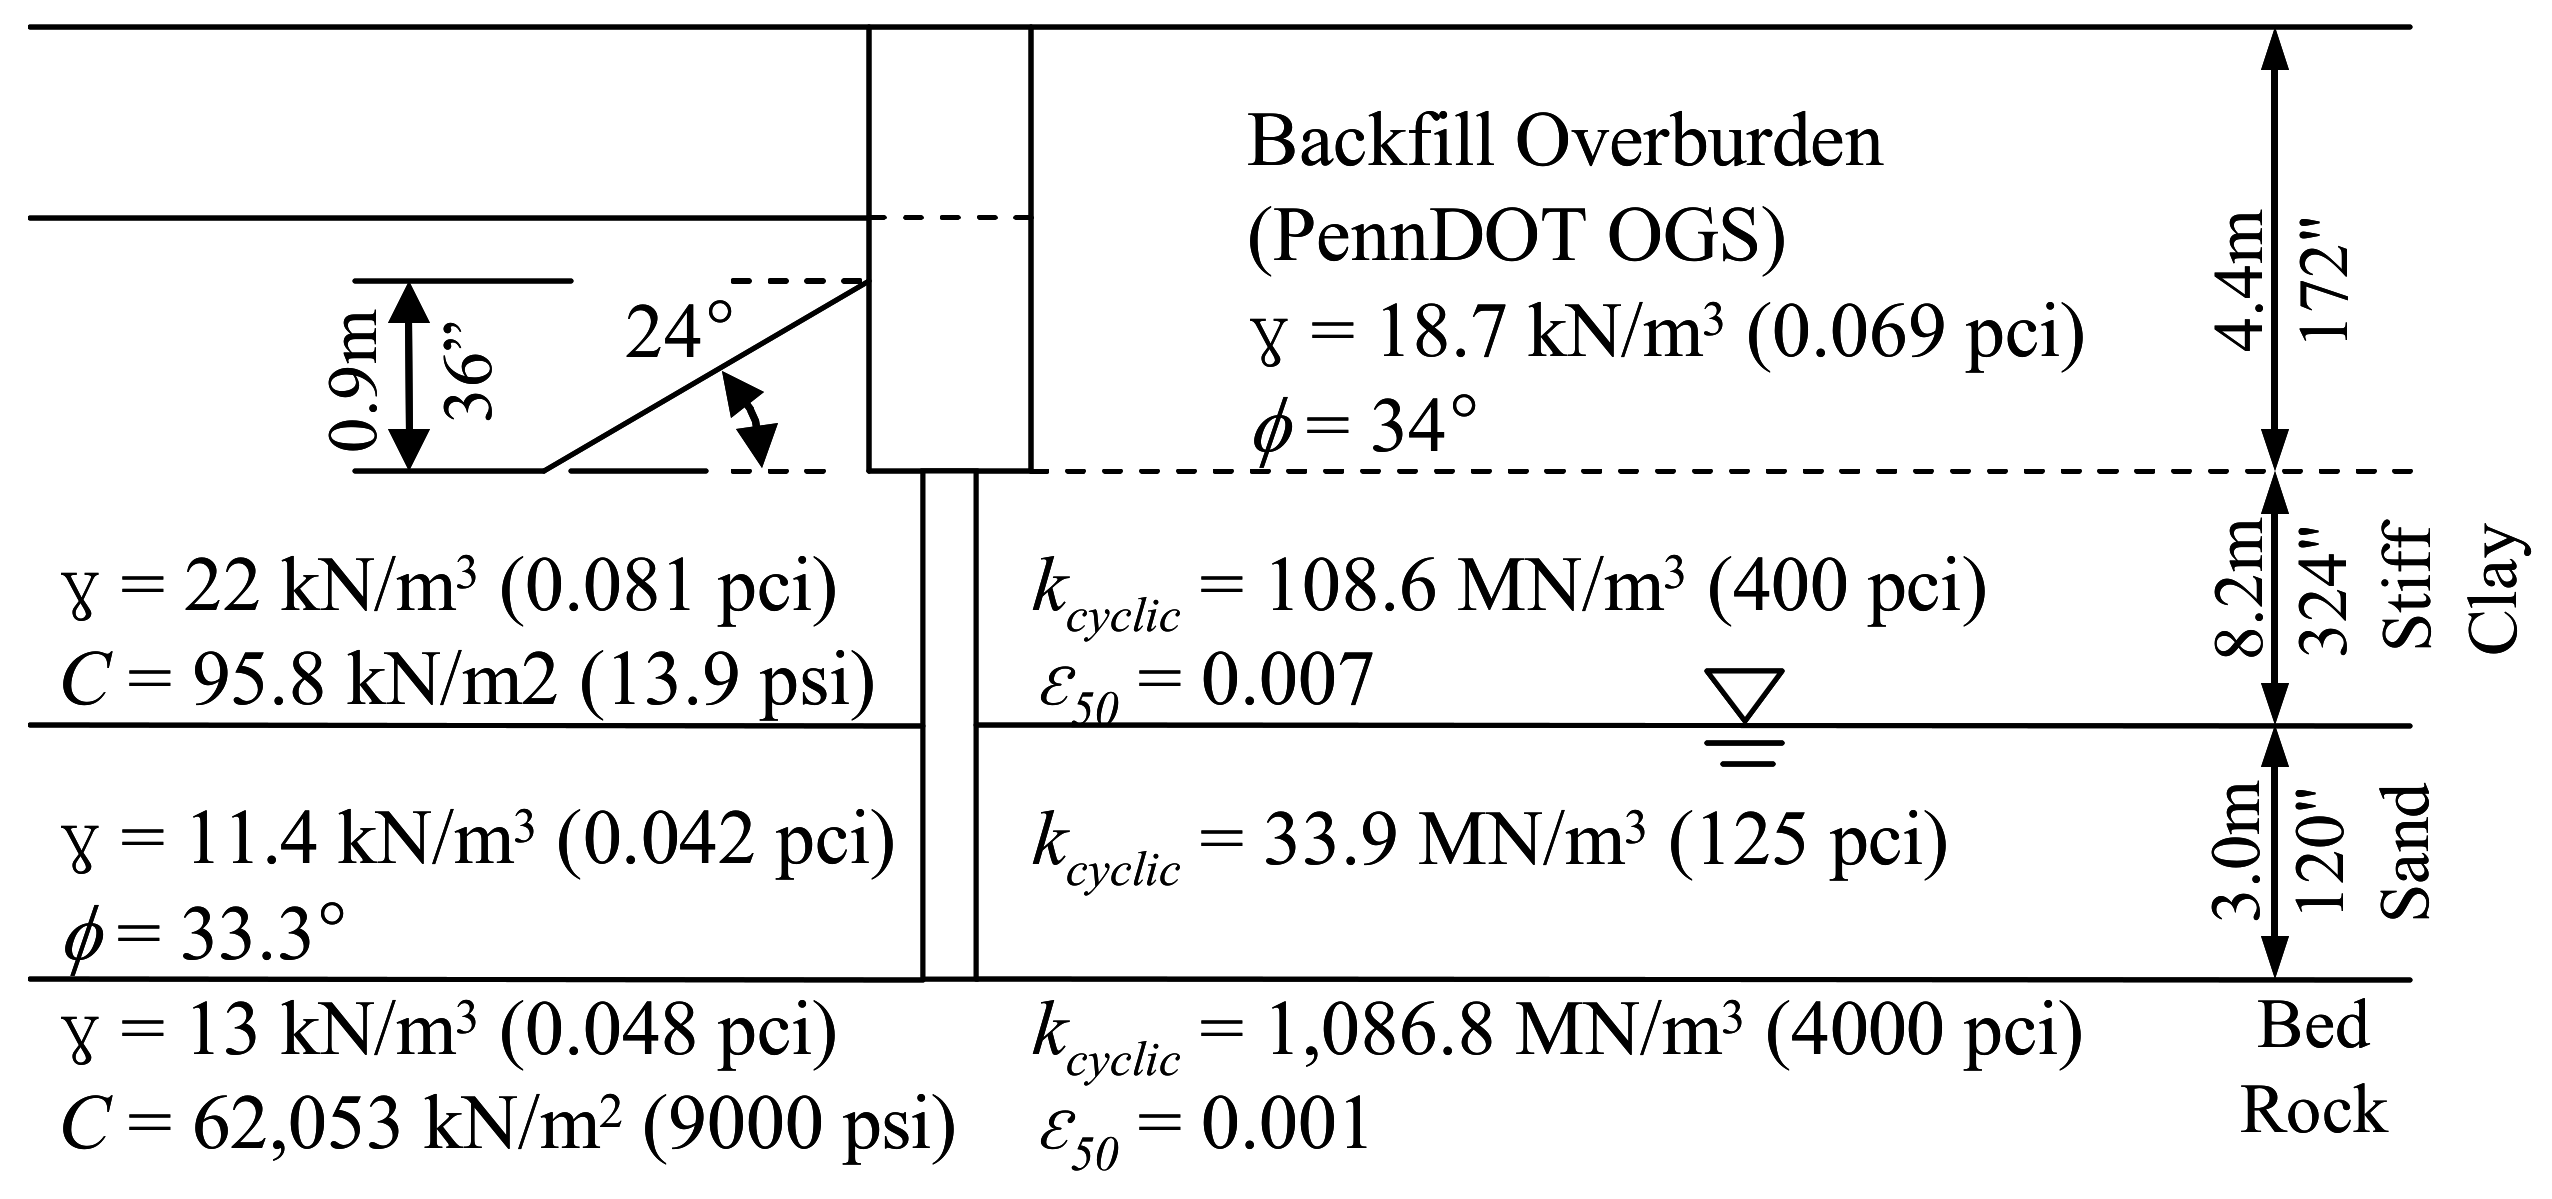
39] reported that soil–pile interaction is a key variable to determine IAB behavior. However, several boring tests are performed before bridge design, thus properties of surrounding soils have uncertainties. During the pile driving stage, piles are sometimes crooked owing to rocks in geological stratum. Thus, this study assumed properties of the soil–pile interaction based on typical supporting steel piles and soil strata. A total of 13 HP310 × 110,
= 345 MPa piles were used and oriented to the weak-axis for the parametric study. Soil strata properties from the previous field test [
5] were selected for this study and are presented in
Figure 3. The values behind the abutment were used to define the abutment–backfill interaction based on Rankine’s theory. The values on both the left and right were used to define
p-
y curves for the soil–pile interaction [
40].
3. Development of 3D Numerical Models
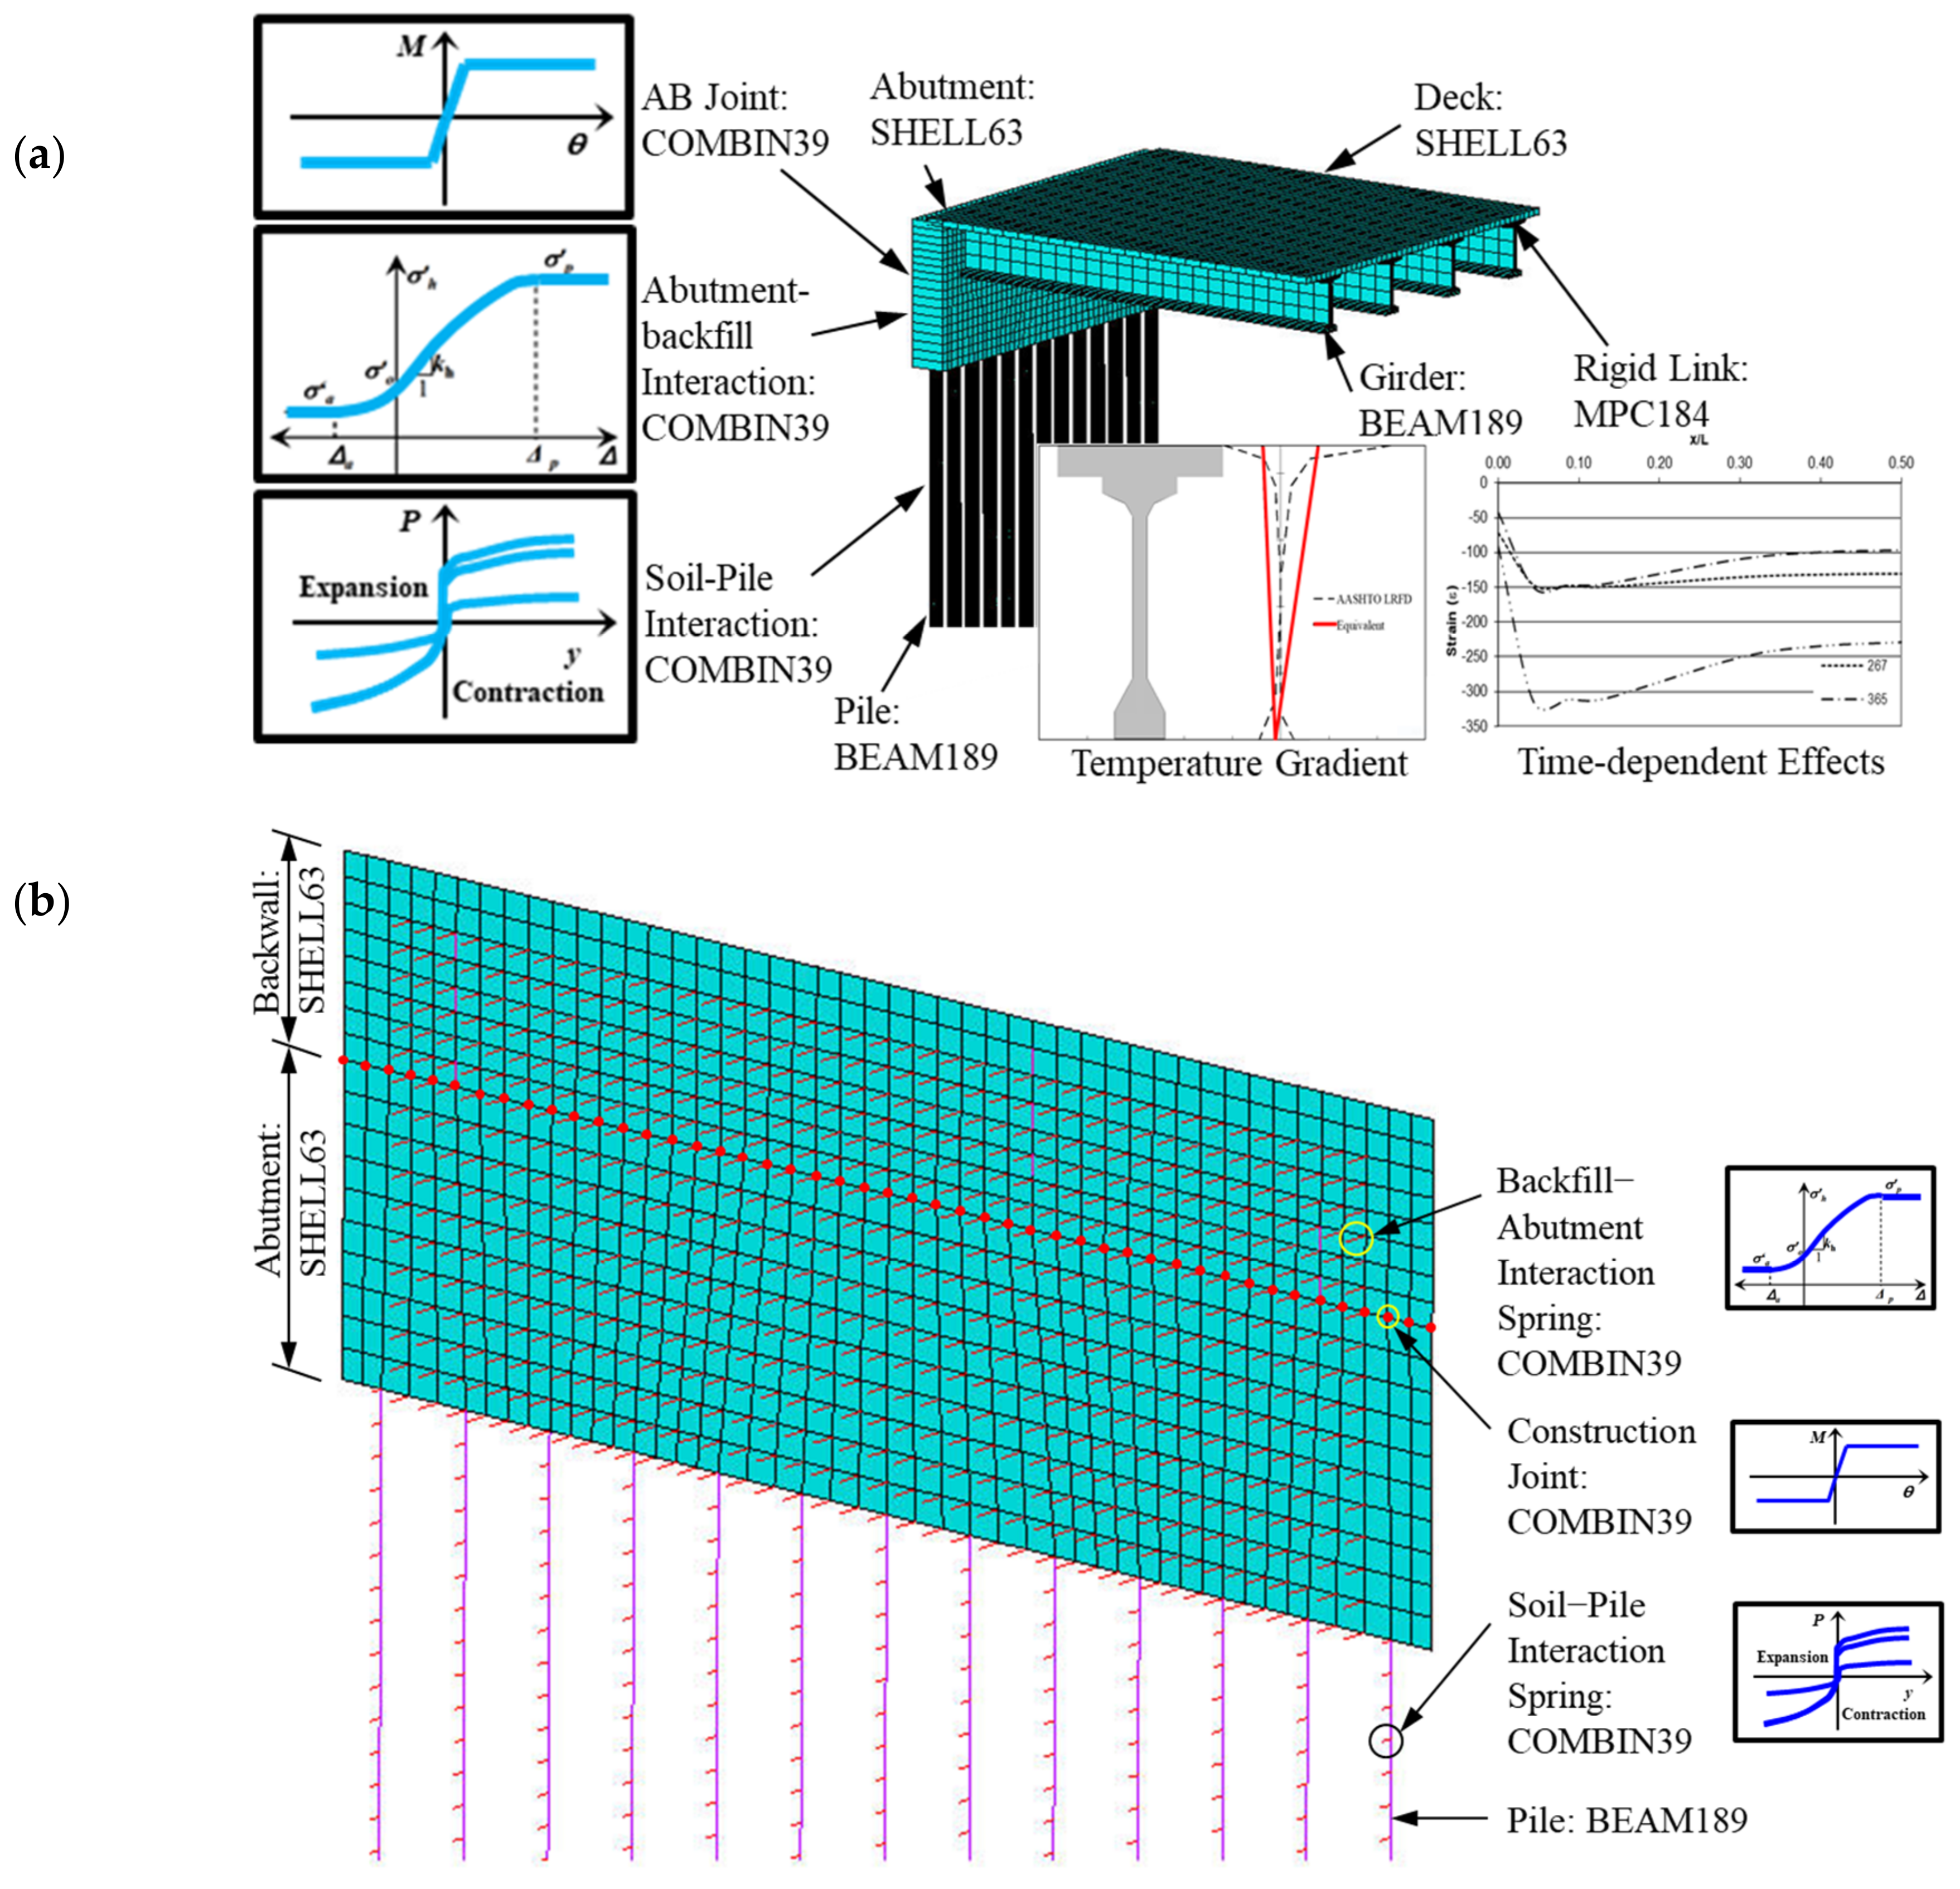
The 3D FE models in
Figure 4 and
Figure 5 were developed to predict the response of instrumented IABs to thermal loads; analysis was performed using ANSYS. For the superstructure, shell and beam elements represent deck slab and girders, respectively, as shown in
Figure 4. For the substructure, shell elements represent the abutment and backwall and beam elements represent the piles, as shown in
Figure 5.
Bridge loads include backfill pressure, time-dependent effects, temperature load, and temperature gradient load. Backfill pressure applied to abutments is the traditional, linearly varying distribution with depth.
The girder boundary conditions at the abutment were rigidly connected to the backwall without bearings. At the internal piers, the superstructure was built continuously and supported by elastomeric bearings. The piles were rigidly connected to the bottom of the abutment and fixed at the pile tips.
The FE models were implemented in a two-step analysis. In the first step, earth pressure behind the abutment was initially applied to consider an initial abutment displacement before backwall placement. Then, in the second analysis step, temperature- and time-dependent loads were applied after nonlinear springs of backfill–abutment interaction curves were set. Detailed analysis procedure can be found in the literature [
15,
29,
41].
3.1. Abutment–Backfill Interaction
The numerical models include the critical features of soil–structure interaction and abutment–backwall joint behavior. Soil–structure interaction is categorized into two components: soil–pile interaction and backfill–abutment interaction. Some studies [
12,
42] used 2D plane elements to consider the elastoplastic behavior of backfills, but this approach is too expensive to be utilized in 3D models. Thus, based on the backfill properties shown in
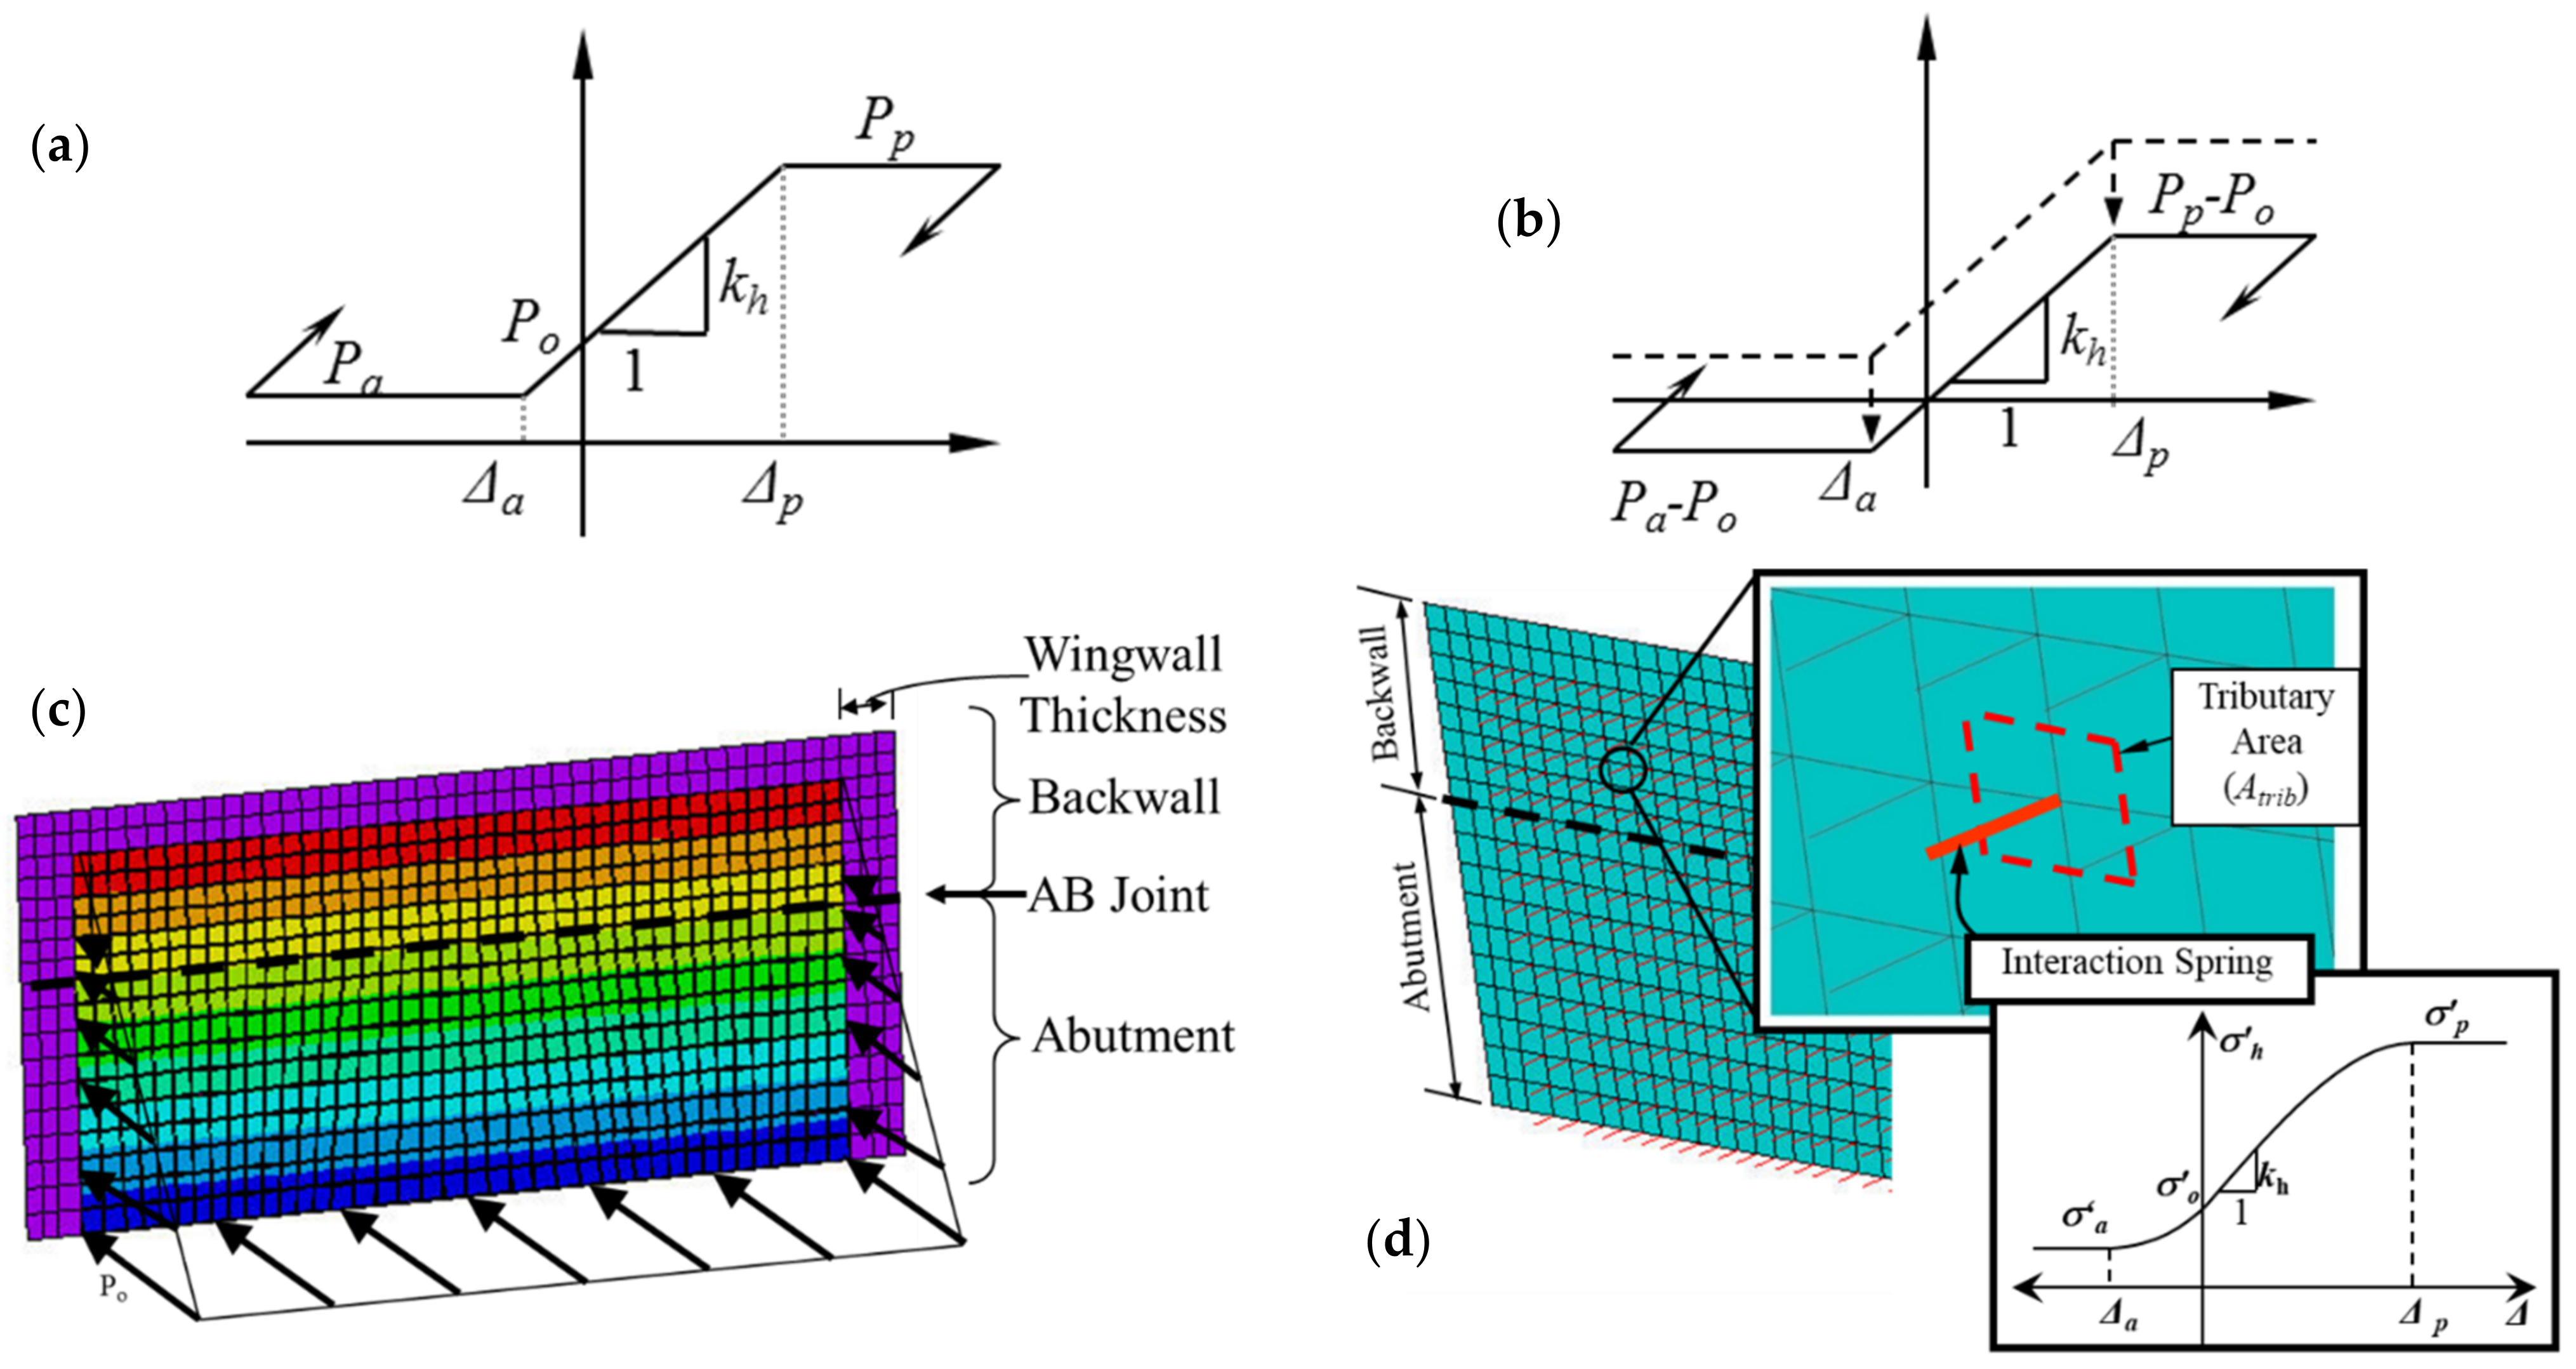
Table 3, multi-linear springs—within the range of the upper and lower bound defined by the passive and active failure limit—were determined to simulate backfill-abutment interaction, as shown in
Figure 6a. The spring properties varied along with backfill depth (
Figure 6c) and element tributary area (
Figure 6d). To implement the backfill–abutment interaction, two modifications were applied. Firstly, as shown in
Figure 6b, the multi-linear line was vertically moved down in the amount of at-rest pressure (
), so that it can start from the origin. Then, the at-rest pressure was applied externally to the abutment to compensate for the parallel translation (
Figure 6c).
3.2. Soil–Pile Interaction
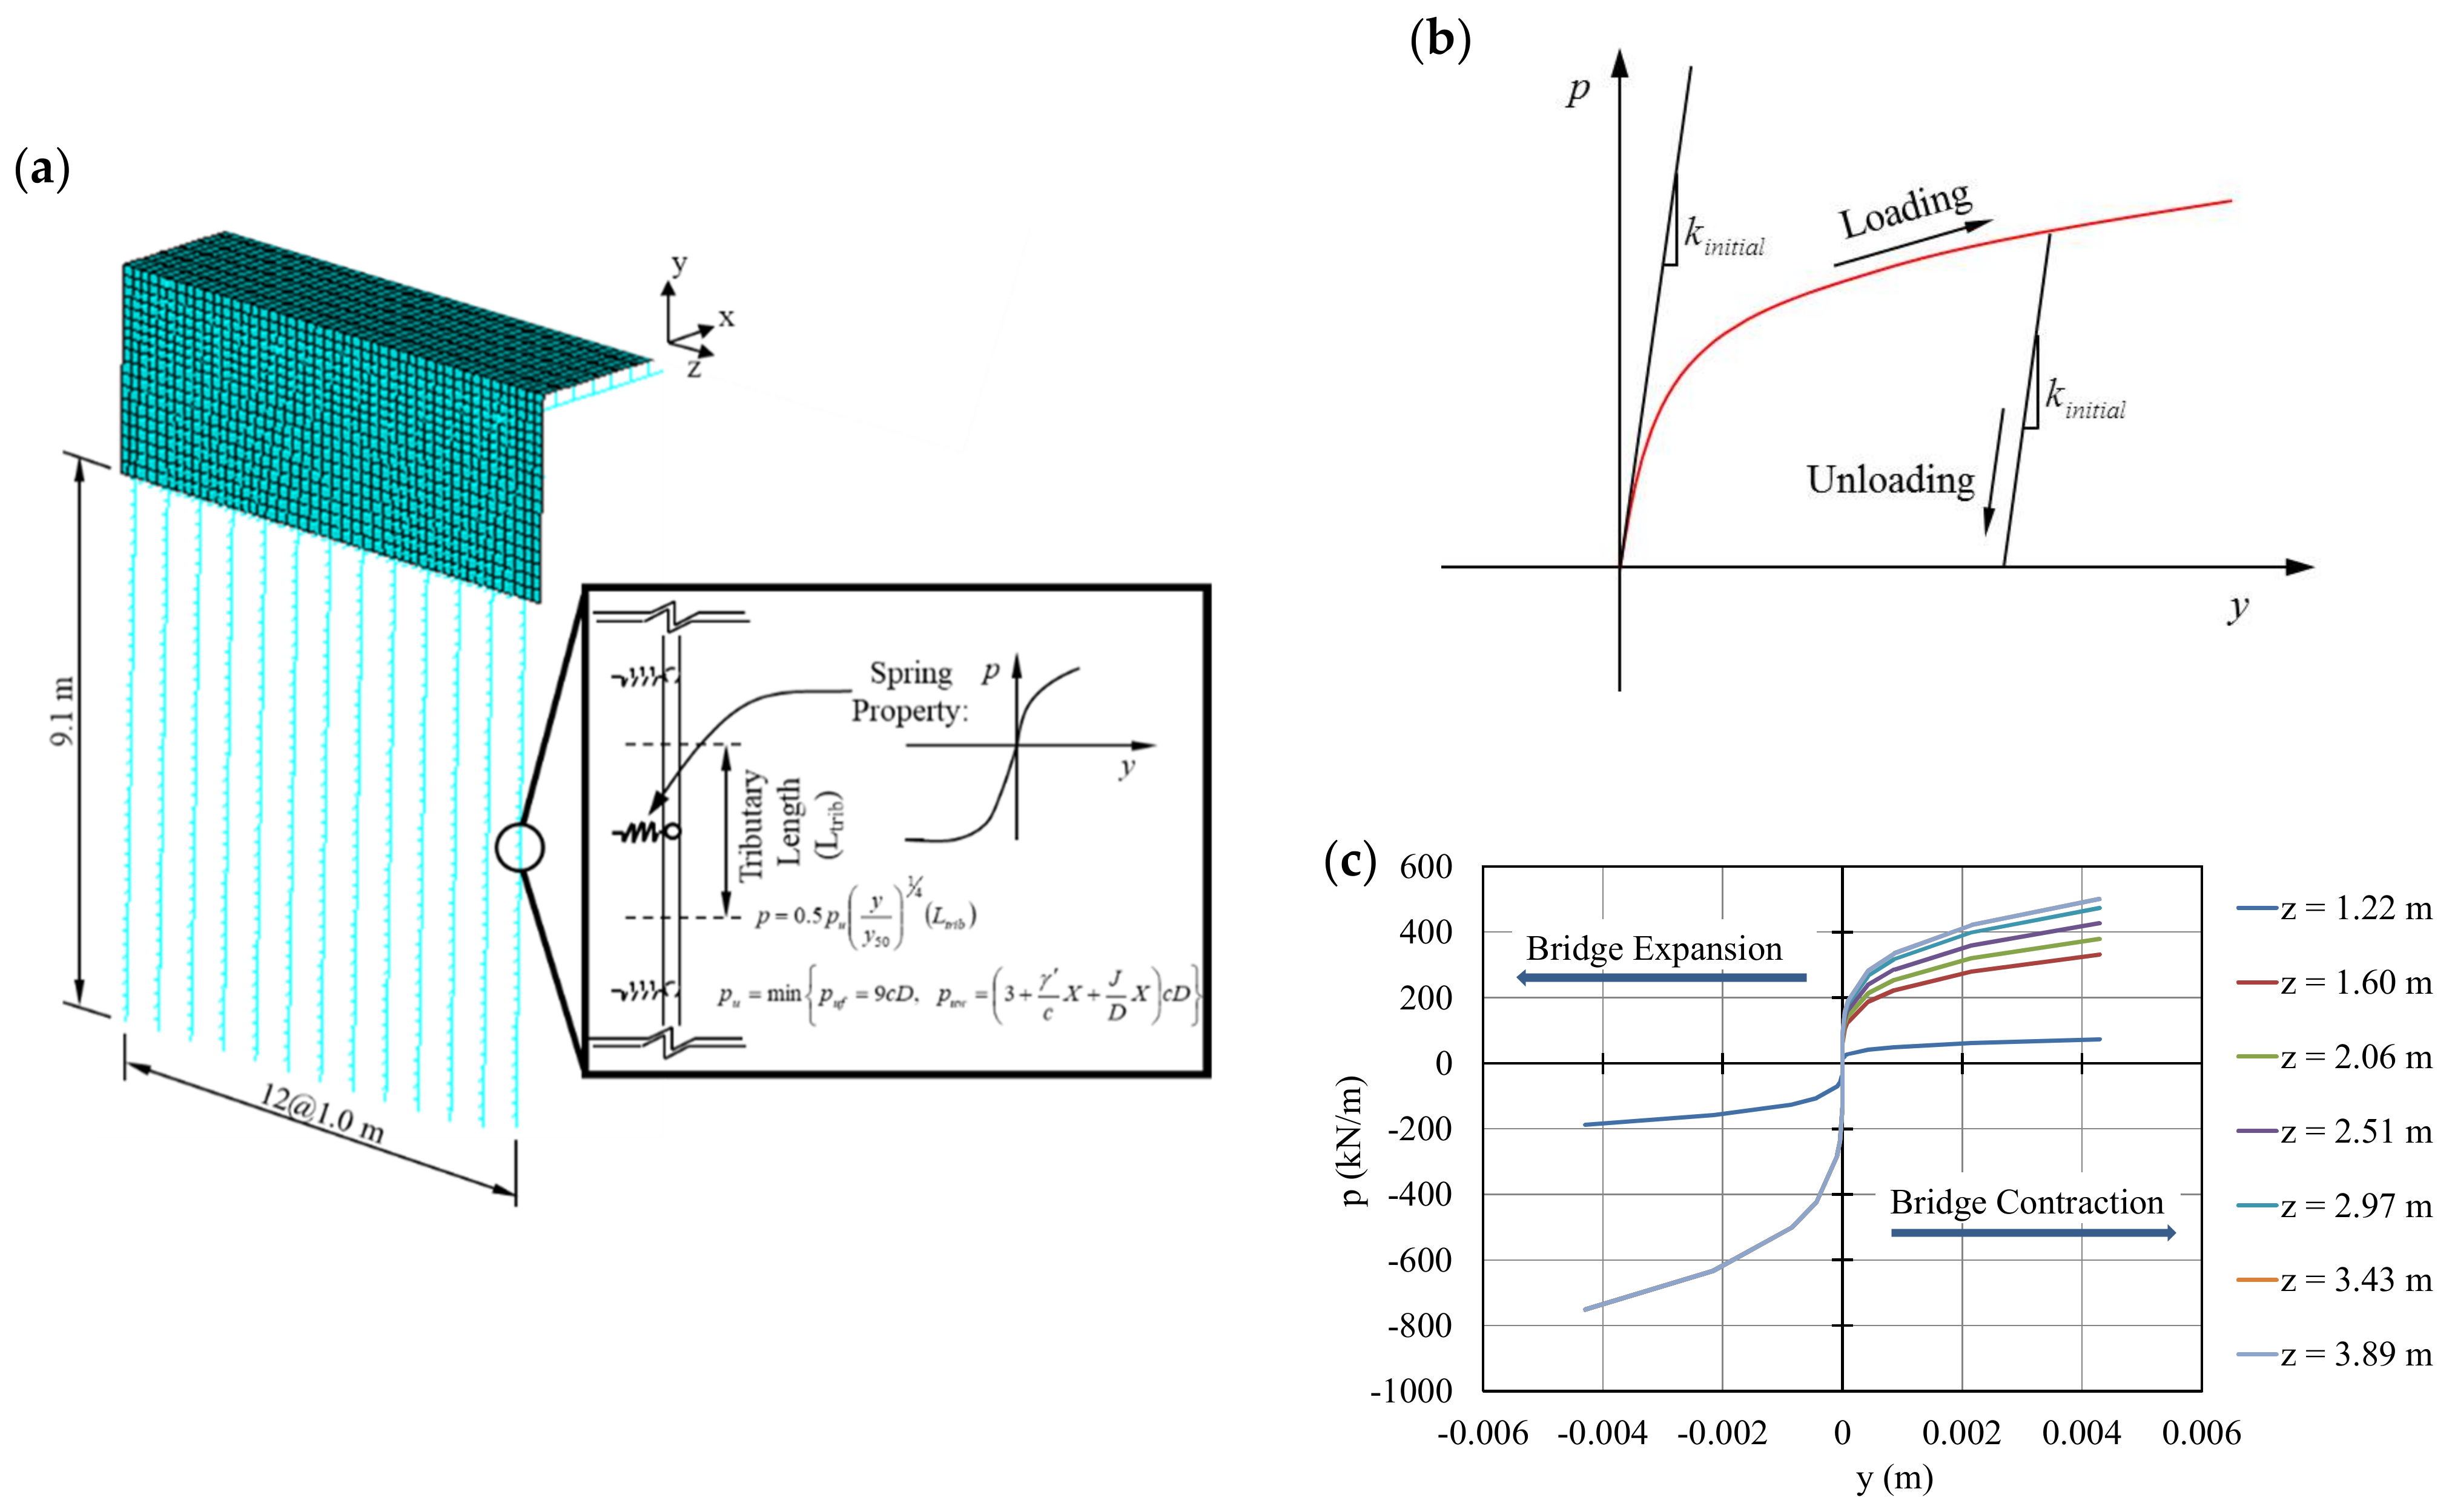
For soil–pile interaction, a family of Winkler springs based on the American Petroleum Institute (API) [
40] p-y curves was used, as presented in
Figure 7. Previous studies [
2,
11,
39] considered soil below abutment to model soil–pile interaction behavior. This study considered nonlinear hysteretic behavior of soil–pile interaction, as shown in
Figure 7b. Backfills behind the abutment are loaded on the soil surrounding the pile. Overburden pressure exerted by backfills increases the soil–pile stiffness against bridge expansion; therefore, the p-y curves for bridge expansion and contraction were different from each other, as presented in
Figure 7c. For p-y (force–displacement) curves to resist bridge contraction, only soils below the abutment were considered. Thus, varying p-y curves having different stiffnesses for bridge contraction and expansion were adopted in this study.
3.3. Abutment to Backwall Joint
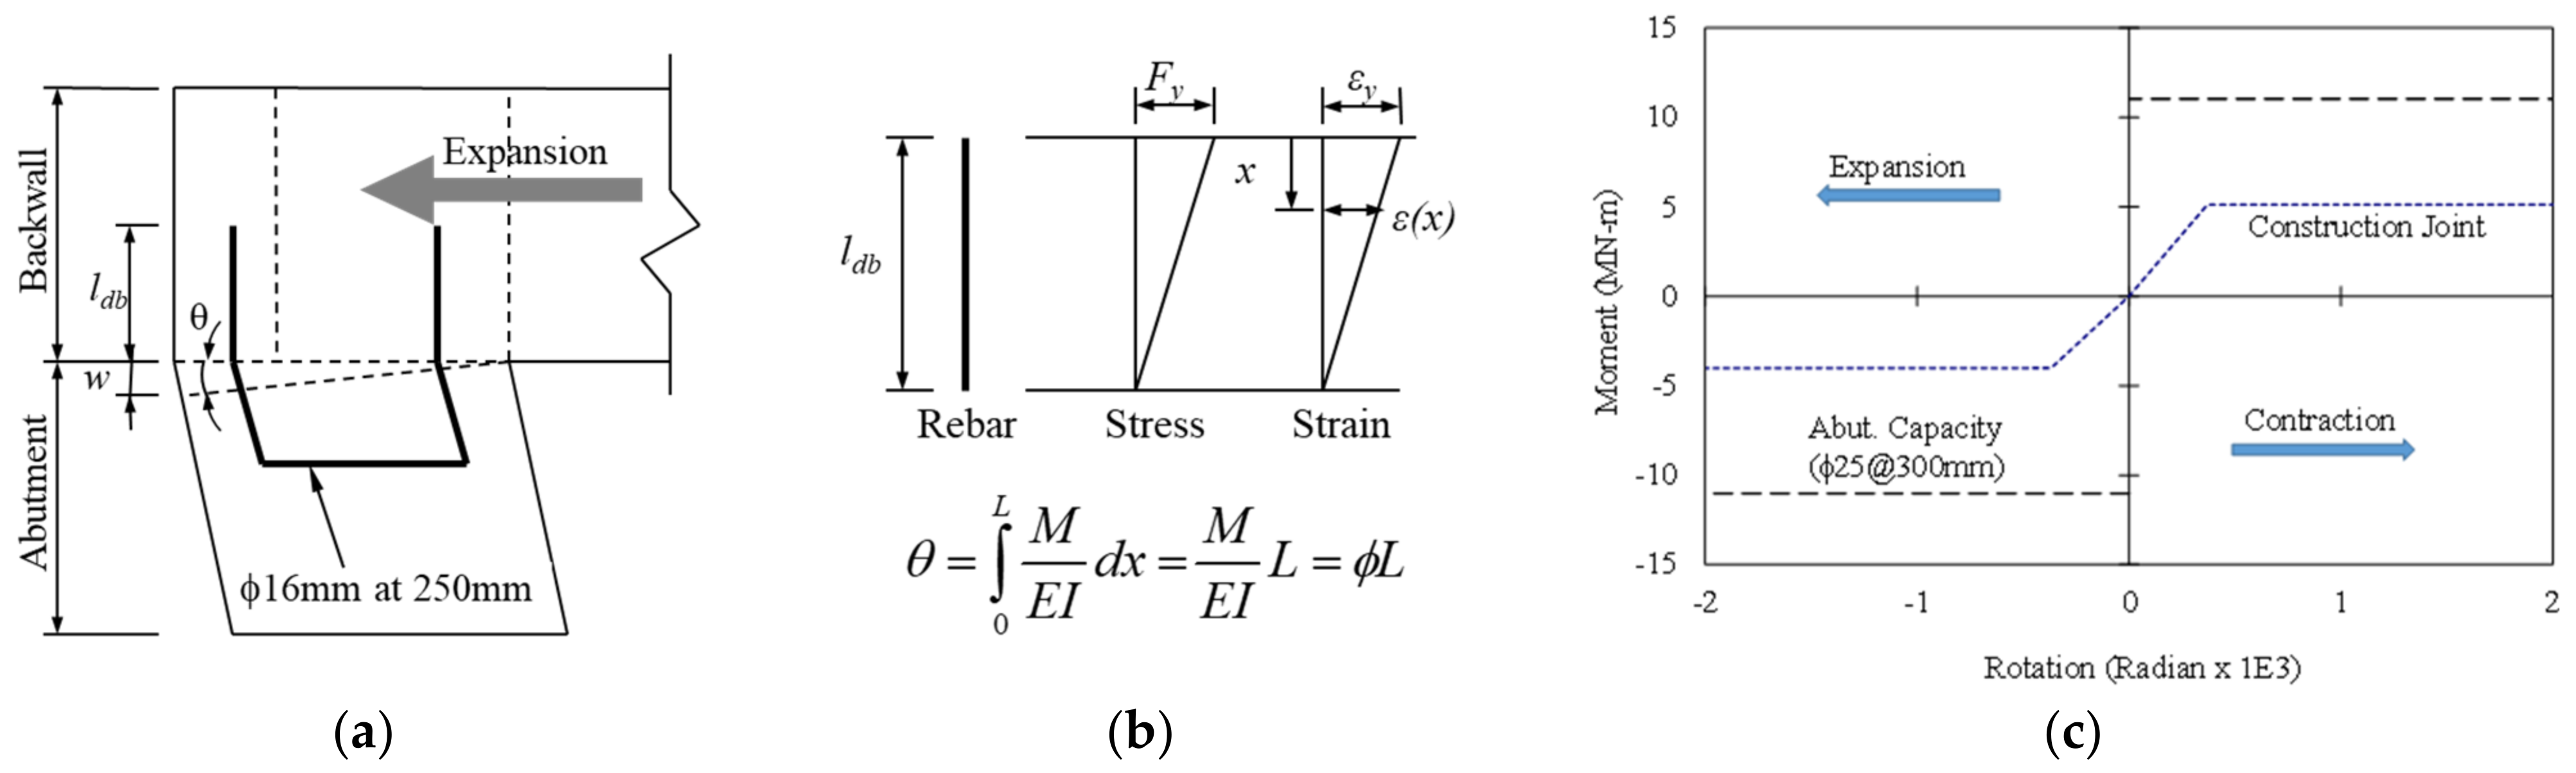
The abutment to backwall (AB) joint, depending on the construction, may deform significantly in the inelastic region in the case of large rotations; therefore, the AB joint was modeled based on #16 bars at 500 mm by including moment-rotation characteristics of this joint, as shown in
Figure 8. The moment-rotational property was developed based on the development length (
) of the reinforcement and assumption of linear strain distribution along the rebar. This reinforcement details are one of the most commonly used in the United States and other countries. The construction joint in the rear face of the abutment is opened during bridge expansion, as presented in
Figure 8a, and vice versa. The rotational angle corresponding to the given moment was calculated based on the AASHTO minimum embedment length, as shown in
Figure 8b. The rear face reinforcement area is larger than the front face because of the interference by girder seats and difference of yield moment capacities (
Figure 8c).
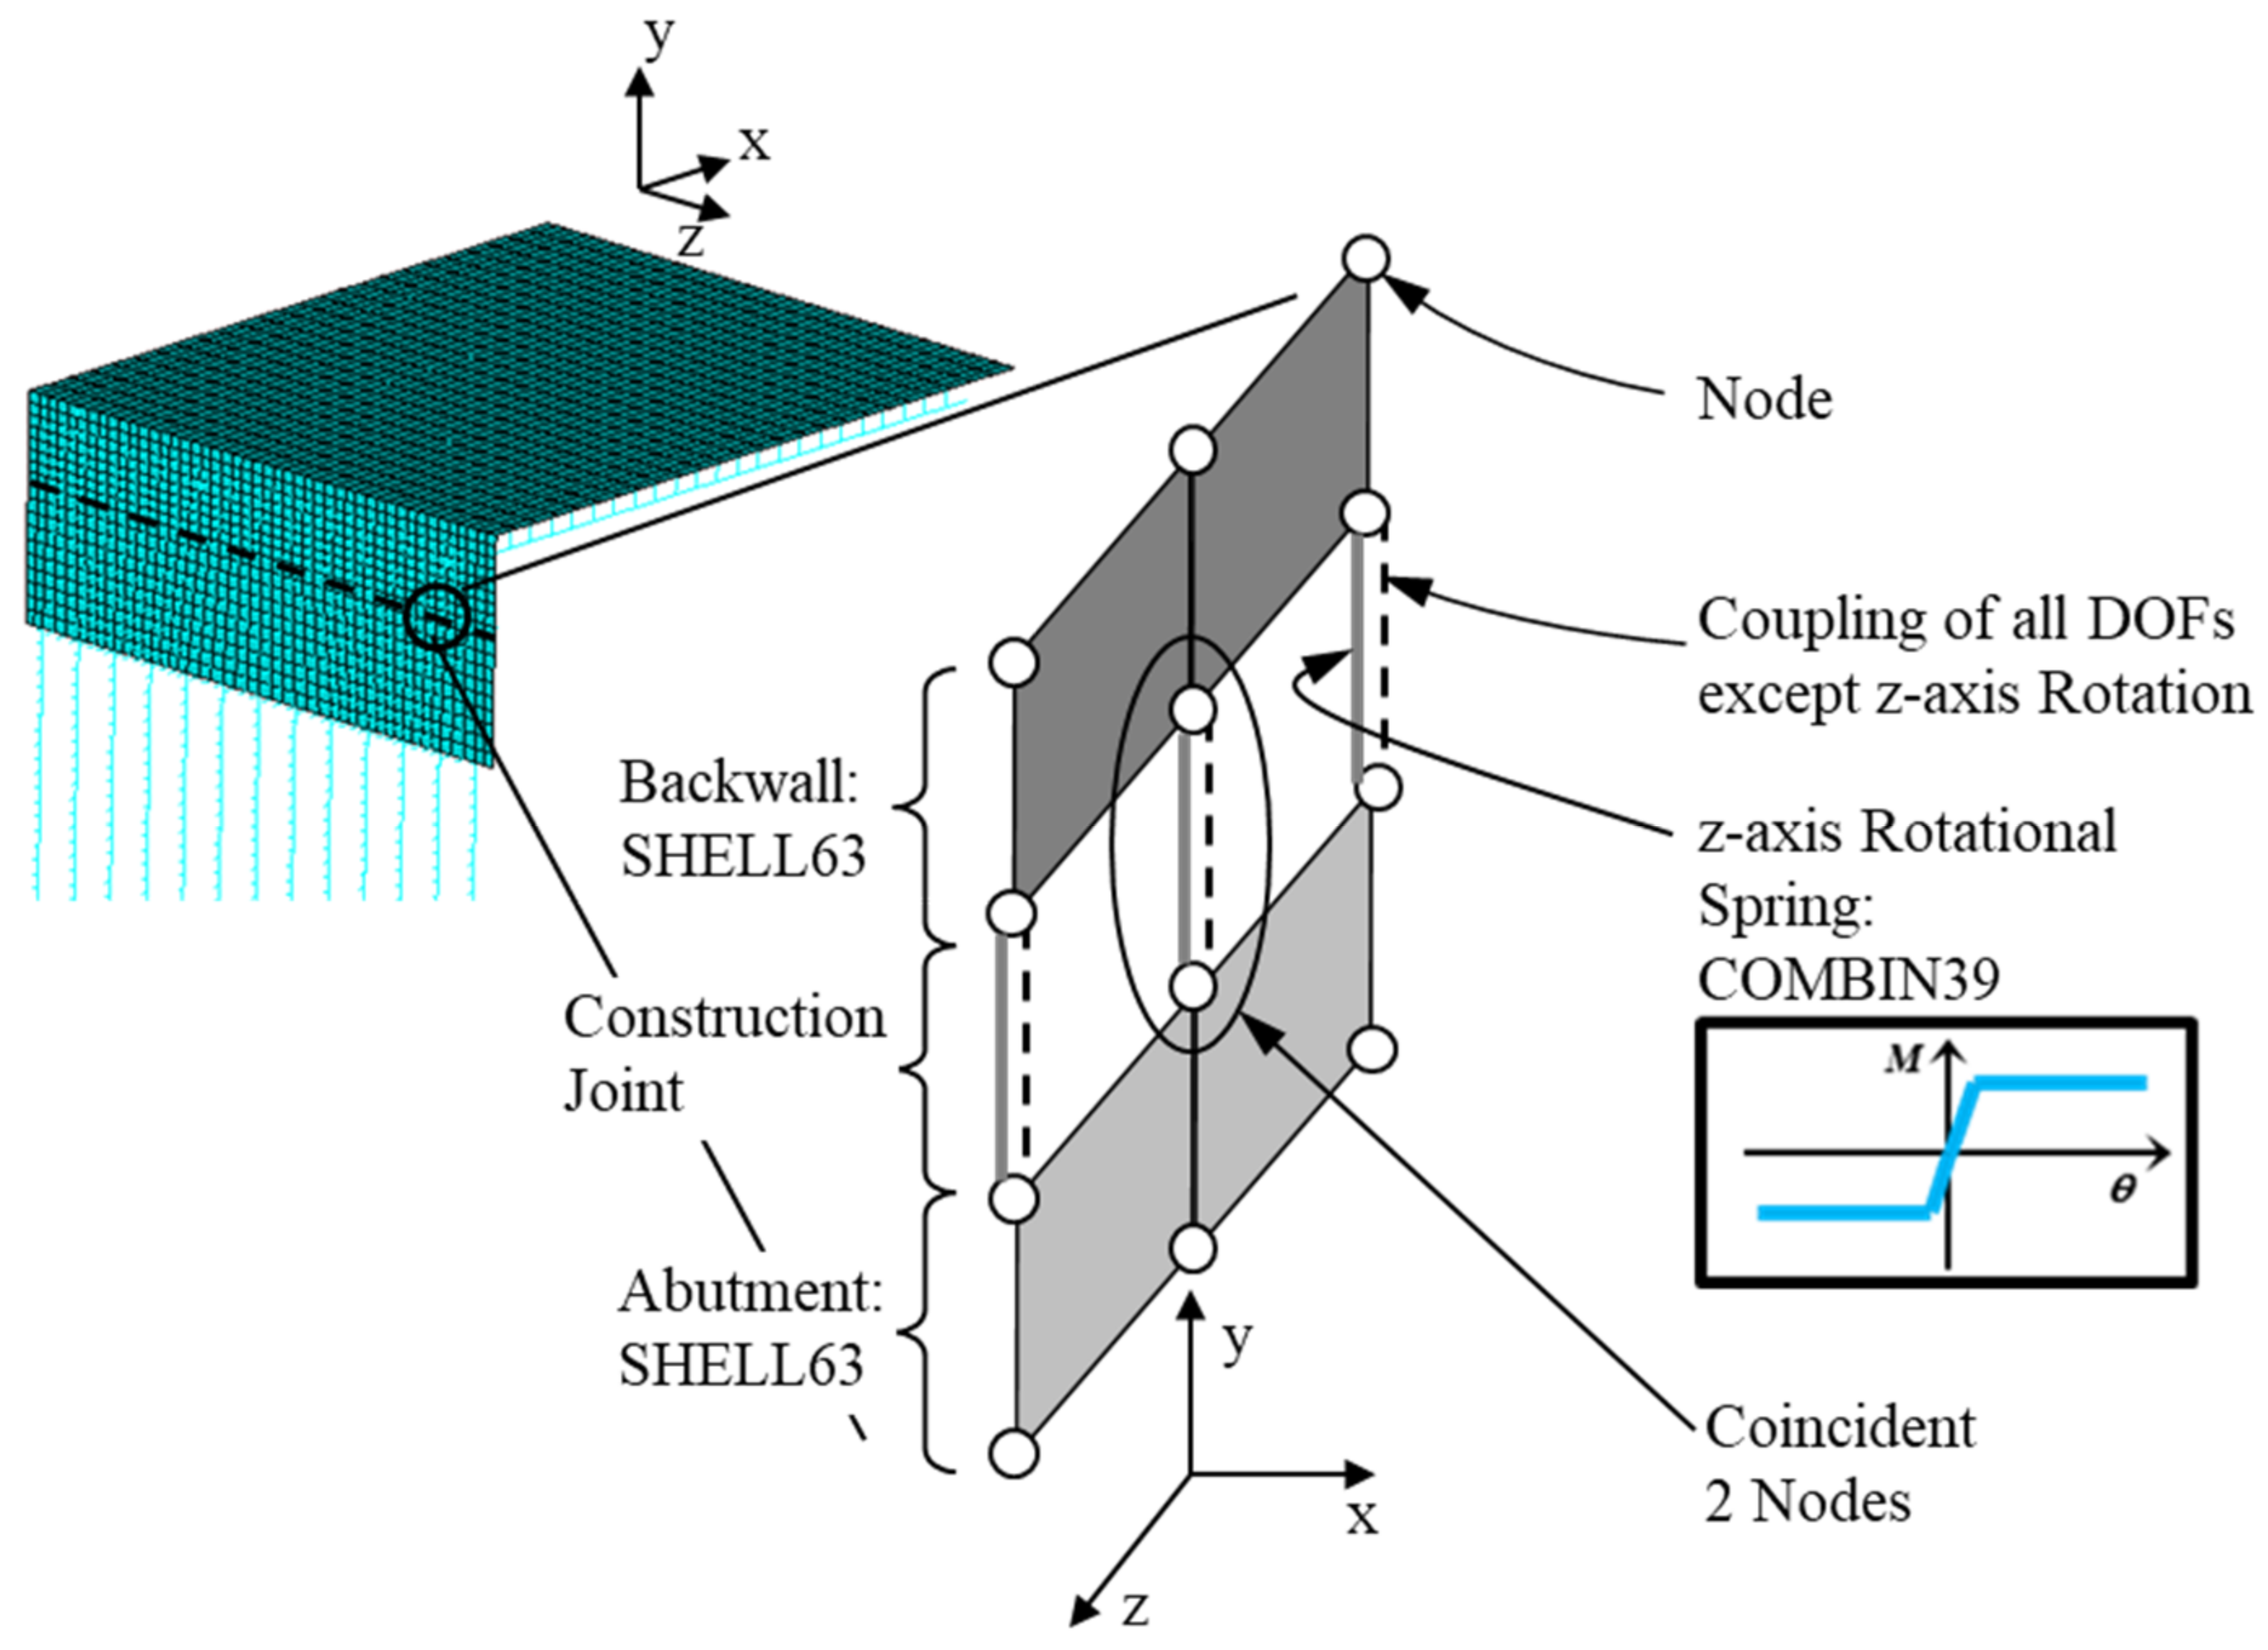
In the numerical model, nonlinear rotational spring elements (COMBIN39) were used to connect two coincident nodes from the backwall and abutment and the spring property was determined based on the tributary length in the z-axis direction, as presented in
Figure 9.
3.4. Time-Dependent Effects
Time-dependent effects are one of the dominant loads in the IABs [
43] and consist of concrete creep, shrinkage, and prestressing steel relaxation. This study adopted AASHTO’s recommended values for time-dependent effects, i.e., 1.4927 and 0.0004161 for creep and shrinkage coefficient for 100 years, respectively. These time-dependent effects were implemented using an equivalent temperature method by Ghali et al. [
44] and the age-adjusted effective modulus method (AEMM) from the PCI Bridge Manual [
45].
3.5. Uniform Temperature and Temperature Gradient
Temperature load is the most crucial factor to determine IAB response [
46,
47]. The two loading cases of extreme design temperature were applied to the numerical model in accordance with AASHTO LRFD [
25]; an extreme temperature rise equal to +16.7 °C and a fall equal to −22.2 °C. To obtain the maximum contraction response, concrete time-dependent effects were included with the thermal effects. For the expansion case, only thermal effects were considered because the bridge expansion response is the opposite of the concrete time-dependent effects.
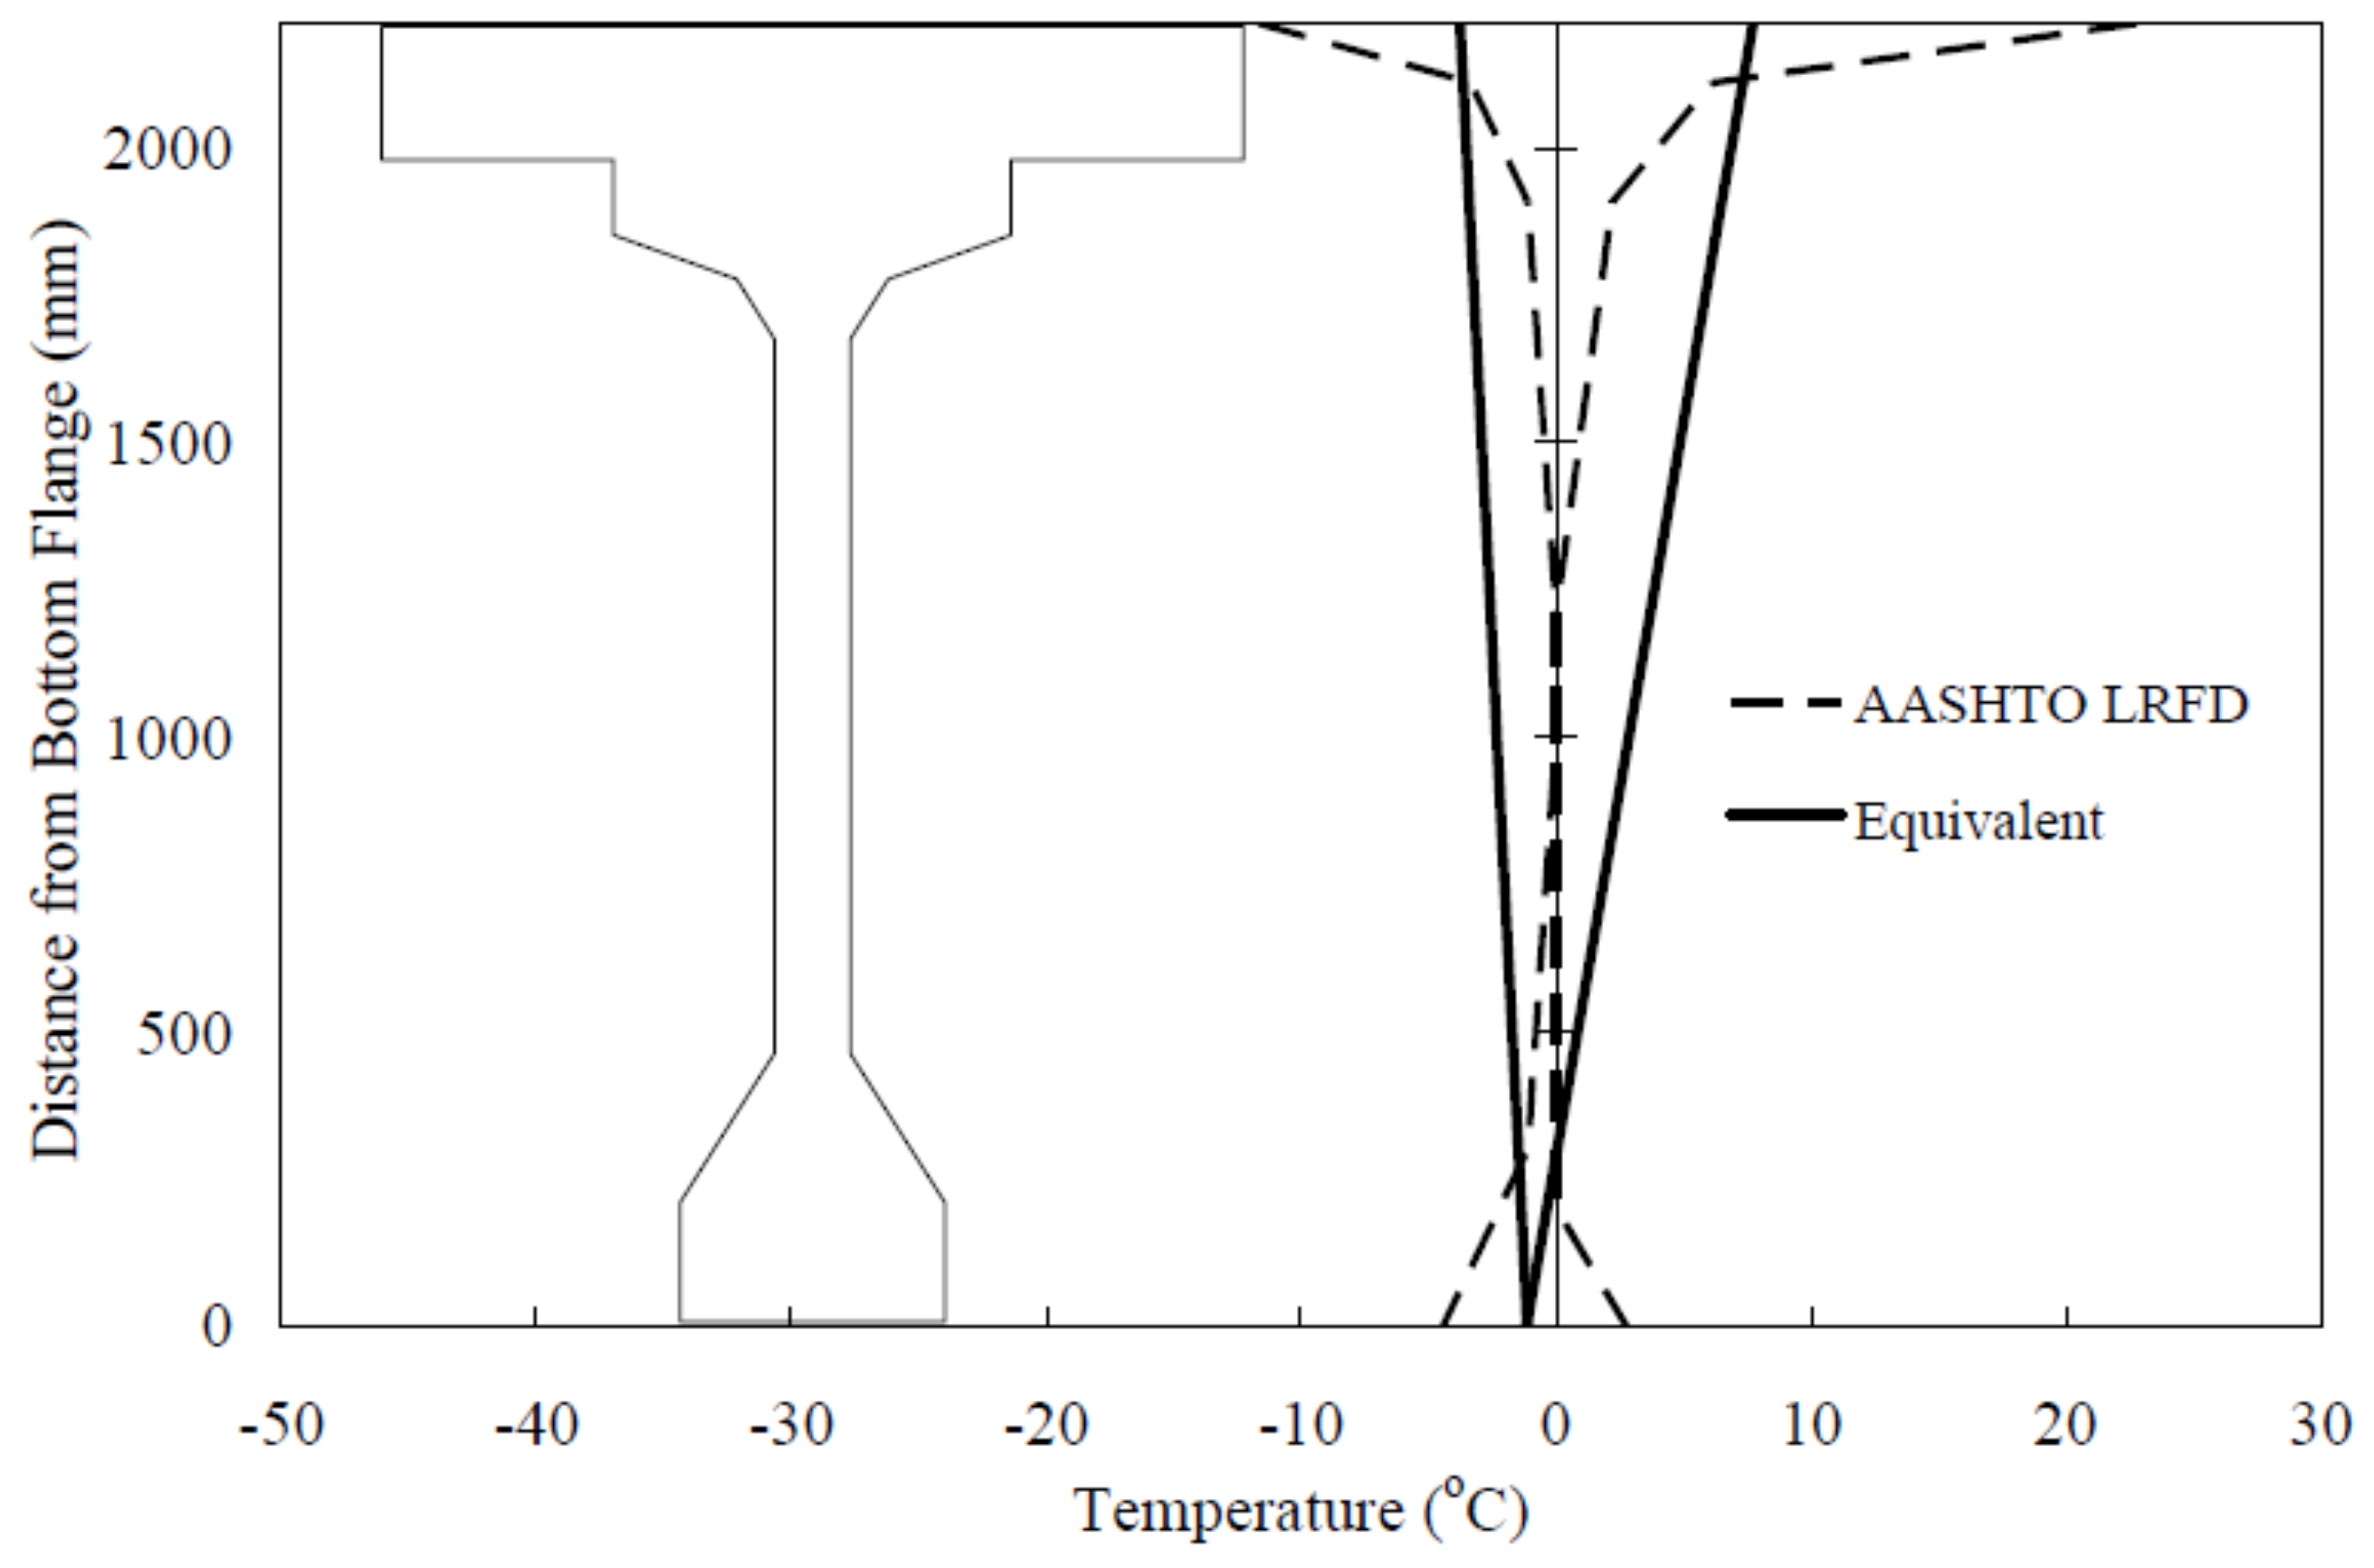
Temperature distribution along the girder depth is nonlinear because of the complex girder-deck section and the low thermal conductivity. AASHTO LRFD [
25] provides multi-linear temperature gradient profiles for concrete and steel girders as shown in
Figure 10. Because of modeling limitations, the temperature gradient of the superstructure is modeled as an equivalent linear variation along the depth to represent the complex variation, as recommended by AASHTO LRFD [
25]. An equivalent linear thermal gradient model was computed based on the concept of an equal axial force and moment. A detailed description can be found in Kim and Laman [
28].
4. Bridge Response Results
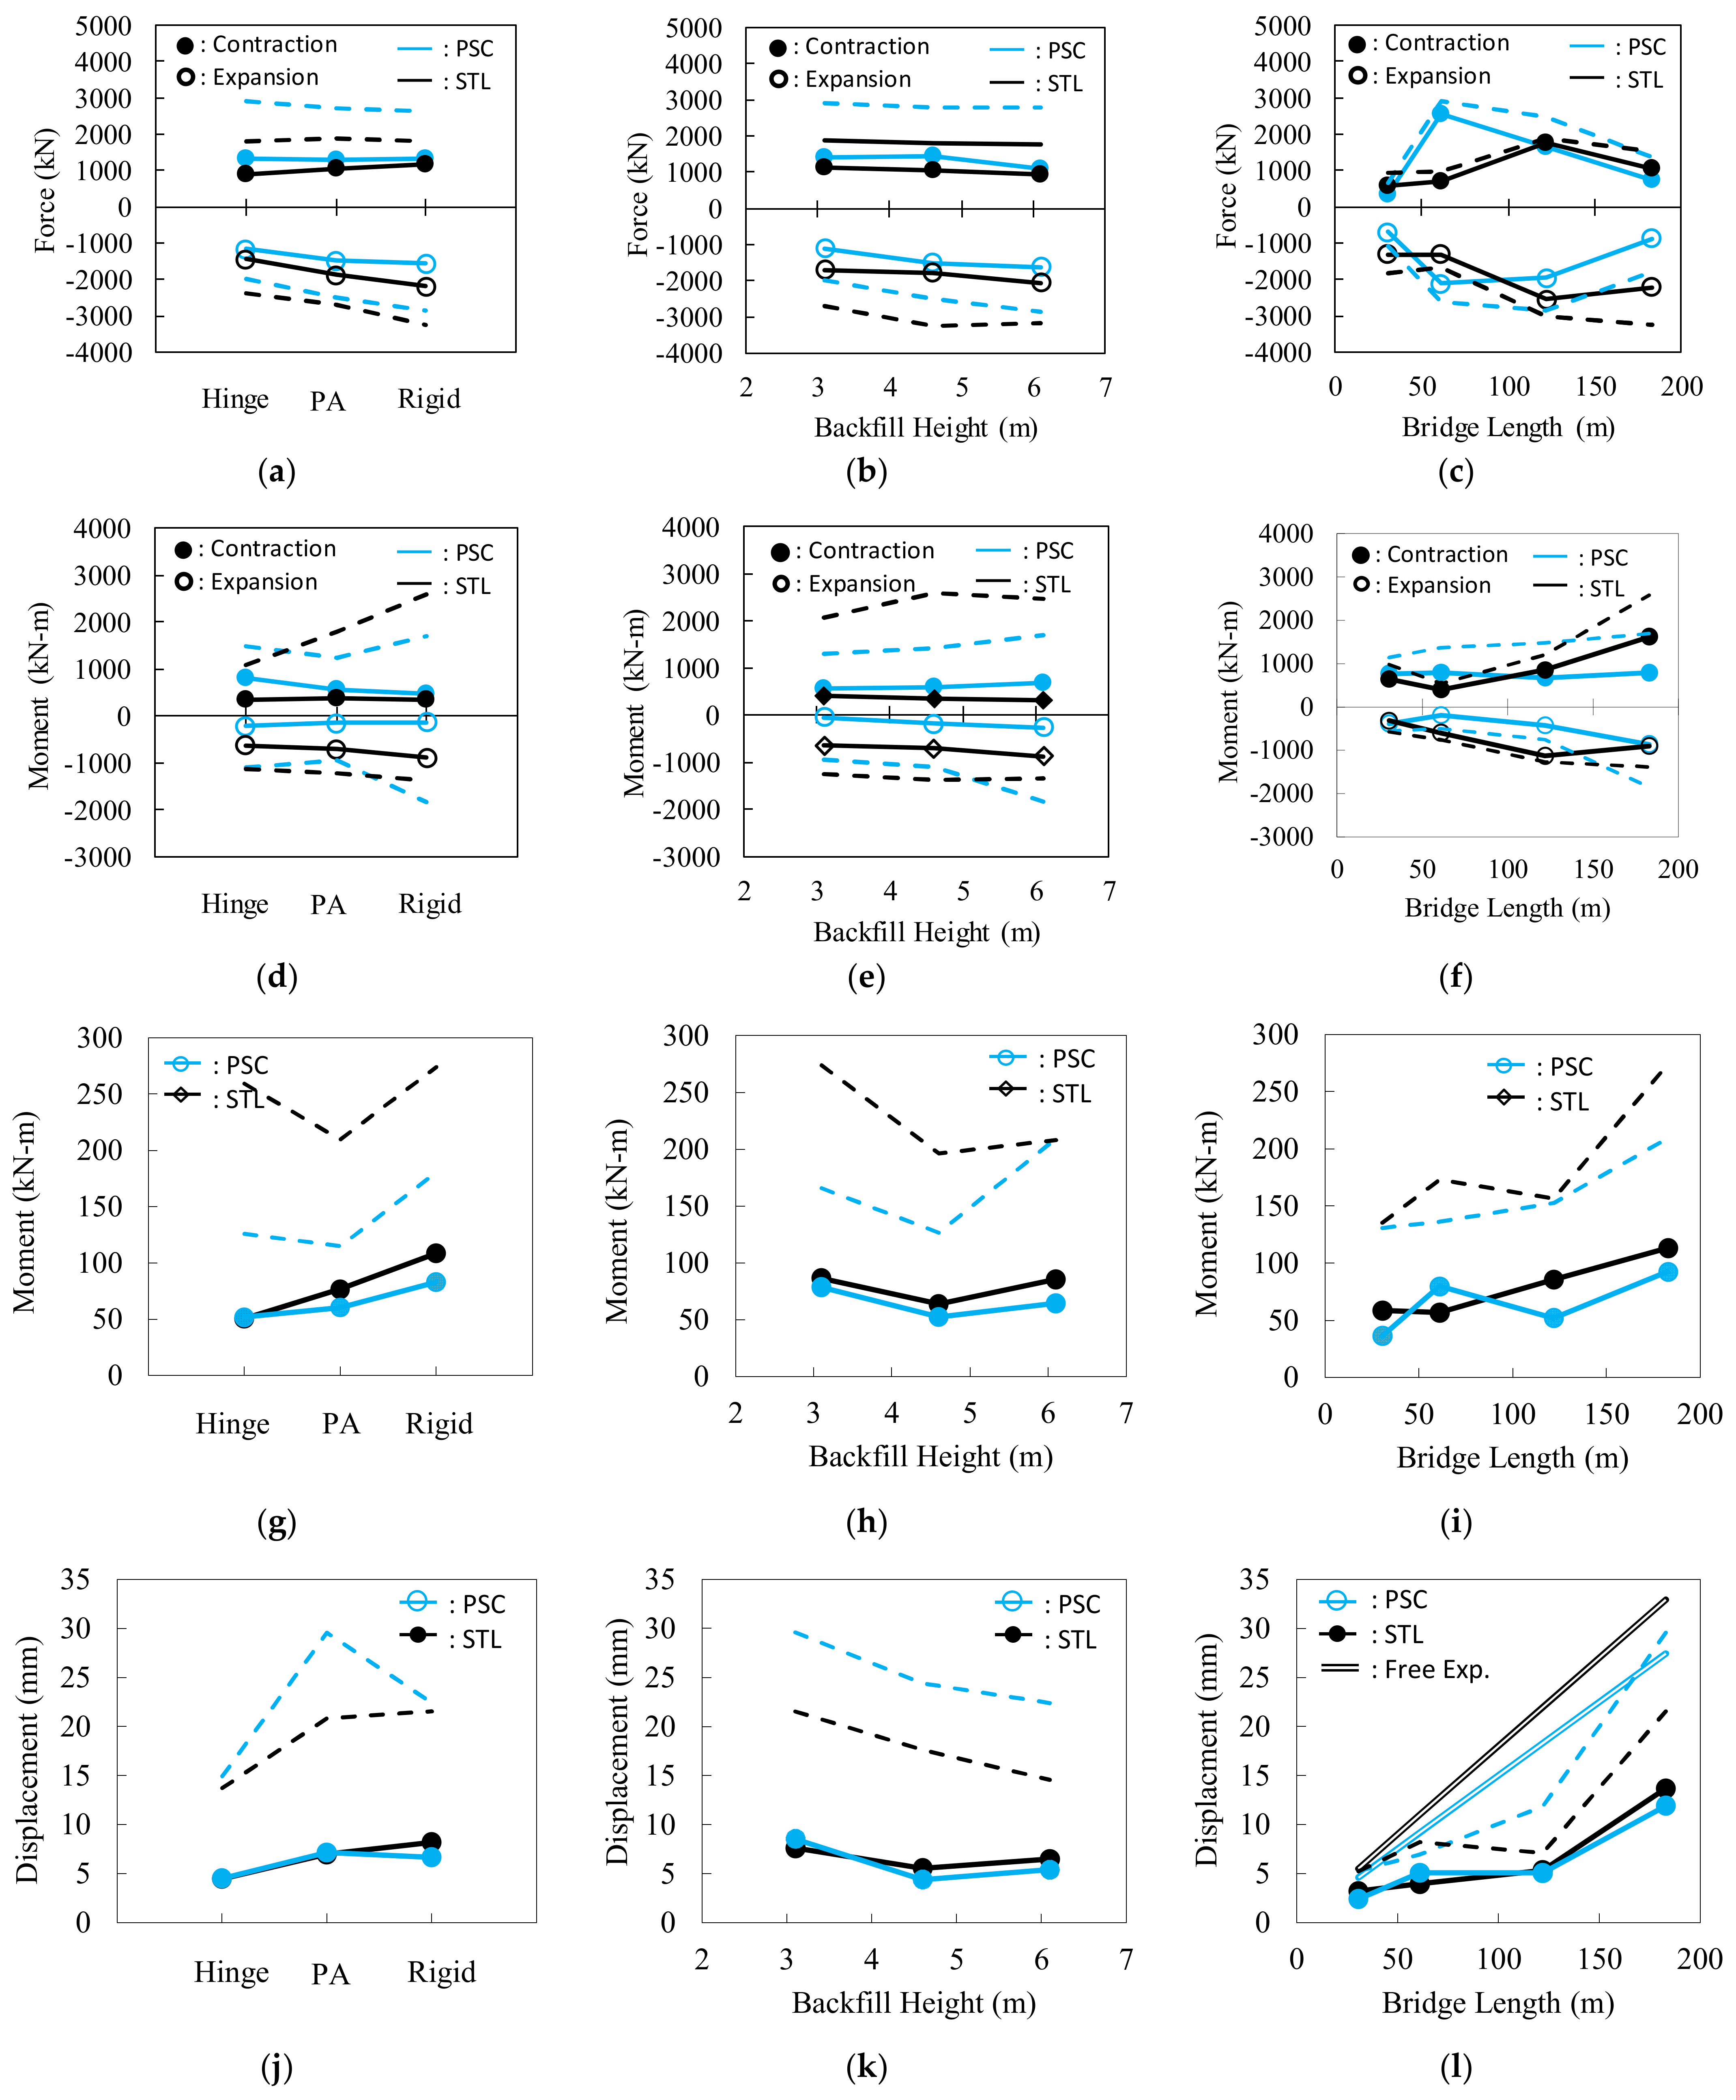
Bridge response parameters of (1) girder axial force, (2) girder bending moment, (3) pile moment, and (4) pile head displacement for all 72 studied cases were investigated with respect to each selected parameter for steel (STL, black line) and PSC (light blue line) girder IABs, as shown in
Figure 11. The following factors: (1) AB (abutment to backwall) joint stiffness, (2) backfill height (
H), and (3) bridge length (
L) were used to evaluate the bridge response parameters. The averaged bridge response parameters of corresponding cases were represented as solid lines and the envelopes of the upper and lower bounds were represented as dashed lines. Although much IAB research has been performed, bridge length and backfill height effects considering AB joint stiffness have not been investigated. Thus, this study provides extensive parametric results to identify IAB behavior with respect to the four considered parameters.
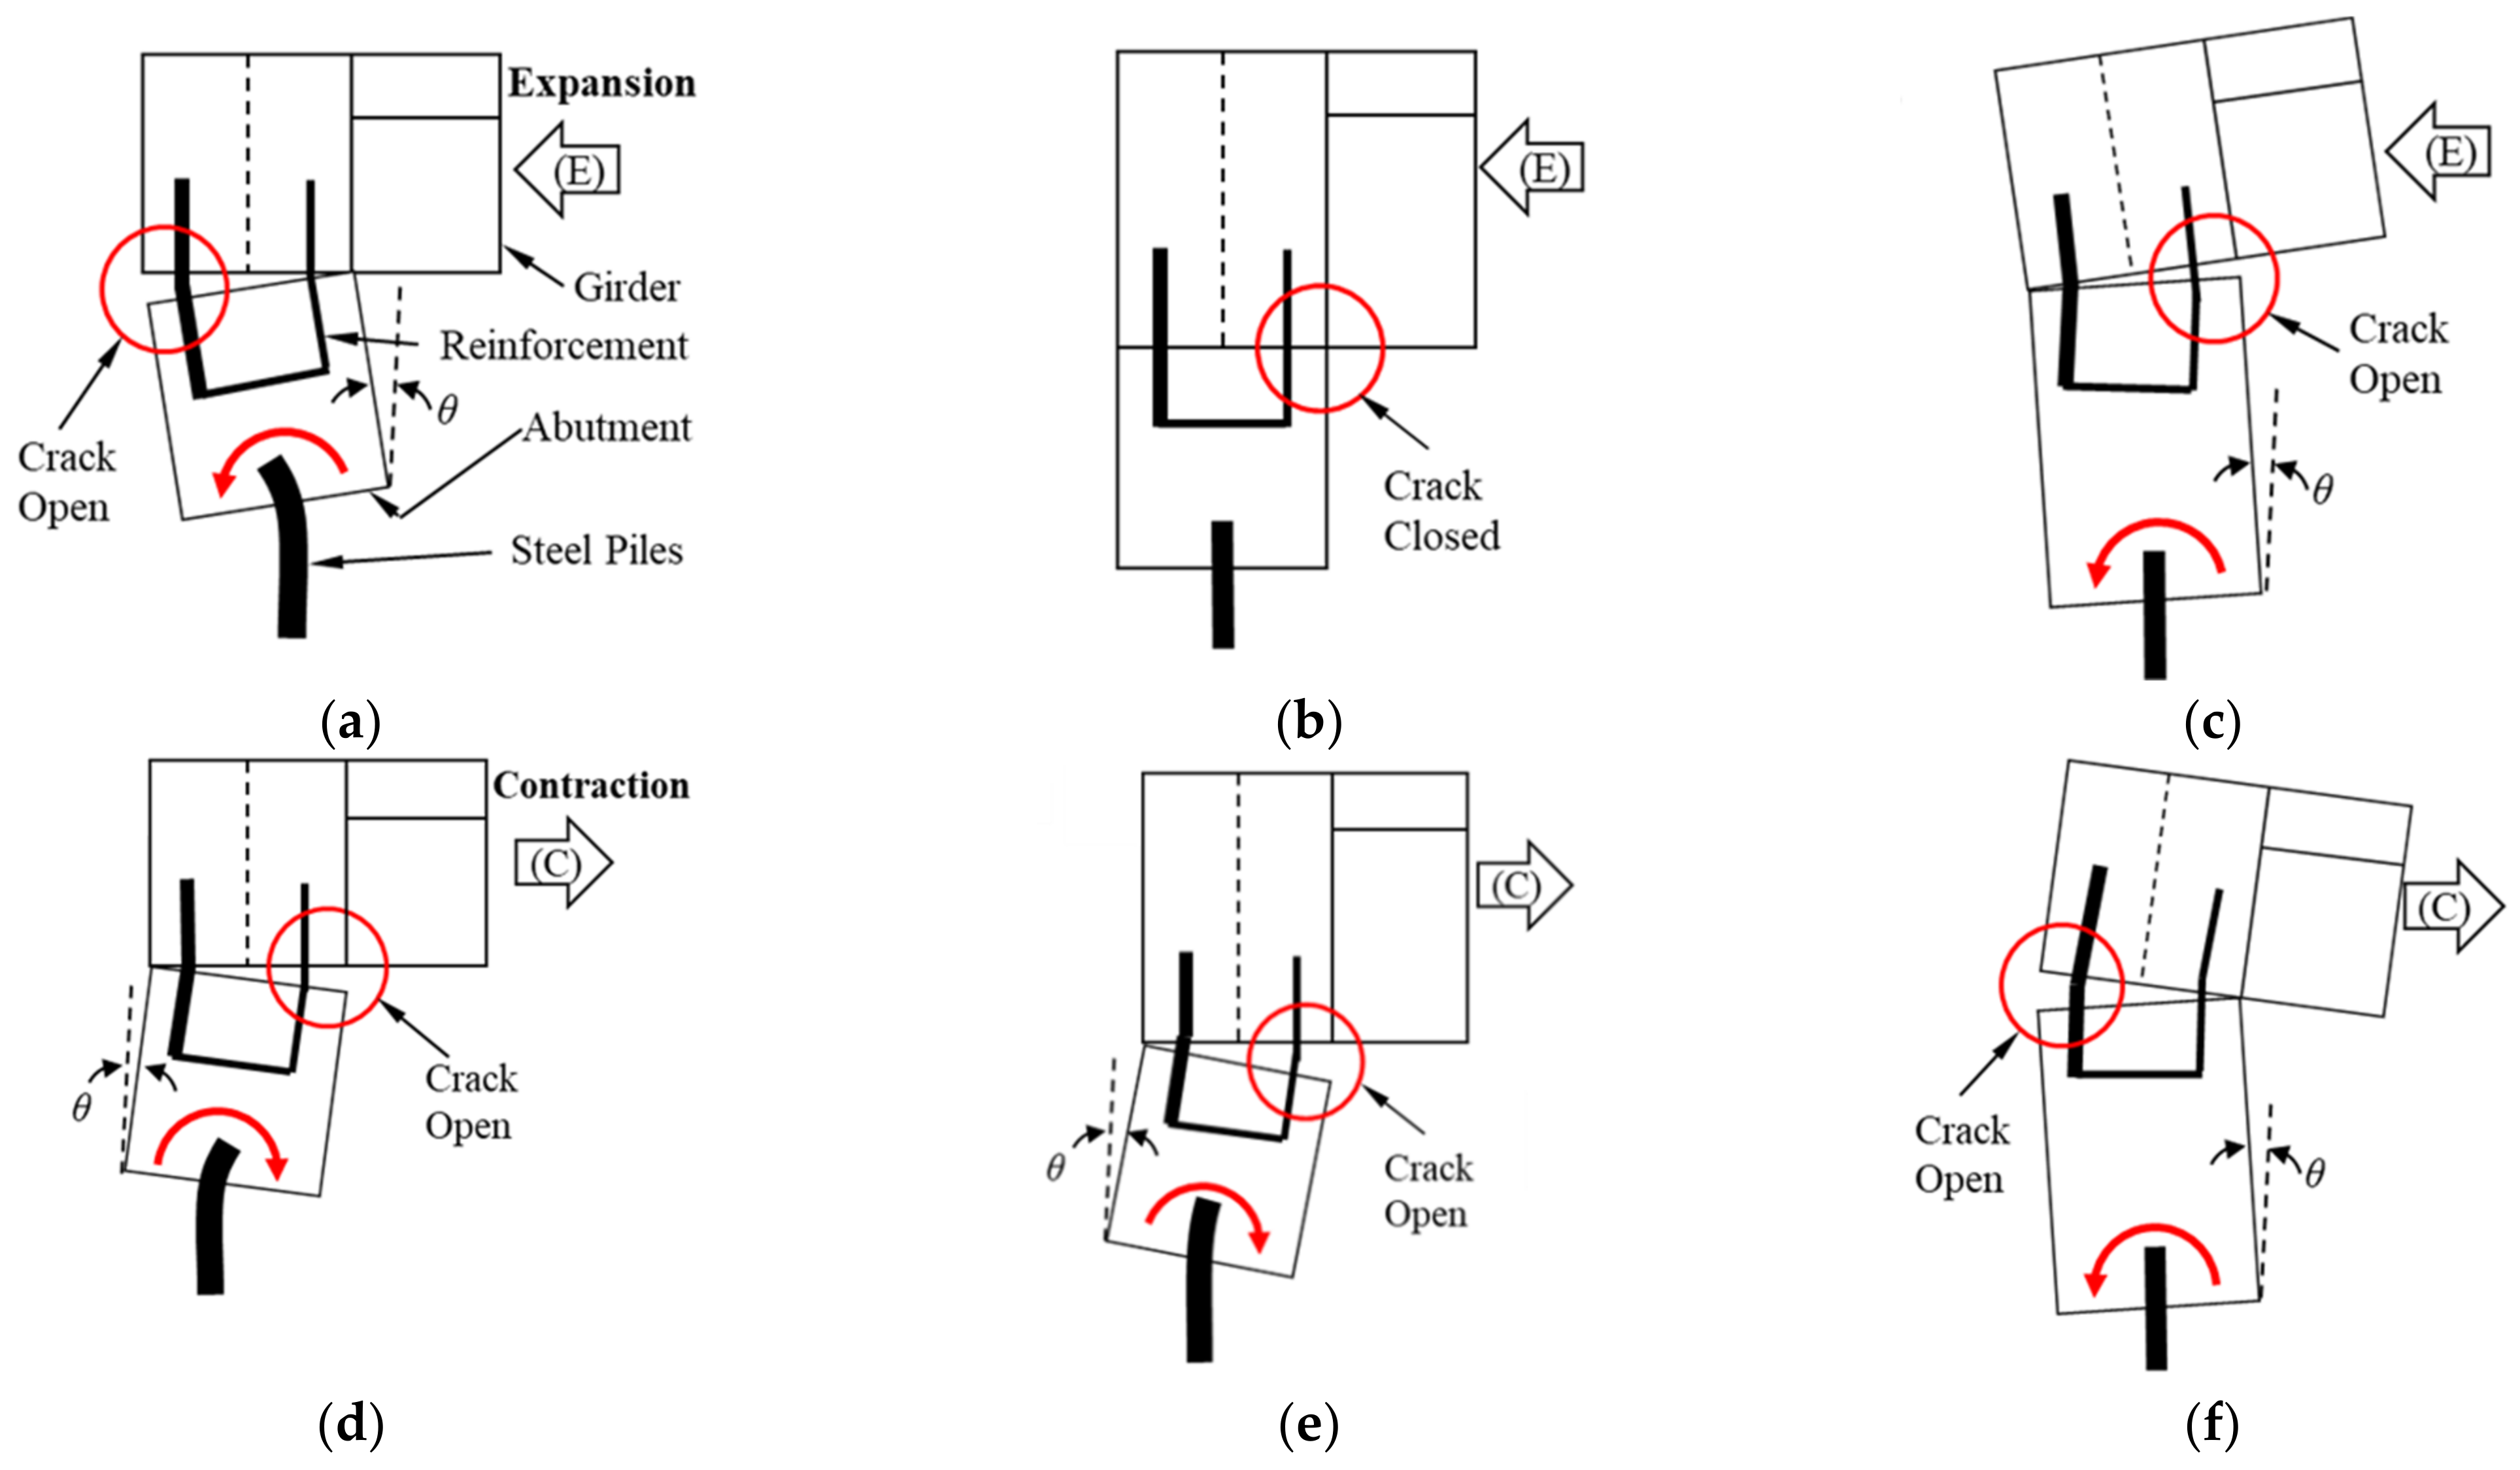
Typical IAB behaviors need to be understood to correctly interpret the analysis results. As presented in
Figure 12, IABs expand and contract owing to thermal loading. During this thermal movement, the AB joint allows a differential rotation and crack opens if it is not fully rigid. However, it should be noted that the abutment rotation is related to the resistance of the substructure (backfill and piles) and the capacity of the superstructure movement. If a typical bridge with short girders and short (stub-type) abutments is considered, construction joints on the rear face of the abutment open during bridge expansion; see
Figure 12a,d. However, the opposite IAB behaviors can happen if the superstructure moment is large enough owing to thermal movement or temperature gradient, such as for longer and deeper girders with a higher abutment, as presented in
Figure 12c,f. If the concrete girder bridge is long enough, initial time-dependent effects pulling the abutment toward the bridge are significant and the crack on the rear face may not open (
Figure 12b,e).
4.1. Girder Axial Force
Girder axial force with respect to AB joint stiffness, backfill height, and bridge length is presented in
Figure 11a,c. Both tensile and compressive axial forces of steel (STL) and PSC girders were significantly affected by the following factors, in order of importance: bridge length > AB joint stiffness > backfill height.
Bridge length significantly influenced girder axial forces. Steel (STL) and PSC girders exhibited clear differences in response to the bridge length parameter, but showed similar responses for AB joint stiffness and backfill height. Bridge length influence on girder axial force exhibited a highly nonlinear trend. Bridge length and girder material determine the amount of bridge thermal movement. Thus, bridge length is highly correlated to the girder axial force. However, owing to the nonlinear boundaries provided by backfills and supporting piles, girder axial forces were not linearly proportional to bridge length, but tended to increase as bridge length increased. During bridge contraction, girder tensile axial forces of 61.0, 121.9, and 182.9 m PSC and steel IABs varied 7.5, 4.8, and 2.2 times higher and 1.2, 3.0, and 1.8 times higher than those of the 30.5 m bridge, respectively. During bridge expansion, girder compressive axial forces of 61.0, 121.9, and 182.9 m PSC and steel IABs varied 3.1, 2.8, and 1.3 times higher and 1.1, 2.0, and 1.7 times higher than those of the 30.5 m bridge, respectively. Once a bridge expands, the nonlinear boundaries may yield at a certain point, and then the bridge expands easily and girder axial forces decrease. Although a steel girder has a larger thermal expansion coefficient, PSC girder IABs, owing to time-dependent effects, exhibited earlier yielding at L = 61.0 m, while steel girder IABs yielded at L = 121.9 m. Both axial forces of steel and PSC girder IABs increased up to the yielding of soil boundaries and then decreased as bridge length increased.
AB (abutment to backwall) joint stiffness significantly influenced compressive girder axial forces. Compressive girder axial forces showed a tendency to increase as AB joint stiffness increased. As AB joints and backfill height become stiffer and higher, the compressive girder axial forces increased. This is because stiffer AB joints induce the abutment to displace by longitudinal translation rather than rotation, which results in larger backfill resistance. Abutment translation is resisted by the full backfill height, while abutment rotation is resisted by the top portion of the backfill. This trend was clear in steel girder IABs because PSC girders had time-dependent effects. However, tensile forces were not significantly influenced by AB joint stiffness because bridge contraction is mainly related to pile rotational stiffness, which is constant in this study. During bridge expansion, girder compressive axial forces of PSC and steel IABs with PA (Pennsylvania) standard and rigid AB joint varied 1.2 and 1.3 times higher and 1.3 and 1.5 times higher than those of IABs with hinged AB joint, respectively. During bridge contraction, girder compressive axial forces of steel IABs with PA standard and rigid AB joint varied 1.1 and 1.3 times higher than those of IABs with hinged AB joint, respectively, while PSC IABs produced similar girder tensile forces regardless of AB joint stiffness.
Backfill height influenced compressive axial forces as the AB joint became stiffer. All girder moments showed tendencies to increase as backfill height increased. This is because increasing backfill height increases backfill passive pressure. During bridge expansion, girder compressive axial forces of PSC and steel IABs with 4.6 and 6.1 m backfill height varied 1.4 and 1.5 times higher and 1.05 and 1.2 times higher than those of IABs with 3.1 m backfill height, respectively.
Although longer bridge cases resulted in lower girder axial forces, the largest girder axial forces occurring in the shorter bridges than the given bridge should be considered in bridge design: longer bridges are expected to experience the largest compressive girder axial forces during expansion and girder axial forces were relieved after soil yielding. To reduce compressive girder axial forces, bridge designers should consider using lower backfill height and flexible AB joint stiffness.
4.2. Girder Moment
Girder moments with respect to AB joint stiffness, backfill height, and bridge length are presented in
Figure 11d,f. Positive and negative maximum moments collected at any point produce the maximum throughout the bridge. During bridge contraction, most of the positive and negative maximum moments occurred at the midspan and the abutment, respectively. During bridge expansion, most of the positive and negative maximum moments occurred at the abutment and the midspan, respectively. Both positive and negative moments of steel (STL) and PSC girders were significantly affected by the following factors, in order of importance: bridge length > AB joint stiffness > backfill height.
The bridge length parameter significantly influenced girder moments. Both positive and negative maximum moments of steel and PSC girder IABs tended to increase as bridge length increased. Owing to time-dependent effects, PSC girders produced relatively smaller negative moments than did steel girders. The maximum positive and negative girder moments of 61.0, 121.9, and 182.9 m steel IABs varied 0.6, 1.3, and 2.5 times and 1.9, 3.6, and 2.9 times compared with those of the 30.5 m bridge, respectively. The maximum positive and negative girder moments of 61.0, 121.9, and 182.9 m PSC IABs varied 1.03, 0.9, and 1.03 times and 0.5, 1.1, and 2.2 times compared with those of the 30.5 m bridge, respectively.
AB joint stiffness significantly influenced girder moments. Girder moments in steel girder IABs increased as AB joint stiffness increased, while those in PSC girder IABs decreased as AB joint stiffness increased. Positive and negative girder moments of steel girder IABs with PA standard and rigid AB joints varied 1.07 and 1.03 times higher and 1.12 and 1.41 times higher than those of IAB with hinged AB joint. However, positive and negative girder moments of PSC girder IABs with PA standard and rigid AB joints varied 0.69 and 0.57 times and 0.75 and 0.64 times less than those of IAB with hinged AB joint. Thus, hinged and rigid AB joints would reduce girder moments for steel and PSC girder IABs, respectively.
Backfill height influenced both positive and negative girder moments in steel and PSC girder IABs. Especially, negative girder moments were significantly influenced. All girder moments except the positive moment in steel girder IABs showed tendencies to increase as backfill height increased. Positive and negative PSC girder moments in 4.6 and 6.1 m high backfill increased 1.04 and 1.21 times higher and 3.95 and 5.52 times higher than those in 3.1 m high backfill. Negative steel girder moments in 4.6 and 6.1 m high backfill increased 1.09 and 1.35 times higher than those in 3.1 m backfill, while positive steel girder moments decreased 0.90 and 0.82 times.
Based on the girder moment investigation, rigid AB joint, lower backfill height, and shorter bridge length reduce the PSC girder moment. Hinged AB joint, lower backfill height, and shorter bridge length reduce the steel girder moment.
4.3. Pile Moment
Absolute pile moments as a function of AB joint stiffness, backfill height, and bridge length under bridge contraction and expansion are presented in
Figure 11g,i. All pile moments were within the plastic moment φM
plastic = 263 kN-m of an HP310 × 110; however, φM
yielding = 172 kN-m was exceeded in some cases. In this study, elastic beam elements were used in FE models because actual bridge piles may be designed for thermal movement and most of them are intended to remain within the elastic range.
Pile moment was significantly affected by AB joint stiffness, bridge length, and backfill height, and increased as AB joint stiffness and bridge length increased. The relationship between pile moment and backfill height was not proportional. Steel (STL) girder IABs tended to produce a larger pile moment than did PSC girder IABs. Pile moments of steel and PSC girders were significantly affected by the following factors, in order of importance: AB joint stiffness > bridge length > backfill height.
Bridge length significantly influenced the pile moment. It is believed that the amount of abutment displacement is mostly determined by bridge length. Pile moments in 61.0, 121.9, and 182.9 m steel and PSC girder IABs varied 0.97, 1.46, and 1.93 times and 2.18, 1.42, and 2.53 times higher than those in 30.5 m long IABs.
AB joint stiffness significantly influenced the pile moment. AB joint stiffness is important to predict the pile moment because the moment induced by bridge thermal movement is transferred to the abutment through the AB joint. As the AB joint stiffness increased, it is expected the superstructure moment is fully transferred to the pile head. Pile moments in steel girder IABs with PA standard and rigid AB joint increased 1.52 and 2.14 times higher than those with hinged AB joint. Pile moments in PSC girder IABs with PA standard and rigid AB joint increased 1.17 and 1.60 times higher than those with hinged AB joint.
Backfill height influenced pile moments, but it was not proportional. Steel girder IABs showed larger pile moment than did PSC girder IABs. Pile moments in steel and PSC girder IABs with 4.6 and 6.1 m high backfill varied 0.74 and 0.99 times and 0.67 and 0.82 times less than those with 3.1 m high backfill. For both steel and PSC girder IABs, pile moments in 4.6 m high backfill produced the lowest pile moment. Generally, an increase of backfill height means an increase in backfill resistance against bridge expansion and abutment rotation. Thus, the increase of backfill height means an increase in pile head rotation. On the contrary, a decrease of backfill height reduces backfill resistance, and thus abutment translation increases. Hence, both an increase and decrease of backfill height increase pile moment through pile rotation and translation, respectively. Within the scope of this study, 4.6 m abutment height would be the optimum height.
Based on the pile moment investigation, PSC girder IABs with hinged AB joint and 4.6 m high backfill would reduce the pile moment.
4.4. Pile Head Displacement
Pile head displacement with respect to AB joint stiffness, backfill height, and bridge length is presented in
Figure 11j,l. This study used a positive sign convention for bridge contraction displacement toward the bridge. The pile head displacement during bridge expansion was not significant (averaged maximum expansion was −3.5 mm) owing to backfill resistance compared with those during bridge contraction, and this study focused on bridge contraction displacement. Pile head displacement was significantly influenced by the following factors, in order of importance: bridge length > AB joint stiffness > backfill height.
Bridge length significantly influenced pile head displacement. For comparison purposes, free expansion displacement by AASHTO LRFD [
25], which is a function of bridge length, was included in
Figure 11l. Pile head displacements in most of the parametric study cases were far less than the free expansion. Pile displacement increased as bridge length increased. As time-dependent effects in concrete increased bridge contraction, contraction displacements in PSC girder bridges were similar to those in steel girder bridges, despite a larger thermal expansion coefficient of steel. However, pile displacements in steel girder bridges were larger than those in PSC bridges during bridge expansion. Pile head displacement in 61.0, 121.9, and 182.9 m long steel and PSC girder IABs increased 1.23, 1.66, and 4.27 times larger and 2.12, 2.11, and 4.98 times larger than those in 30.5 m IABs, respectively.
AB joint stiffness significantly influenced pile head displacement. Pile head displacement tended to increase as AB joint stiffness increased. Pile head displacement in steel girder IABs with PA standard and rigid AB joint increased 1.56 and1.83 times larger than those in IABs with hinged AB joint, respectively. Pile head displacement in PSC girder IABs with PA standard and rigid AB joint increased 1.58 and 1.48 times larger than those in IABs with hinged AB joint, respectively. When the hinged AB joint is installed, some of the superstructure thermal movement is accommodated by the rotation of AB joint. On the contrary, rigid AB joint forces the abutment to displace along the bridge longitudinal axis with less rotation, which increases pile head displacement. Hence, stiffer AB joints produced larger pile head displacements.
Backfill height influenced pile head displacement. As backfill height increased, pile head displacements in both steel and PSC girder IABs decreased, especially the maximum envelopes clearly decreased. As the increase of backfill height caused an increase of backfill resistance against bridge expansion, but made the abutment easily to rotate to bridge contraction, the abutment with 3.1 m high backfill displaced in longitudinal translation, while the abutment with 4.6 and 6.1 m high backfill displaced in rotational direction, which caused the pile head to remain. The pile head displacement of steel and PSC girder IABs with 4.6 and 6.1 m high backfill decreased 0.73 and 0.85 times less and 0.51 and 0.63 times less than those of IABs with 3.1 m high backfill, respectively.
5. Conclusions
This study investigated the influence of bridge design parameters that should be determined by bridge designers. The parametric study evaluated the effect of four parameters: (1) girder material, (2) AB joint stiffness, (3) backfill height, and (4) bridge length. The analysis results were evaluated for four critical response parameters: (1) girder axial force, (2) girder moment, (3) pile moment, and (4) pile head displacement.
Girder axial force: bridge length most significantly influenced girder axial forces. Steel girder IAB response was clearly different from those of PSC bridges and tended to produce larger compressive forces and smaller tensile forces. As bridge length increased from 30.5 to 182.9 m, positive and negative steel girder axial forces increased 3.0 and 2.0 times larger than those of 30.5 m long IABs, respectively. Positive and negative PSC girder axial forces increased 7.5 and 3.1 times larger than those of 30.5 m long IABs. During bridge contraction, an increase of backfill height reduced at least 0.81 and 0.78 times less steel and PSC girder tensile forces than those of IABs with 3.1 m high backfill. However, the increase of backfill height increased steel and PSC girder axial forces to at most 1.2 and 1.5 times larger than those of IABs with 3.1 m high backfill. This tensile axial force in a PSC girder should be carefully undertaken during design process. Moreover, the largest girder axial forces, about 2500 and −2100 kN for PSC and 1800 and −2600 kN for steel girder IABs, that can occur during thermal movement should be considered in bridge design within the scope of this study.
Girder moment: Bridge length and AB joint stiffness most significantly influenced the girder moments, because the superstructure moment induced by the thermal movement related to bridge length is transferred to the substructure through the AB joint. The negative moments in 182.9 m long steel and PSC girder IABs increased 2.24 and 2.87 times higher than those in 30.5 m long IABs. The AB joint stiffness influence on girder moment in steel girder IABs was opposite to those in PSC girder IABs. For steel girder IABs, hinged AB joints would reduce 41% girder moments compared with those with rigid AB joint. However, for PSC girder IABs, rigid AB joints would reduce 43% girder moments compared with those with hinged AB joint. Positive and negative PSC girder moments in 4.6 and 6.1 m high backfill increased 1.04 and 1.21 times higher and 3.95 and 5.52 times higher than those in 3.1 m high backfill. Negative steel girder moments in 4.6 and 6.1 m high backfill increased 1.09 and 1.35 times higher than those in 3.1 m backfill, while positive steel girder moments decreased 0.90 and 0.82 times.
Pile moment: Bridge length, AB joint stiffness, and backfill height significantly influenced the pile moments. Pile moments increased as AB joint stiffness or bridge length increased. For AB joint stiffness, hinged joints showed less pile moment and rigid joints showed higher a pile moment. Steel girder IABs tended to produce larger pile moments than did PSC girder IABs. Pile moments in steel girder IABs with PA standard and rigid AB joint increased 1.52 and 2.14 times higher than those with hinged AB joint. Pile moments in PSC girder IABs with PA standard and rigid AB joint increased 1.17 and 1.60 times higher than those with hinged AB joint. Therefore, short PSC girder IABs with hinged AB joint and 4.6 m high backfill would be effective to reduce the pile moment.
Pile displacement: Bridge length mainly influenced pile head displacement. Most of the considered cases for steel and PSC girder IABs were well below the free expansion prediction. A hinged construction joint and high abutment height tended to reduce pile head displacement in IABs. For bridge expansion, because of the backfill resistance increase, both PSC and steel girder IABs developed lower pile head displacements than free expansion predictions. Pile head displacement in steel girder IABs with PA standard and rigid AB joint increased 1.56 and1.83 times larger than those in IABs with hinged AB joint, respectively. Pile head displacement in PSC girder IABs with PA standard and rigid AB joint increased 1.58 and 1.48 times larger than those in IABs with hinged AB joint, respectively. For higher than 4.6 m high backfill height, pile head displacements did not vary much and were within the range from 4.4 to 6.5 mm.
6. Recommendations for IAB Design
All bridge response parameters were strongly related to the four considered parameters, while they were not always linearly proportional. The PSC bridge response did not differ significantly from the steel bridge response for bridge contraction. Because time-dependent effects accommodate thermal movements, PSC girder IABs exhibited lower bridge response parameters overall compared with steel girder IABs. Those forces and moments in the superstructure and the substructure induced by thermal movements and time-dependent loads were not negligible and should be considered in the design process.
The bridge length parameter, as in bridge design guidelines, most significantly influenced all considered responses of the superstructure and substructure and should be considered as a key design parameter. Although the bridge responses were not linearly proportional to bridge length, all bridge responses increased as bridge length increased. Backfill height significantly influenced the pile moment and girder moment. AB joint stiffness significantly influenced the pile moment, girder moment, and girder axial force. The influence of backfill height and AB joint stiffness implies that the flexibility of the substructure, i.e., rotational stiffness of the abutment and piles, is strongly related to the superstructure moment because rotational stiffness of the substructure is determined by backfill height and AB joint stiffness. The current design concept of an IAB is based on the concept that thermal movement is accommodated by the flexibility of supporting piles. This design concept thus requires larger pile displacement and moment. However, this study exhibited that thermal movement is accommodated via the flexibility of AB joints, superstructure, and substructure. This concept would provide better performing IAB design.


