Article

Coordinated Operation of Electricity and Natural Gas Networks with Consideration of Congestion and Demand Response

1
Department of Electrical Engineering, School of Automation, Guangdong University of Technology, Guangzhou 510006, China
2
Brunel Interdisciplinary Power Systems Research Centre, Department of Electronic and Electrical Engineering, Brunel University London, London UB8 3PH, UK
*
Authors to whom correspondence should be addressed.
Appl. Sci. 2021, 11(11), 4987; https://doi.org/10.3390/app11114987
Submission received: 11 April 2021 / Revised: 8 May 2021 / Accepted: 11 May 2021 / Published: 28 May 2021
(This article belongs to the Special Issue Electrification of Smart Cities)

Abstract

:
This work presents a new coordinated operation (CO) framework for electricity and natural gas networks, considering network congestions and demand response. Credit rank (CR) indicator of coupling units is introduced, and gas consumption constraints information of natural gas fired units (NGFUs) is given. Natural gas network operator (GNO) will deliver this information to an electricity network operator (ENO). A major advantage of this operation framework is that no frequent information interaction between GNO and ENO is needed. The entire framework contains two participants and three optimization problems, namely, GNO optimization sub-problem-A, GNO optimization sub-problem-B, and ENO optimization sub-problem. Decision sequence changed from traditional ENO-GNO-ENO to GNO-ENO-GNO in this novel framework. Second-order cone (SOC) relaxation is applied to ENO optimization sub-problem. The original problem is reformulated as a mixed-integer second-order cone programming (MISOCP) problem. For GNO optimization sub-problem, an improved sequential cone programming (SCP) method is applied based on SOC relaxation and the original sub-problem is converted to MISOCP problem. A benchmark 6-node natural gas system and 6-bus electricity system is used to illustrate the effectiveness of the proposed framework. Considering pipeline congestion, CO, with demand response, can reduce the total cost of an electricity network by 1.19%, as compared to −0.48% using traditional decentralized operation with demand response.

1. Introduction

In November 2018, the European Union (EU) presented its long-term vision for a carbon-neutral economy by 2050. While renewable energy sources are adopted in achieving this goal, the EU will require more grid scale storage as the fraction of intermittent renewable energy becomes larger. Without significant grid scale storage, renewable energy sources may have to be taken off the grid or carry out large-scale load shedding to avoid de-stabilizing the grid when supply outstrips demand. Many options are being studied for grid scale storage, but no sustainable, marketable, affordable, and renewable solution is on the table. Power to Gas is a technology that could be useful in the short to medium term, as a component of a comprehensive grid scale storage solution, in support of a power grid supplied by intermittent renewable energy systems (RES) in the long term to promote smart energy for smart cities [1,2,3]. At the same time, some research deals with the energy, exergy, economic, and exergoenvironmental analyses of hybrid combined system [4].
The use of natural gas to produce electricity is increasing dramatically throughout the world. This trend is being driven by the cost and environmental advantages of gas-fired generation as compared to that of the coal. This increase has also highlighted the need for greater coordination between natural gas and electricity systems. Insufficient coordination limits pipeline operators from providing accurate guidance on gas quantities to supply gas-fired generators each hour [5]. In general, generators overschedule gas deliveries to ensure enough resources to operate. The inefficiency will only increase with the growing use of natural gas for electricity generation. While the two systems have operated for decades, closer coordination could save money, improve efficiencies, and minimize potential disruptions. Improved coordination of these networks will increase energy resiliency and reliability while reducing the cost of natural gas supply for electricity generation.
Natural gas generation can reduce the use of coal-fired power, support integration of renewable resources, and reduce greenhouse gas emission. In power systems with increasing numbers of uncertain renewable sources, gas generation is taking a more important role in supplying short-term flexibility to match unexpected electricity consumption. In the electricity network, the natural gas generation units are rapid response units that overcome generation scarcity caused by sudden variations in the electricity consumption or the renewable generation dispatch. The gas turbines’ flexibility relates to the gas network’s flexibility [5]. The performance of the gas turbine is affected by some important parameters that consist of the compression ratio, ambient temperature, pressure, humidity, turbine inlet temperature, specific fuel consumption, and air to fuel ratio [6].
Reference [7] examined the renewable energy sources impact, including pumped-storage units and photovoltaic systems on power system security from electricity and natural gas networks perspective. With the large-scale natural gas infrastructure deployment, which leads to changes in capabilities of pipelines, operational procedures, supply, and tariffs, it is important to have coordination between the two networks to enhance future energy system reliability [8].
Natural gas volume is susceptible to price changes and influences the generation and commitment costs of generating units. Naturally, an increasing amount of natural gas usage in the electricity sector has raised difficulties for natural gas network planning and operation. Natural gas pipelines’ pressure interruption or loss may contribute to the outage of several natural gas-fired generators and lead to power system security issues. For electricity networks, intermittent renewable energy sources have no fuel costs and only have a fixed operating cost for operation. To achieve robust power system operations, natural gas units may provide flexible dispatch and rapid ramping capability. Turning to variable renewables, it is expected that the intermittency in generation due to, for example, wind will have an impact on other generation units, which will be required to increase and decrease their generation, as the wind generation falls and rises, to meet the shortfall between generation and demand. Naturally, gas turbines will have a greater role to play in generating electricity due to their ability to ramp up/down quickly.
Natural gas fired units (NGFUs) gradually replace coal fired units due to the operation flexibility, great efficiency and little capital costs in many countries [9]. In China, NGFUs occupy 4% of total generating capacity, while in the USA, it reached 39% [10]. Therefore, integrating natural gas systems with power systems is challenging.
A great amount of overall electricity production is produced by gas-fired power plants for several countries. It is projected to rise to 7600 TWh by 2035. With increasing gas demand, gas networks need to expand capacity to provide fuel to additional gas-fired power plants. Reference [11] presents an integrated gas and electricity network expansion planning model. Gas fired generation plants were seen as connections between the two networks. The model concurrently minimizes electricity and gas operational and network development costs.
Various research works were performed on optimal operation strategy and interdependency of the integrated electricity-natural gas system. Reference [7] examined the influence of natural gas infrastructure on the electricity system by focusing on particular constraints of the natural gas network. Reference [12] presented an in-depth integrated model for examining the influence of interdependency between natural gas and electricity networks on power system security, considering constraints of natural gas network in the security-constrained unit commitment (SCUC) problem for power systems. References [13,14] formulated the co-planning process as a mixed-integer nonlinear programming problem to consider recent challenges, including congestions, demand response effect, etc.
The growing reliance of the power system on NG systems has demanded an integrated planning approach for the two systems [12]. Reference [15] proposed a decentralized operation strategy and applied it to coordinate energy flow in a multi-area integrated electricity-natural gas system (IEGS). The complete decentralized operation of interconnected large-scale IEGS is achieved with the iterative alternating direction method of multipliers (ADMM) algorithm. IEGS was represented by several subsystems that were tied by electricity and natural gas networks. An optimal operation strategy based on decentralization was developed for multi-area IEGS.
Reference [10] showed that integrated natural gas and electricity networks operation can be attained in a distributed method with ADMM. Results showed that the ADMM-based approach gives enhanced convergence performances than the classical Lagrange Relaxation (LR), as well as augmented LR-based methods. Reference [16] propose a mixed integer programming model to characterize the electricity portfolio of large consumers. References [17,18] propose electricity and natural gas networks by considering energy hubs. As reported in Reference [19], the changes of natural gas unit’s generation dispatch will provide natural gas demand profile changes. The changes may harm the natural gas network’s security. Electricity and natural gas infrastructure’s coordinated operation can enhance reliability and security for the infrastructure and avoid demand curtailment risks. Reference [20] presented a novel robust operation model for IEGS but without the solution algorithm. With ADMM, reference [21] presented a study on robust optimization for IEGS with distributed structures. Previous works have fixated on the coordination of natural gas and electricity networks at synergistic scheduling level. Electricity network flow rules are summarized in [22] to solve the gas flow problem. Reference [23] presented a methodology for considering the combination of the natural gas network. Coordination with stochastic scheduling were studied in [24]. Scheduling problems, including electricity demand response, were presented in [25,26]. Natural gas prices impacting on the system were examined in [27,28,29].
Several investigations have fixated on solving steady-state natural gas flow. The challenges are contributed from the non-linear and non-convex Weymouth equation, that is, the natural gas flow is a nonlinear programming (NLP) problem. References [22,23] employed a nonlinear solution or commercial solvers to determine gas flow, including interior point method or Newton-Raphson methods. Approximate piecewise linearization methods were presented in [30] and [31] by transforming to a mixed-integer linear programming (MILP) problem. To eliminate non-convexity, researchers in [10] and [32] employed the special form of the Weymouth equation by transforming the NLP problem to MISOCP via convex relaxation.
Natural gas and electricity networks are owned by various operators and stakeholders. However, both networks are often seen as an integrated system to achieve coordinated operation or establish a third-party coordinator with a lot of information interaction. The main contributions of this work are as follows:
  • Proposed a novel CO framework and this changes the traditional decision sequence. With this framework, it is possible to avoid frequent information interaction and without a third coordinator.
  • A model is constructed to generate NGFUs’ gas consumption constraints. A CR indicator and an update method are introduced, to generate reasonable gas consumption constraints information deliver from gas network operator (GNO) to electricity network operator (ENO).
  • Impact of considering classic demand response program [33] and congestion is discussed in a decentralized and coordinated operation. For GNO optimization sub-problem, an improve SCP method based SOC with reasonable initial expansion value is used to determine the steady-state gas flow in a natural gas network.
  • Simulations under different scenarios, considering the NG and electricity networks operation, based on a benchmark 6-bus electricity system and 6-node natural gas system were used to verify the proposed framework, considering solution convergence and benefits obtained.
  • The impact of the coordinated operation is studied with congestions and demand response. The present method can give a better convergence when compared to a very popular method such as ADMM.
Section 2 presents the formulations of the framework for coordination operation for one IEGS. Section 3 provides a mathematical model for the two sub-optimization problems, namely, GNO optimization and ENO optimization. Section 4 gives the solution methodology for solving the optimization of the two networks based on Weymouth function. Case studies and discussions are given in Section 5. Conclusion and future work are provided in Section 6.

2. Framework for Coordinated Operation

2.1. Coordination of Interdependent Electricity and Natural Gas Systems (IENS): An Overview

Due to the increasing interdependence between power grids and natural gas networks, it may be unreasonable, or physically infeasible, to model and optimize the two energy systems separately in practice. Different coordination strategies are as follows:
  • From the perspective of the macro scope of the energy system model, the models can be classified from four aspects: comprehensive evaluation, energy economy, power system planning, and energy system planning [34]. They have different methods, different ranges of use and different fields of application. Energy modeling tools such as LEAP, EnergyPlan, MASSAGE, MARKAL/TIMES have been designated for sustainable energy planning analysis [35]. The main methods of energy system modeling are top-down and bottom-up. The combination of these models leads to a hybrid energy model.
  • In IENS, due to the uncertainty of natural gas supply, the balance of supply and demand in power system may be affected for security and economic purposes. Power system researchers have incorporated natural gas transmission constraints into the unit commitment problem of security constraints [12,23,24]. The uncertainty of natural gas supply and the variability of natural gas price are also considered in reference [36] to study the impact of natural gas supply shortage on the optimal dispatch of power system.
  • In the natural gas optimization problem, the time-varying gas consumption of gas generating units is simulated to explore the influence of large gas generating units [37,38,39] on the daily operation efficiency of natural gas network.
  • For sequence optimization of power grid and natural gas network [38,39], this model cannot guarantee global optimality of the IENS.
  • The collaborative optimization of IENS considers the power grid and natural gas network as a whole to minimize the total cost associated with the two energy systems. It can achieve the best solution for the whole IENS [40,41,42]. In addition, considering that power grid and natural gas network may belong to different system operators and information exchange may be restricted by policies, researchers explore decentralized algorithms to obtain high-quality coordination solutions of IENS, while maintaining decision independence and information privacy of the two systems [43,44,45]
  • IENS should be considered from operational and long-term planning aspects [46]. Co-planning of power and natural gas networks can be proposed at system level [47] and local level [48]. The integration of natural gas and power sectors usually needs to study the interaction between them and Resource Co-optimization from the perspective of central planners [49]. The mathematical model used in the joint planning of electric power and natural gas shows that some relationships are nonlinear and nonconvex [50]. The most common problem in this paper is MINLP model [51]. In order to solve the complexity of the model, various techniques of linear and convex reconstruction/relaxation [52] and decomposition method [53] are proposed.

2.2. Coordinated Operation Method Based on ADMM Algorithm

For the synergy between power and gas networks and coordination operators, the synergy among the three decision makers is achieved through consensus based ADMM method. Consensus variables are introduced to reflect the interaction between upper and lower operators. In each iteration, the upper coordination operator checks the convergence and updates the consensus variables, while the lower electric operator and natural gas operator solve the local optimization problem at the same time. The cooperative operation mode of the third party is: Based on the synchronous ADMM decoupling algorithm, a higher-level third-party cooperative operator (CO) is introduced to solve the electricity network subproblem and the natural gas network subproblem simultaneously, and the relevant information is transferred to the third-party scheduling department to realize the cooperative operation.
The structure of ADMM with coordination is shown in Figure 1 composed of five steps:
  • Parameter initialization: Initialize the coupling variable values G i g , 1   and   H e g , 1 of the power grid sub-problem and the natural gas network sub-problem respectively. Initialize the coupling variable value J e g , 1 of the third-party dispatching department, set the ADMM algorithm step size ρ1and ρ2. Initialize the Lagrange multiplier λ i e , 1 k   and   λ i e , 2 k of the grid sub-problem and the gas grid sub-problem respectively.
  • Simultaneously solve the electricity network subproblem and the gas network subproblem.
  • Update ADMM multiplier and third-party coupling variable.
  • Convergence criterion: The original residual is the coupling unbalance, and the dual residual is the difference before and after the iteration of the coupling variable.

2.3. Traditional Decentralized Operation

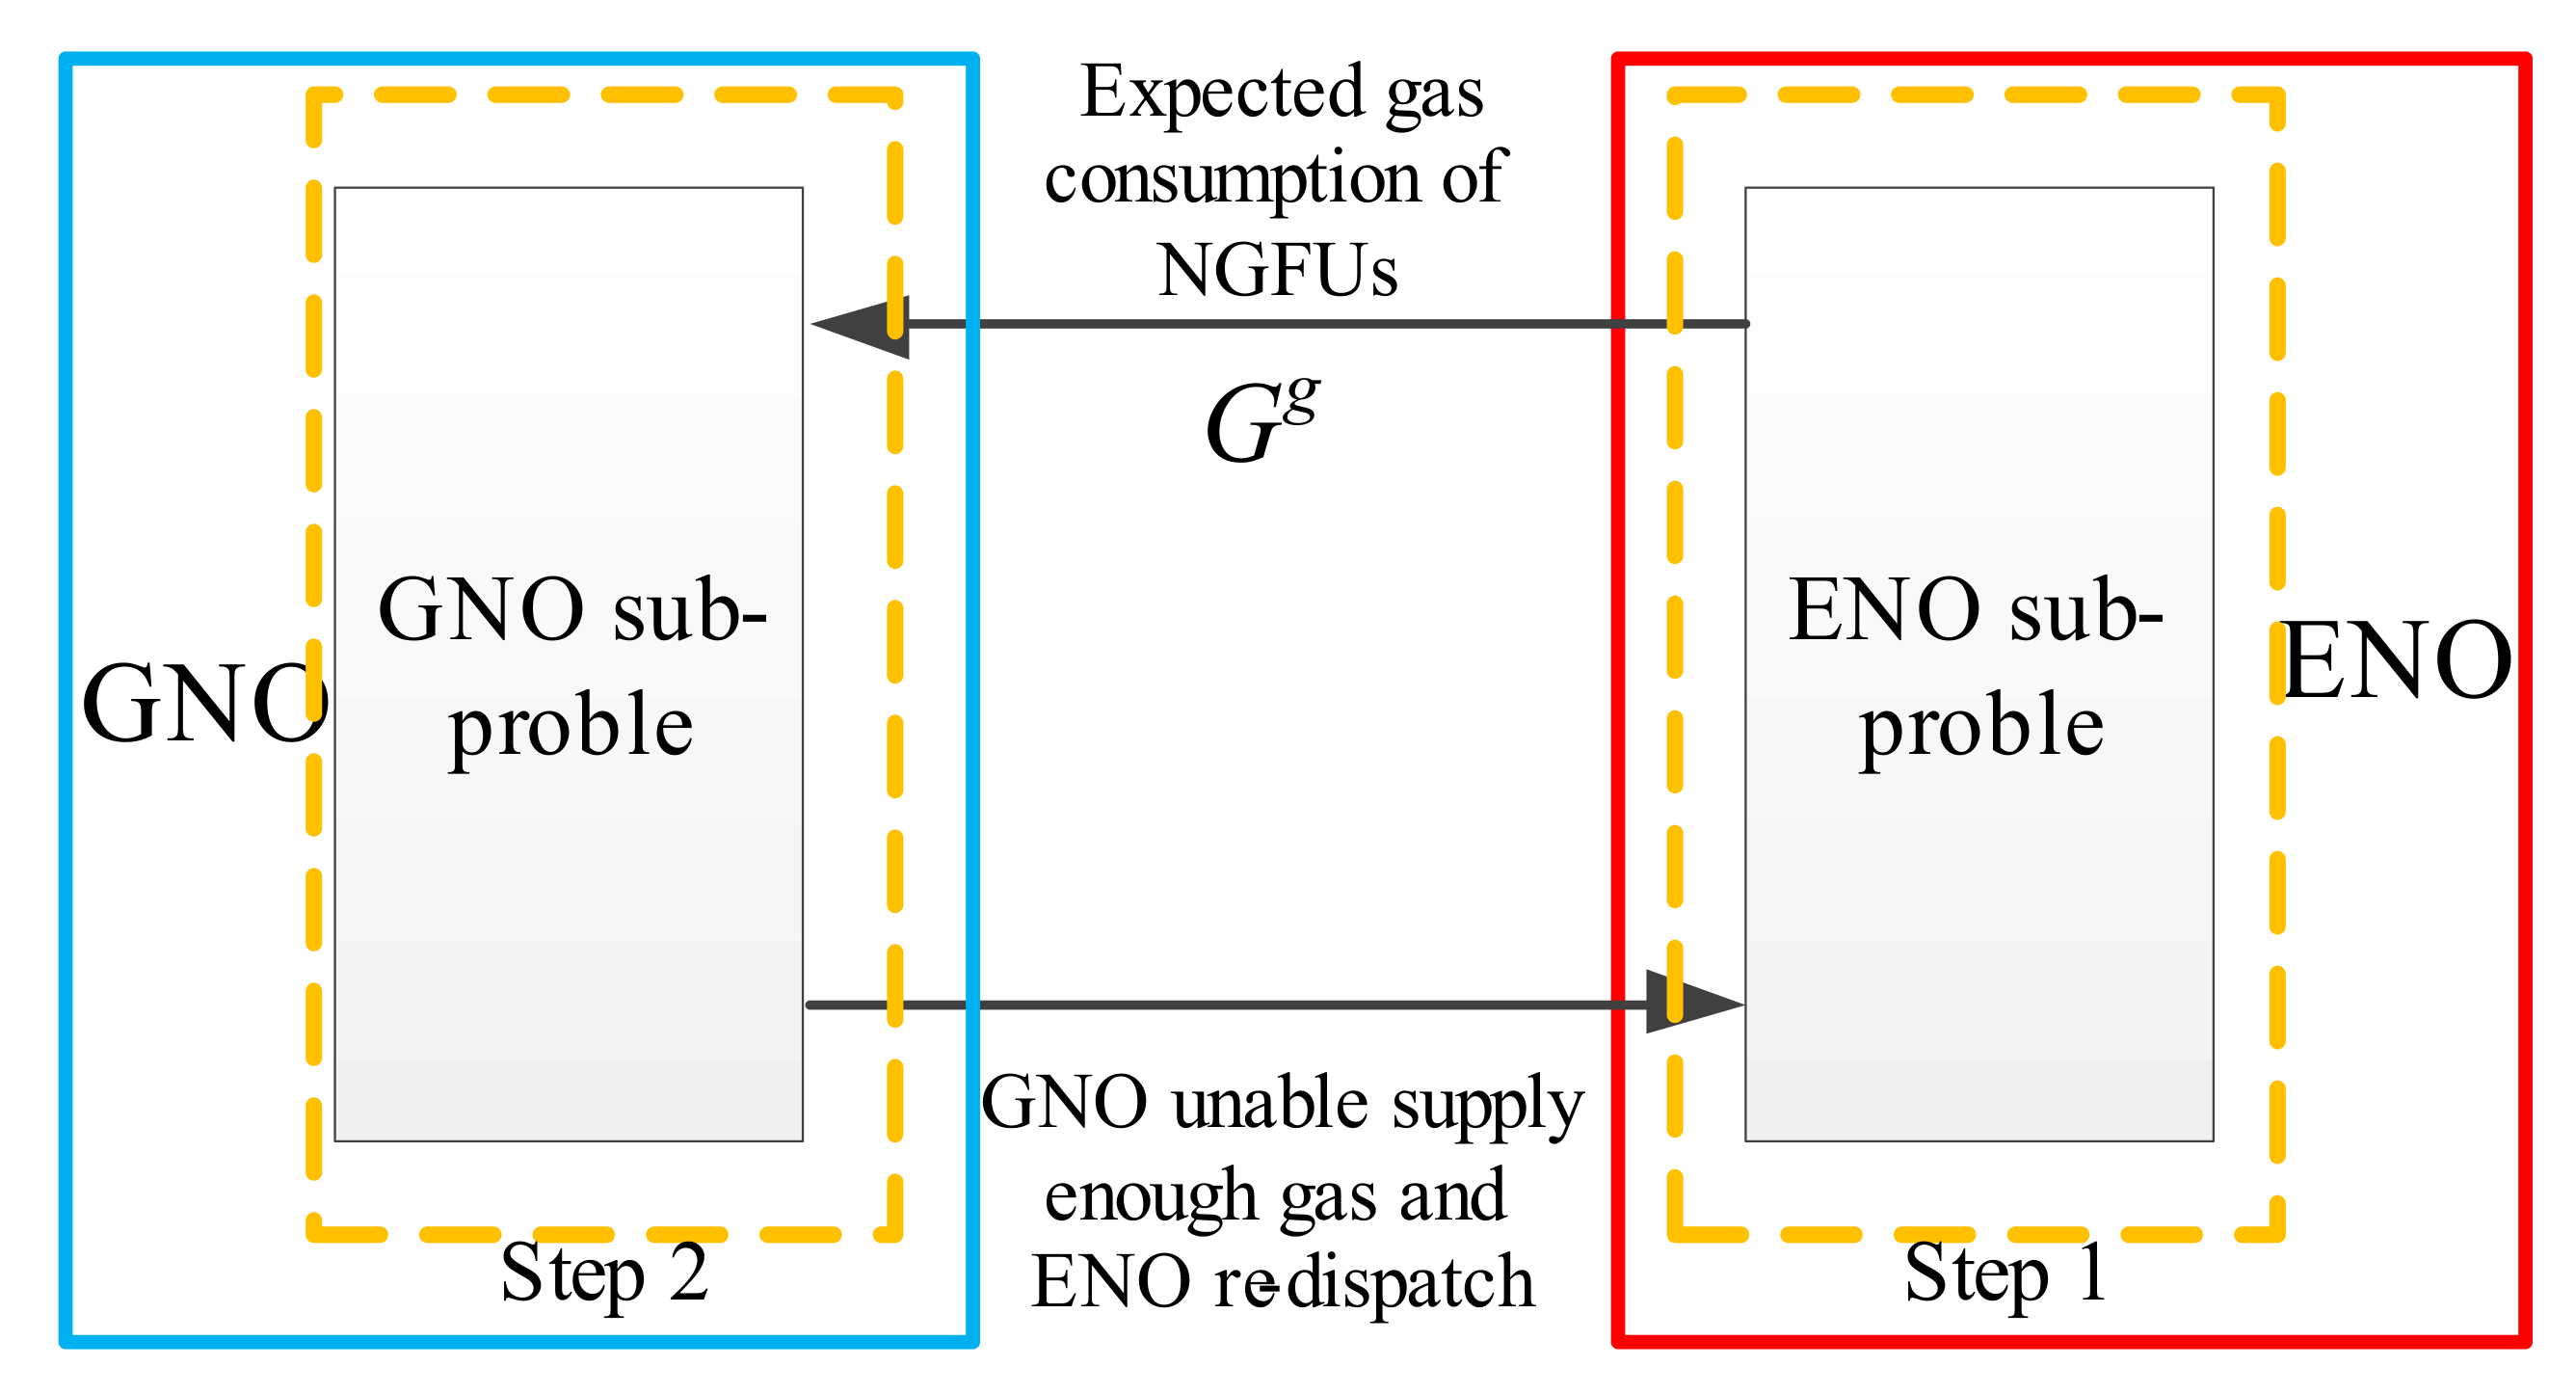
The structure of traditional decentralized operation (DO) is shown in Figure 2 composed of two steps:
  • Step 1: ENO carries out the optimal local scheduling of electricity network which described as ENO sub-problem, and the corresponding consumption of natural gas information will deliver to the GNO.
  • Step 2: GNO carries out the optimal scheduling of natural gas network and is described as GNO sub-problem. If GNO cannot supply enough expected gas volume in Step 1 as the premise of resident gas demand has a higher priority, ENO needs to re-dispatch in the electricity network.
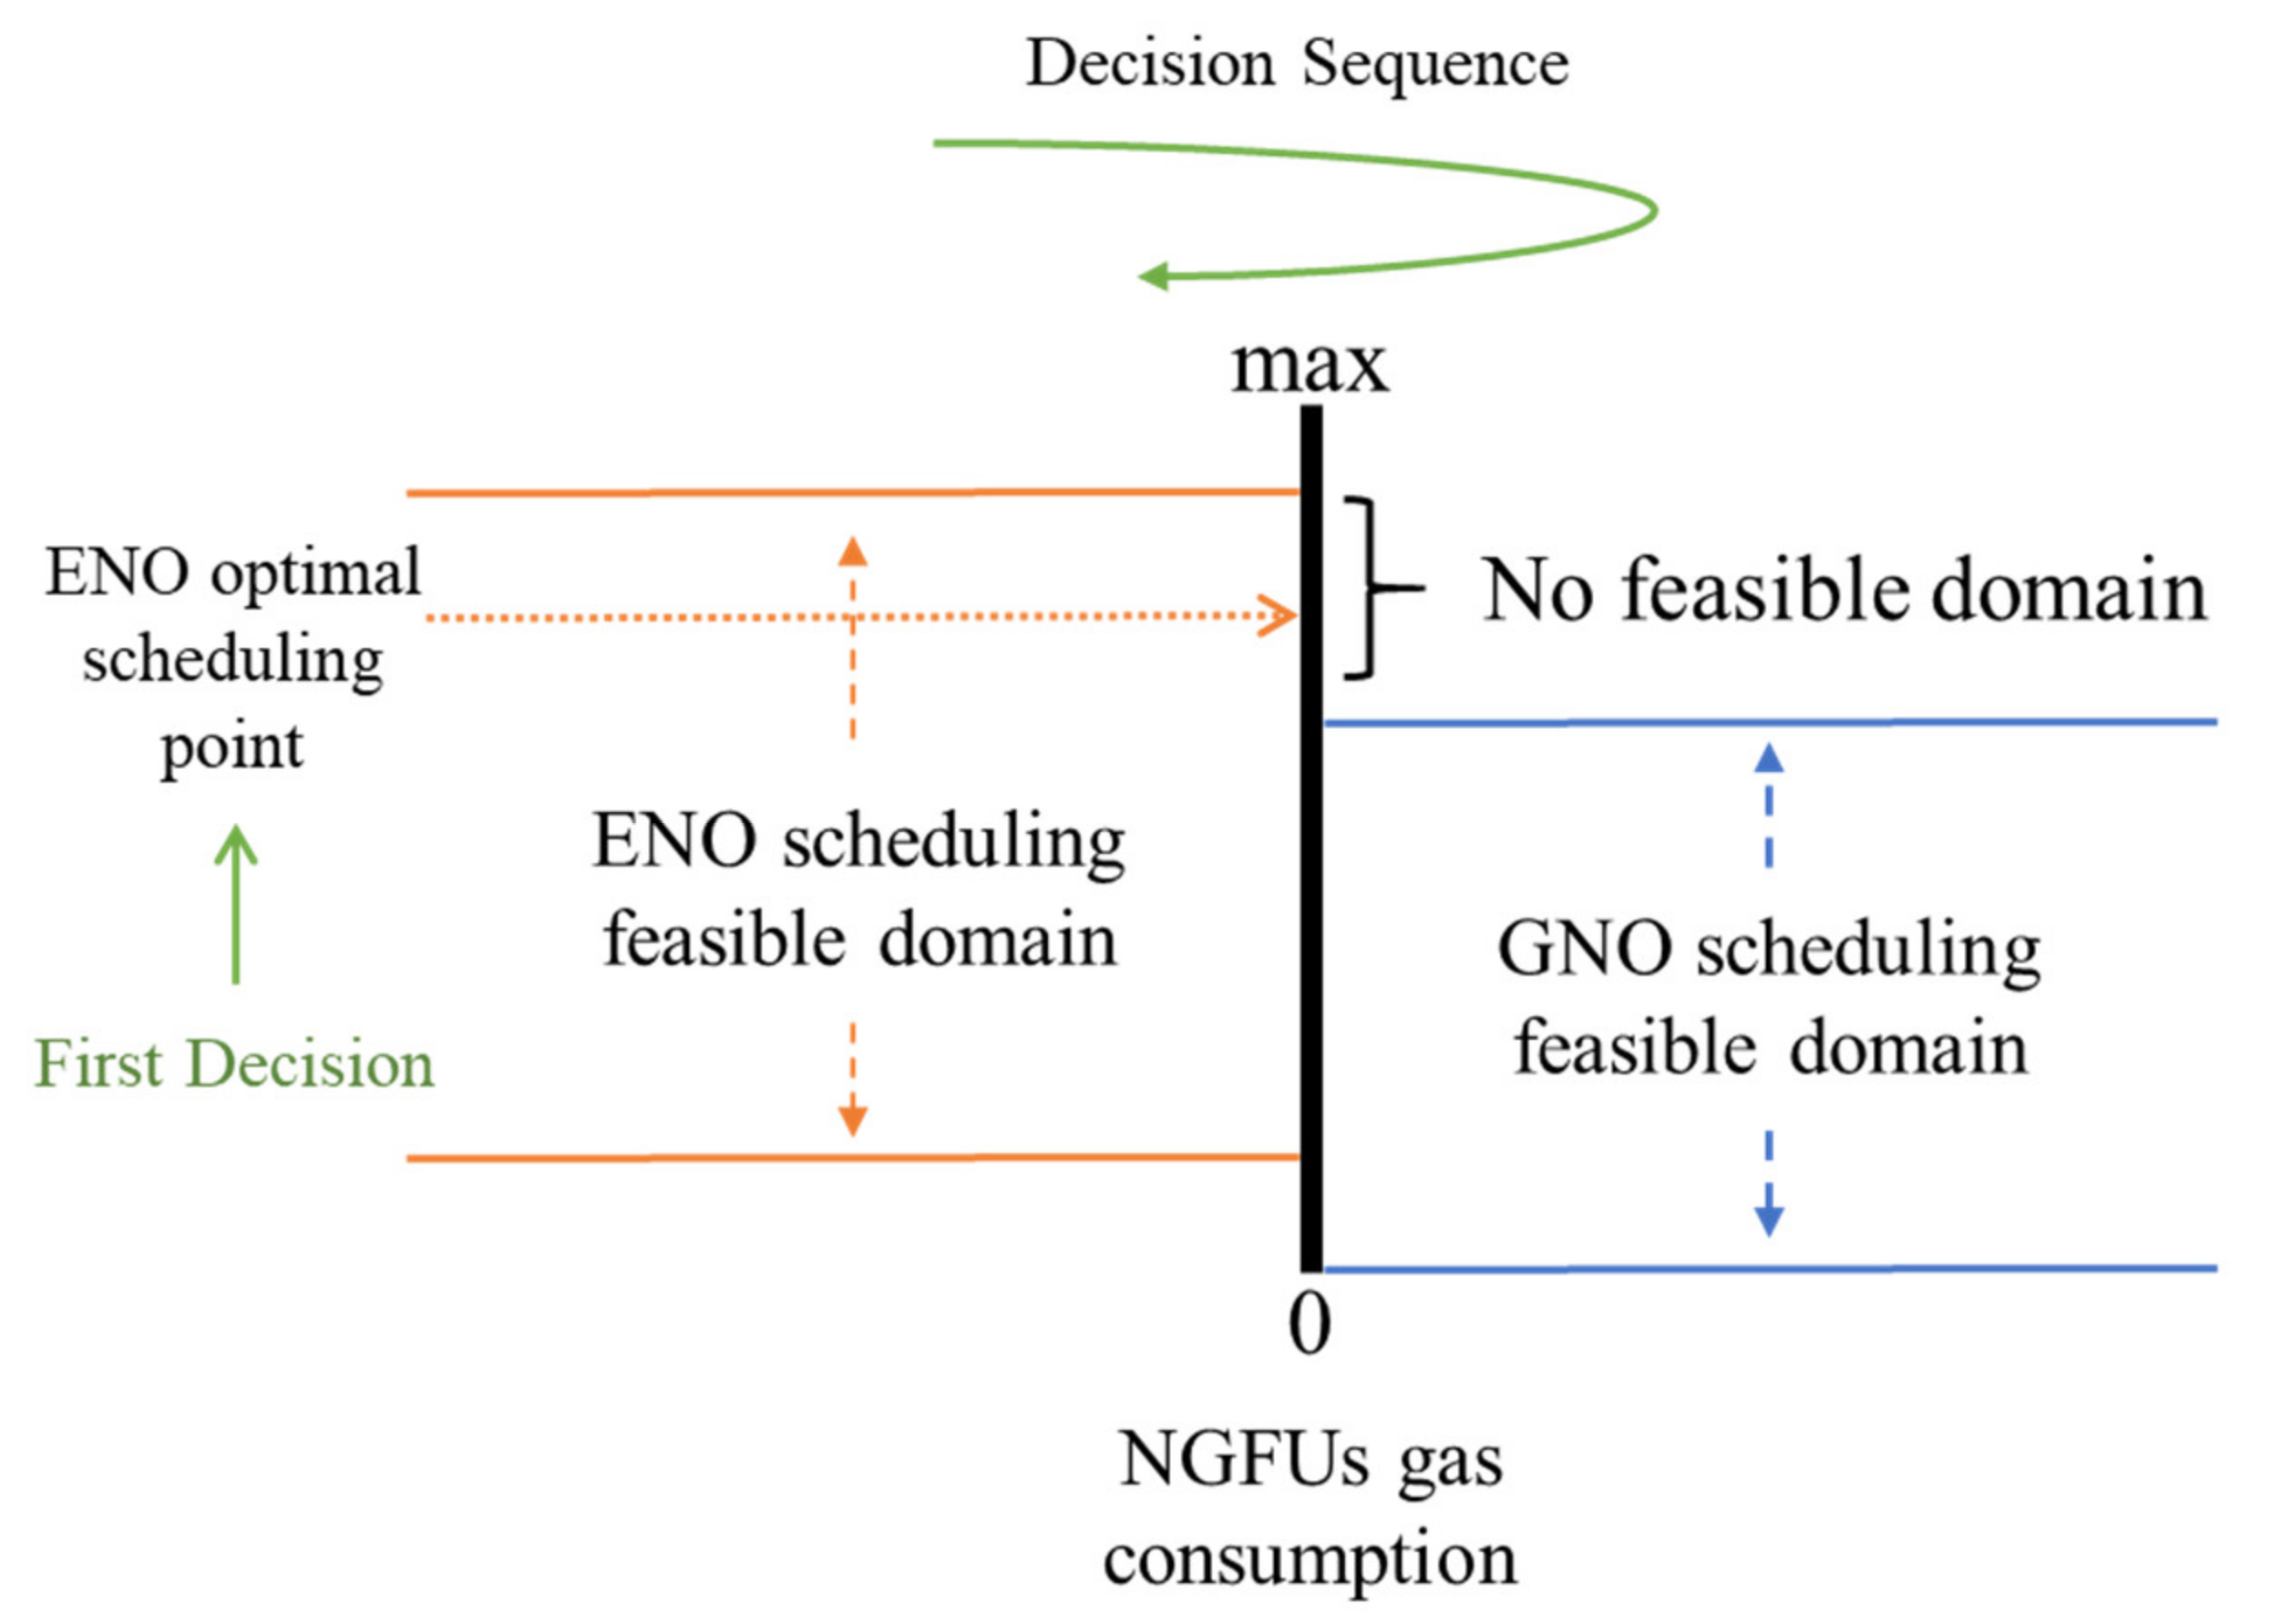
The main defect with this traditional DO is that ENO as an advance decision-maker, cannot guarantee the local scheduling result at coupling units will always be a feasible solution in the GNO scheduling feasible domain shown in Figure 3. The decision sequence is ENO-GNO-ENO.

2.4. A New Framework for Coordinated Operation

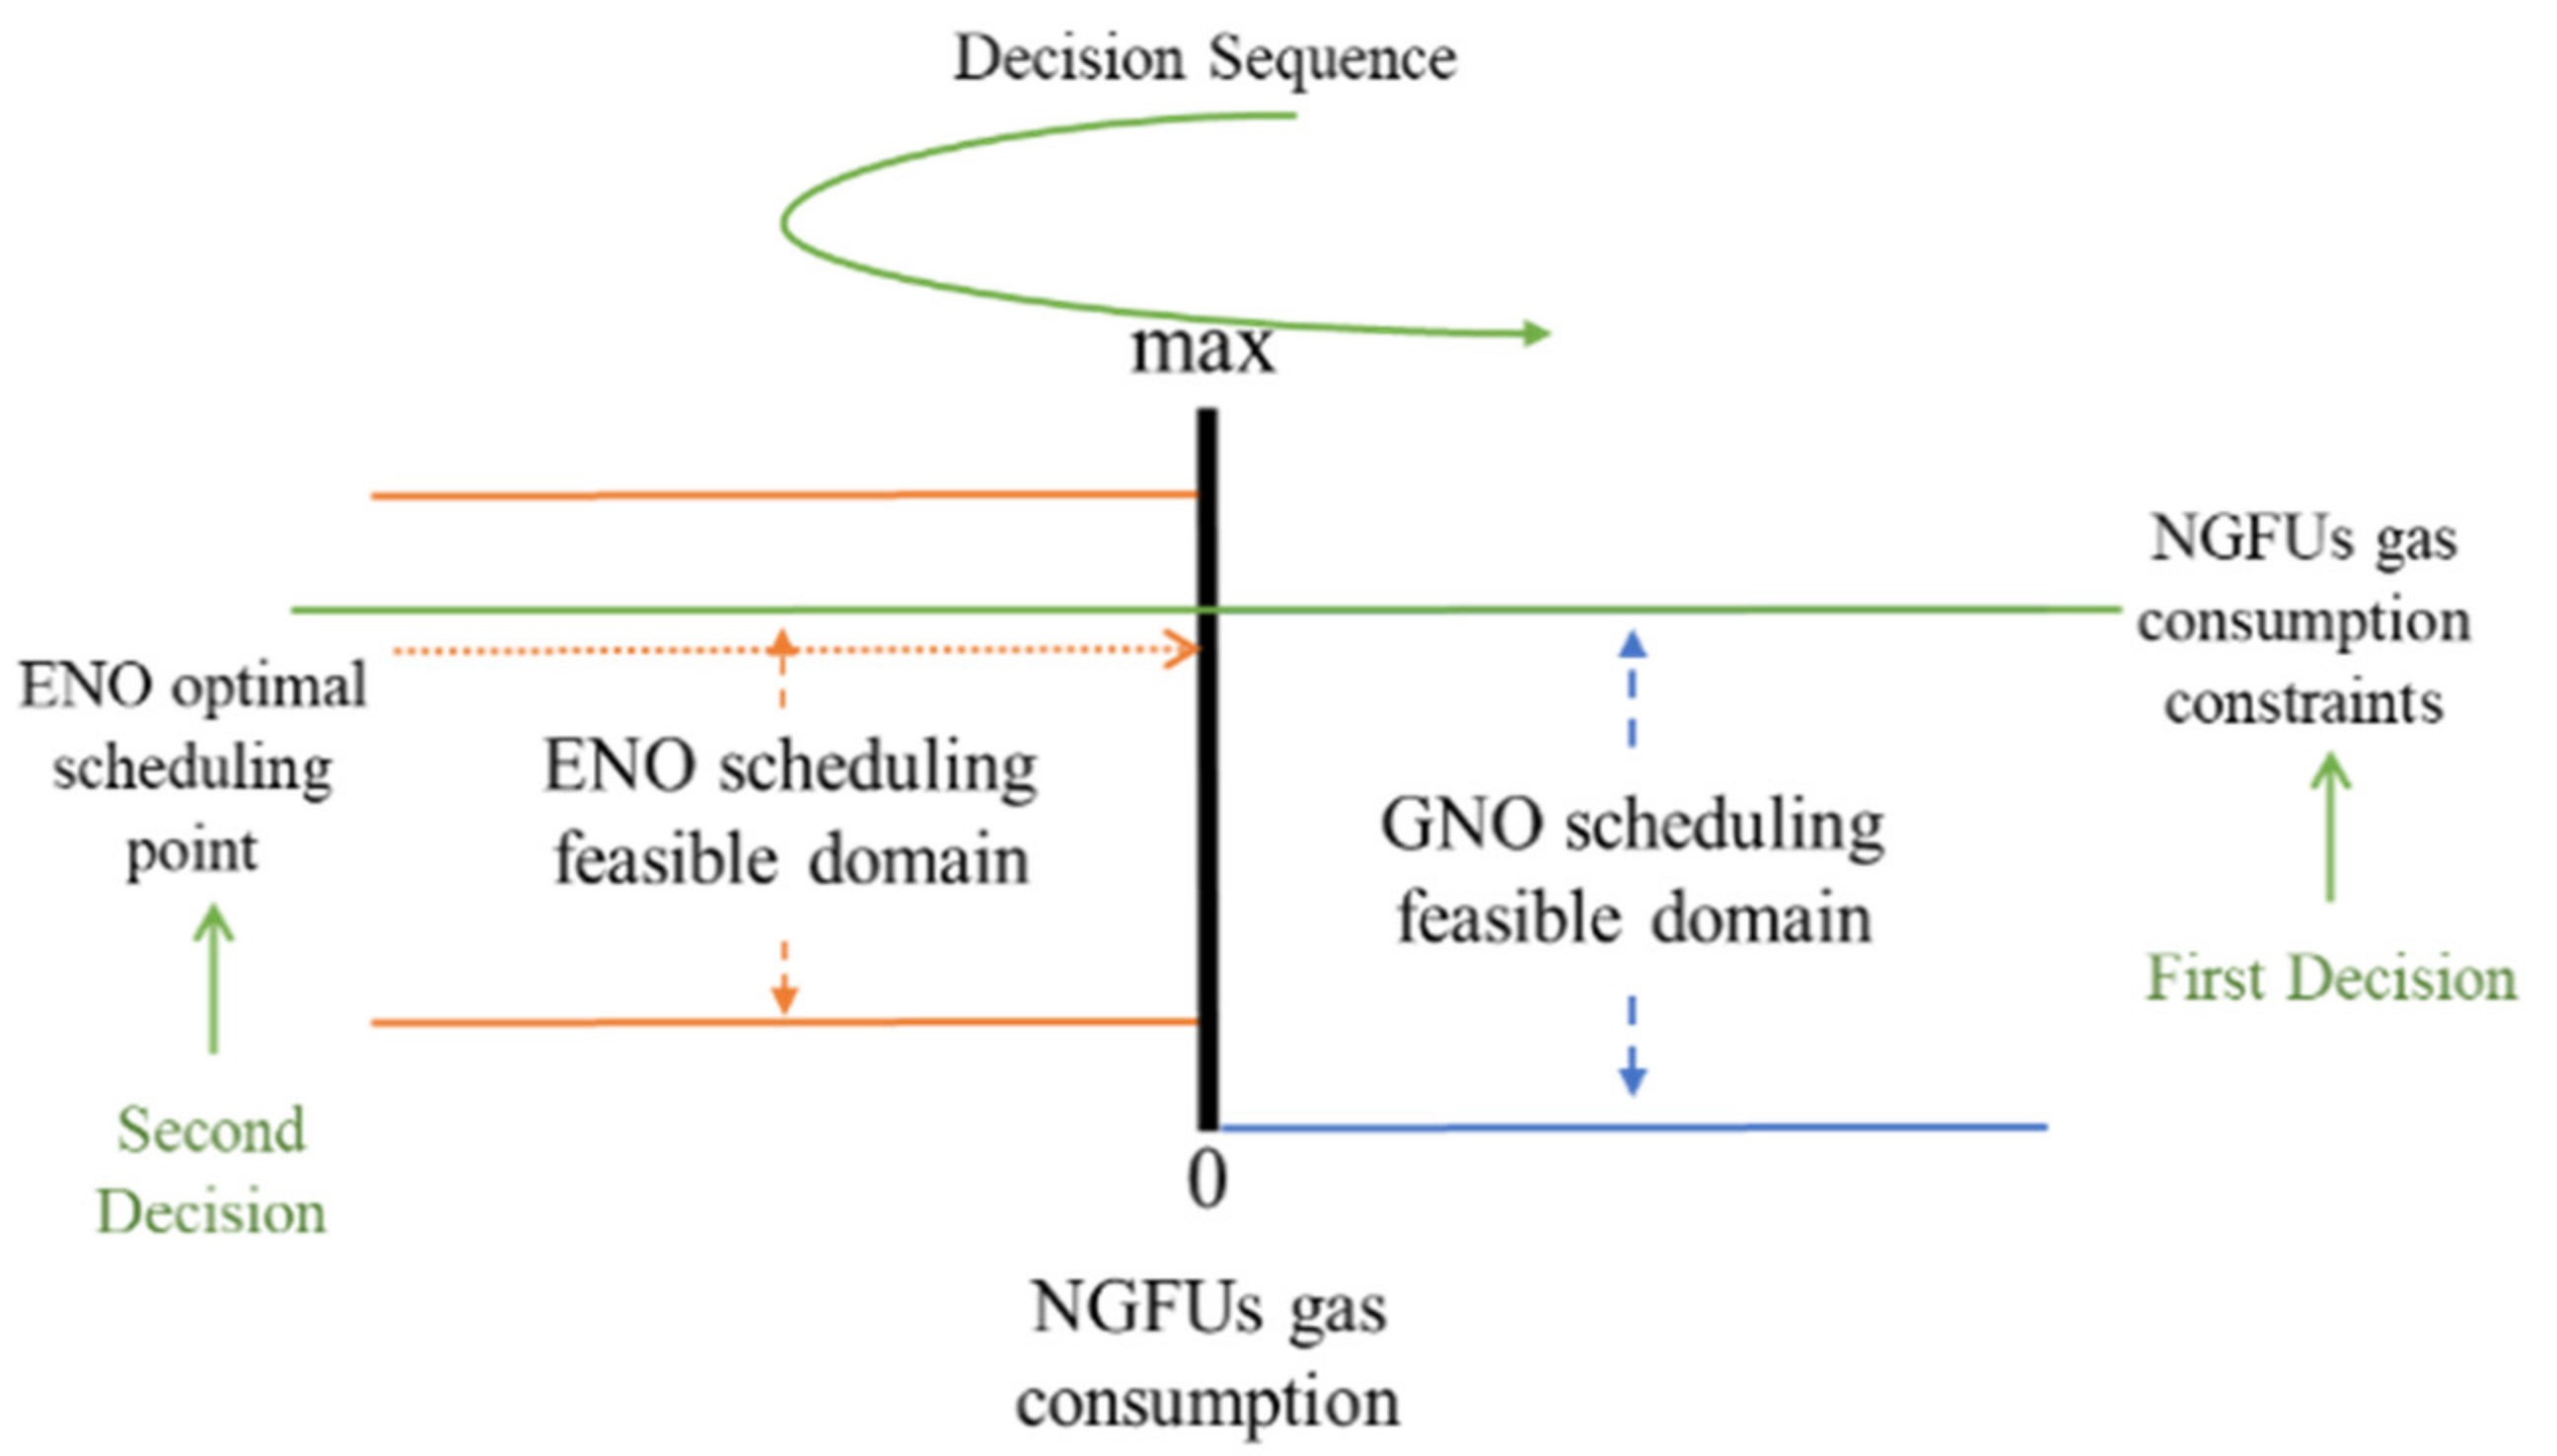
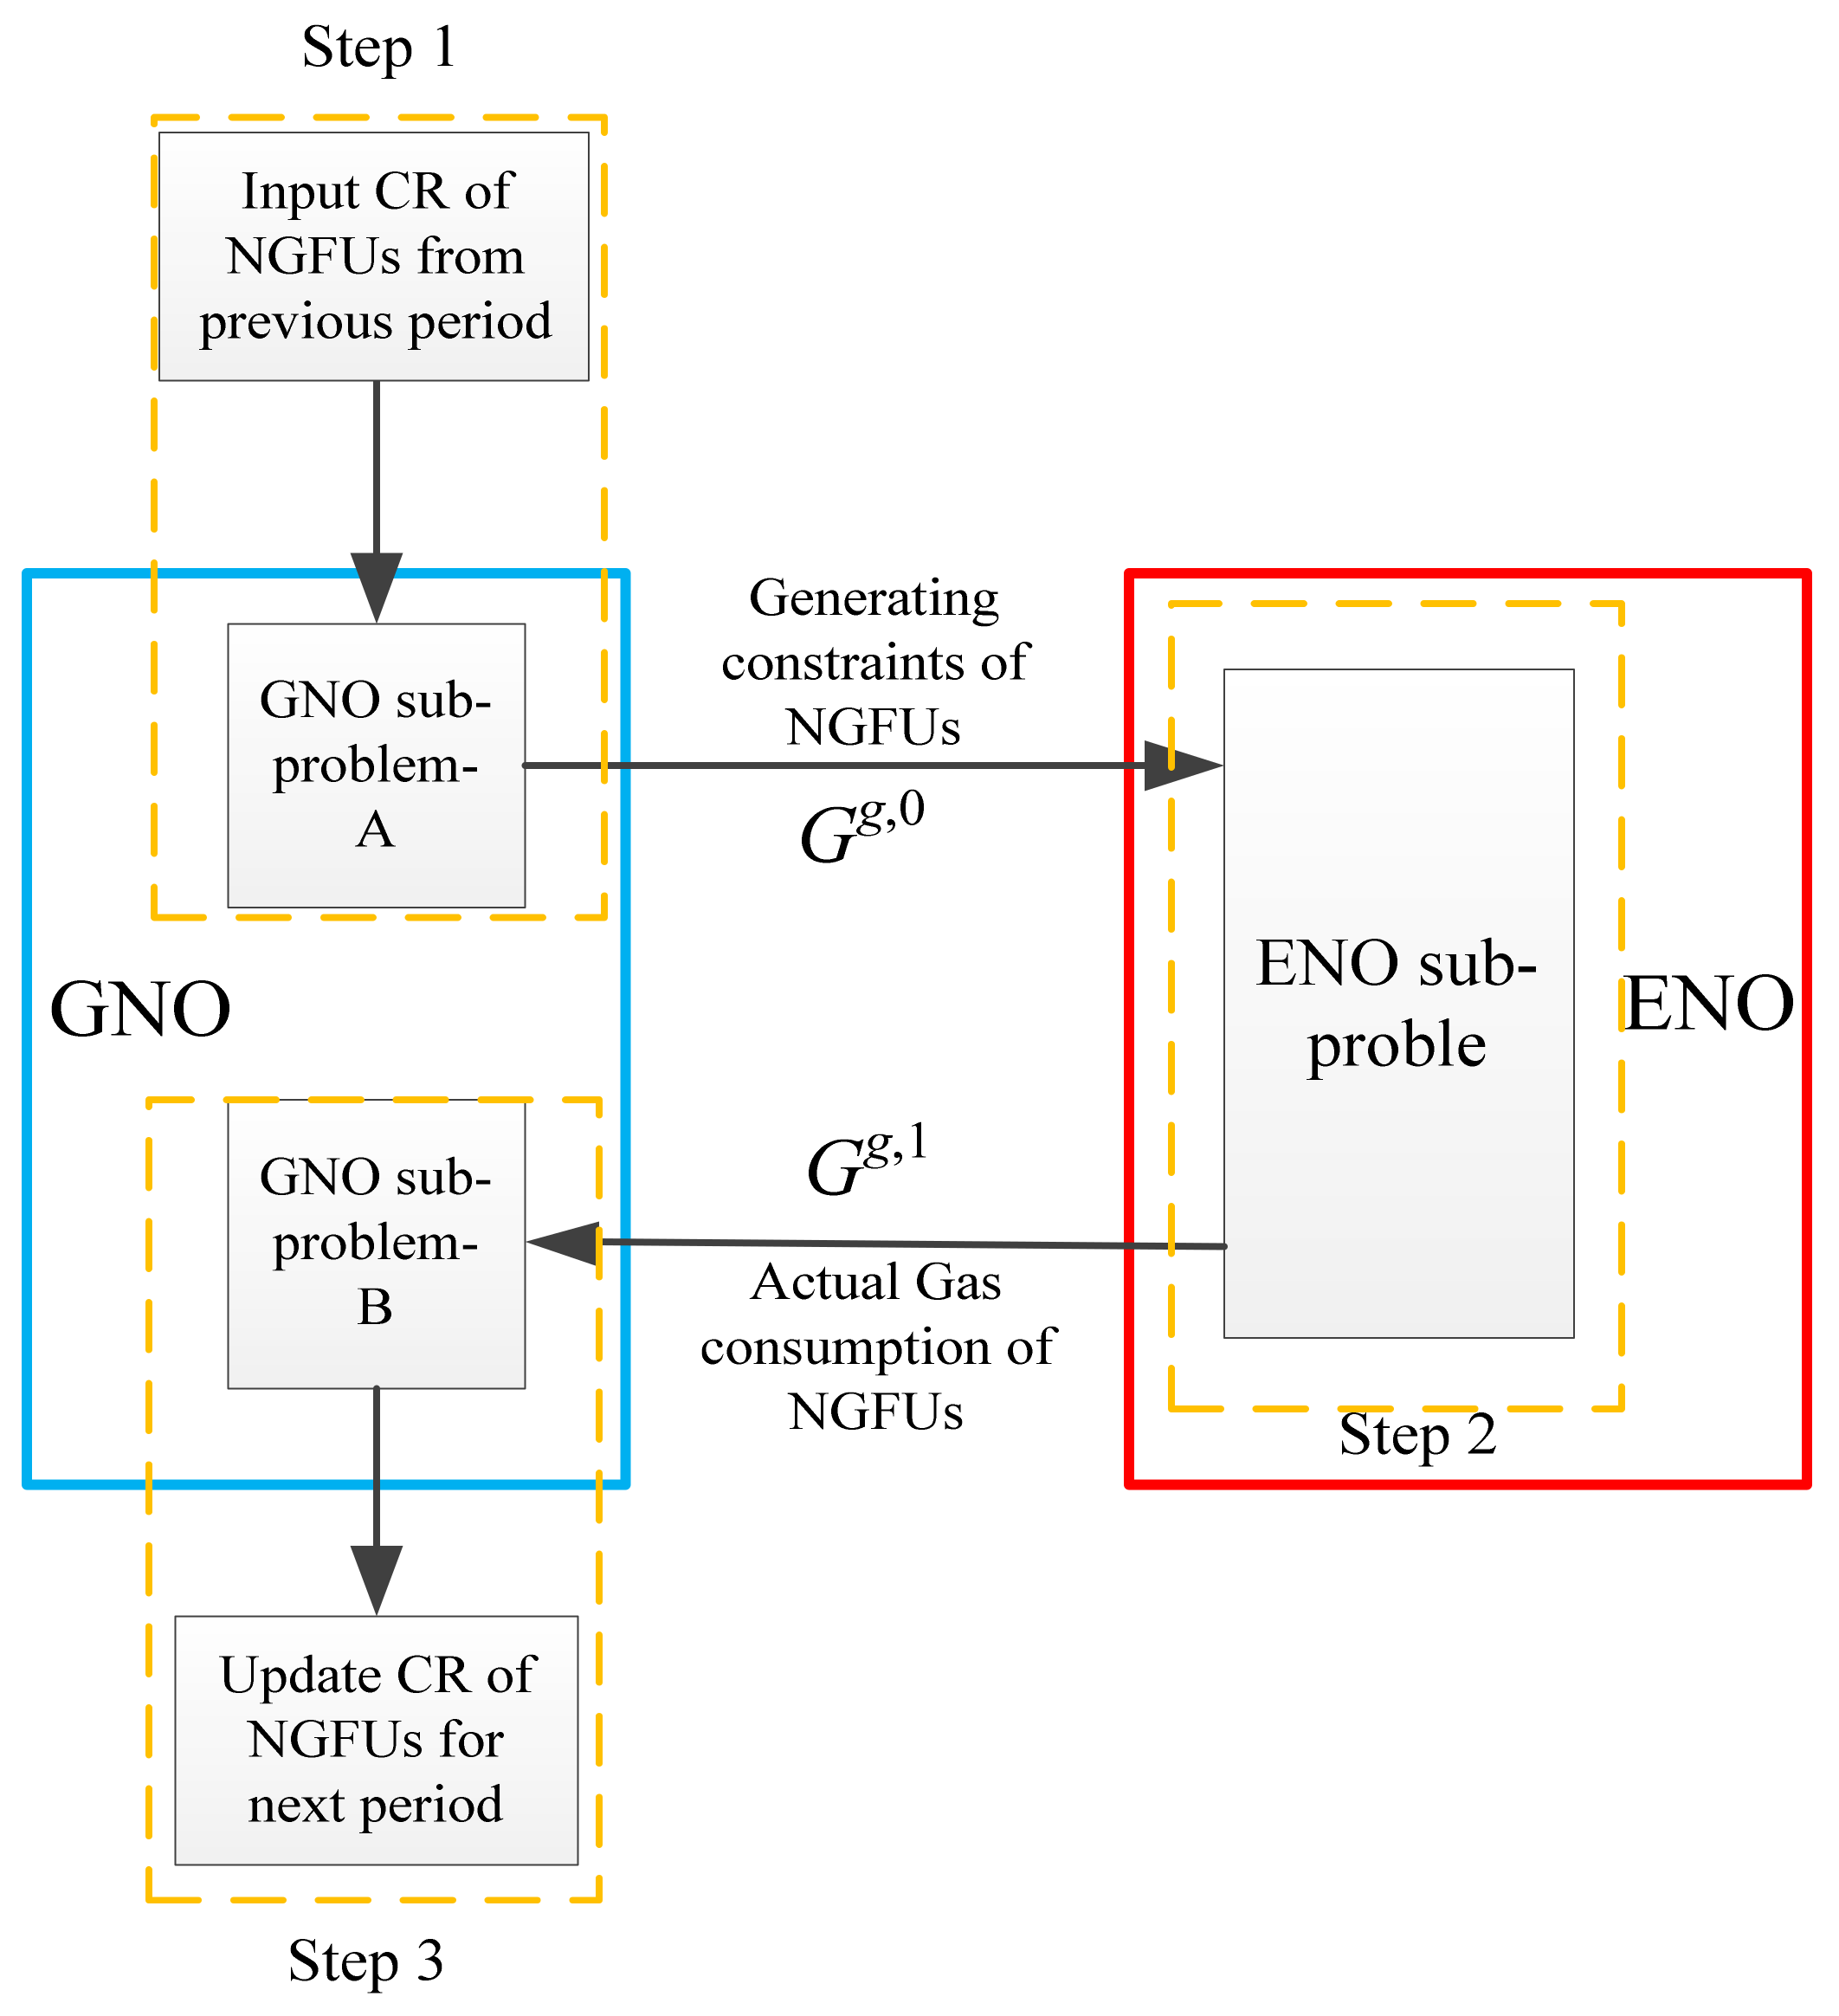
A new framework is established for CO of electricity and natural gas networks, as presented in Figure 4. It is different from the traditional DO in decision sequence as GNO-ENO-GNO. GNO as advance decision-maker provides NGFUs gas consumption constraints to ENO. When there are multiple coupling units and gas supply capacity is limited, how to generate reasonable constraints for multiple coupling units is extremely important. To solve this problem, to the knowledge of the authors, it is the first time to introduce an indicator, that is, credit rating (CR) for decision making and the entire framework for CO is shown in Figure 5. There are three steps in the procedure.
  • Step 1: Receive NGFUs’ CR from the previous period, GNO calculates the maximum profit with an uncertain gas load of NGFUs, named GNO sub-optimization-A problem. GNO as advance decision-maker provides NGFUs gas consumption constraints to ENO. To generate reasonable gas consumption constraints information that deliver from GNO to ENO. This means that the natural gas network supplies the maximum capacity to NGFUs.
  • Step 2: ENO set the maximum gas supply of NGFUs as constraints in optimization sub-problem to determine the hourly dispatch, including the dispatching generation and actual gas consumption of NGFUs.
  • Step 3: After receiving the actual gas load of NGFUs in natural gas network, GNO optimizes the gas network scheduling to achieve the minimal operation cost and updates the CR of NGFUs for the next scheduling period.
Some insights could be summarized as follows:
(1)
The GNO and ENO do not have dispatching power and networks information of another party, but the information in coupling units is available for both GNO and ENO.
(2)
In a natural gas network, resident natural gas load priority is higher than NGFUs gas load, GNO will cut the gas supply of NGFUs first if there is a natural gas shortage. Thus, in GNO optimization sub-problem, the resident natural gas load is the control parameters and the profit of this part is fixed.
(3)
In GNO optimization sub-problem-A, the cost of a gas well is ignored. It assumes that the gas purchase price of NGFUs is greater than the production cost of a gas well, GNO will always benefit from it.
(4)
CR is a gas price-related indicator, we assume that the forecast gas contract price of all NGFUs is the same. A higher CR means GNO will provide as much natural gas as possible to this NGFU, so that the gas constraint value deliver to ENO will be greater.

3. Mathematical Model

3.1. GNO Optimization Sub-Problem-A

As shown in (1), the objective of GNO sub-optimization-A problem is to maximize profit. In this sub-problem, the resident natural gas load is fixed, and NGFUs gas load is a variable. The first term of the objective function represents incomes from the resident natural gas load and the second term is expected profits from NGFUs natural gas load.
Natural gas network model is given by Equations (2)–(6) when applied by the steady-state natural gas flow. Constraint (2) represents the pressure of the gas node and gas flow in the pipeline relationship, which is a Weymouth function. The pressure of gas node upper and lower limits is shown in (3). Nodal natural gas balance in the network is given in (4), and the natural gas well production boundary is shown in (5). The gas load of NGFUs is constrained by the unit’s maximum gas consumption as given by (6). Constraint (7) represents the relationship between CR, the gas contract price of NGFUs and credit value factor, which is equal to the product of CR and forecast gas contract price.
Max   o b j _ G a = t = 1 N T g l = 1 N L τ g l L + i G U λ i 0 G i , t g
F m n , t = sgn ω m , t , ω n , t C m n ω m , t 2 ω n , t 2
ω m , t min ω m , t ω m max
T w W T g G g T l L = T f F
W s min W s , t W s max
G i , t g G i g , max
λ i 0 = η i C R i 0
After completing the above optimization solution, a series of constraints of NGFUs will be generated, the gas supply to NGFUs of this optimization result is given by (8). This value will deliver to the next step.
G i , t g , 0 = G i , t g = arg max o b j _ G a , i G U

3.2. ENO Optimization Sub-Problem

(1)
Objective function
As shown in (9), the objective function of ENO sub-optimization problem is determined by the hourly dispatch. It is to minimize the operating cost over the complete scheduling horizon with security-constraints. The first term of the objective function is the generation costs and startup cost of NGFUs, the second term is the generation costs and startup cost of non-NGFUs. The shutdown cost of units has been converted into the startup cost.
Min   o b j _ E = t = 1 N T i G U G i , t g η i + S U i , t + i N G U G i , t c + S U i , t
(2)
Units and network constraints
Equations (10)–(21) are physical constraints of generating unit. Generation scheduling of each thermal unit is constrained by maximum and minimum output of the unit as presented in (10). The renewable power dispatch at individual hour is constrained by the renewable power forecast given in (11). Thermal units operating ramping up/down constraints are given in (12) and (13). Minimum on/off-limits are enforced by (14) and (15). The relationships between unit states and startup/shutdown indicators are given in (16). The logic between startup indicators and shutdown indicators are given in (17). Constraint (18) represents the generation costs of non-NGFUs. Constraint (19) represents the fuel consumption NGFUs. Constraint (20) shows the startup costs of thermal units.
P i min u i , t P i , t P i max u i , t
P r , t P r , t W
P i , t P i , t 1 U R i 1 y i , t + P i min y i , t
P i , t 1 P i , t D R i 1 z i , t + P i min z i , t
X i , t 1 o n T i o n u i , t 1 u i , t 0
X i , t 1 o f f T i o f f u i , t u i , t 1 0
y i , t z i , t = u i , t u i , t 1
y i , t + z i , t 1
G i , t c = α i c u i , t + β i c P i , t + γ i c P i , t 2 , i N G U
G i , t g = α i g u i , t + β i g P i , t + γ i g P i , t 2 , i G U
S U i , t = s u i y i , t
Constraint (21) limits the gas consumption of NGFUs, the information of this constraint is from GNO optimization sub-problem-A.
G i , t g G i , t g , 0 , i G U
For simplicity, the electric power transmission is modeled by (22)–(26) in DC power flow form. Constraint (22) shows the system power balance at each hour. Constraint (23) is the power balance for individual bus. Constraint (24) represents the DC power flow in branch br with first and last buses at j and k. Constraint (25) means line capacity limit, pfmax is power flow limits. Constraint (26) is the phase angle for reference bus.
i G U P i , t + i N G U P i , t + r = 1 N R P r , t = b = 1 N B D b , t
K P P i + K W P r K D D = K L p f
p f b r = θ j θ l x j l , j , l b r
p f b r p f b r max
θ r e f = 0
(3)
Demand response constraints
The price-elastic load in the electricity network is based on the model reported in References [54,55]. Equations (27)–(30) represent electrical load deviation and electricity price deviation in the demand response program. In this paper, the time-of-use electricity price is adopted to describe the price change in one day. In this demand response strategy, the satisfaction of customers should be considered. At the same time, customers’ satisfaction cannot break the limit as shown in (31). Constraint (32) represents the load is shiftable and the sum of electrical load cannot be changed in one day.
D d e v = E p d e v
D d e v = Δ D 1 D 1 i n i , , Δ D N T D N T i n i
p d e v = Δ p 1 p 1 i n i , , Δ p N T p N T i n i
D t = D t i n i + Δ D t
C S = 1 t = 1 N T Δ D t t = 1 N T D t i n i C S min
t = 1 N T D t i n i = t = 1 N T D t
After ENO completing optimization sub-problem, the actual gas consumption of NGFUs will be fixed and delivered to GNO for Step 3 as Equation (33) shown.
G i , t g , 1 = G i , t g = arg min o b j _ E , i G U

3.3. GNO Optimization Sub-Problem-B

As shown in (34), the objective function of GNO sub-optimization-B problem is to minimize the cost of gas wells. The resident natural gas load and NGFUs gas load are assumed to be fixed. The natural gas network constraints are similar to GNO sub-optimization-A, consisting of (2)–(6).
Min   o b j _ G b = t = 1 N T s = 1 N S τ s W s , t
s.t Constraints (2)–(6).
Meanwhile, GNO updates the CR as shown in Equation (35).
C R i 1 = 0.5 C R i 0 + t = 1 N T G i , t g , 1 t = 1 N T G i , t g , 0

4. Solution Methodology

The Solution of Network Sub-Problem Solving

This work adopted an improved SCP method based on SOC with reasonable initial expansion value for natural gas network sub-problem. The method is suitable for both sub-problems A and B. The steps of solving are derived from the special form of the Weymouth function. Weymouth nonlinear steady-state pipeline flow of constraints (2)–(3) can be transformed as follows and shown in (36)–(38).
I m n , t + I m n , t π m , t π n , t = 1 C m n 2 F m n , t 2
I m n , t + + I m n , t = 1
π m min π m , t π m max
According to [8], (36) is substituted by McCormick envelope (39)–(43) which converts the whole model into the MISOCP problem.
Π m n , t 1 C m n 2 F m n 2
Π m n , t π n , t π m , t + I m n , t + I m n , t + 1 π m min π n max
Π m n , t π m , t π n , t + I m n , t + I m n , t 1 π m max π n min
Π m n , t π m , t π n , t + I m n , t + I m n , t 1 π m min π n max
Π m n , t π n , t π m , t + I m n , t + I m n , t + 1 π m max π n min
Constraints (39)–(43) will be equal to constraint (36) if (39) is tight. This work adopts a penalty function by combining SCP method to tight the constraint (39).
(1)
Penalty function method
To tighten the inequality as much as possible under constraint (39), the objective function includes a penalty as shown in (44), to make the left term of inequality (39) as small as possible. This kind of solution is often not accurate enough but could be used to determine an initial solution. φ represents a pre-set positive number.
Min   t = 1 N T t = 1 N S τ s W s , t + t = 1 N T m n = 1 N P φ Π m n , t
s.t Constraints (4) and (5), (37)–(43)
(2)
Sequential cone programming method
In SCP method, extra concave constraint (45) is adopted to let constraints (39)–(43), (45) equivalent to constraint (36).
Π m n , t 1 C m n 2 F m n , t 2
As such, the key problem becomes the processing of Equation (45), and linearization is a common method. According to Taylor series, it can be approximated as (46). When the right-hand side value of the inequality is close to 0, the solution meets the expected requirements. Where S is an auxiliary variable.
Π m n , t k 1 C m n 2 F m n , t k 1 2 1 C m n 2 2 F m n , t k 1 F m n , t k F m n , t k 1 S m n , t k
(3)
Solution procedure
The Algorithm 1 solution procedure is given as follows:
Algorithm 1: Improve SCP method for natural gas network sub-problem based on SOC
Step 1 Use penalty function method to solve natural gas steady-state flow problem to get the initial solution of gas flow F m n 0 . Set initial iteration number k = 0 .
Min Min   t = 1 N T s = 1 N S τ s W s , t + t = 1 N T m n = 1 N P φ Π m n , t
s.t Constraints (4) and (5), (37)–(43)
Step 2 Parameter settings. Set a punish growth rate v and maximum penalty factor ϕmax, SCP residual tolerance ξ Z and ξS.
Step 3 Solve the following MISOCP problem:
Z k = Min Z k = Min t = 1 N T s = 1 N s τ s W s , t + t = 1 N T m n = 1 N P ϕ k 1 S m n , t k
s.t Constraints (4) and (5), (37)–(43), (46)
Step 4 Check SCP residuals.
Z k Z k 1 ξ Z
max m n = 1 N P S m n , t k ξ S
If yes, end the procedure. Otherwise, update the penalty factor and iteration number.
ϕ h = min v ϕ h 1 , ϕ max
Step 5 Set k = k + 1 and repeat Steps 3–4 until the convergence conditions are met.
The gas flow directions will not change after several iterations. The binary variables in the gas network sub-problem (MISOCP) are fixed.

5. Case Studies and Discussions

All the cases are conducted on a Windows 10 64-bit personal computer with Intel Core i5-6500 3.2 GHz CPU and 8 GB of RAM using MATLAB R2014b in YALMIP with Gurobi 6.5 solver. A 6-bus electricity system and 6-node natural gas system is employed to examine the effectiveness of the proposed CO framework. Figure 6 presents the integrated topology. The test networks have one non-NGFU, seven transmission lines, two natural gas wells, five pipelines, three NGFUs, and one renewable energy source. The network considers varying electricity and natural gas loads, the networks test data can be found in http://motor.ece.iit.edu/data/ (accessed on 22 March 2021). Table 1 and Table 2 give the gas source characteristics for S1 and S2 and natural gas line characteristics respectively.

5.1. Comparison between DO, ADMM and CO

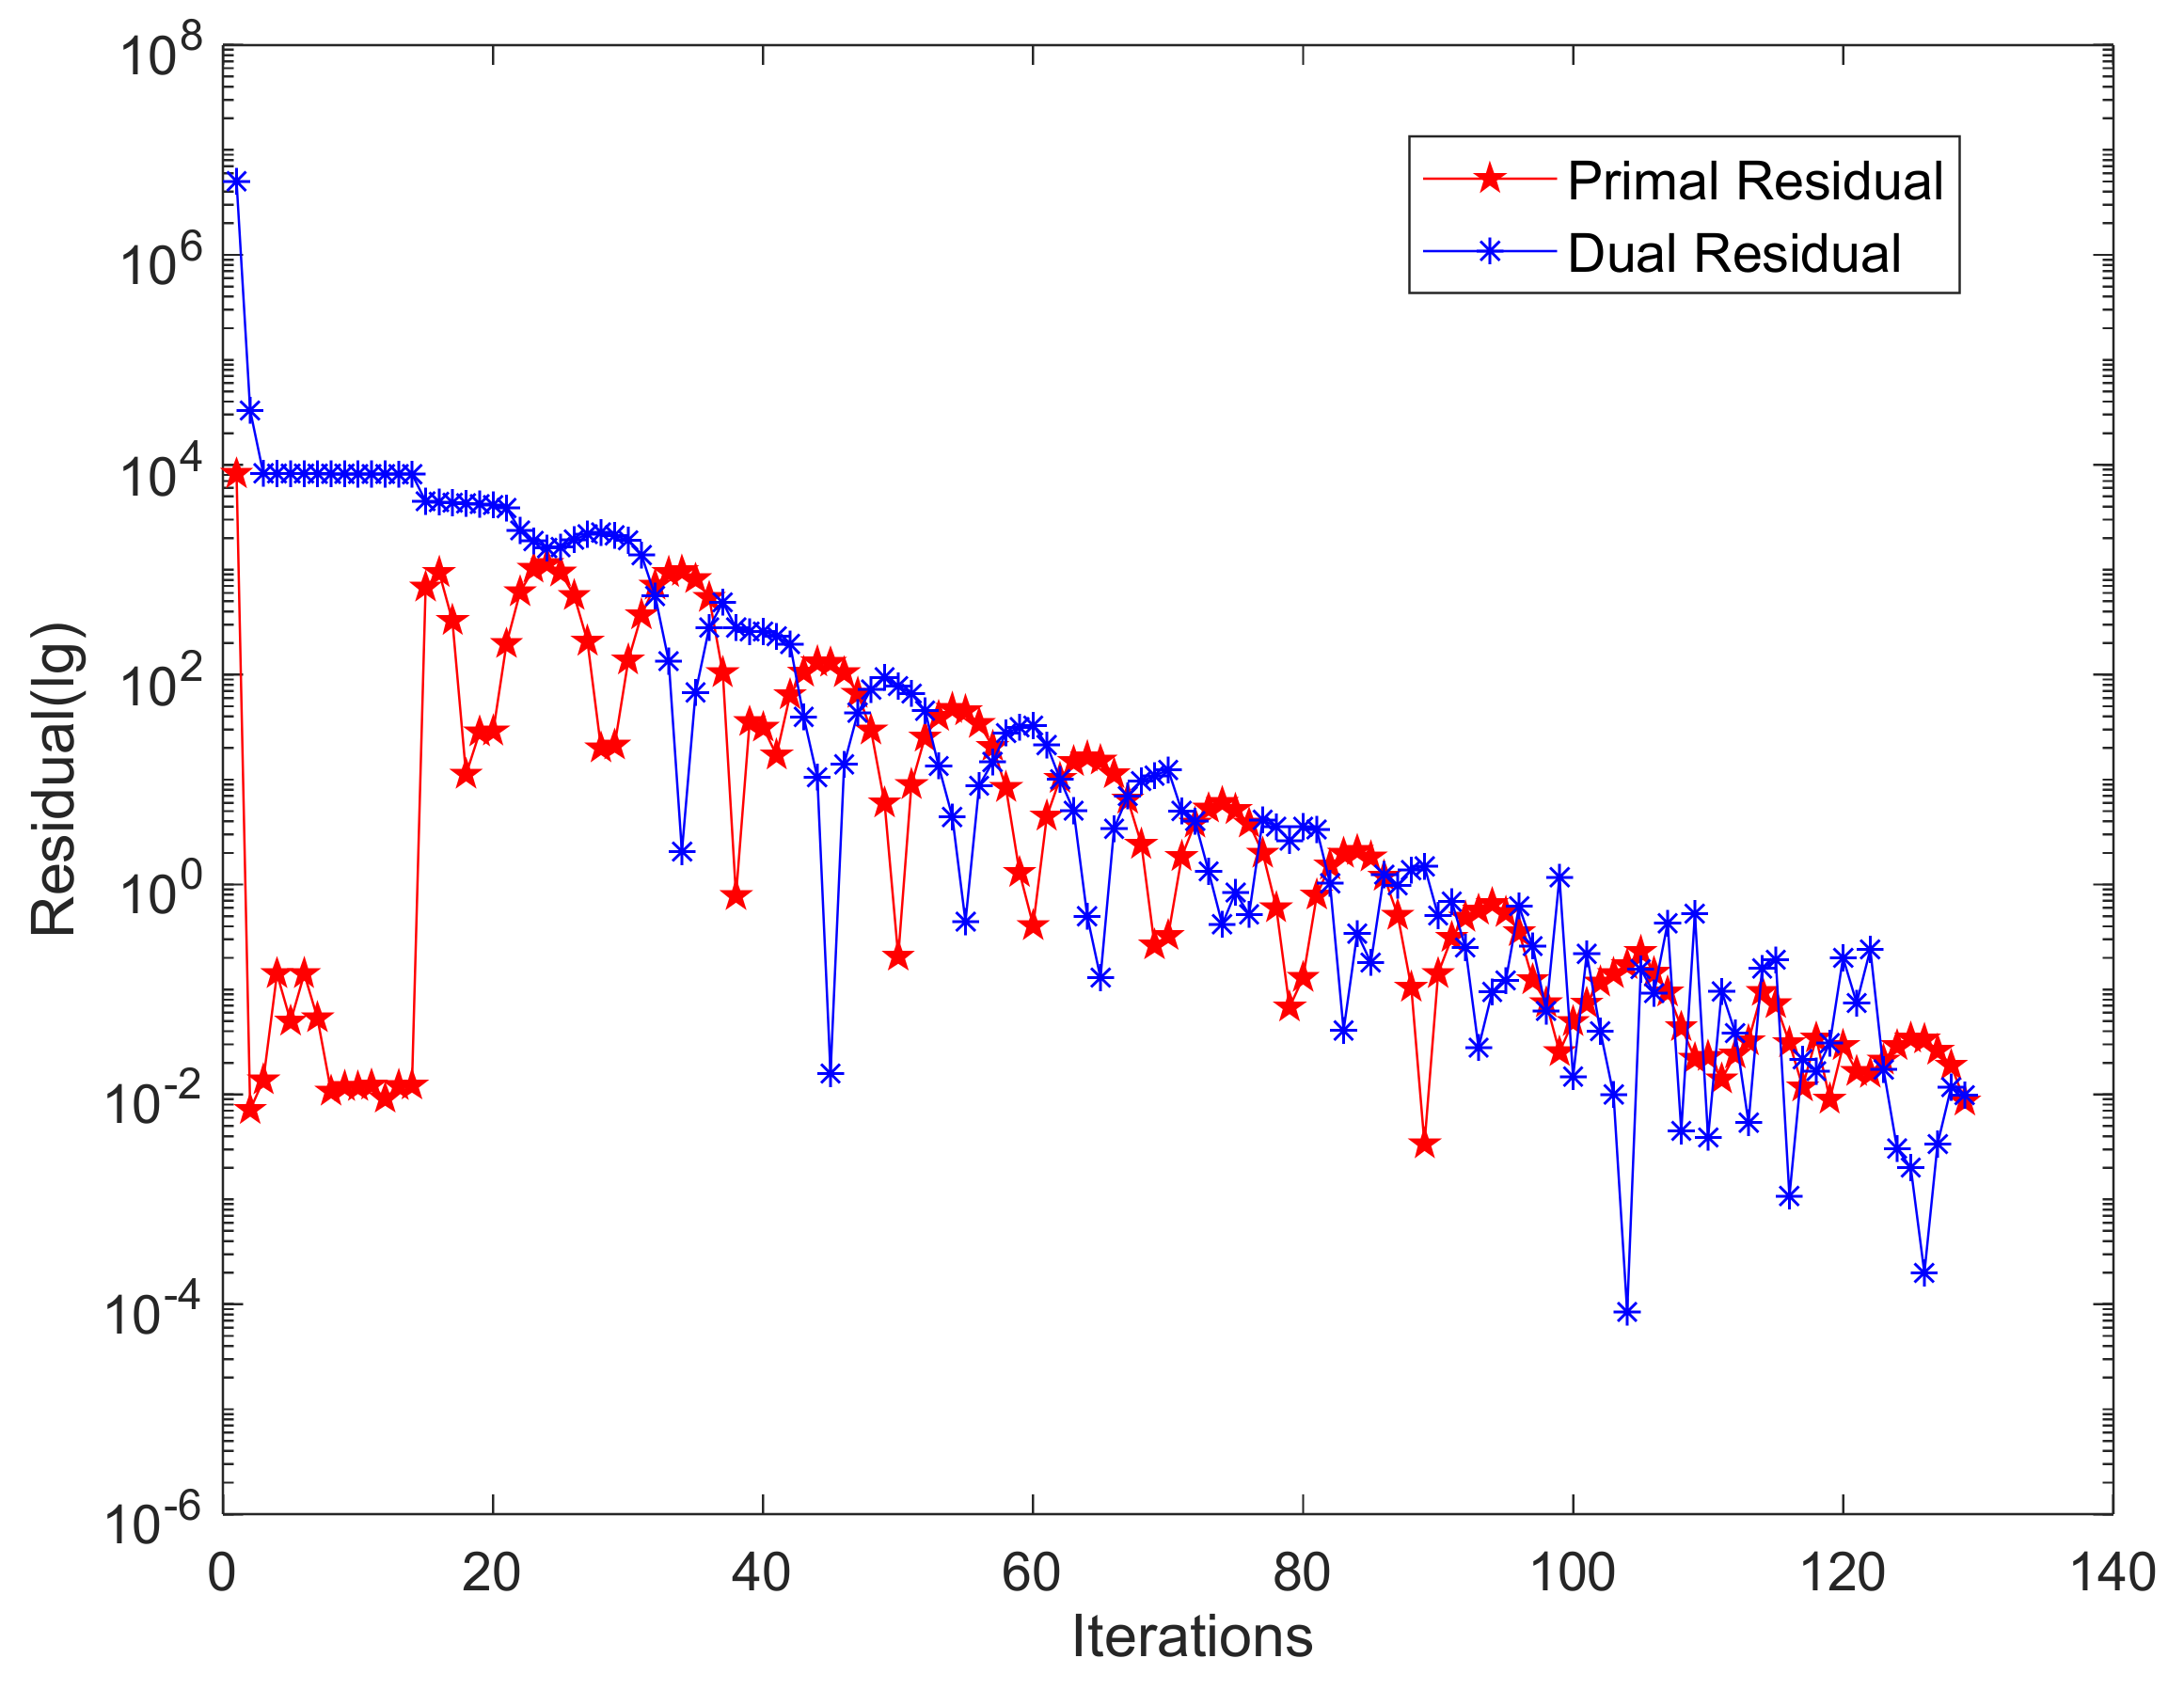
Figure 7 shows the variation of the original residuals and dual residuals with the iteration progress under the synchronous ADMM algorithm. In the 129 iterations, the residuals have a significant downward trend, showing a fluctuating decline. At the beginning of iterations, the magnitude of residual error is about 1e4, which indicates that there is a large gap in the coupling part of gas turbine. In the middle and later stage of the iteration, the residuals do not increase or decrease monotonically, but decrease gradually under small oscillation, and finally reach the convergence requirement.
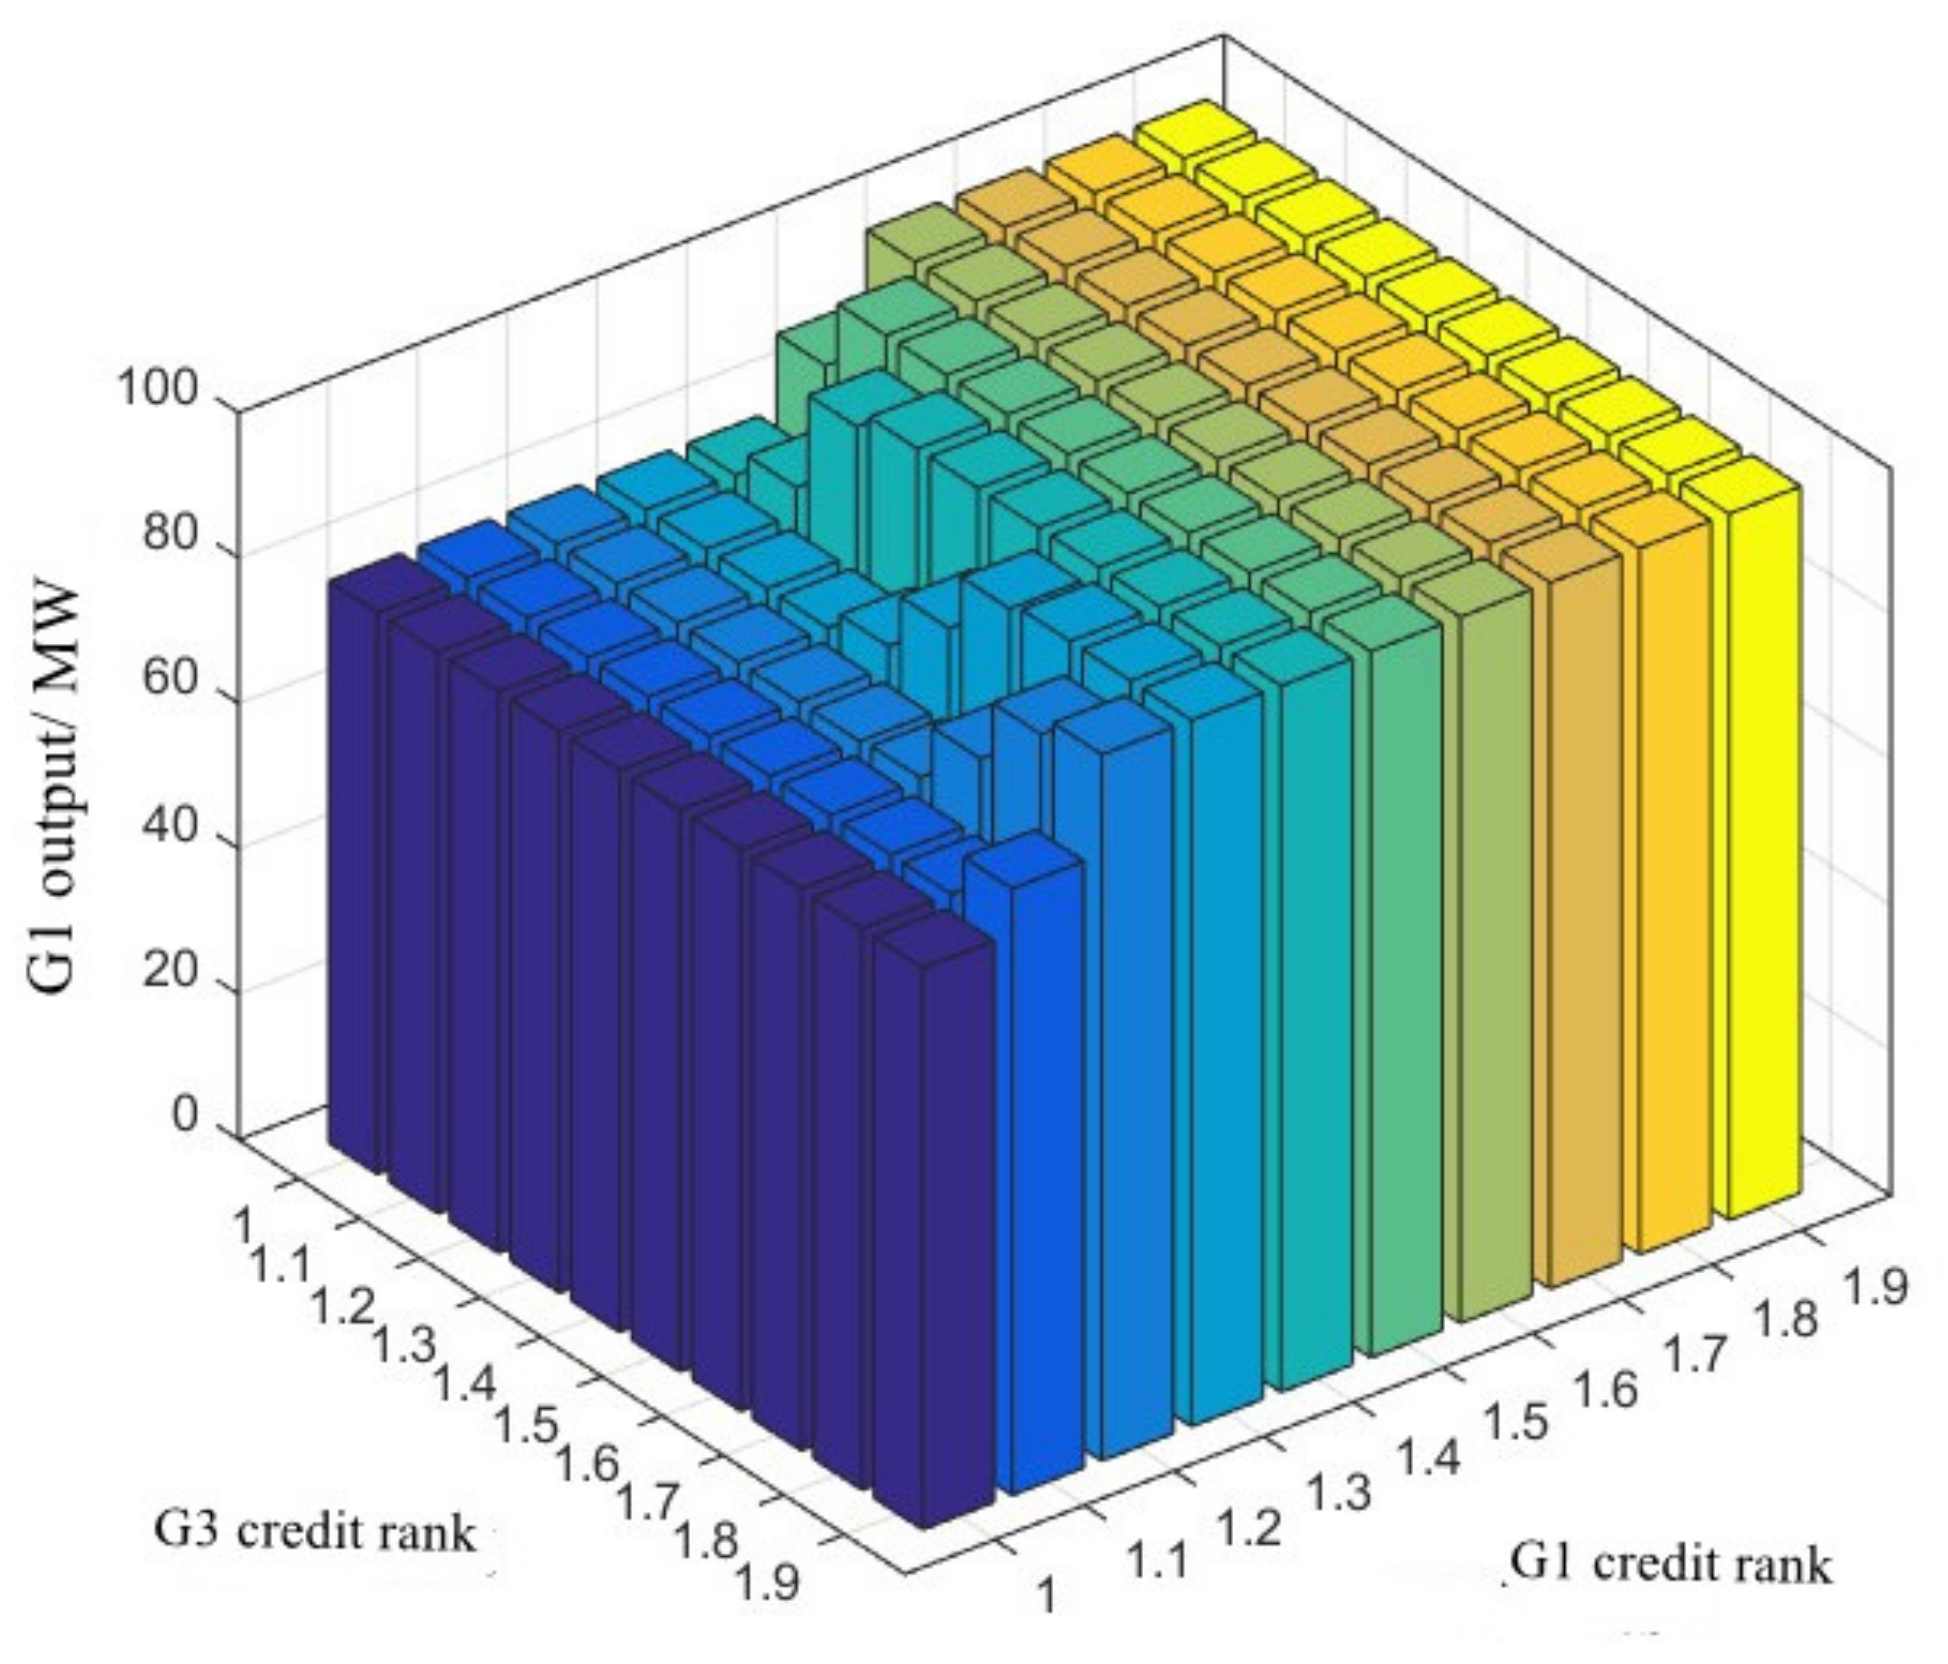
The main idea of the proposed step-by-step cooperative operation method for a power gas interconnected system is the constructed credit degree and credit value parameters, and the credit value is directly determined by the credit degree. Therefore, this part of the example mainly studies the influence of credit degree on the effectiveness of the proposed method. First, it should be noted that, because the cost, the coefficient of G2 is higher than that of other units. The minimum output is maintained, so the credit degree is set to a fixed value of 1. It mainly analyzes the change and influence of credit degree of G1 and G3. Credit degree indicates the quantitative degree of the relationship between the actual gas consumption of gas units and the constraints generated by gas units. It is suitable for gas network managers to evaluate large gas users. Figure 8 shows the output of gas turbine G1 under different credit combinations under step-by-step coordinated operation, and the credit degree of G1 is 1-1. 9, the interval is 0. 1, G3 credit rating is 1-1. 9, the interval is 0. 1.
A one-hour operation between electricity and the natural gas network was analyzed. An economic dispatch model was adopted in electricity system and an hourly steady-state gas flow model was adopted in the natural gas system [19]. Concurrently, the gas flow upper limit is similar for the comparison.
This study illustrates the overall advantage obtained from the proposed framework CO, as compared to the other usual methods for coordinated operation of natural gas and electricity networks.
Table 3 shows that performance comparison between DO, alternating direction method of multipliers (ADMM) and CO. It is observed that ADMM requires a longer time to obtain a solution. The convergence time for DO and CO are nearly the same. However, DO cannot produce better solutions under congestions and demand response situations, so CO gives the best overall performance. Due to the information asymmetry of the coupled gas units in the discrete operation, the natural gas required by the gas units in the power grid dispatching has no solution in the gas grid dispatching, that is, the dispatching is unbalanced. The dispatching unbalance of the discrete operation in the table comes from G1, and the specific reasons have been explained in the previous paper. In the operation cost of the two networks, due to the reduction in power generation and gas supply, the operation cost of discrete operation of the two networks is lower than that of other operation modes, but the existence of dispatching imbalance requires the power grid to pay a higher price. In terms of solution time, the optimization time of step-by-step collaborative operation is 1.04s, which is larger than that of discrete operation and much smaller than that of ADMM operation. The reason why the time difference is so large is that the optimization times of each mode are different. The discrete operation mode solves the electric network subproblem and the gas network subproblem once. The step-by-step cooperative operation model solves the electric network subproblem once and the gas network subproblem twice. When the synchronous ADMM runs for 129 iterations, the electric network subproblem and the gas network subproblem are solved for 129 iterations, the asynchronous ADMM only runs for 35 iterations. The solution of the gas network subproblem is the multi-layer iterative sequential cone optimization method, as proposed in this paper.
Under the research background of the collaborative operation of the electricity-gas interconnection system, this case shows the specific modes and advantages and disadvantages of the discrete operation of the electricity-gas interconnection system, the coordinated operation, based on the alternating direction multiplier method, and the proposed step-by-step collaborative operation method. The following observations are obtained:
  • The discrete operation mode of the electricity-gas interconnection system will produce unbalanced coupling dispatch when the gas network is blocked, and the gas generators cannot get enough natural gas supply, which does not meet the optimal economic dispatch decision-making results.
  • Based on the alternating direction multiplier method, the coordinated scheduling of the electricity-gas interconnection system can be realized. It can be divided into asynchronous and synchronous cooperative operation modes with or without the participation of third-party organizations. The above two modes can achieve coordinated scheduling when gas network pipelines are blocked, that is, gas generating units can get enough natural gas supply, and there will be no unbalanced coupling scheduling due to asymmetric information.
  • This case proposes a new idea of realizing step-by-step coordinated operation, based on credit indicators, and establishes a corresponding mathematical model and specific operation framework. This operating mode belongs to the concept of distributed scheduling. Through case analysis, the feasibility and superiority of the proposed method are discussed, and the sensitivity analysis of credit changes is carried out. Compared with other methods, the proposed method has the advantages of simplicity, reliability, and strong applicability.

5.2. Impact Due to Congestion and Demand Response

In this simulation, the impact due to congestion and demand response, with the same fuel price for all units, is adopted for investigation. Load shedding is added to avoid imbalance between load and generation. It is assumed that all NGFUs have an initial credit rank of 0.5, the entire scheduling time is for four days, and an hour is taken as a time step.
The advantages of the proposed framework applied to daily scheduling for a few days are illustrated with the following case studies:
  • Case 1: Decentralized and coordinated operation without natural gas pipelines congestion.
  • Case 2: Decentralized and coordinated operation with natural gas pipelines congestion.
  • Case 3: Decentralized and coordinated operation considering demand response (Based on Case 2).
For Case 1, the natural gas supply capacity of the natural gas network to NGFUs is redundant. Because the gas consumption of NGFUs in ENO optimal scheduling is feasible for GNO, so the cost of ENO in DO is minimum and with no-load shedding.
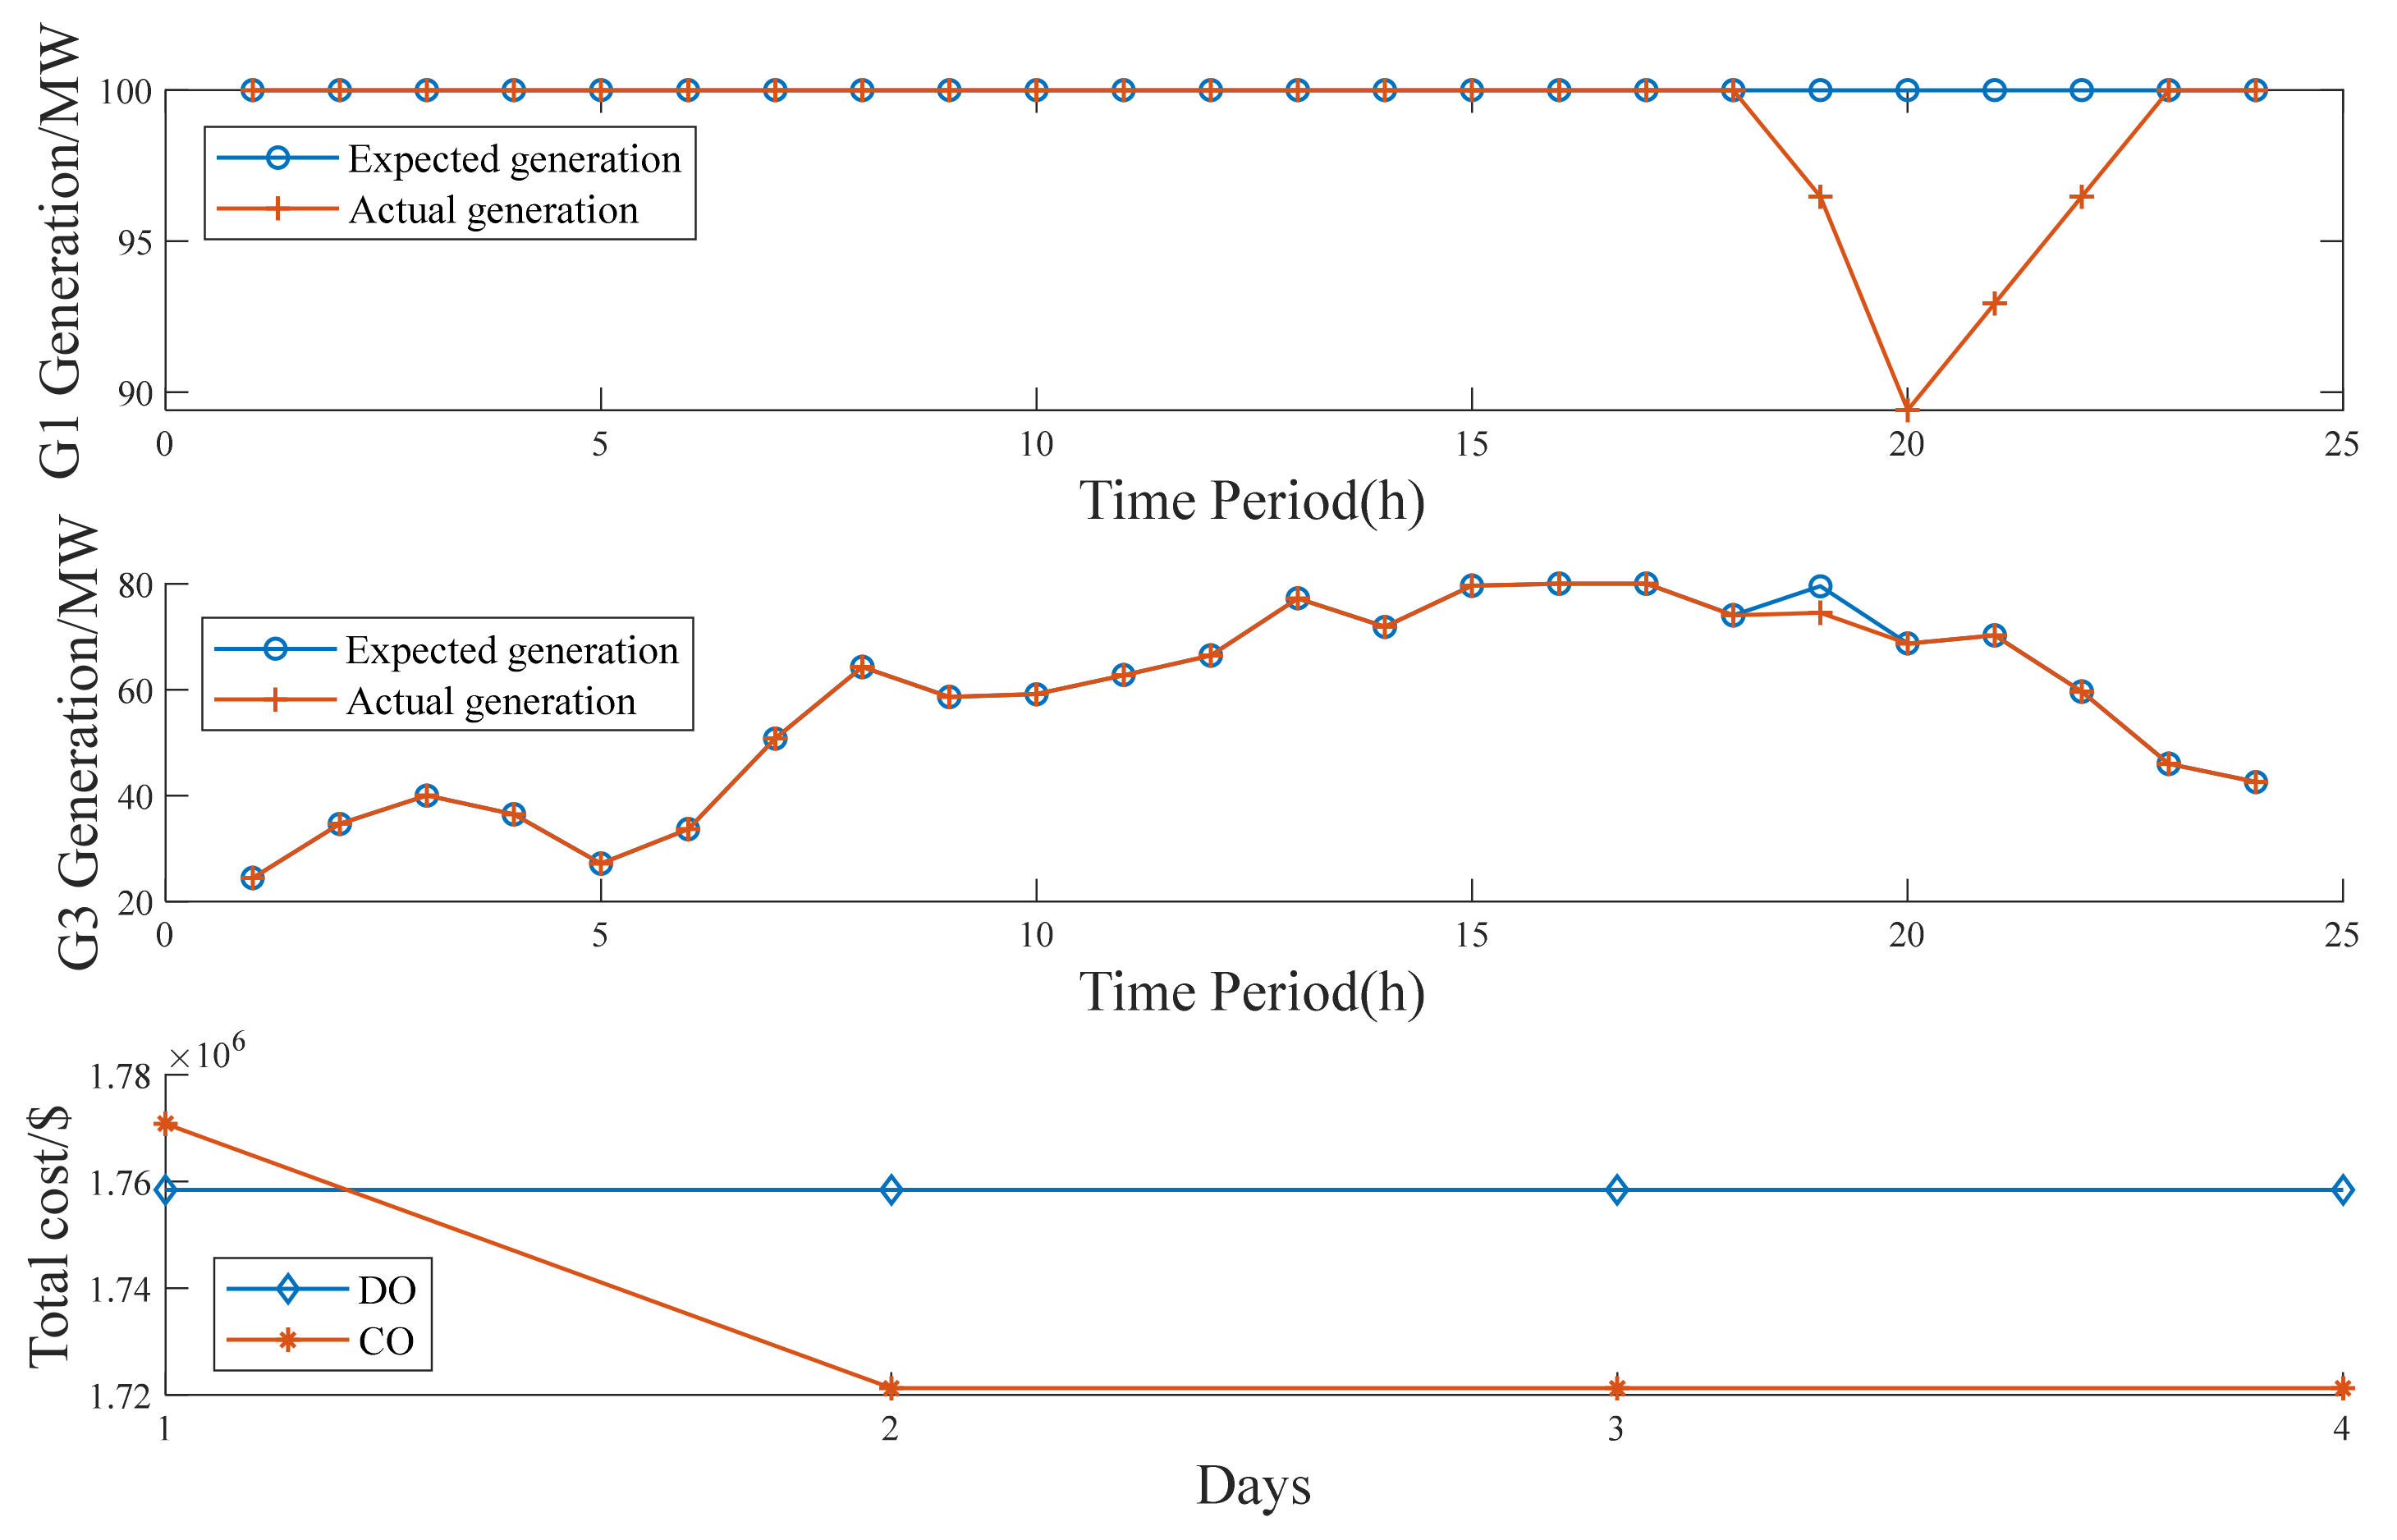
The hourly cost, total cost of ENO, and hourly generation of G1 are shown in Figure 9. It can be seen that DO hourly cost of the electricity network is less than CO for day 1, the main reason is due to the CR parameter is introduced in CO and has an initial credit rank of 0.5 at first day of optimization. CO has not reached the optimization. In Case 1, without natural gas pipelines congestion, the gas consumption in ENO optimization scheduling is feasible for GNO. Therefore, the cost of ENO in DO is the smallest. After updating the CR, DO total cost of the electricity network is same as that of CO, the scheduling results of the two coordinated operation methods are consistent.
Table 4 shows the gap of the iteration process with various expansion points. SCP with initial point achieved by the penalty function is denoted as penalty function (PF) initial. Zero initial means SCP with zero initial points [56]. The gap of the proposed method reduces greatly, and the accuracy will converge 5 iterations later. The zero-point method will converge after 6 iterations. The proposed method has quicker convergence characteristics, while the zero-point method convergence is slower [57].
Case 2: According to steady-state natural gas flow model, the gas flow in pipelines depends on the first and last node pressure. To simplify the debugging process, we included the gas flow upper limit on pipeline 1 and pipeline 4 in this case.
Pipeline congestion at hours 19–22 is a peak period for both electricity and gas networks in decentralized operation. Pipeline congestion creates the difference between expected generation and actual generation of NGFUs in DO. Figure 10 shows the output of gas-fired units with the optimal economic dispatch of the power grid and the discrete operation of the electricity-gas interconnection system. For the gas unit G1, under the condition of economic dispatch, the output has been kept at full capacity, but when considering the natural gas network constraints, in the discrete operation mode, due to the blockage of pipeline 1 during the period 19–22, G1 cannot get enough gas supply. The output is affected, and there is an imbalance in coupled scheduling. For gas-fired unit G3, in the discrete operation mode, pipeline 3 was blocked during the period 19–21. G3 could not get enough gas supply and there was also unbalanced coupling scheduling. This shows that in the case of natural gas network constraints, once the gas network pipeline is blocked, it will have a negative impact on the grid dispatching. The actual power generation is fewer than the expected one in hour 19–22, and part of the load is not satisfied in DO, so load shedding has to take place. CO total electricity cost is slightly higher than that in DO on the first day, but there is no load shedding. Electricity operation cost will be minimum on the next day in the proposed framework.
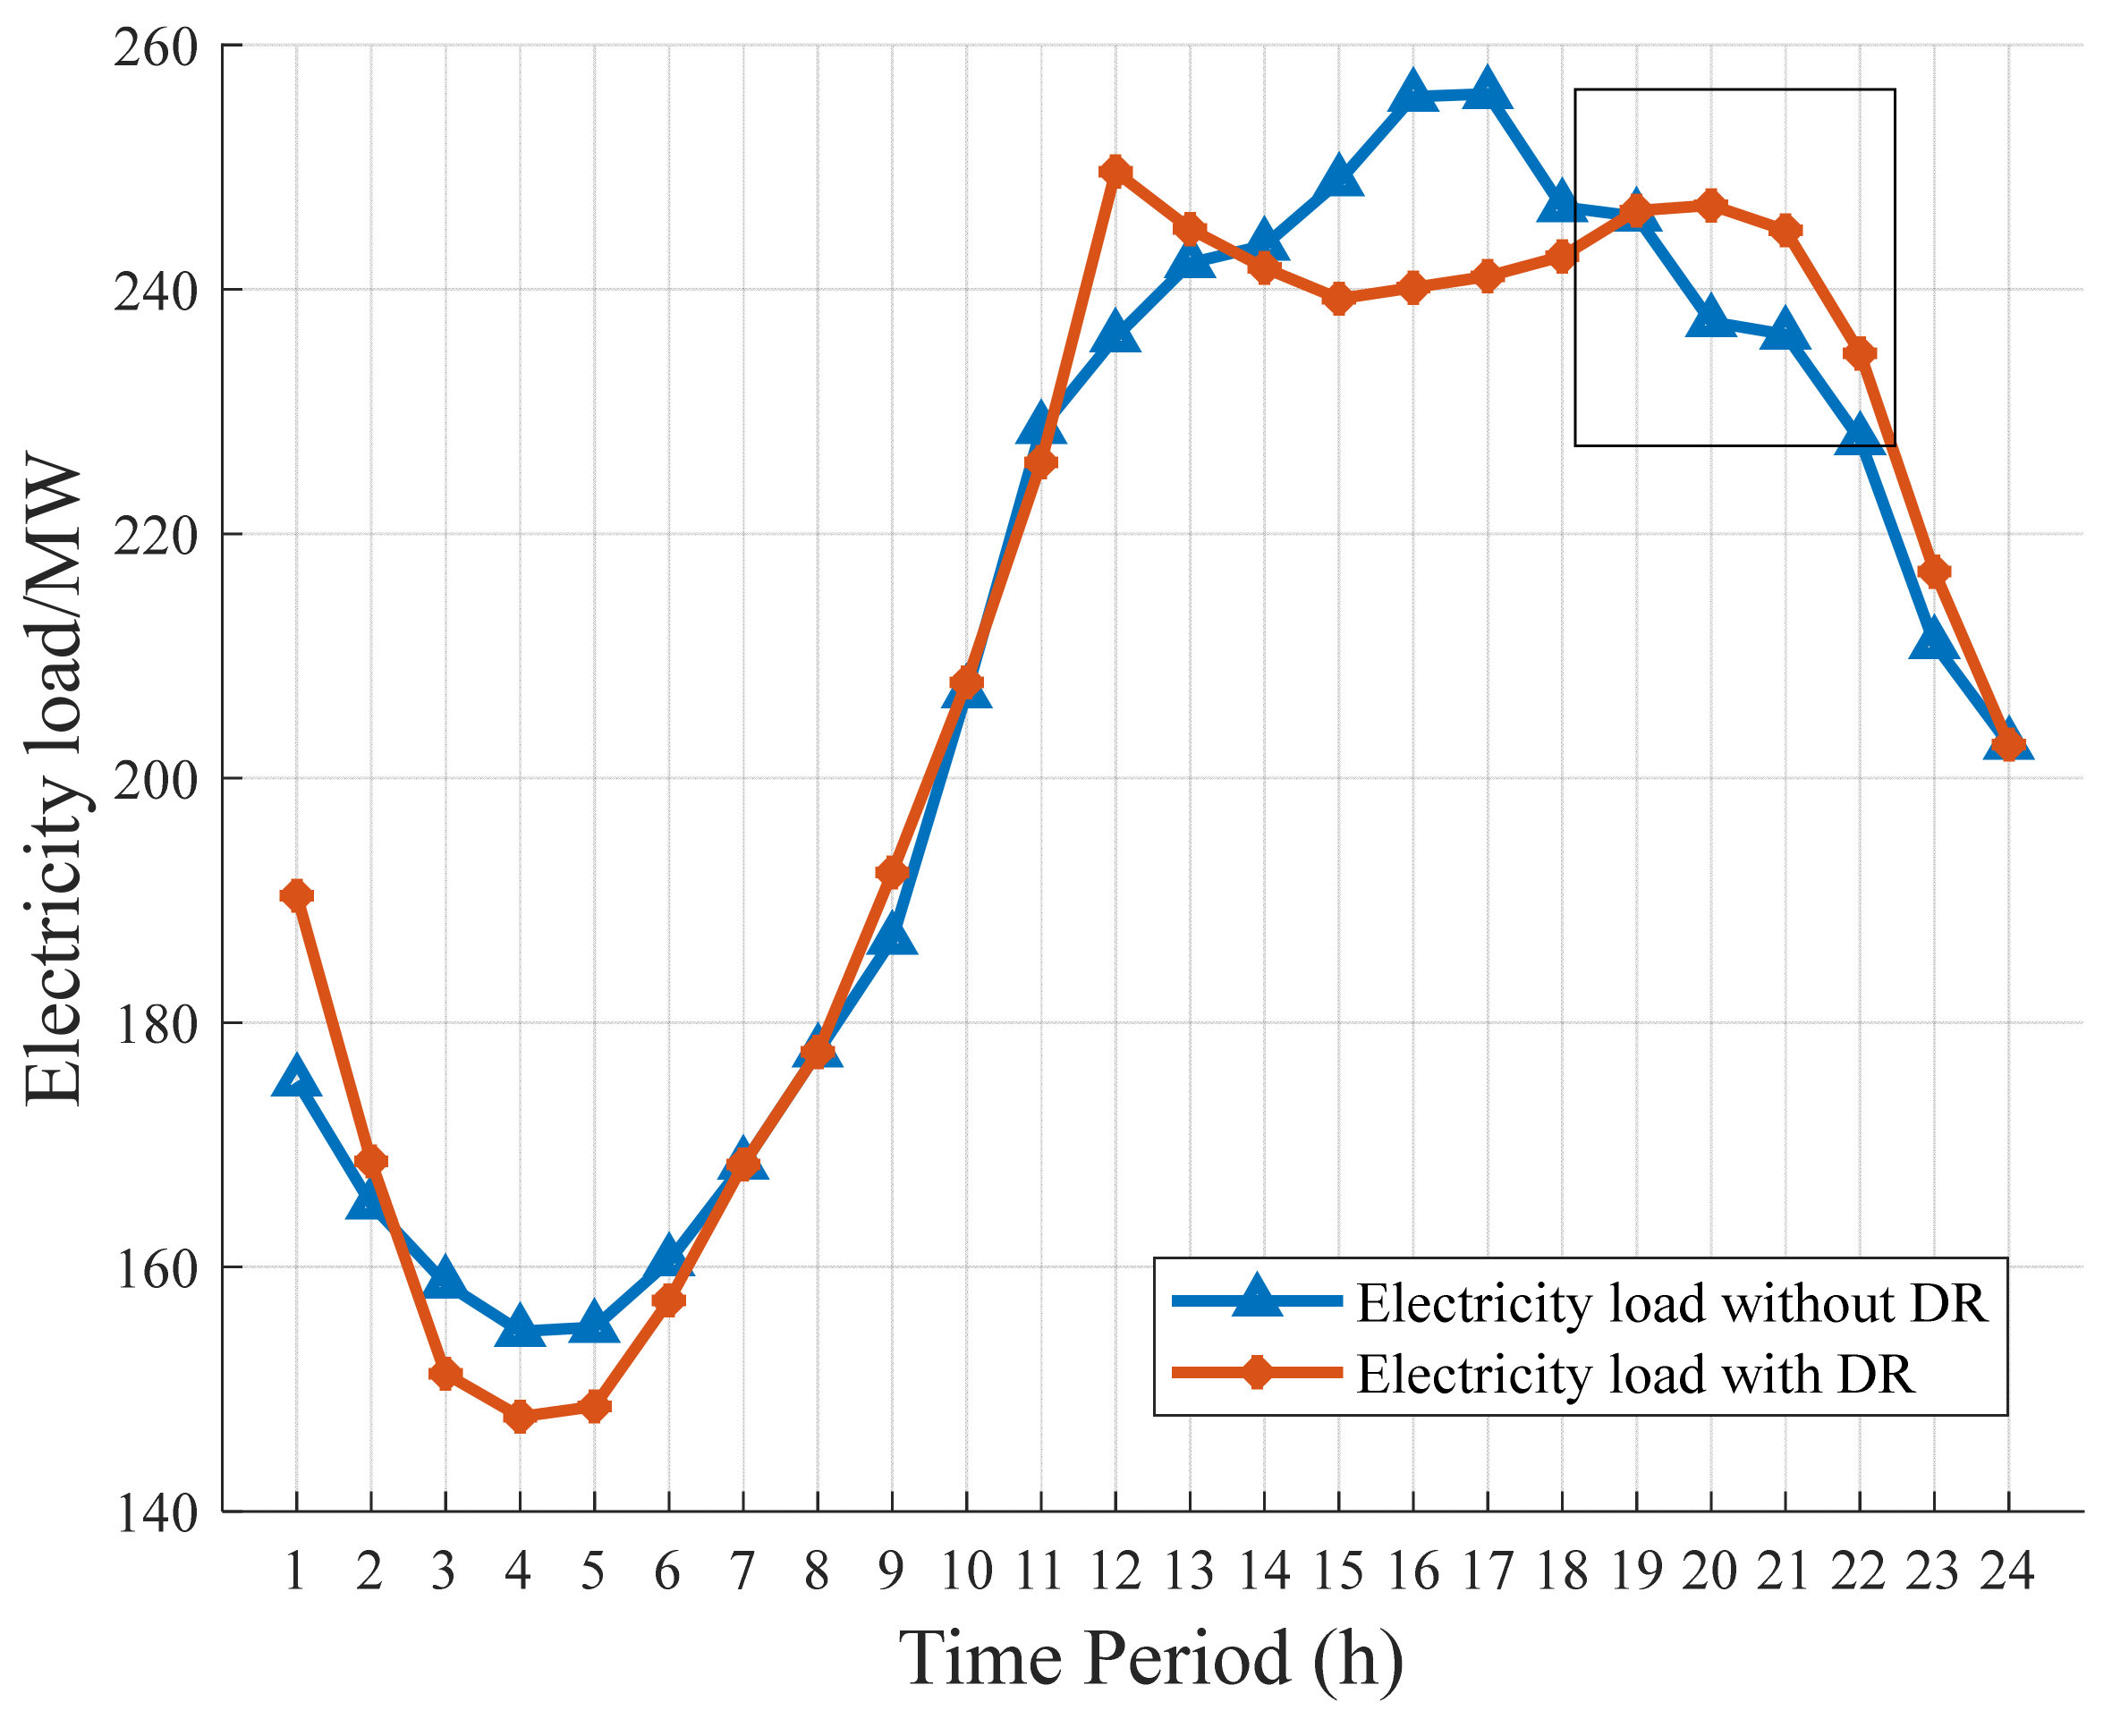
Case 3: The demand response program is considered, and the electricity load is shown in Figure 10. There is increased load in the pipeline congestion period when DR becomes effective. This will cause a more serious gas shortage of NGFUs, and insufficient generation of electricity network as compared to Case 2. Table 5 provides gas shortage and load shedding information with different operation modes. The unbalanced amount of coupled dispatch increased due to the addition of demand response action. The reason is that, due to the consideration of time-of-use electricity prices, electricity price-sensitive loads will be adjusted according to changes in electricity prices, and electricity demand will increase during the period when the gas network pipeline is blocked. This adjustment supply gap is enlarged. As shown in Figure 11, due to the addition of price-based demand response action, the power demand shifts from the peak period (14–19 h) to the valley period (3–6 h), and the load in the valley period increases. The peak load is reduced, so the peak-valley difference is reduced, and the effect of demand response is reflected. However, at 20–22 h, because the demand response action increases the power demand, the load curve is larger than the original curve, so the unbalanced amount of coupled dispatch increases. At 19 h, due to the peak load period, regardless of whether demand response is considered or not, G1 and G3 remain at full output. The impact of the gas network on scheduling does not change due to demand response, so the unbalanced amount of coupled scheduling remains unchanged.
Table 6 shows the total cost of the electricity network with different operation modes in different cases. In DO pipeline congestion cases, the addition of a demand response program not only promotes the reduction in costs but also increases profit. CO mode can solve this problem with a great extent, not only minimizing the negative impact of DR, but also reducing load shedding.
The work demonstrates that demand response can achieve benefits, for example, to reduce congestion so as to improve energy supply security and enhance low-carbon economy. The use of gas storage is no double can improve co-ordination with electricity network operation. This gives a direction for future work to study the gas storage investment in detail. A similar approach derived from electrical energy storage (EES) may be considered. At present, EES, such as lithium-ion (Li-ion) batteries, can reduce curtailment of renewables, maximizing renewable utilization by storing surplus electricity. Several techno-economic analyses have been performed on EES, but few have investigated the financial performance. However, [58] presents a state-of-the-art financial model obtaining novel and significative financial and economics results when applied to Li-ion EES. A discounted cash flow model for the Li-ion EES is introduced and applied to examine the financial performance of different EES operating scenarios. It is expected that similar approaches could be investigated for investment purposes for gas storage [59,60]. It is believed that co-ordination of electricity and gas networks could benefit the transition from fossil fuel energy to clean energy with net-zero emission by 2050.

6. Conclusions and Future Work

This paper proposed an innovative coordinated operation framework for natural gas and electricity networks to effectively solve the optimization problem of the operation of integrated gas and electricity systems. The modeling approach developed is applied to demonstrate the benefits of an integrated approach to the operation of interdependent gas and electricity systems. In addition, the novel coordinated operation framework changes the traditional decision sequence. GNO as an advance decision-maker provides NGFUs gas consumption constraints to ENO. With this framework, it is possible to avoid frequent information interaction and without a third coordinator. This framework will not affect the local optimal scheduling for both the electricity network and the natural gas network. The modeling indicates that, in pipeline congestion situations, this framework for CO reduces the impact on the electricity network as compared to that of DO. At the same time, it improves DR program acceptance of electricity networks and prevents massive load shedding. The proposed framework can produce more cost-effective solutions as compared to other methods, such as ADMM. It was demonstrated that CO with demand response can reduce the electricity network total cost by 1.19% when pipeline congestion occurs, as compared to −0.48% using traditional decentralized operation with demand response.
Future work will investigate the application of a coordinated operation framework to a very large-scale, multi-area system with gas and electricity networks managed by different operators. Sensitivity analysis of credit rank will also be studied in detail. The credit rank will be further developed to form in the hope of a guideline or recommended practices. Gas storage in the view of technical, economic, social, and environmental aspects will be looked at.

Author Contributions

Conceptualization, C.S.L., X.L. and L.L.L.; methodology, C.S.L., M.Y., L.L.L. and Y.X.; software, Y.X.; formal analysis, C.S.L., M.Y. and Y.X.; investigation, C.S.L., M.Y. and Y.X.; resources, C.S.L., X.L. and L.L.L.; data curation, C.S.L. and Y.X.; writing—original draft preparation, C.S.L., L.L.L. and Y.X.; writing—review and editing, C.S.L., X.L., and L.L.L.; supervision, L.L.L.; project administration, X.L.; funding acquisition, X.L. and L.L.L. All authors have read and agreed to the published version of the manuscript.

Funding

The work is sponsored by the Department of Finance and Education of Guangdong Province 2016 [202]: Key Discipline Construction Program, China; and the Education Department of Guangdong Province: New and Integrated Energy System Theory and Technology Research Group [Project Number 2016KCXTD022].

Institutional Review Board Statement

Not applicable.

Informed Consent Statement

Not applicable.

Data Availability Statement

Not applicable.

Conflicts of Interest

The authors declare no conflict of interest.

Nomenclature

Indices and Sets:
t Index of time periods
i Index of thermal units
b Index of buses
r Index of renewable energy
b r Index of power transmission lines
j , l Index of buses in the electricity network
m , n Index of gas nodes
s Index of gas wells
m n Index of gas pipelines
g l Index of resident natural gas load
G U Set of NGFUs
N G U Set of non-NGFUs
Parameters:
N T Number of time periods
N B Number of thermal units
N R Number of renewable power generators
N P Number of gas pipelines
N s Number of gas wells
N L Number of resident gas load
P i min , P i max Minimum and maximum output of unit i
U R i , D R i Ramp up/down limits of unit i
T i o n , T i o f f Minimum on/off time of unit i
α c , β c , γ c Cost coefficient of non-NGFUs
α g , β g , γ g Fuel coefficient of NGFUs
s u i Startup cost coefficient of unit i
η Natural gas contract price of NGFUs.
P r , t W Forecast of renewable energy r at hour t
p f b r max Maximum power flow of power transmission line br
x j k Reactance between bus j and k
D i n i Initial electrical load
p i n i Initial electricity price
E Price-elastic matrix of electrical load
C S min Minimum customer’s satisfaction
C m n Weymouth constant of pipelines
W s min , W s max Minimum and maximum production of gas well s
τ s Cost coefficient of gas well s
τ g l Gas price of resident natural gas load
L Resident natural gas load
K P Bus-thermal unit incidence matrix
K W Bus-renewable unit incidence matrix
K D Bus-electrical load incidence matrix
K L Bus-branch incidence matrix
T w Node-gas well incidence matrix
T g Node-NGFUs incidence matrix
T l Node-resident natural gas load incidence matrix
T f Node-gas pipe incidence matrix
φ Pre-set constants
Variables:
G i , t c Cost of non-NGFU i at hour t
G i , t g Fuel consumption of NGFU i at hour t in electricity network
P i , t Generation dispatch of unit i at hour t
P r , t Generation dispatch of renewable energy r at hour t
S U i , t Startup cost of unit i at hour t
u i , t Status indicator of unit i at hour t
y i , t , z i , t Indicator for startup/ shutdown of unit i at hour t
X i , t o n , X i , t o f f On/Off time of unit i at hour t
θ Bus voltage angle
p f b r Power flow on transmission line br
D Adjusted electrical load
Δ D t Variety in electrical load at hour t
Δ p t Variety in electricity price at hour t
D d e v Deviation matrix of electrical load
p d e v Deviation matrix of electricity price
C S Electricity customer’s satisfaction
W s , t Production of gas well s at hour t
ω m , t Gas pressure of gas node m at hour t
π m , t Quadratic pressure of gas node m at hour t
F m n , t Gas flow of pipeline mn at hour t
I m n , t + , I m n , t Binary indicators of gas flow direction of pipeline mn at hour t
Π , S Auxiliary variable
λ 0 , λ 1 Initial and updated credit value factor
C R 0 , C R 1 Initial and updated credit rank

References

  1. Lai, C.S.; Lai, L.L.; Lai, Q.H. Data Analytics for Solar Energy in Promoting Smart Cities, Smart Grids and Big Data Analytics for Smart Cities; Springer: Berlin/Heidelberg, Germany, 2020; pp. 173–263. [Google Scholar]
  2. Lai, C.S.; Lai, L.L.; Lai, Q.H. Blockchain Applications in Microgrid Clusters, Smart Grids and Big Data Analytics for Smart Cities; Springer: Berlin/Heidelberg, Germany, 2020; pp. 265–305. [Google Scholar]
  3. Lai, C.S.; Lai, L.L.; Lai, Q.H. Narrowband Internet of Thing-Based Temperature Prediction for Valve-Regulated Lead Acid Battery, Smart Grids and Big Data Analytics for Smart Cities; Springer: Berlin/Heidelberg, Germany, 2020; pp. 345–363. [Google Scholar]
  4. Esfandi, S.; Baloochzadeh, S.; Asayesh, M.; Ehyaei, M.A.; Ahmadi, A.; Rabanian, A.A.; Das, B.; Costa, V.A.F.; Davarpanah, A. Energy, exergy, economic, and exergoenvironmental analyses of a novel hybrid system to produce electricity, cooling, and syngas. Energies 2020, 13, 6453. [Google Scholar] [CrossRef]
  5. Clegg, S.; Mancarella, P. Integrated electrical and gas network flexibility assessment in low-carbon multi-energy systems. IEEE Trans. Sustain. Energy 2016, 7, 718–731. [Google Scholar] [CrossRef]
  6. Alizadeh, S.M.; Ghazanfari, A.; Ehyaei, M.A.; Ahmadi, A.; Jamali, D.H.; Nedaei, N.; Davarpanah, A. Investigation the Integration of Heliostat Solar Receiver to Gas and Combined Cycles by Energy, Exergy, and Economic Point of Views. Appl. Sci. 2020, 10, 5307. [Google Scholar] [CrossRef]
  7. Shahidehpour, M.; Fu, Y.; Wideman, T. Impact of natural gas infrastructure on electric power systems. Proc. IEEE 2005, 93, 1042–1056. [Google Scholar] [CrossRef]
  8. Clean Energy Wire. Electricity and Gas Grids Need to Be Better Aligned in New Energy System. Available online: https://www.cleanenergywire.org/news/electricity-and-gas-grids-need-be-better-aligned-new-energy-system (accessed on 22 March 2021).
  9. Henderson, M.; Shahidehpour, M. Continuing to grow: Natural gas usage rising in electricity generation [Guest Editorial]. IEEE Power Energy Mag. 2014, 12, 12–19. [Google Scholar] [CrossRef]
  10. Wen, Y.; Qu, X.; Li, W.; Liu, X.; Ye, X. Synergistic operation of electricity and natural gas networks via ADMM. IEEE Trans. Smart Grid 2018, 9, 4555–4565. [Google Scholar] [CrossRef]
  11. Chaudry, M.; Jenkins, N.; Qadrdan, M.; Wu, J.Z. Combined gas and electricity network expansion planning. Appl. Energy 2014, 113, 1171–1187. [Google Scholar] [CrossRef]
  12. Li, T.; Eremia, M.; Shahidehpour, M. Interdependency of natural gas network and power system security. IEEE Trans. Power Syst. 2008, 23, 1817–1824. [Google Scholar] [CrossRef]
  13. Wang, D.; Qiu, J.; Meng, K.; Gao, X.; Dong, Z.Y. Coordinated expansion co planning of integrated gas and power systems. J. Mod. Power Syst. Clean Energy 2017, 5, 314–325. [Google Scholar] [CrossRef] [Green Version]
  14. Qiu, J.; Yang, H.; Dong, Z.Y.; Zhao, J.H.; Meng, K.; Luo, F.J.; Wong, K.P. A linear programming approach to expansion co-planning in gas and electricity markets. IEEE Trans. Power Syst. 2016, 31, 3594–3606. [Google Scholar] [CrossRef]
  15. He, Y.; Yan, M.; Shahidehpour, M.; Li, Z.; Guo, C.; Wu, L.; Ding, Y. Decentralized optimization of multi-area electricity-natural gas flows based on cone reformulation. IEEE Trans. Power Syst. 2018, 33, 4531–4542. [Google Scholar] [CrossRef]
  16. Canelas, E.; Pinto-Varela, T.; Sawik, B. Electricity portfolio optimization for large consumers: Iberian electricity market case study. Energies 2020, 13, 2249. [Google Scholar] [CrossRef]
  17. Hosseini, S.E.; Ahmarinejad, A. Stochastic framework for day-ahead scheduling of coordinated electricity and natural gas networks considering multiple downward energy hubs. J. Energy Storage 2021, 33, 102066. [Google Scholar] [CrossRef]
  18. Hemmati, M.; Abapour, M.; Mohammadi-Ivatloo, B.; Anvari-Moghaddam, A. Optimal operation of integrated electrical and natural gas networks with a focus on distributed energy hub systems. Sustainability 2020, 12, 8320. [Google Scholar] [CrossRef]
  19. Manshadi, S.D.; Khodayar, M.E. Coordinated operation of electricity and natural gas systems: A convex relaxation approach. IEEE Trans. Smart Grid 2019, 10, 199–210. [Google Scholar] [CrossRef]
  20. Bai, L.; Li, F.; Jiang, T.; Jia, H. Robust scheduling for wind integrated energy systems considering gas pipeline and power transmission N-1 contingencies. IEEE Trans. Power Syst. 2017, 32, 1582–1584. [Google Scholar] [CrossRef]
  21. He, C.; Wu, L.; Liu, T.; Shahidehpour, M. Robust co-optimization scheduling of electricity and natural gas systems via ADMM. IEEE Trans. Sustain. Energy 2017, 8, 658–670. [Google Scholar]
  22. An, S.; Li, Q.; Gedra, T.W. Natural gas and electricity optimal power flow. In Proceedings of the 2003 IEEE PES Transmission and Distribution Conference and Exposition (IEEE Cat. No.03CH37495), Dallas, TX, USA, 7–12 September 2003; pp. 138–143. [Google Scholar]
  23. Liu, C.; Shahidehpour, M.; Fu, Y.; Li, Z. Security-constrained unit commitment with natural gas transmission constraints. IEEE Trans. Power Syst. 2009, 24, 1523–1536. [Google Scholar]
  24. Alabdulwahab, A.; Abusorrah, A.; Zhang, X.; Shahidehpour, M. Coordination of interdependent natural gas and electricity infrastructures for firming the variability of wind energy in stochastic day-ahead scheduling. IEEE Trans. Sustain. Energy 2015, 6, 606–615. [Google Scholar] [CrossRef]
  25. Bai, L.; Li, F.; Cui, H.; Jiang, T.; Sun, H.; Zhu, J. Intervaloptimization based operating strategy for gas-electricity integrated energy systems considering demand response and wind uncertainty. Appl. Energy 2016, 167, 270–279. [Google Scholar] [CrossRef] [Green Version]
  26. Zhang, X.; Shahidehpour, M.; Alabdulwahab, A.; Abusorrah, A. Hourly electricity demand response in the stochastic day-ahead scheduling of coordinated electricity and natural gas networks. IEEE Trans. Power Syst. 2016, 31, 592–601. [Google Scholar] [CrossRef]
  27. Zhao, B.; Zlotnik, A.; Conejo, A.J.; Sioshansi, R.; Rudkevich, A.M. Shadow price-based co-ordination of natural gas and electric power systems. IEEE Trans. Power Syst. 2019, 34, 1942–1954. [Google Scholar] [CrossRef]
  28. Morals, M.S.; Lima, J.W.M. Natural gas network pricing and its influence on electricity and gas markets. In Proceedings of the 2003 IEEE Bologna Power Tech Conference, Bologna, Italy, 23–26 June 2003. [Google Scholar]
  29. Wang, C.; Wei, W.; Wang, J.; Liu, F.; Mei, S. Strategicoffering and equilibrium in coupled gas and electricity markets. IEEE Trans. Power Syst. 2018, 33, 290–306. [Google Scholar] [CrossRef]
  30. Shao, C.; Wang, X.; Shahidehpour, M.; Wang, X.; Wang, B. An MILP-based optimal power flow in multicarrier energy systems. IEEE Trans. Sustain. Energy 2017, 8, 239–248. [Google Scholar] [CrossRef]
  31. Urbina, M.; Li, Z. A combined model for analyzing the interdependency of electrical and gas systems. In Proceedings of the 2007 39th North American Power Symposium, Las Cruces, NM, USA, 30 September–2 October 2007; pp. 468–472. [Google Scholar]
  32. Andre, J.; Bonnans, F.; Cornibert, L. Optimization of capacity expansion planning for gas transportation networks. Eur. J. Oper. Res. 2009, 197, 1019–1027. [Google Scholar] [CrossRef]
  33. Xu, F.Y.; Zhang, T.; Lai, L.L.; Zhou, H. Shifting boundary for price-based residential demand response and applications. Appl. Energy 2015, 146, 353–370. [Google Scholar] [CrossRef]
  34. Subramanian, A.S.R.; Gundersen, T.; Adams, T.A. Modeling and simulation of energy systems: A review. Processes 2018, 6, 238. [Google Scholar] [CrossRef] [Green Version]
  35. Lai, S.C.; Locatelli, G.; Pimm, A.; Wu, X.; Lai, L.L. A review on long-term electrical power system modeling with energy storage. J. Clean. Prod. 2021, 280, 124298. [Google Scholar] [CrossRef]
  36. Zhao, B.; Conejo, A.J.; Sioshansi, R. Unit commitment under gas supply uncertainty and gas-price variability. IEEE Trans. Power Syst. 2017, 32, 2394–2405. [Google Scholar] [CrossRef]
  37. Chertkov, M.; Fisher, M.; Backhaus, S.; Bent, R.; Misra, S. Pressure fluctuations in natural gas networks caused by gas-electric coupling. In Proceedings of the 48th Hawaii International Conference on System Sciences, Hawaii, HI, USA, 5–8 January 2015; pp. 2738–2747. [Google Scholar] [CrossRef] [Green Version]
  38. Hejazi, A.; Mashhadi, H. Effects of natural gas network on optimal operation of gas-fired power plants. In Proceedings of the 6th Conference Thermal Power Plants, Teheran, Iran, 19–20 January 2016; pp. 105–110. [Google Scholar] [CrossRef]
  39. Behrooz, H.; Boozarjomehry, R. Dynamic optimization of natural gas networks under customer demand uncertainties. Energy 2017, 134, 968–983. [Google Scholar] [CrossRef]
  40. Qadrdan, M.; Wu, J.; Jenkins, N.; Ekanayake, J. Operating strategies for a GB integrated gas and electricity network considering the uncertainty in wind power forecasts. IEEE Trans. Sustain. Energy 2014, 5, 128–138. [Google Scholar] [CrossRef]
  41. Odetayo, B.; MacCormack, J.; Rosehart, W.; Zareipour, H. A sequential planning approach for distributed generation and natural gas networks. Energy 2017, 127, 428–437. [Google Scholar] [CrossRef]
  42. Correa-Posada, C.; Sánchez-Martín, P. Integrated power and natural gas model for energy adequacy in short-term operation. IEEE Trans. Power Syst. 2015, 30, 3347–3355. [Google Scholar] [CrossRef]
  43. Zlotnik, A.; Roald, L.; Backhaus, S.; Chertkov, M.; Andersson, G. Coordinated scheduling for interdependent electric power and natural gas infrastructures. IEEE Trans. Power Syst. 2017, 32, 600–610. [Google Scholar] [CrossRef]
  44. Li, G.; Zhang, R.; Jiang, T.; Chen, H.; Bai, L.; Li, X. Security-constrained bi-level economic dispatch model for integrated natural gas and electricity systems considering wind power and power-to-gas process. Appl. Energy 2016, 194, 696–704. [Google Scholar] [CrossRef]
  45. Liu, C.; Shahidehpour, M.; Wang, J. Application of augmented Lagrangian relaxation to coordinated scheduling of interdependent hydrothermal power and natural gas systems. IET Gener. Transm. Distrib. 2010, 4, 1314–1325. [Google Scholar] [CrossRef]
  46. Alkano, D.; Scherpen, J. Distributed supply coordination for Powerto-Gas facilities embedded in energy grids. IEEE Trans. Smart Grid. 2017, 9, 1012–1022. [Google Scholar] [CrossRef]
  47. Khaligh, V.; Buygi, M.O.; Moghaddam, A.A.; Guerrero, J.M. Integrated expansion planning of gas-electricity system: A case study in Iran. In Proceedings of the 2018 International Conference on Smart Energy Systems and Technologies (SEST), Sevilla, Spain, 10–12 September 2018; pp. 1–6. [Google Scholar]
  48. International Gas Union. Underground Storage of Gas. Report of Working Group Committee 2, International Gas Union, June 2006. Available online: https://bgc.bg/upload_files/file/UGS.pdf (accessed on 1 March 2021).
  49. Observ’ER. Worldwide Electricity Production from Renewable Energy Sources—Stats and Figures Series; Observ’ER: Paris, France, 2013.
  50. Ojeda-Esteybar, D.M.; Rubio-Barros, R.G.; Vargas, A. Integrated operational planning of hydrothermal power and natural gas systems with large scale storages. J. Mod. Power Syst. Clean Energy 2017, 5, 299–313. [Google Scholar] [CrossRef] [Green Version]
  51. Zeng, Q.; Zhang, B.; Fang, J.; Chen, Z. A bi-level programming for multistage co-expansion planning of the integrated gas and electricity system. Appl. Energy 2017, 200, 192–203. [Google Scholar] [CrossRef]
  52. Saldarriaga, C.A.; Hincapié, R.A.; Salazar, H. A holistic approach for planning natural gas and electricity distribution networks. IEEE Trans. Power Syst. 2013, 28, 4052–4063. [Google Scholar] [CrossRef]
  53. Sánchez, C.B.; Bent, R.; Backhaus, S.; Blumsack, S.; Hijazi, H.; Hentenryck, P.V. Convex optimization for joint expansion planning of natural gas and power systems. In Proceedings of the 49th Hawaii International Conference on System Sciences (HICSS), Koloa, HI, USA, 5–8 January 2016; pp. 2536–2545. [Google Scholar]
  54. Saldarriaga-Cortés, C.; Salazar, H.; Moreno, R.; Jiménez-Estévez, G. Stochastic planning of electricity and gas networks: An asynchronous column generation approach. Appl. Energy 2019, 233–234, 1065–1077. [Google Scholar] [CrossRef]
  55. Kirschen, D.S.; Strbac, G.; Cumperayot, P.; Mendes, D.D. Factoring the elasticity of demand in electricity prices. IEEE Trans. Power Syst. 2000, 15, 612–617. [Google Scholar] [CrossRef] [Green Version]
  56. Xu, Y.; Zhao, F.; Lai, L.L.; Wang, Y. Integrated electricity and natural gas system for day-ahead scheduling. In Proceedings of the 2019 IEEE International Conference on Systems, Man and Cybernetics (SMC), Bari, Italy, 6–9 October 2019; pp. 2242–2247. [Google Scholar]
  57. Xu, Y.; Lai, L.L.; Zhao, F.; Wang, Y.; Li, X.; Lai, C.S.; Xu, F.Y. Coordinated operation of gas and electricity networks. In Proceedings of the International Conference on Applied Energy 2019, Vasteraås, Sweden, 12–15 August 2019. [Google Scholar]
  58. Lai, C.S.; Locatelli, G.; Pimm, A.; Tao, Y.; Li, X.; Lai, L.L. A financial model for lithium-ion storage in a photovoltaic and biogas energy system’. Appl. Energy 2019, 251, 113179. [Google Scholar] [CrossRef]
  59. Lai, C.S.; Jia, Y.; Xu, Z.; Lai, L.L.; Li, X.; Cao, J.; McCulloch, M.D. Levelized cost of electricity for photovoltaic/biogas power plant hybrid system with electrical energy storage degradation costs. Energy Convers. Manag. 2017, 153, 34–47. [Google Scholar] [CrossRef]
  60. Lai, C.S.; McCulloch, M.D. Sizing of stand-alone solar PV and storage system with anaerobic digestion biogas power plants. IEEE Trans. Ind. Electron. 2016, 64, 2112–2121. [Google Scholar] [CrossRef]
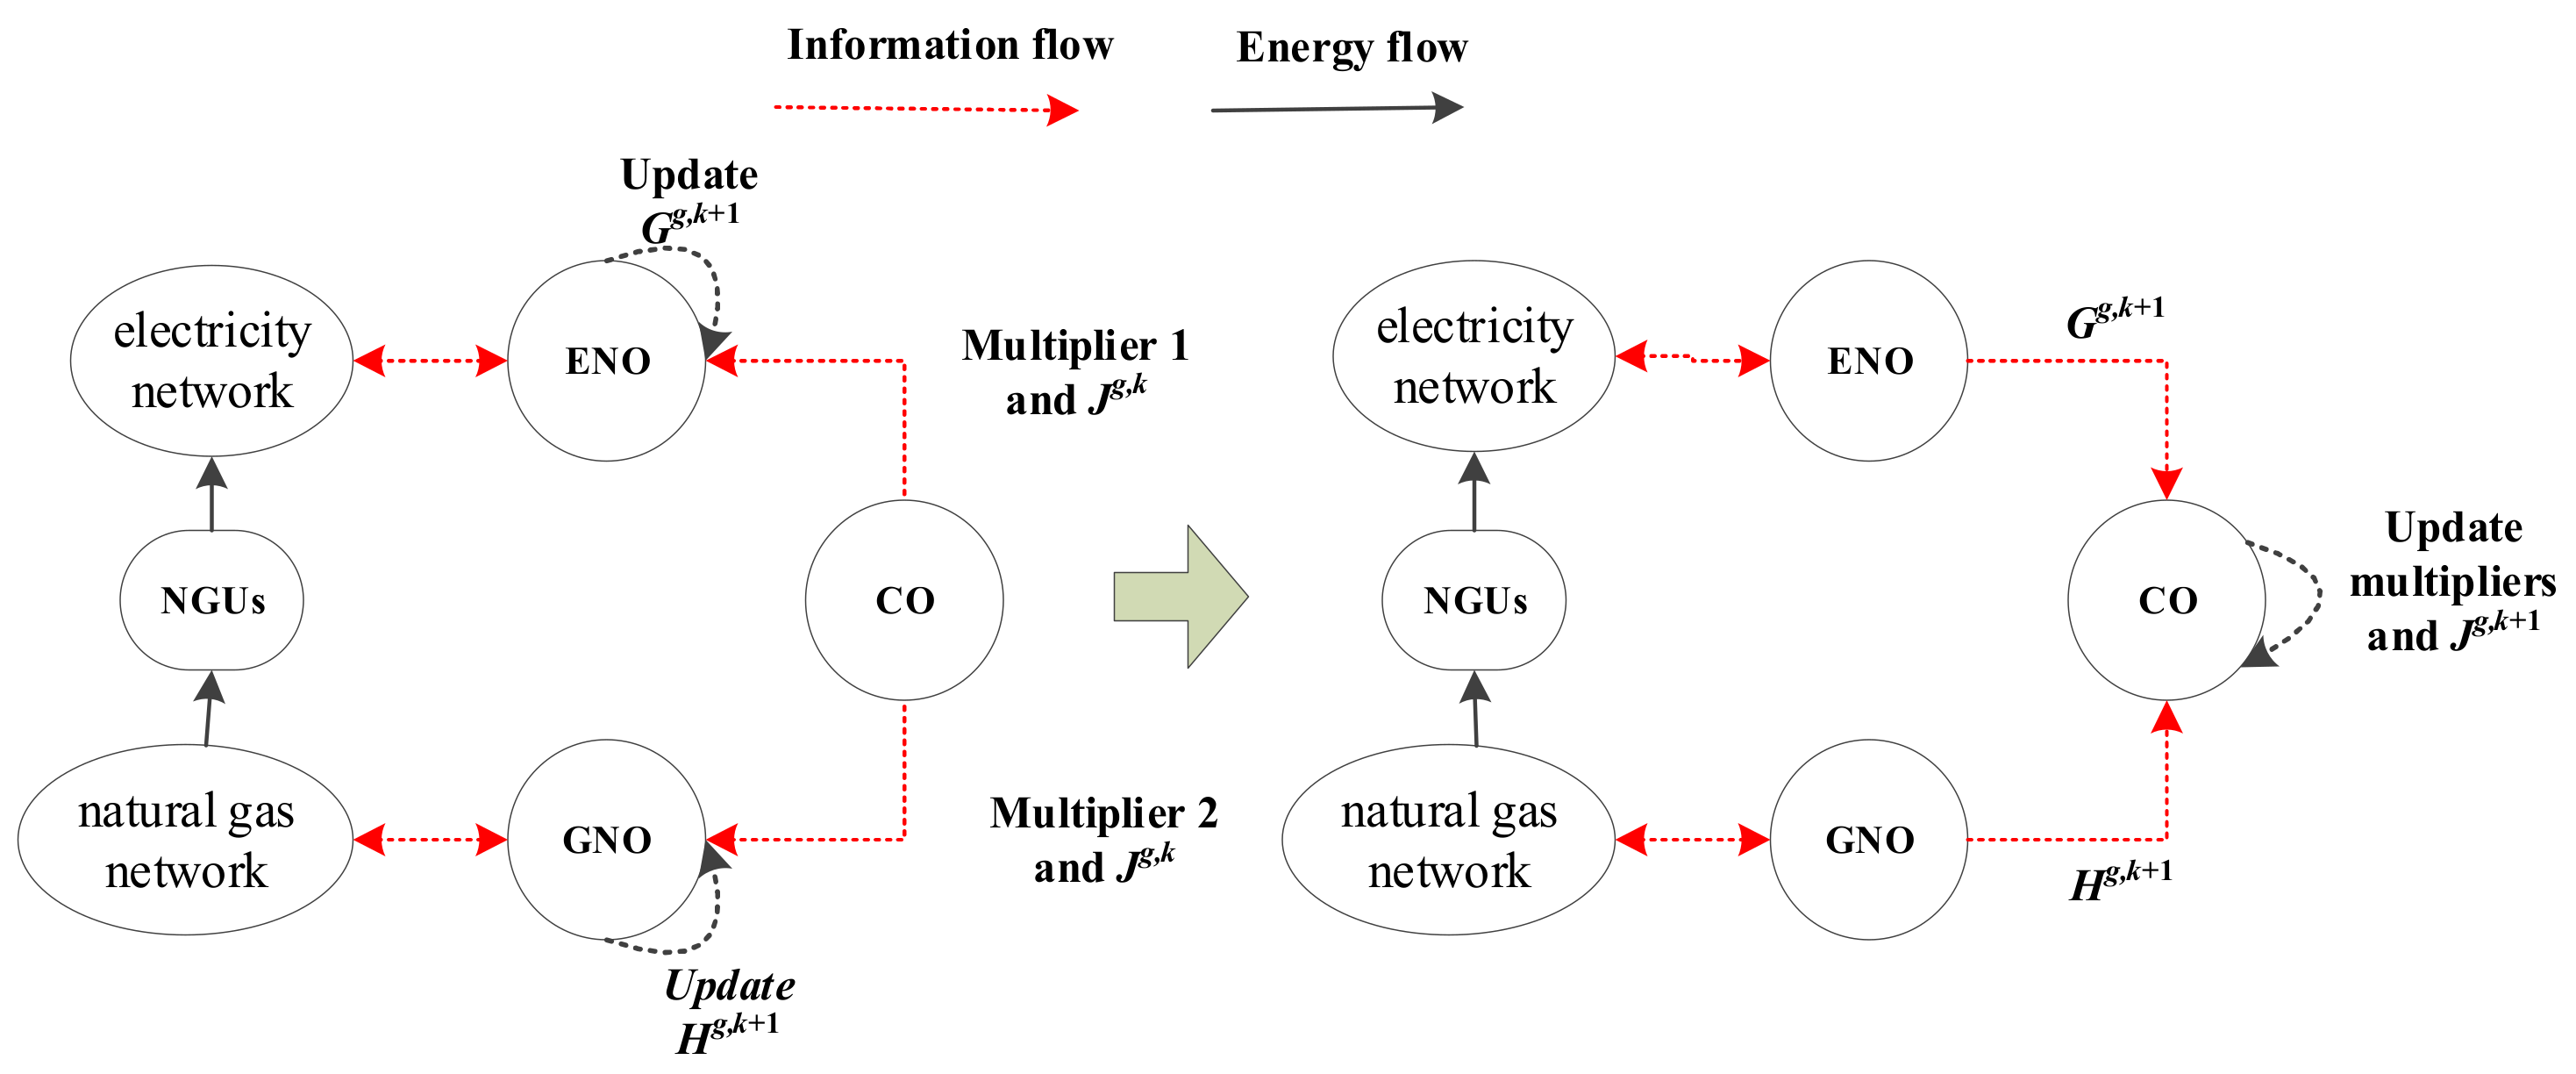
Figure 1. ADMM information flow with coordination operator.
Applsci 11 04987 g001
Figure 2. The structure of traditional DO.
Applsci 11 04987 g002
Figure 3. The diagram of traditional DO.
Applsci 11 04987 g003
Figure 4. The diagram of the proposed CO framework.
Applsci 11 04987 g004
Figure 5. The structure of proposed CO framework.
Applsci 11 04987 g005
Figure 6. The topology of electricity and natural gas networks.
Applsci 11 04987 g006
Figure 7. Residual change of synchronous ADMM.
Applsci 11 04987 g007
Figure 8. Residual change of synchronous ADMM.
Applsci 11 04987 g008
Figure 9. Hourly and total cost of ENO, hourly generation of G1.
Applsci 11 04987 g009
Figure 10. Electricity load profile without and with demand response.
Applsci 11 04987 g010
Figure 11. Hourly generation and total cost of ENO.
Applsci 11 04987 g011
Table 1. Natural gas source characteristics.
SourceConnection
Node
Minimum Capacity (kcf/h)Maximum Capacity (kcf/h)Cost ($/kcf)
S14200050003.2
S25150060002.6
Table 2. Natural gas pipeline characteristics.
Pipeline NumberStart NodeEnd NodePipeline Constant (kcf/Psig)
12150.6
24250.1
35237.5
45343.5
56545.3
Table 3. Performance comparison.
MethodsDOADMMProposed Framework (CO)
CPU time (s)1.51241.392.29
Gas shortage (kcf)280.3800
Load shedding (MW)17.7600
Power generation cost ($)22,358.322,969.222,969.5
Load shedding cost ($)117600
Total cost of electricity ($)23,534.322,969.522,969.5
Gas network income ($)15,781.917,794.917,794.9
Table 4. Gap of iteration process with various expansion point.
Iteration123456
Gap-SPF point1385.308 2.707 0.652 0.366 0.048 N/A
Zero point707557.820 471.389 365.477 205.691 0.300 0.038
Gap-ZPF point143.076 139.152 0.730 0.552 0.090 N/A
Zero point305592.919 70906.237 48.071 15.128 164.559 0.067
Table 5. Gas shortage and load shedding in DO.
Case 2Case 3
DOCODOCO
Gas shortage of NGFUs (kcf)428.30728.80
Load shedding (MW)29.70460
Table 6. The total cost of the electricity network.
Decentralized OperationCoordinated Operation
Without DRWith DRWithout DRWith DR
Without pipelines congestion1708547.2 $1687651.1 $1708547.2 $1687645.0 $
Pipelines congestion1762052.3 $1770473.1 $1721257.2 $1700798.7 $
Publisher’s Note: MDPI stays neutral with regard to jurisdictional claims in published maps and institutional affiliations.