
Fault Diagnosis Approach of Main Drive Chain in Wind Turbine Based on Data Fusion


Abstract
:1. Introduction
- (1)
- Proposing a fault diagnosis strategy of the main drive chain in wind turbines based on data fusion, considering both the real-time monitoring data from the SCADA system and the high-frequency vibration data of the main chain.
- (2)
- Proposing the detailed method to classify and extract the fault features based on two types of data and the method for fault diagnosis using the deep autoencoder model.
- (3)
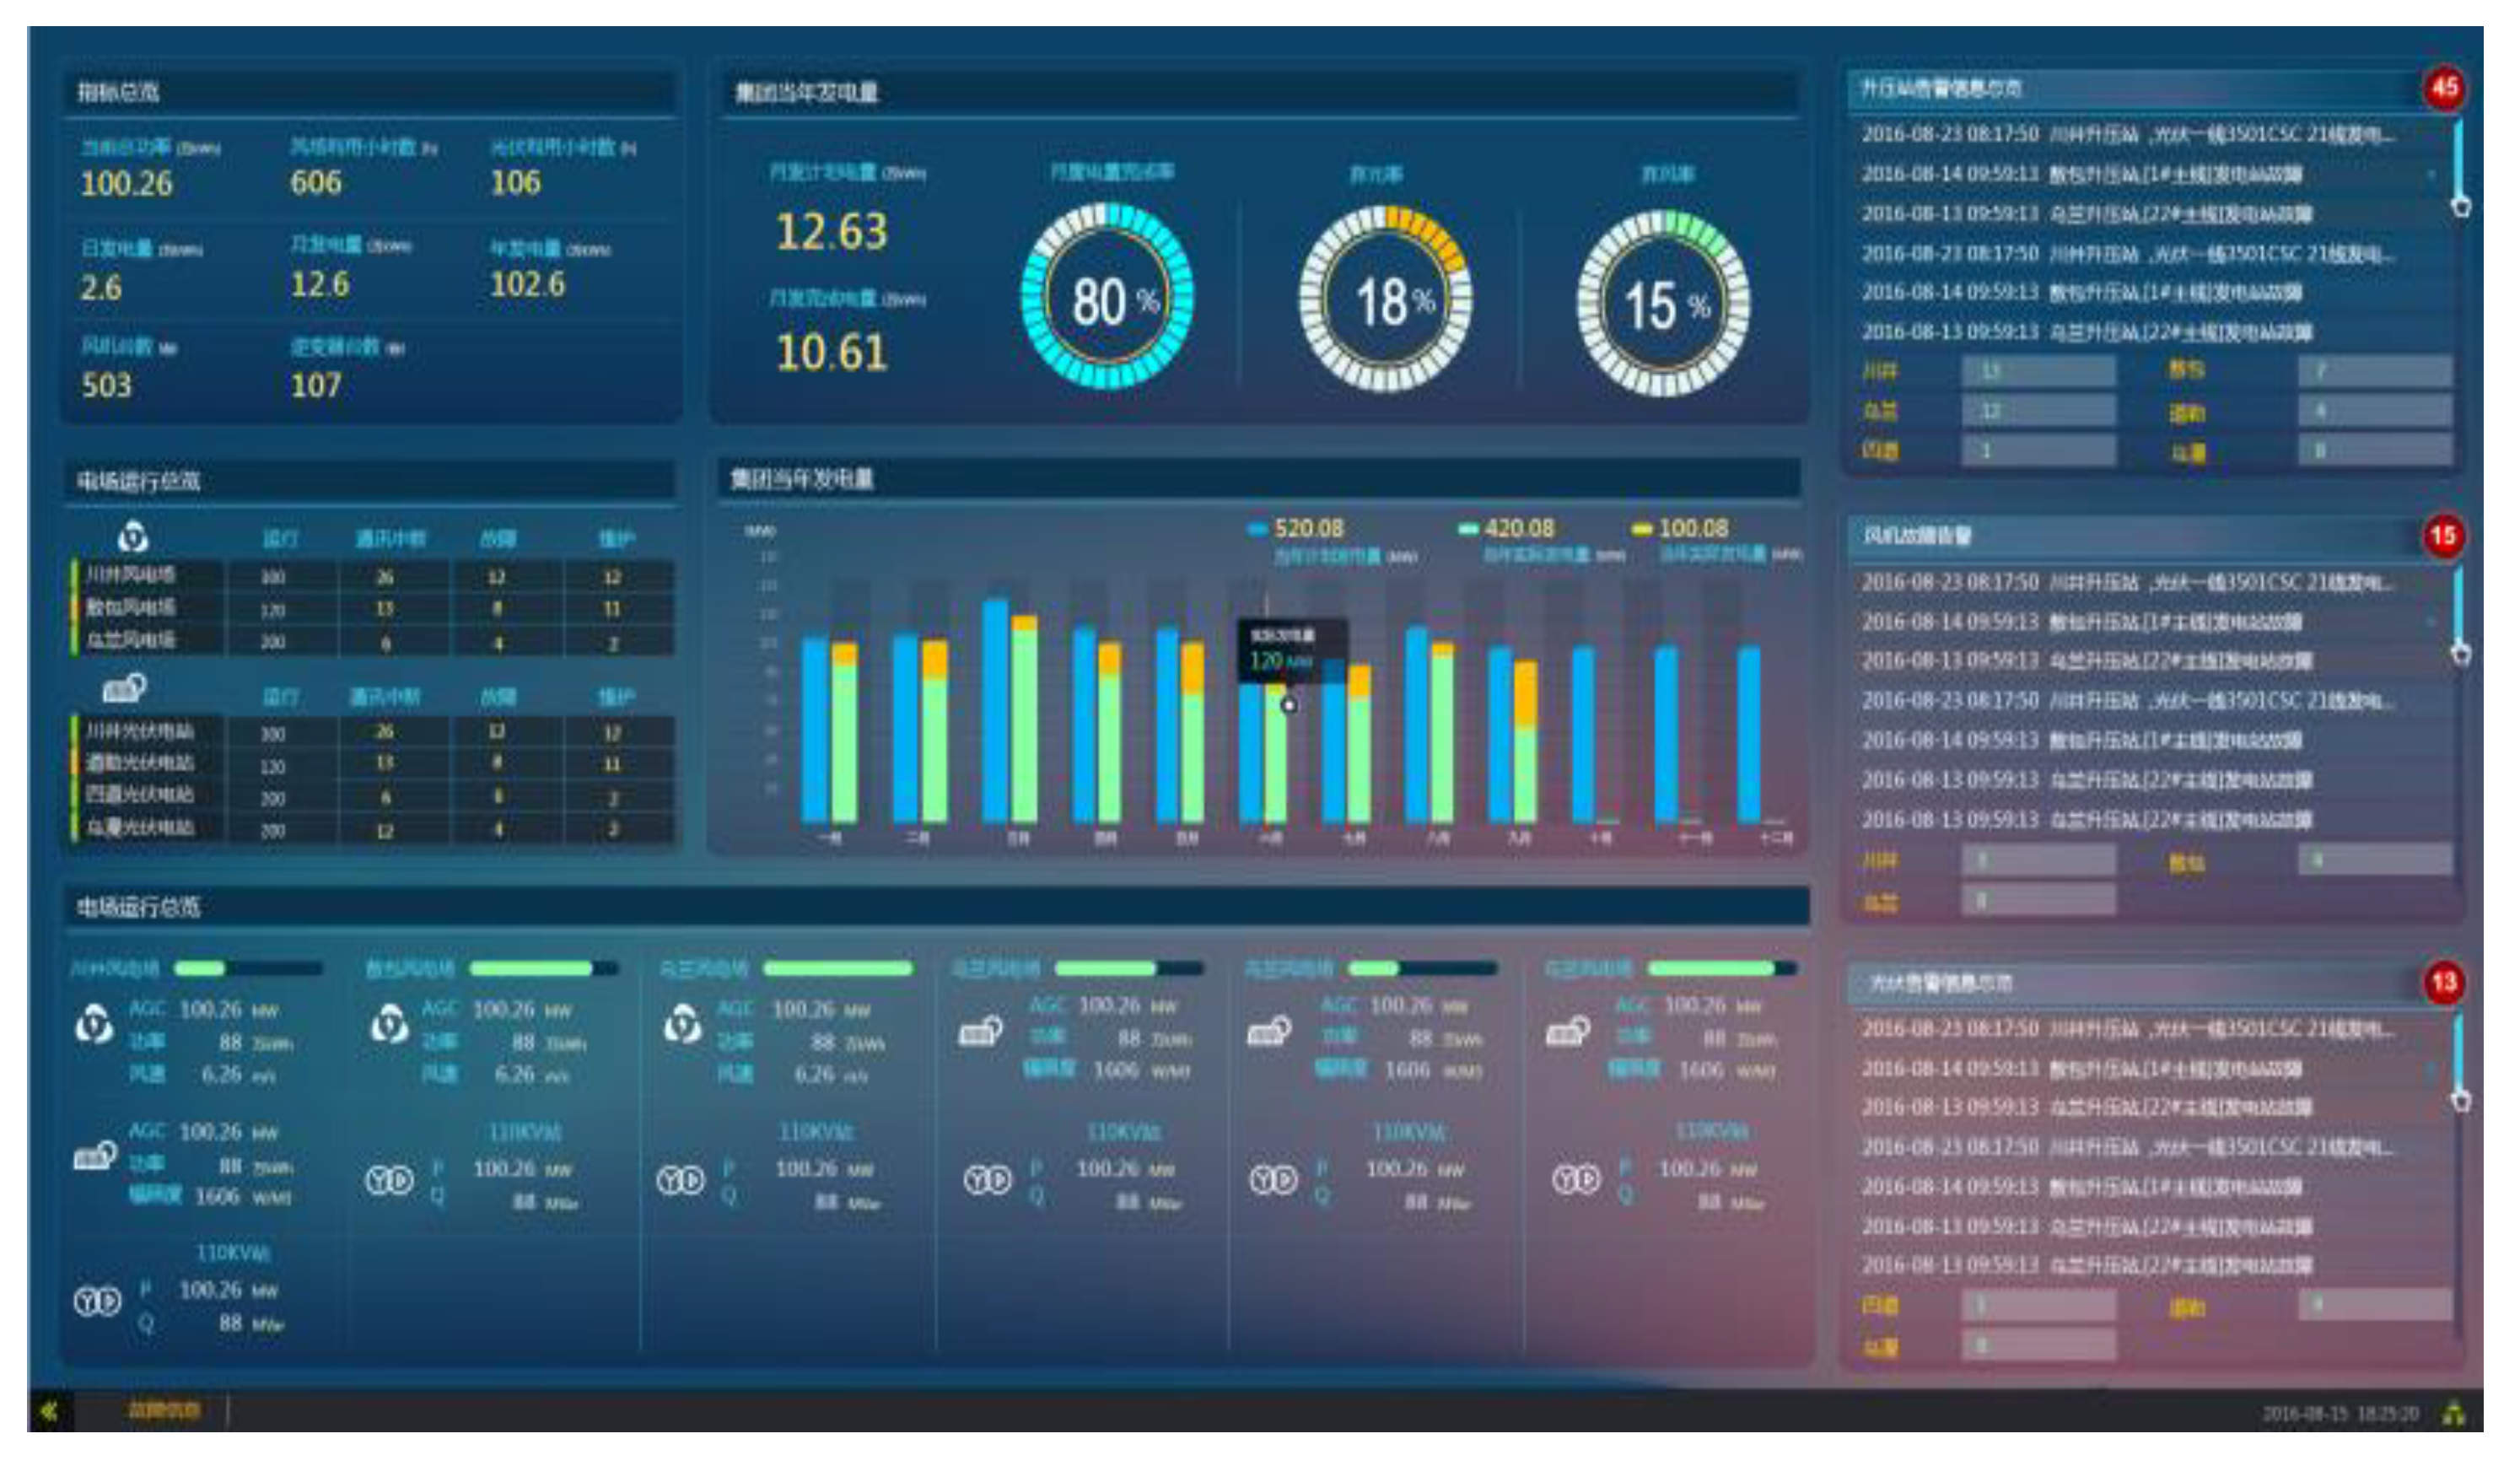
- Conduct case studies in a real wind farm to verify the effectiveness of the proposed strategy, and analyze the experimental results and the benefits to the high-efficient operation and maintenance of wind turbines.
2. Fault Features Extraction of Wind Turbine Main Drive Chain Based on Data Fusion
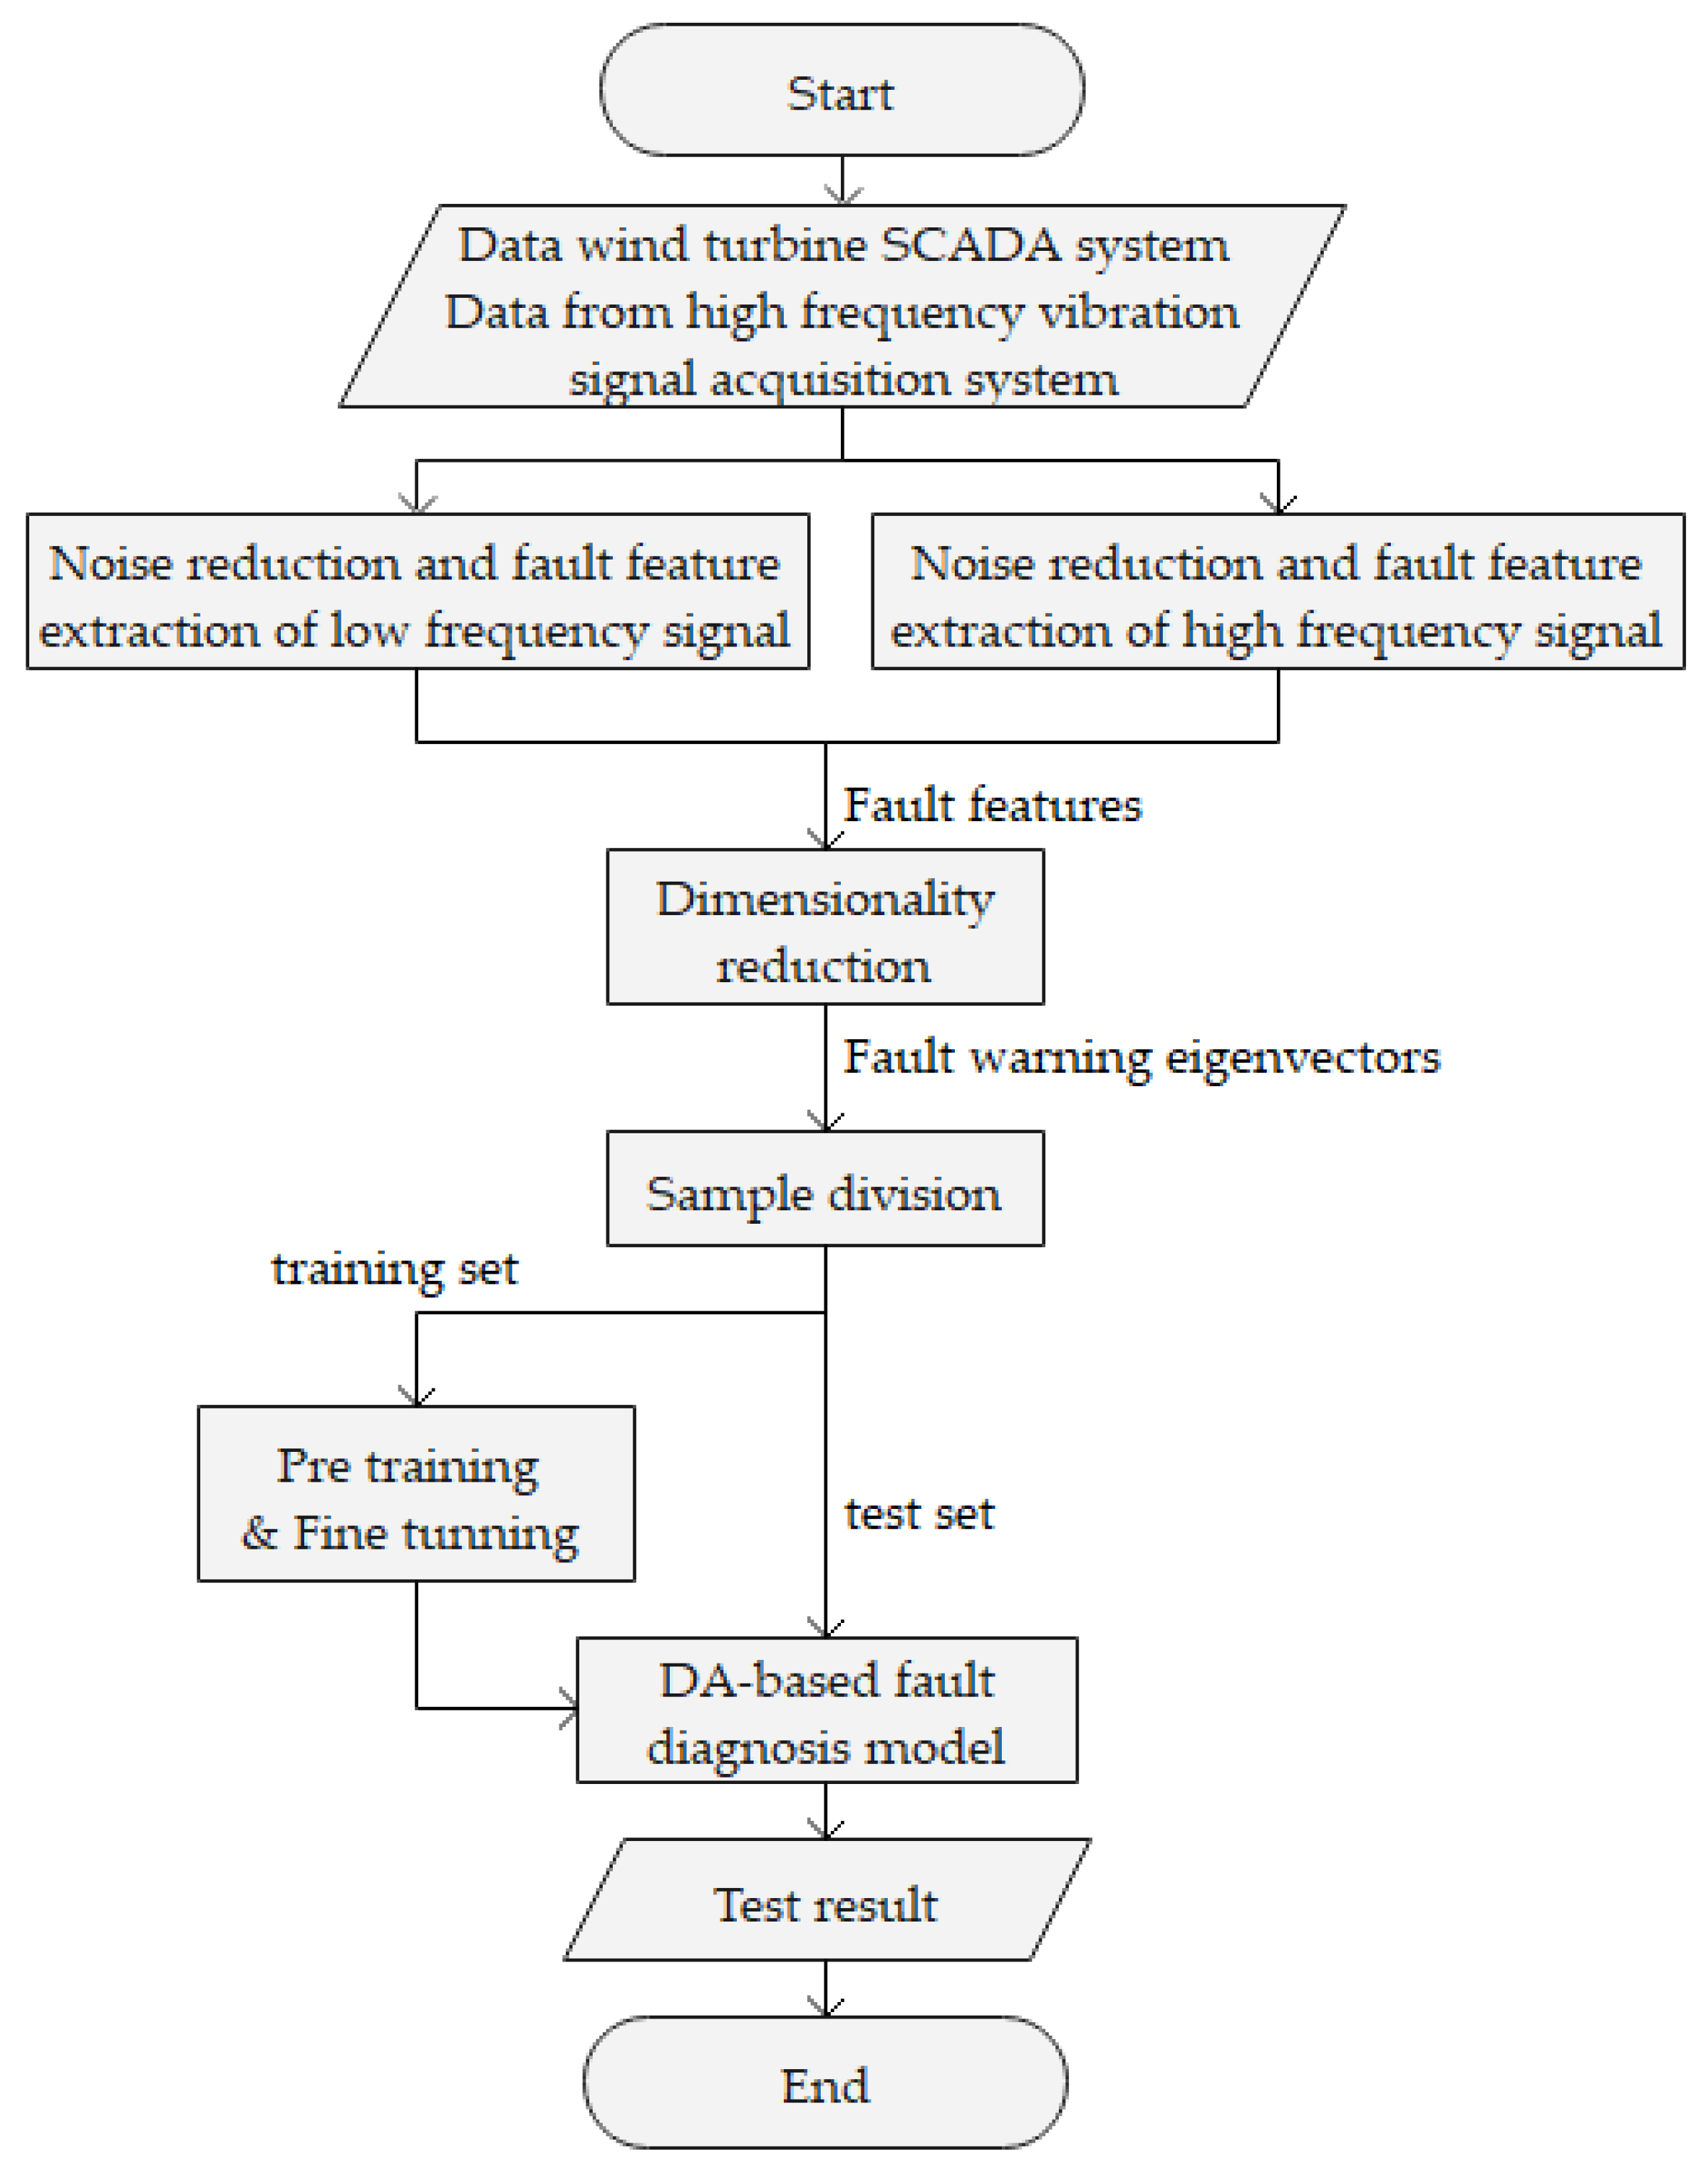
2.1. Process of Fault Features Extraction of the Main Drive Chain in Wind Turbine
2.2. Fault Features Extraction of Wind Turbine Main Drive Chain Based on Data Fusion
- (1)
- Noise reduction of low-frequency and high-frequency vibration signals of the main drive chain
- (2)
- Extraction of low-frequency and high-frequency fault features of typical faults
- (3)
- Dimensionality reduction of fault features
- (1)
- Centralize all samples:
- (2)
- Calculate the covariance matrix of the sample,
- (3)
- Perform singular value decomposition on the matrix ,
- (4)
- Take out the eigenvectors corresponding to the largest k singular values, and normalize all the eigenvectors to form an eigenvector matrix W,
- (5)
- For each sample in the sample set, transform it into a new sample:
- (6)
- Obtain the output sample set:
3. Fault diagnosis of Wind Turbine Main Drive Chain Based on Fusion of Two Types of Data
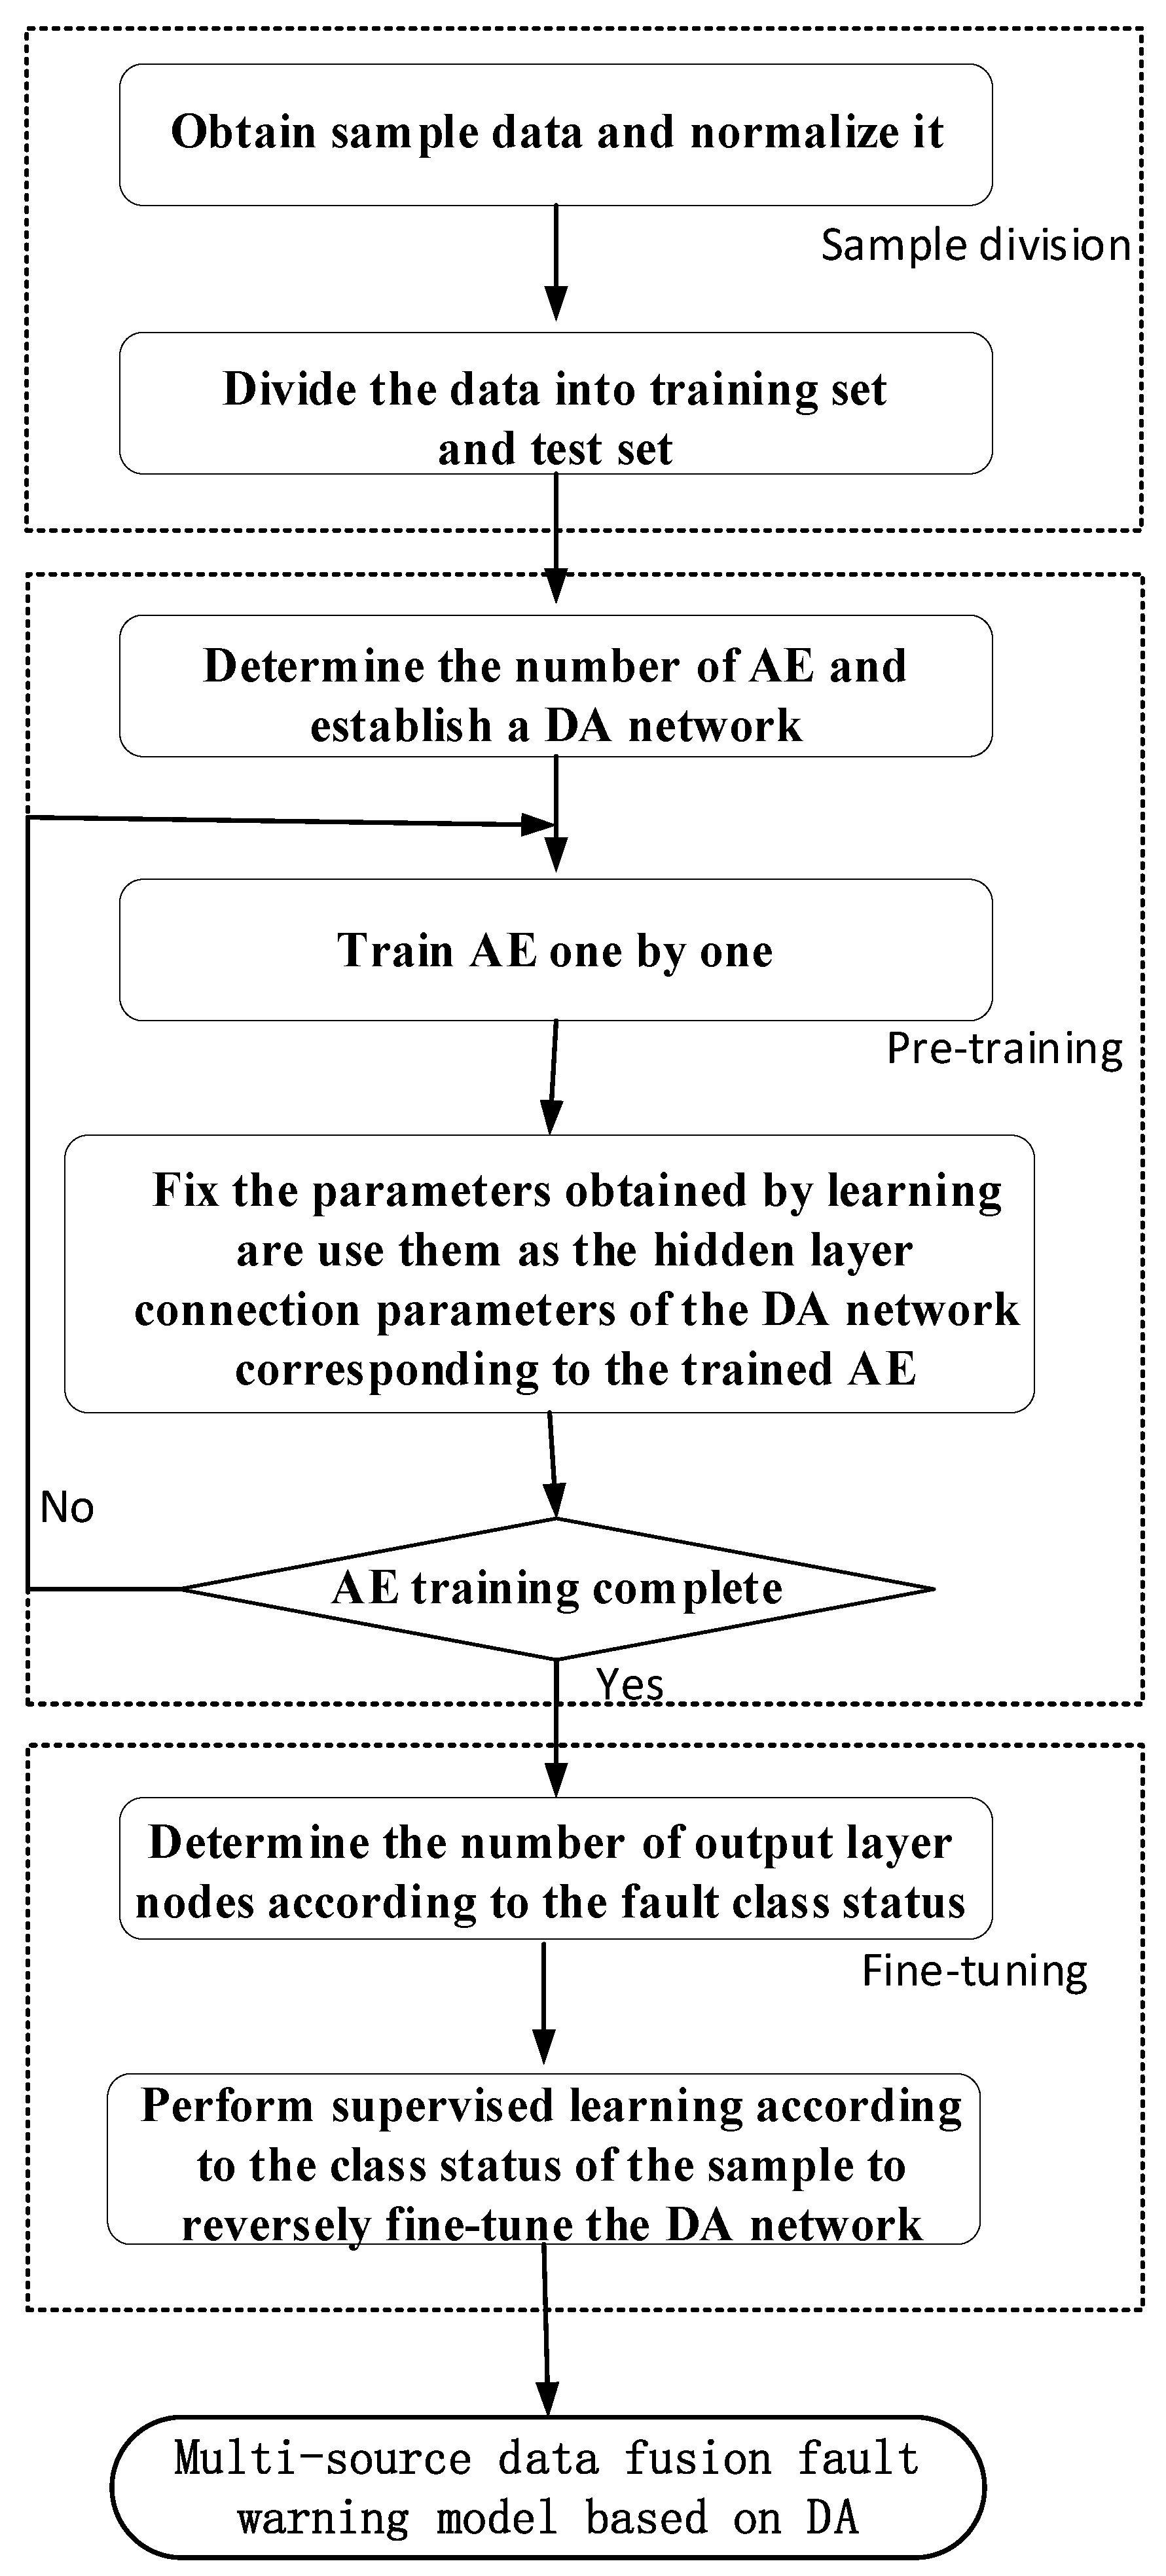
- (1)
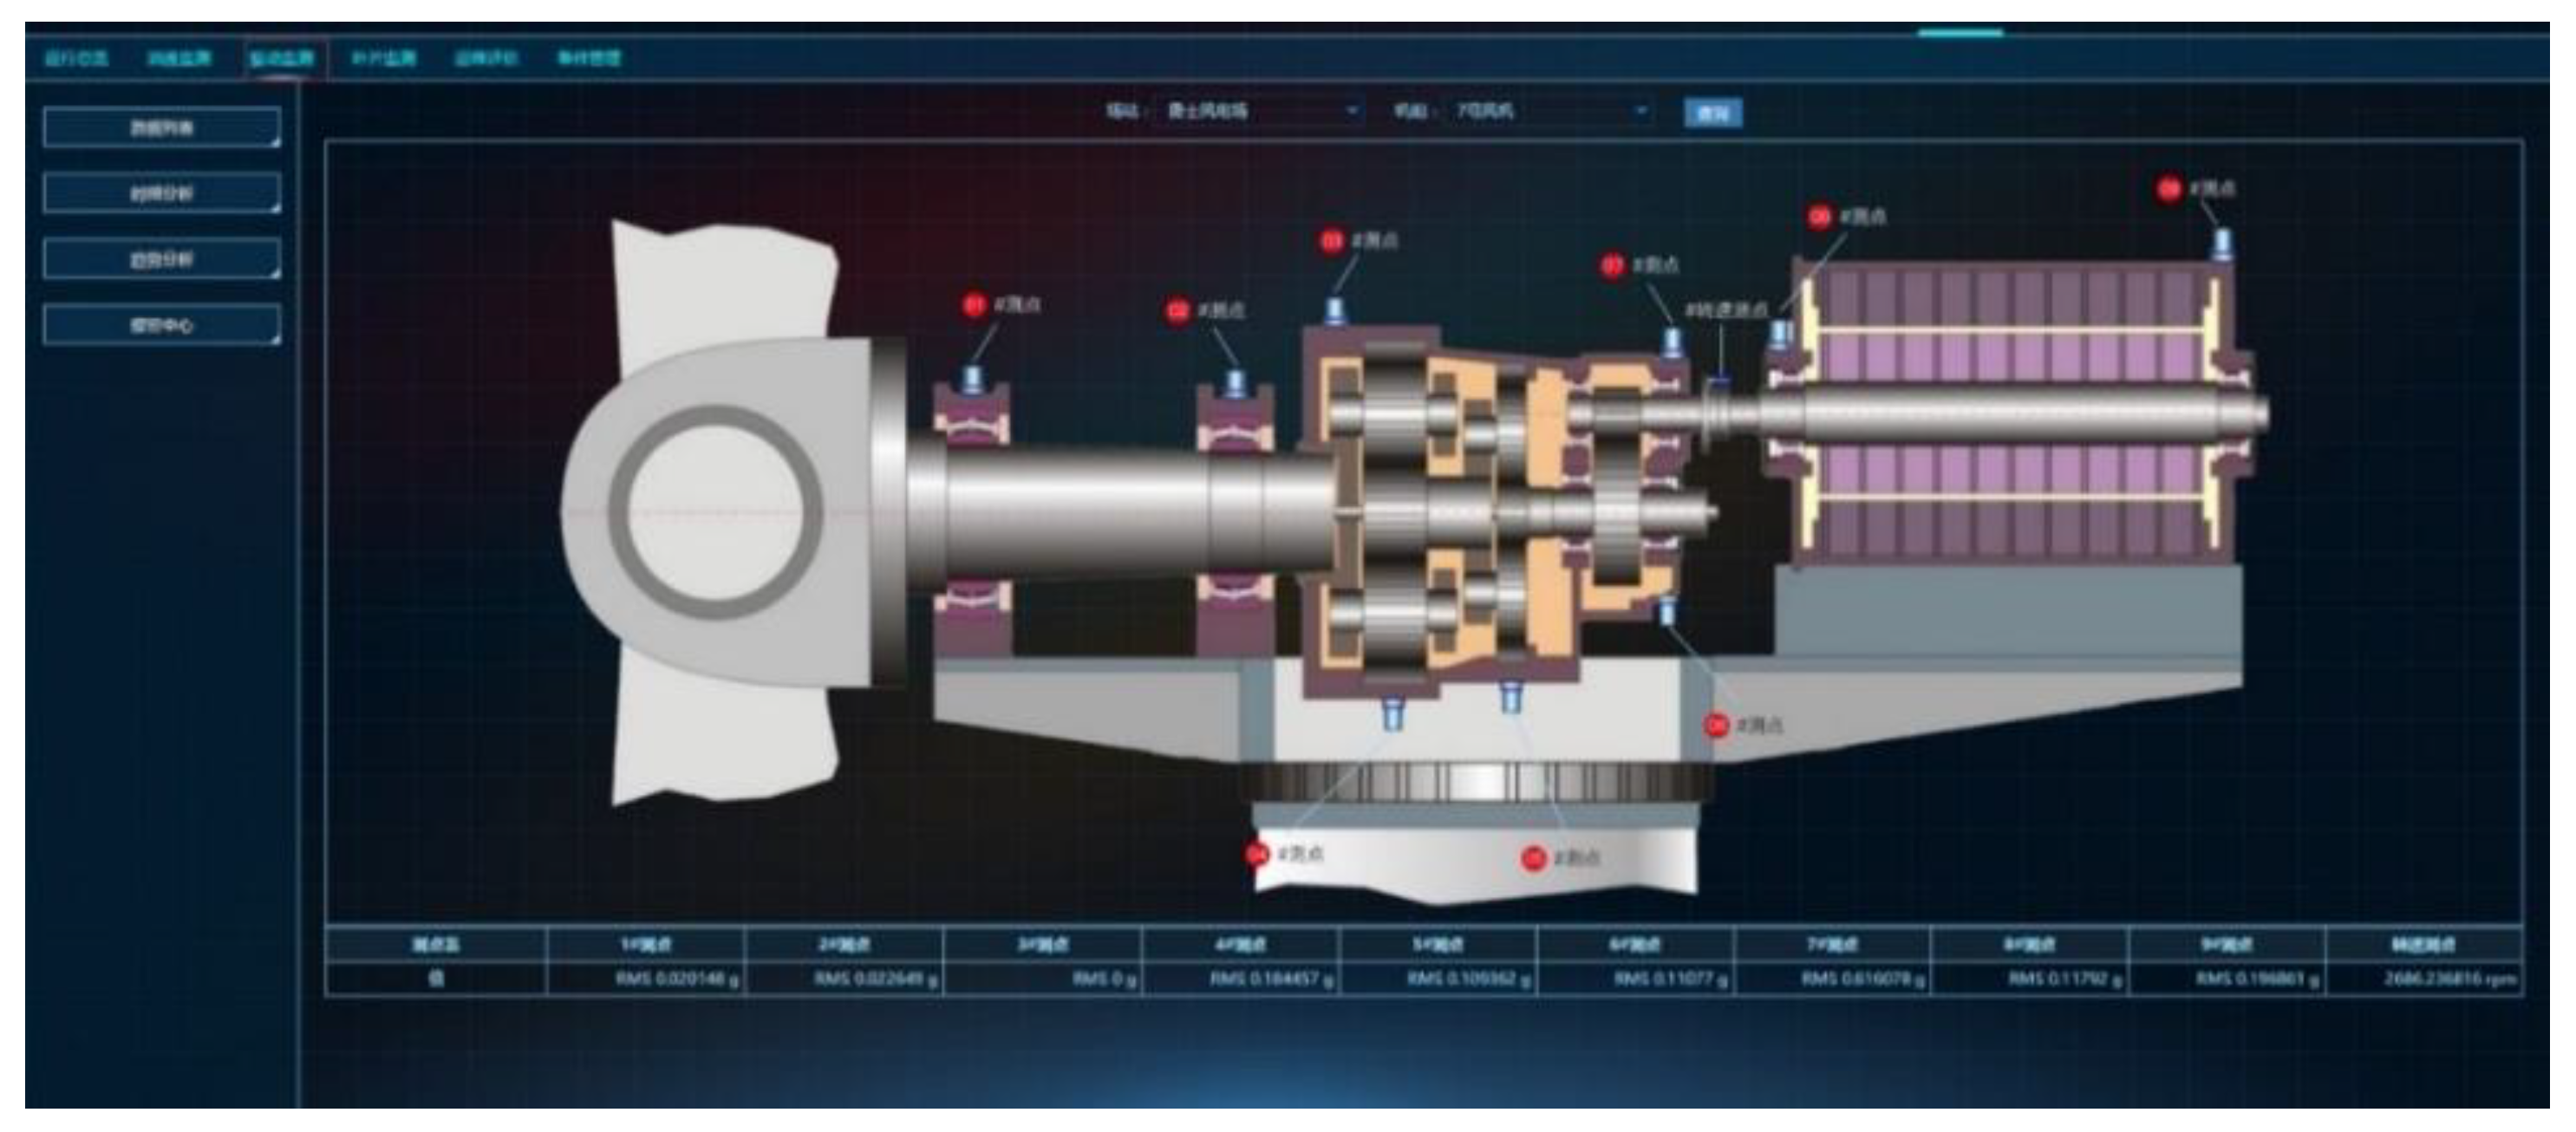
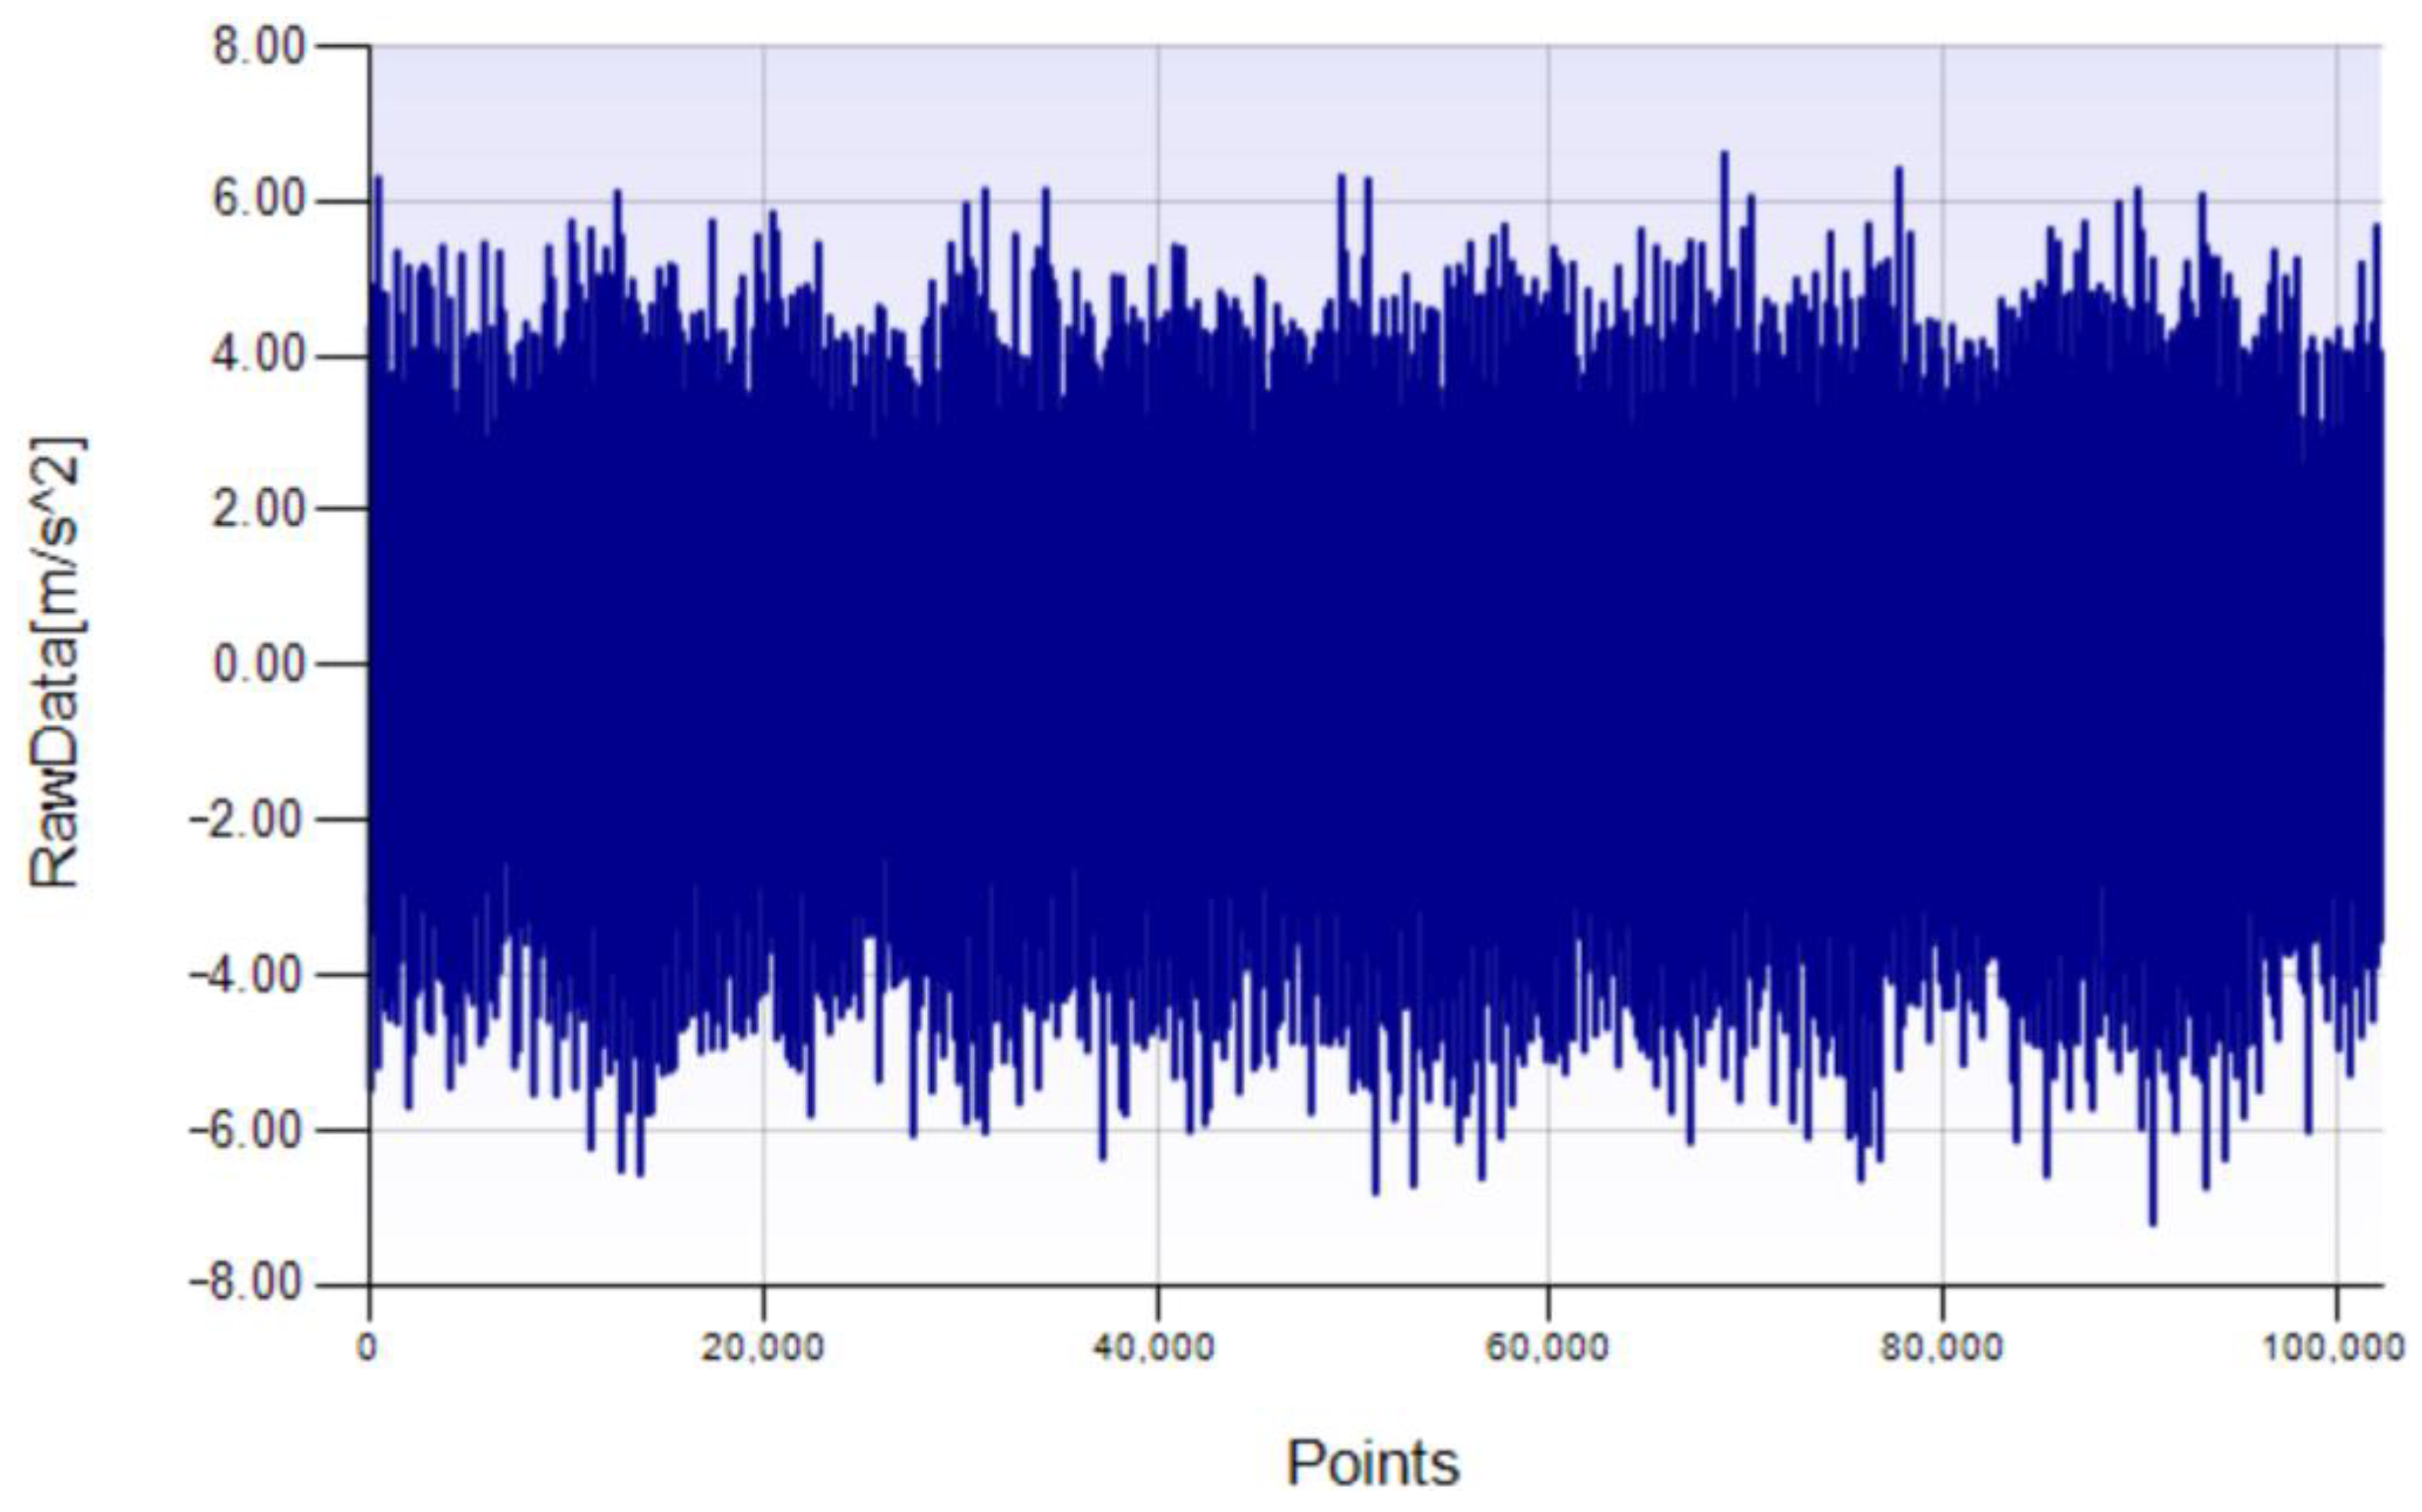
- Select the low-frequency monitoring data from the SCADA system and the high-frequency vibration monitoring data from the main drive chain vibration fault diagnosis system under the normal state and a typical fault state of the wind turbine main drive chain. Calculate the characteristics of a fault warning and establish a sample data set of this typical fault. Normalize the sample data set and divide it into a training set and test set with a certain proportion.
- (2)
- Determine the number of stacked AEs (Auto Encoders) and establish the DA with multiple hidden layers. The number of input layer neurons is the dimension of the input sample, and the data set is used for pre-training by stacking AEs.
- (3)
- Use the labeled samples in the main drive chain training data set to apply supervised fine-tuning to the entire DA to complete all training processes.
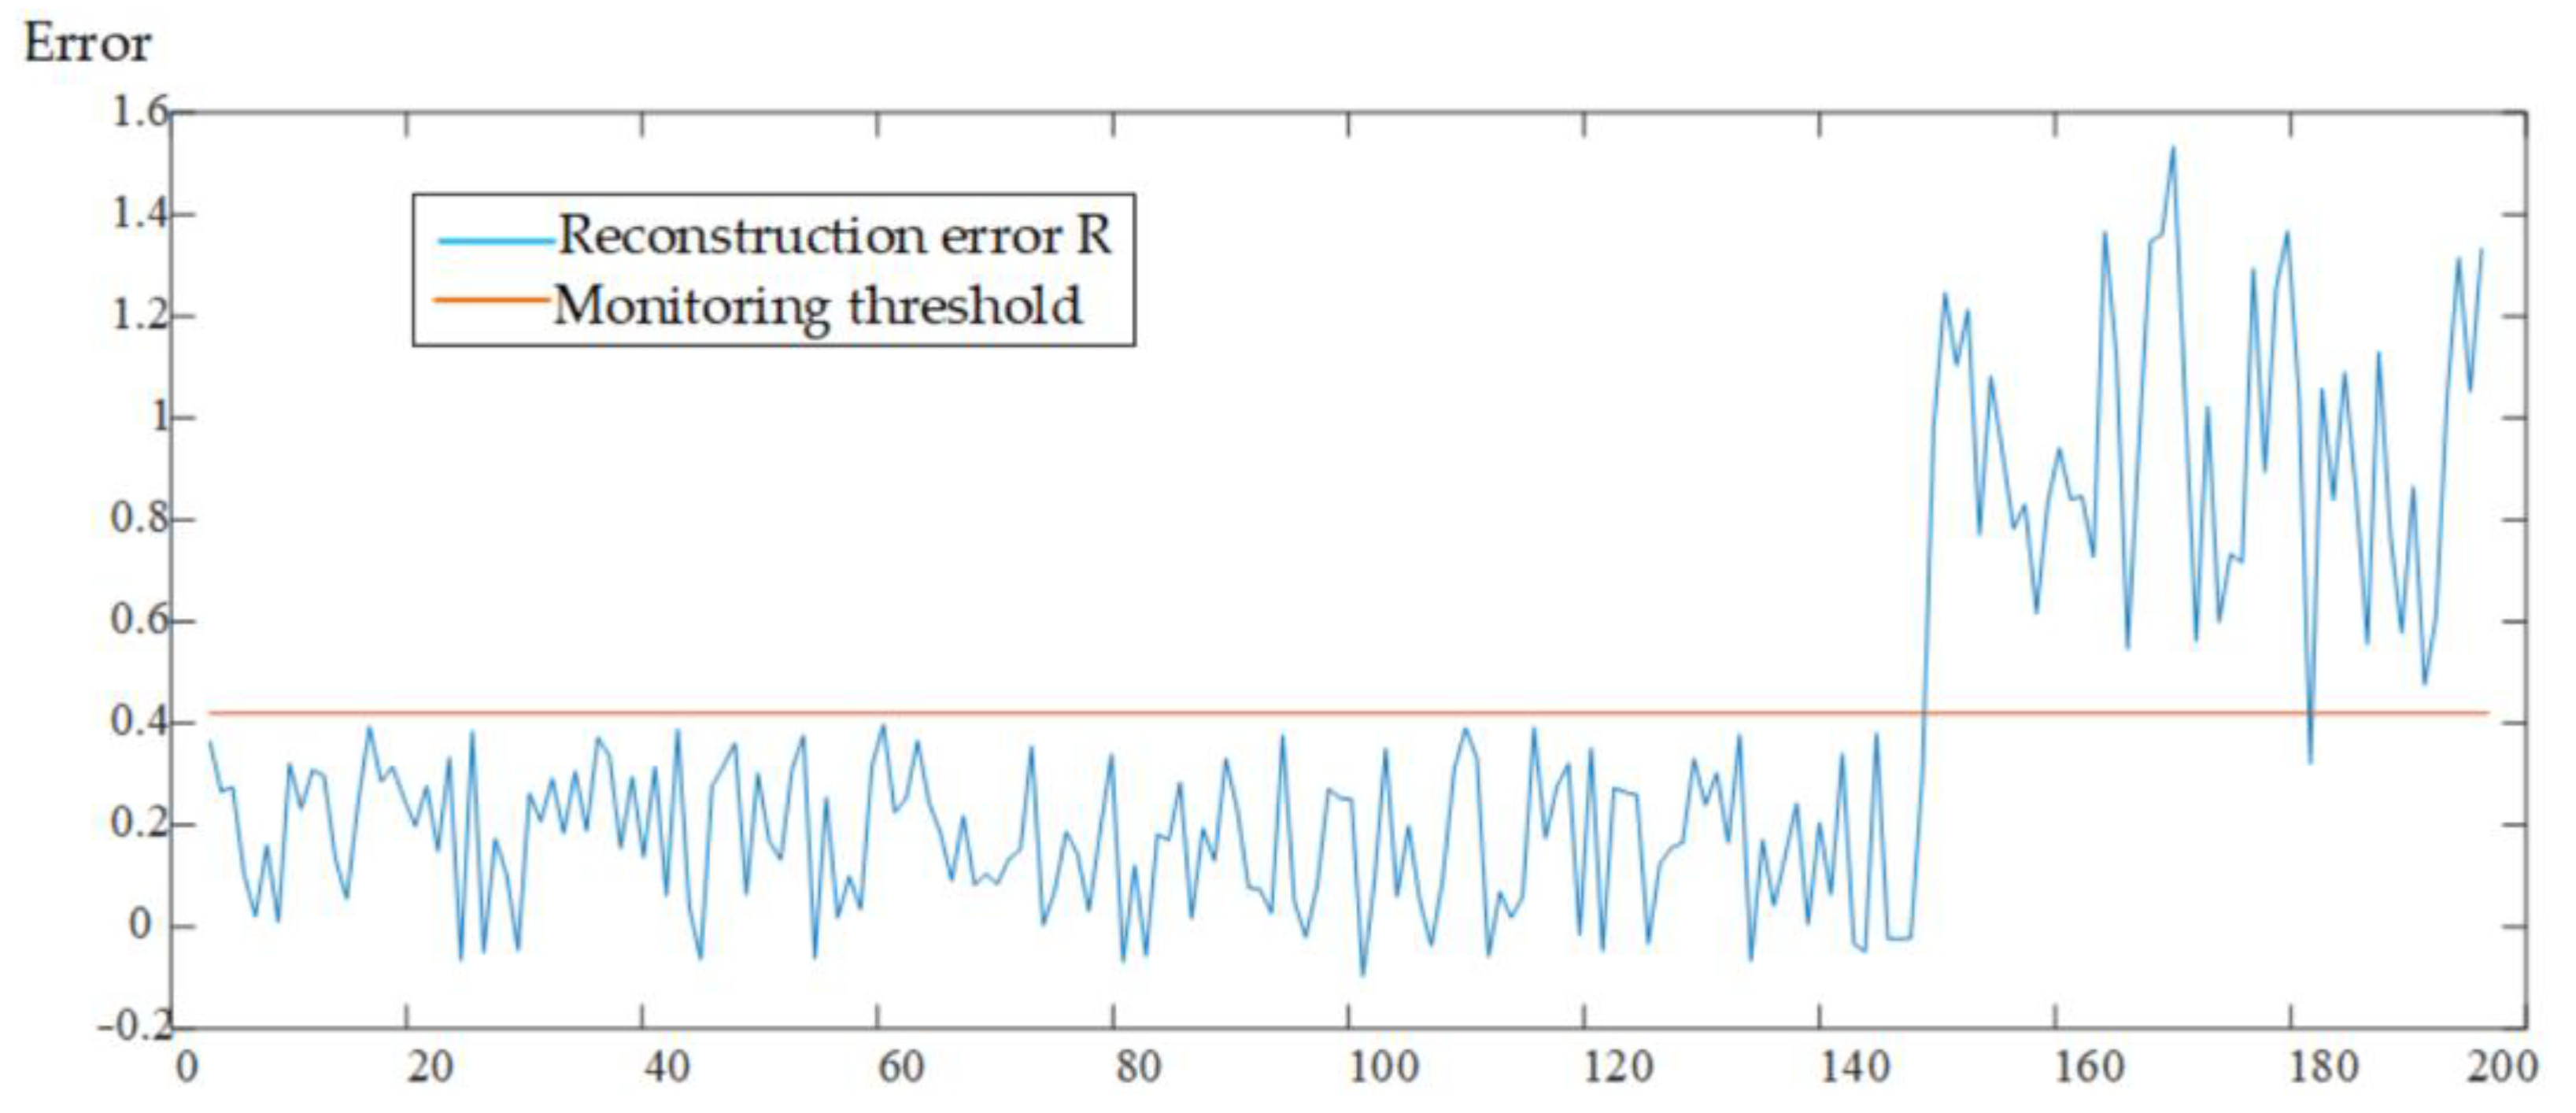
- (4)
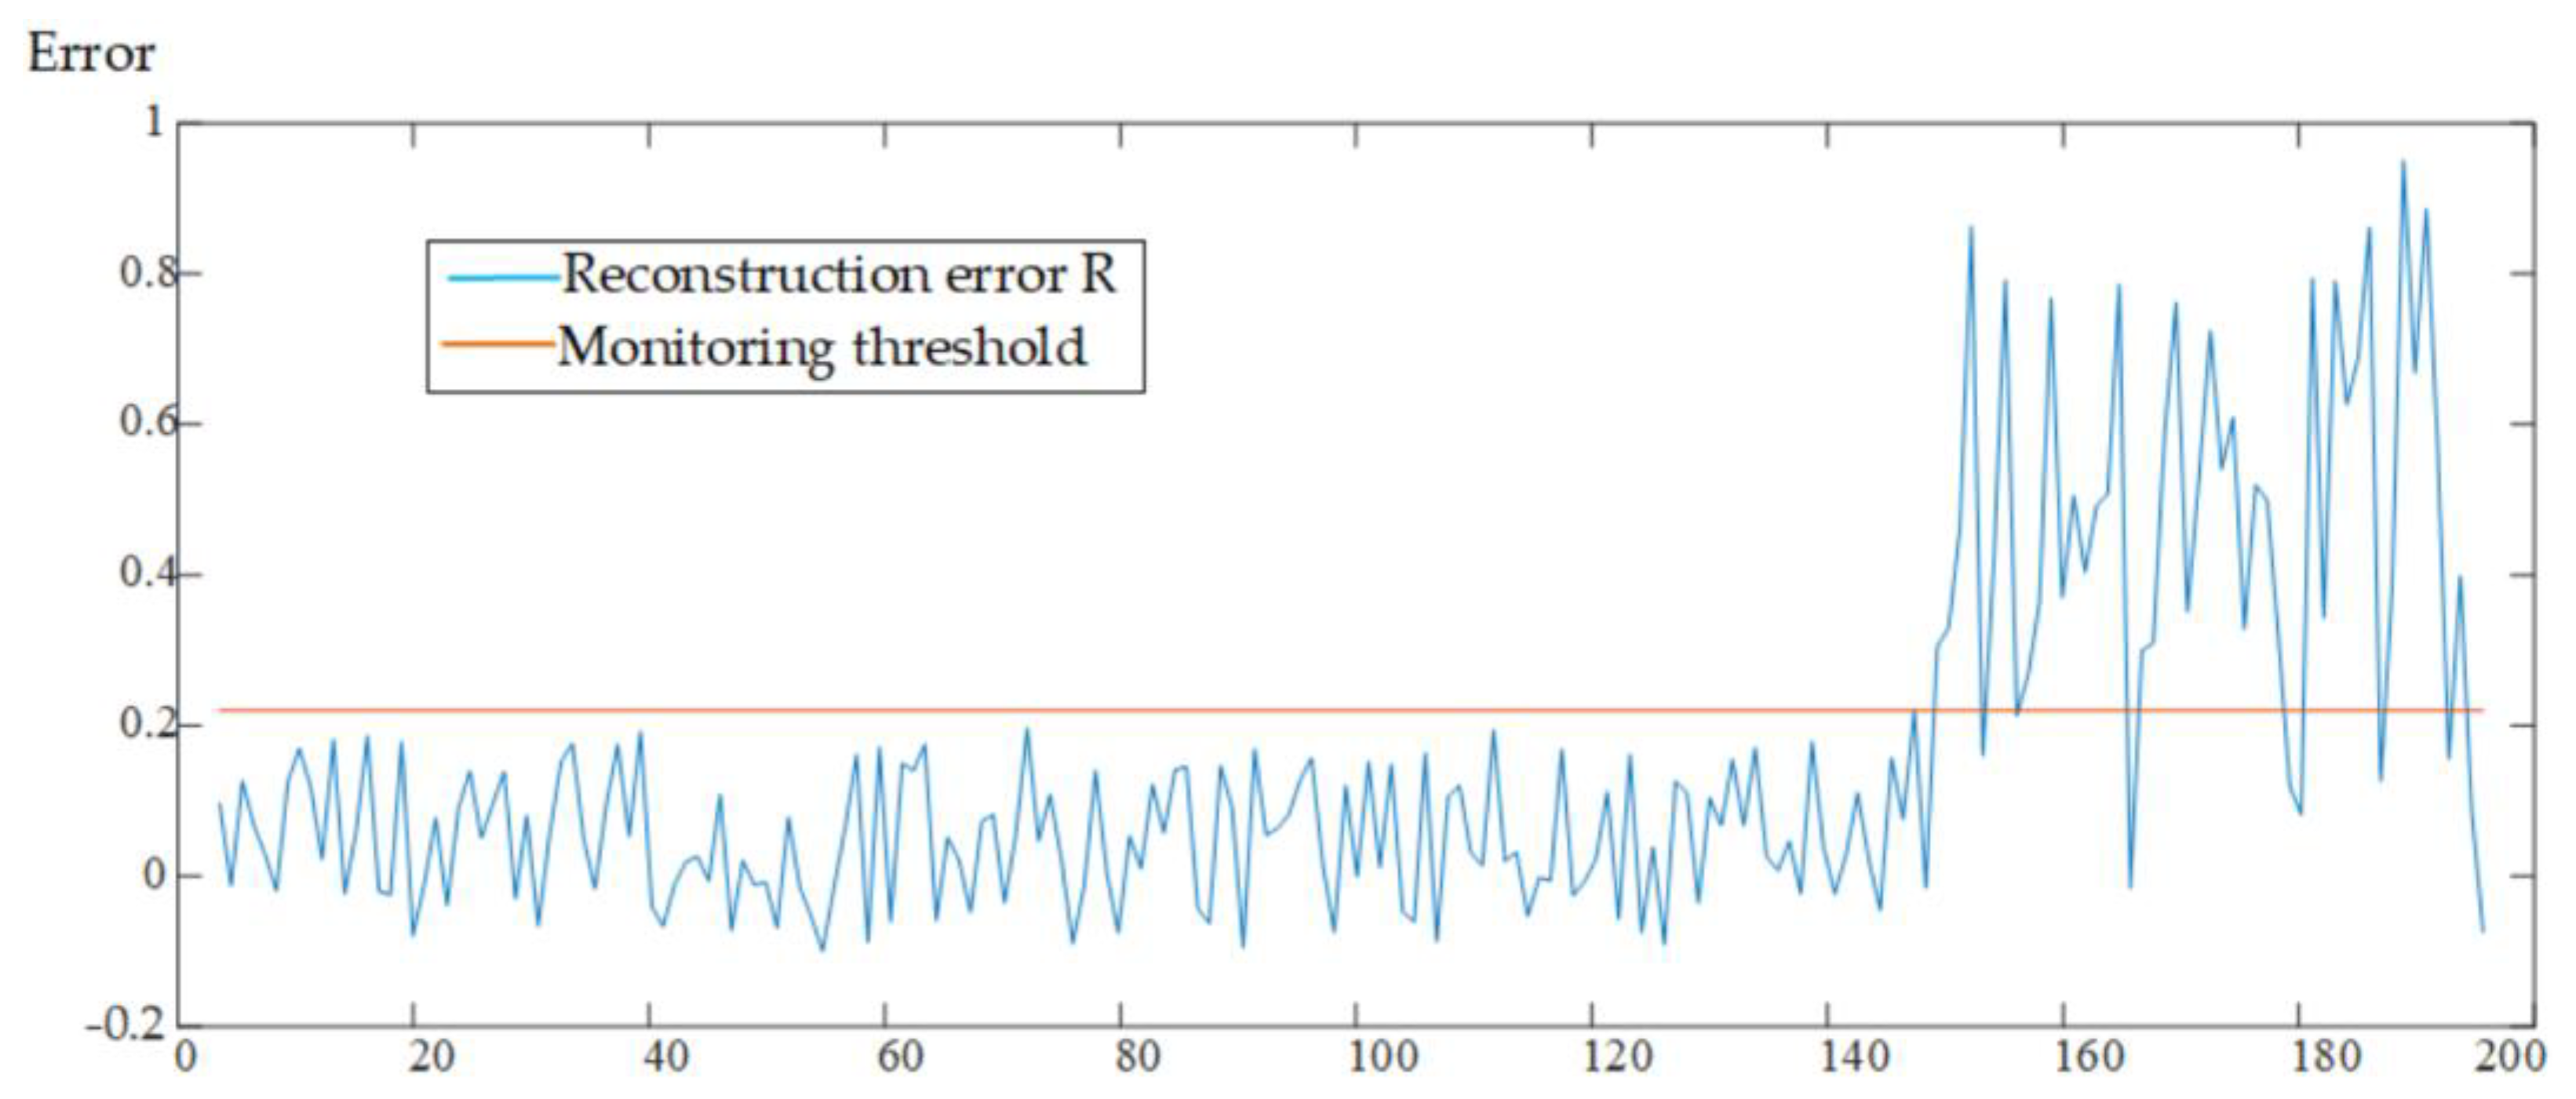
- When the entire DA training is completed, establish the DA model for the main drive chain, calculate the reconstruction error R with the test sample set, and integrate the test samples into the DA model for testing.
4. Results
5. Conclusions
Author Contributions
Funding
Institutional Review Board Statement
Informed Consent Statement
Data Availability Statement
Conflicts of Interest
References
- Xing, L.; Jiao, B.; Du, Y.; Tan, X.; Wang, R. Intelligent Energy-Saving Supervision System of Urban Buildings Based on the Internet of Things: A Case Study. IEEE Syst. J. 2020, 14, 4252–4261. [Google Scholar] [CrossRef]
- Zhao, Z.; Yang, P.; Wang, Y.; Xu, Z.; Guerrero, J.M. Dynamic Characteristics Analysis and Stabilization of PV-Based Multiple Microgrid Clusters. IEEE Trans. Smart Grid 2019, 10, 805–818. [Google Scholar] [CrossRef] [Green Version]
- Kirimtat, A.; Krejcar, O.; Kertesz, A.; Tasgetiren, M.F. Future Trends and Current State of Smart City Concepts: A Survey. IEEE Access 2020, 8, 86448–86467. [Google Scholar] [CrossRef]
- Zhao, Z.; Guo, J.; Lai, C.S.; Xiao, H.; Zhou, K.; Lai, L.L. Distributed Model Predictive Control Strategy for Islands Multimicrogrids Based on Noncooperative Game. IEEE Trans. Ind. Inform. 2021, 17, 3803–3814. [Google Scholar] [CrossRef]
- Şerban, A.C.; Lytras, M.D. Artificial Intelligence for Smart Renewable Energy Sector in Europe—Smart Energy Infrastructures for Next Generation Smart Cities. IEEE Access 2020, 8, 77364–77377. [Google Scholar] [CrossRef]
- Lai, C.S.; Jia, Y.; Dong, Z.; Wang, D.; Tao, Y.; Lai, Q.H.; Wong, R.T.; Zobaa, A.F.; Wu, R.; Lai, L.L. A review of technical standards for smart cities. Clean Technol. 2020, 2, 290–310. [Google Scholar] [CrossRef]
- Azevedo Guedes, A.L.; Carvalho Alvarenga, J.; Dos Santos Sgarbi Goulart, M.; Rodriguez y Rodriguez, M.V.; Pereira Soares, C.A. Smart Cities: The Main Drivers for Increasing the Intelligence of Cities. Sustainability 2018, 10, 3121. [Google Scholar] [CrossRef] [Green Version]
- Florescu, A.; Barabas, S.; Dobrescu, T. Research on Increasing the Performance of Wind Power Plants for Sustainable Development. Sustainability 2019, 11, 1266. [Google Scholar] [CrossRef] [Green Version]
- Marti-Puig, P.; Blanco-M, A.; Serra-Serra, M.; Solé-Casals, J. Wind Turbine Prognosis Models Based on SCADA Data and Extreme Learning Machines. Appl. Sci. 2021, 11, 590. [Google Scholar] [CrossRef]
- Rezamand, M.; Kordestani, M.; Carriveau, R.; Ting, D.S.-K.; Orchard, M.E.; Saif, M. Critical Wind Turbine Components Prognostics: A Comprehensive Review. IEEE Trans. Instrum. Meas. 2020, 69, 9306–9328. [Google Scholar] [CrossRef]
- Qin, A.; Hu, Q.; Lv, Y.; Zhang, Q. Concurrent Fault Diagnosis Based on Bayesian Discriminating Analysis and Time Series Analysis with Dimensionless Parameters. IEEE Sens. J. 2019, 19, 2254–2265. [Google Scholar] [CrossRef]
- Liu, Y.; Wu, Z.; Wang, X. Research on Fault Diagnosis of Wind Turbine Based on SCADA Data. IEEE Access 2020, 8, 185557–185569. [Google Scholar] [CrossRef]
- Tautz-Weinert, J.; Watson, S.J. Using SCADA data for wind turbine condition monitoring-a review. IET Renew. Power Gener. 2017, 11, 382–394. [Google Scholar] [CrossRef] [Green Version]
- Wilkinson, M.; Darnell, B.; Van Delft, T.; Harman, K. Comparison of methods for wind turbine condition monitoring with SCADA data. IET Renew. Power Gener. 2014, 8, 390–397. [Google Scholar] [CrossRef]
- Yang, W.; Jiang, J. Wind turbine condition monitoring and reliability analysis by SCADA information. In Proceedings of the 2011 Second International Conference on Mechanic Automation and Control Engineering, IEEE, Inner Mongolia, China, 15–17 July 2011; pp. 1872–1875. [Google Scholar]
- Zaher, A.; Mcarthur SD, J.; Infield, D.G.; Patel, Y. Online wind turbine fault detection through automated SCADA data analysis. Wind Energy 2009, 12, 574–593. [Google Scholar] [CrossRef]
- Kermani, M.; Carnì, D.L.; Rotondo, S.; Paolillo, A.; Manzo, F.; Martirano, L. A Nearly Zero-Energy Microgrid Testbed Laboratory: Centralized Control Strategy Based on SCADA System. Energies 2020, 13, 2106. [Google Scholar] [CrossRef]
- Leahy, K.; Gallagher, C.; O’Donovan, P.; Bruton, K.; O’Sullivan, D.T.J. A robust prescriptive framework and performance metric for diagnosing and predicting wind turbine faults based on SCADA and alarms data with case study. Energies 2018, 11, 1738. [Google Scholar] [CrossRef] [Green Version]
- Gonzales, E.; Stephen, B.; Infield, D.; Melero, J.J. On the use of high-frequency SCADA data for improved wind turbine performance monitoring. J. Phys. Conf. Ser. 2017, 926, 012009. [Google Scholar] [CrossRef]
- Kusiak, A.; Li, W. The prediction and diagnosis of wind turbine faults. Renew. Energy 2011, 36, 16–23. [Google Scholar] [CrossRef]
- Yin, H.; Jia, R.; Ma, F.; Wang, D. Wind turbine condition monitoring based on SCADA data analysis. In Proceedings of the 2018 IEEE 3rd Advanced Information Technology, Electronic and Automation Control Conference (IAEAC), Chongqing, China, 12–14 October 2018; pp. 1101–1105. [Google Scholar] [CrossRef]
- Pei, Y.; Qian, Z.; Tao, S.; Yu, H. Wind turbine condition monitoring using SCADA data and data mining method. In Proceedings of the 2018 International Conference on Power System Technology (POWERCON), Guangzhou, China, 6–9 November 2018; pp. 3760–3764. [Google Scholar] [CrossRef]
- Kusiak, A.; Verma, A. A data-driven approach for monitoring blade pitch faults in wind turbines. IEEE Trans. Sustain. Energy 2010, 2, 87–96. [Google Scholar] [CrossRef]
- Encalada-Dávila, Á.; Puruncajas, B.; Tutivén, C.; Vidal, Y. Wind Turbine Main Bearing Fault Prognosis Based Solely on SCADA Data. Sensors 2021, 21, 2228. [Google Scholar] [CrossRef]
- Crabtree, C.J.; Zappalá, D.; Tavner, P.J. Survey of Commercial Available Condition Monitoring System for Wind Turbines: Supergen Wind Energy Technologies Consortium Report. 2012. Available online: http://www.supergen-wind.org.uk (accessed on 25 May 2014).
- Tian, S.; Li, Z.; Li, H.; Hu, Y.; Lu, M. Active Control Method for Torsional Vibration of DFIG Drive Chain Under Asymmetric Power Grid Fault. IEEE Access 2020, 8, 155611–155618. [Google Scholar] [CrossRef]
- Duvnjak, I.; Damjanović, D.; Bartolac, M.; Skender, A. Mode Shape-Based Damage Detection Method (MSDI): Experimental Validation. Appl. Sci. 2021, 11, 4589. [Google Scholar] [CrossRef]
- Villa, L.F.; Reñones, A.; Perán, J.R.; de Miguel, L.J. Statistical fault diagnosis based on vibration analysis for gear test-bench under non-stationary conditions of speed and load. Mech. Syst. Signal Process. 2012, 29, 436–446. [Google Scholar] [CrossRef]
- Chen, G. Feature Extraction and Intelligent Diagnosis for Ball Bearing Early Faults. Acta Aeronaut. Astronaut. Sin. 2009, 30, 362–367. [Google Scholar]
- Chen, X.; Chen, Y.; Long, Z.; Zhang, X.; Cheng, Z. Bearing fault diagnosis method based on SVM-HMM. J. Wuhan Univ. Technol. IAME 2016, 38, 267–270. [Google Scholar]
- Wang, B.; Ke, H.; Ma, X.; Yu, B. Fault Diagnosis Method for Engine Control System Based on Probabilistic Neural Network and Support Vector Machine. Appl. Sci. 2019, 9, 4122. [Google Scholar] [CrossRef] [Green Version]
- Zhang, X.; Han, P.; Xu, L.; Zhang, F.; Wang, Y.; Gao, L. Research on Bearing Fault Diagnosis of Wind Turbine Gearbox Based on 1DCNN-PSO-SVM. IEEE Access 2020, 8, 192248–192258. [Google Scholar] [CrossRef]
- Huo, Z.; Zhang, Y.; Shu, L.; Gallimore, M. A New Bearing Fault Diagnosis Method Based on Fine-to-Coarse Multiscale Permutation Entropy, Laplacian Score and SVM. IEEE Access 2019, 7, 17050–17066. [Google Scholar] [CrossRef]
- Wang, Y.; Zhu, Y.; Wang, Q.; Tang, Y.; Duan, F.; Yang, Y. Complex Fault Source Identification Method for High-Voltage Trip-Offs of Wind Farms Based on SU-MRMR and PSO-SVM. IEEE Access 2020, 8, 130379–130391. [Google Scholar] [CrossRef]
- Lv, M.; Su, X.; Chen, C.; Liu, S. Application of Wavelet Packet Energy Entropy and EMD Conjoint Analysis in Fault Diagnosis of Wind Turbine Bearing. Mach. Electron. 2018, 36, 8–12. [Google Scholar]
- Jiang, B.; Cao, H. Fault Diagnosis of GA-SVM Gearbox Based on Wavelet Decomposition and Sample Entropy. Modul. Mach. Tool Autom. Manuf. Tech. 2019, 78–82. [Google Scholar] [CrossRef]
- Yang, D.; Li, H.; Hu, Y.; Zhao, J.; Xiao, H.; Lan, Y. Vibration condition monitoring system for wind turbine bearings based on noise suppression with multi-point data fusion. Renew. Energy 2016, 92, 104–116. [Google Scholar] [CrossRef]
- Feng, Z.; Liang, M. Fault diagnosis of wind turbine planetary gearbox under nonstationary conditions via adaptive optimal kernel time–frequency analysis. Renew. Energy 2014, 66, 468–477. [Google Scholar] [CrossRef]
- Su, N.; Li, X.; Zhang, Q. Fault Diagnosis of Rotating Machinery Based on Wavelet Domain Denoising and Metric Distance. IEEE Access 2019, 7, 73262–73270. [Google Scholar] [CrossRef]
- Zhang, J.; Sun, H.; Sun, Z.; Dong, W.; Dong, Y. Fault Diagnosis of Wind Turbine Power Converter Considering Wavelet Transform, Feature Analysis, Judgment and BP Neural Network. IEEE Access 2019, 7, 179799–179809. [Google Scholar] [CrossRef]
- Rezamand, M.; Kordestani, M.; Carriveau, R.; Ting, D.S.; Saif, M. A New Hybrid Fault Detection Method for Wind Turbine Blades Using Recursive PCA and Wavelet-Based PDF. IEEE Sens. J. 2020, 20, 2023–2033. [Google Scholar] [CrossRef]
- Yan, X. Research on Fault Early Warning Method for Wind Turbine Based on Condition Identification; North China Electric Power University: Beijing, China, 2017. [Google Scholar]
- Vives, J.; Quiles, E.; García, E. AI techniques applied to diagnosis of vibrations failures in wind turbines. IEEE Lat. Am. Trans. 2020, 18, 1478–1486. [Google Scholar] [CrossRef]
- Lu, L.; He, Y.; Wang, T.; Shi, T.; Ruan, Y. Wind Turbine Planetary Gearbox Fault Diagnosis Based on Self-Powered Wireless Sensor and Deep Learning Approach. IEEE Access 2019, 7, 119430–119442. [Google Scholar] [CrossRef]
- Hsu, J.; Wang, Y.; Lin, K.; Chen, M.; Hsu, J.H. Wind Turbine Fault Diagnosis and Predictive Maintenance Through Statistical Process Control and Machine Learning. IEEE Access 2020, 8, 23427–23439. [Google Scholar] [CrossRef]
- Luo, Z.; Liu, C.; Liu, S. A Novel Fault Prediction Method of Wind Turbine Gearbox Based on Pair-Copula Construction and BP Neural Network. IEEE Access 2020, 8, 91924–91939. [Google Scholar] [CrossRef]
- Schlechtingen, M.; Santos, I.F. Comparative analysis of neural network and regression based condition monitoring approaches for wind turbine fault detection. Mech. Syst. Signal Process. 2011, 25, 1849–1875. [Google Scholar] [CrossRef] [Green Version]
- Ahmad, R.; Kamaruddin, S. An overview of time-based and condition-based maintenance in industrial application. Comput. Ind. Eng. 2012, 63, 135–149. [Google Scholar] [CrossRef]
- Mohammed, A.; Hu, B.; Hu, Z.; Djurovic, S.; Ran, L.; Barnes, M.; Mawby, P.A. Distributed Thermal Monitoring of Wind Turbine Power Electronic Modules Using FBG Sensing Technology. IEEE Sens. J. 2020, 20, 9886–9894. [Google Scholar] [CrossRef]
- Glowacz, A. Ventilation Diagnosis of Angle Grinder Using Thermal Imaging. Sensors 2021, 21, 2853. [Google Scholar] [CrossRef]
- Nicholas, G.; Clarke, B.P.; Dwyer-Joyce, R.S. Detection of Lubrication State in a Field Operational Wind Turbine Gearbox Bearing Using Ultrasonic Reflectometry. Lubricants 2021, 9, 6. [Google Scholar] [CrossRef]


| Faulty Module | Main Fault Type | Fault Cause |
|---|---|---|
| Gearbox gear | Gear break | Sudden impact overload, bearing damage, shaft bending, continuous contact fatigue, foreign matter mixed in the meshing area, etc. |
| Tooth surface wear | Material defects, poor lubrication, foreign matter mixed in the meshing area, etc. | |
| Tooth surface pitting | Poor lubrication, over-high speed, over-high oil temperature | |
| Tooth surface bonding | Poor lubrication, over-concentrated local load, over-high oil temperature, over-high speed, etc. | |
| Bearings (gearbox, main shaft, generator, etc.) | Rust and corrosion | Poor sealing, insufficient rust prevention |
| Wear | Poor lubrication, foreign matter mixed in, etc. | |
| Surface peeling | Overload, design or installation defect, foreign matter mixed in, over-small clearances, etc. | |
| Bonding | Over-small clearance, poor lubrication, overload, rolling body deflection, etc. | |
| Crack | Impact load, fatigue friction crack, large foreign body stuck in, etc. | |
| Shafting (main shaft, low/high speed shaft in gearbox, etc.) | Shaft misalignment | Design or installation defect, etc. |
| Shaft bending | Material and installation defect, stress concentration is not eliminated during the manufacturing process, gearbox damaged, etc. | |
| Shaft fracture | Material defect, stress concentration is not eliminated during the manufacturing process, gearbox damaged, etc. | |
| Coupling | Misalignment | The gearbox high-speed shaft is misaligned with the generator, bearing air gap is too large, the ball is slightly corroded, etc. |
| Grinding disc fracture | Safety cover scratch, the high-speed shaft of the gearbox and the generator are misaligned, etc. | |
| Generator winding fault | Rotor fault | Rotor eccentricity fault, bearing deformation, design defect, poor installation, etc. |
| Stator fault | Winding insulation aging |
| Turbine | Fault Type | Fault Location | Abnormal Phenomena | Maintenance after Early Warning | Duration between Early Warning and Alarm from SCADA |
|---|---|---|---|---|---|
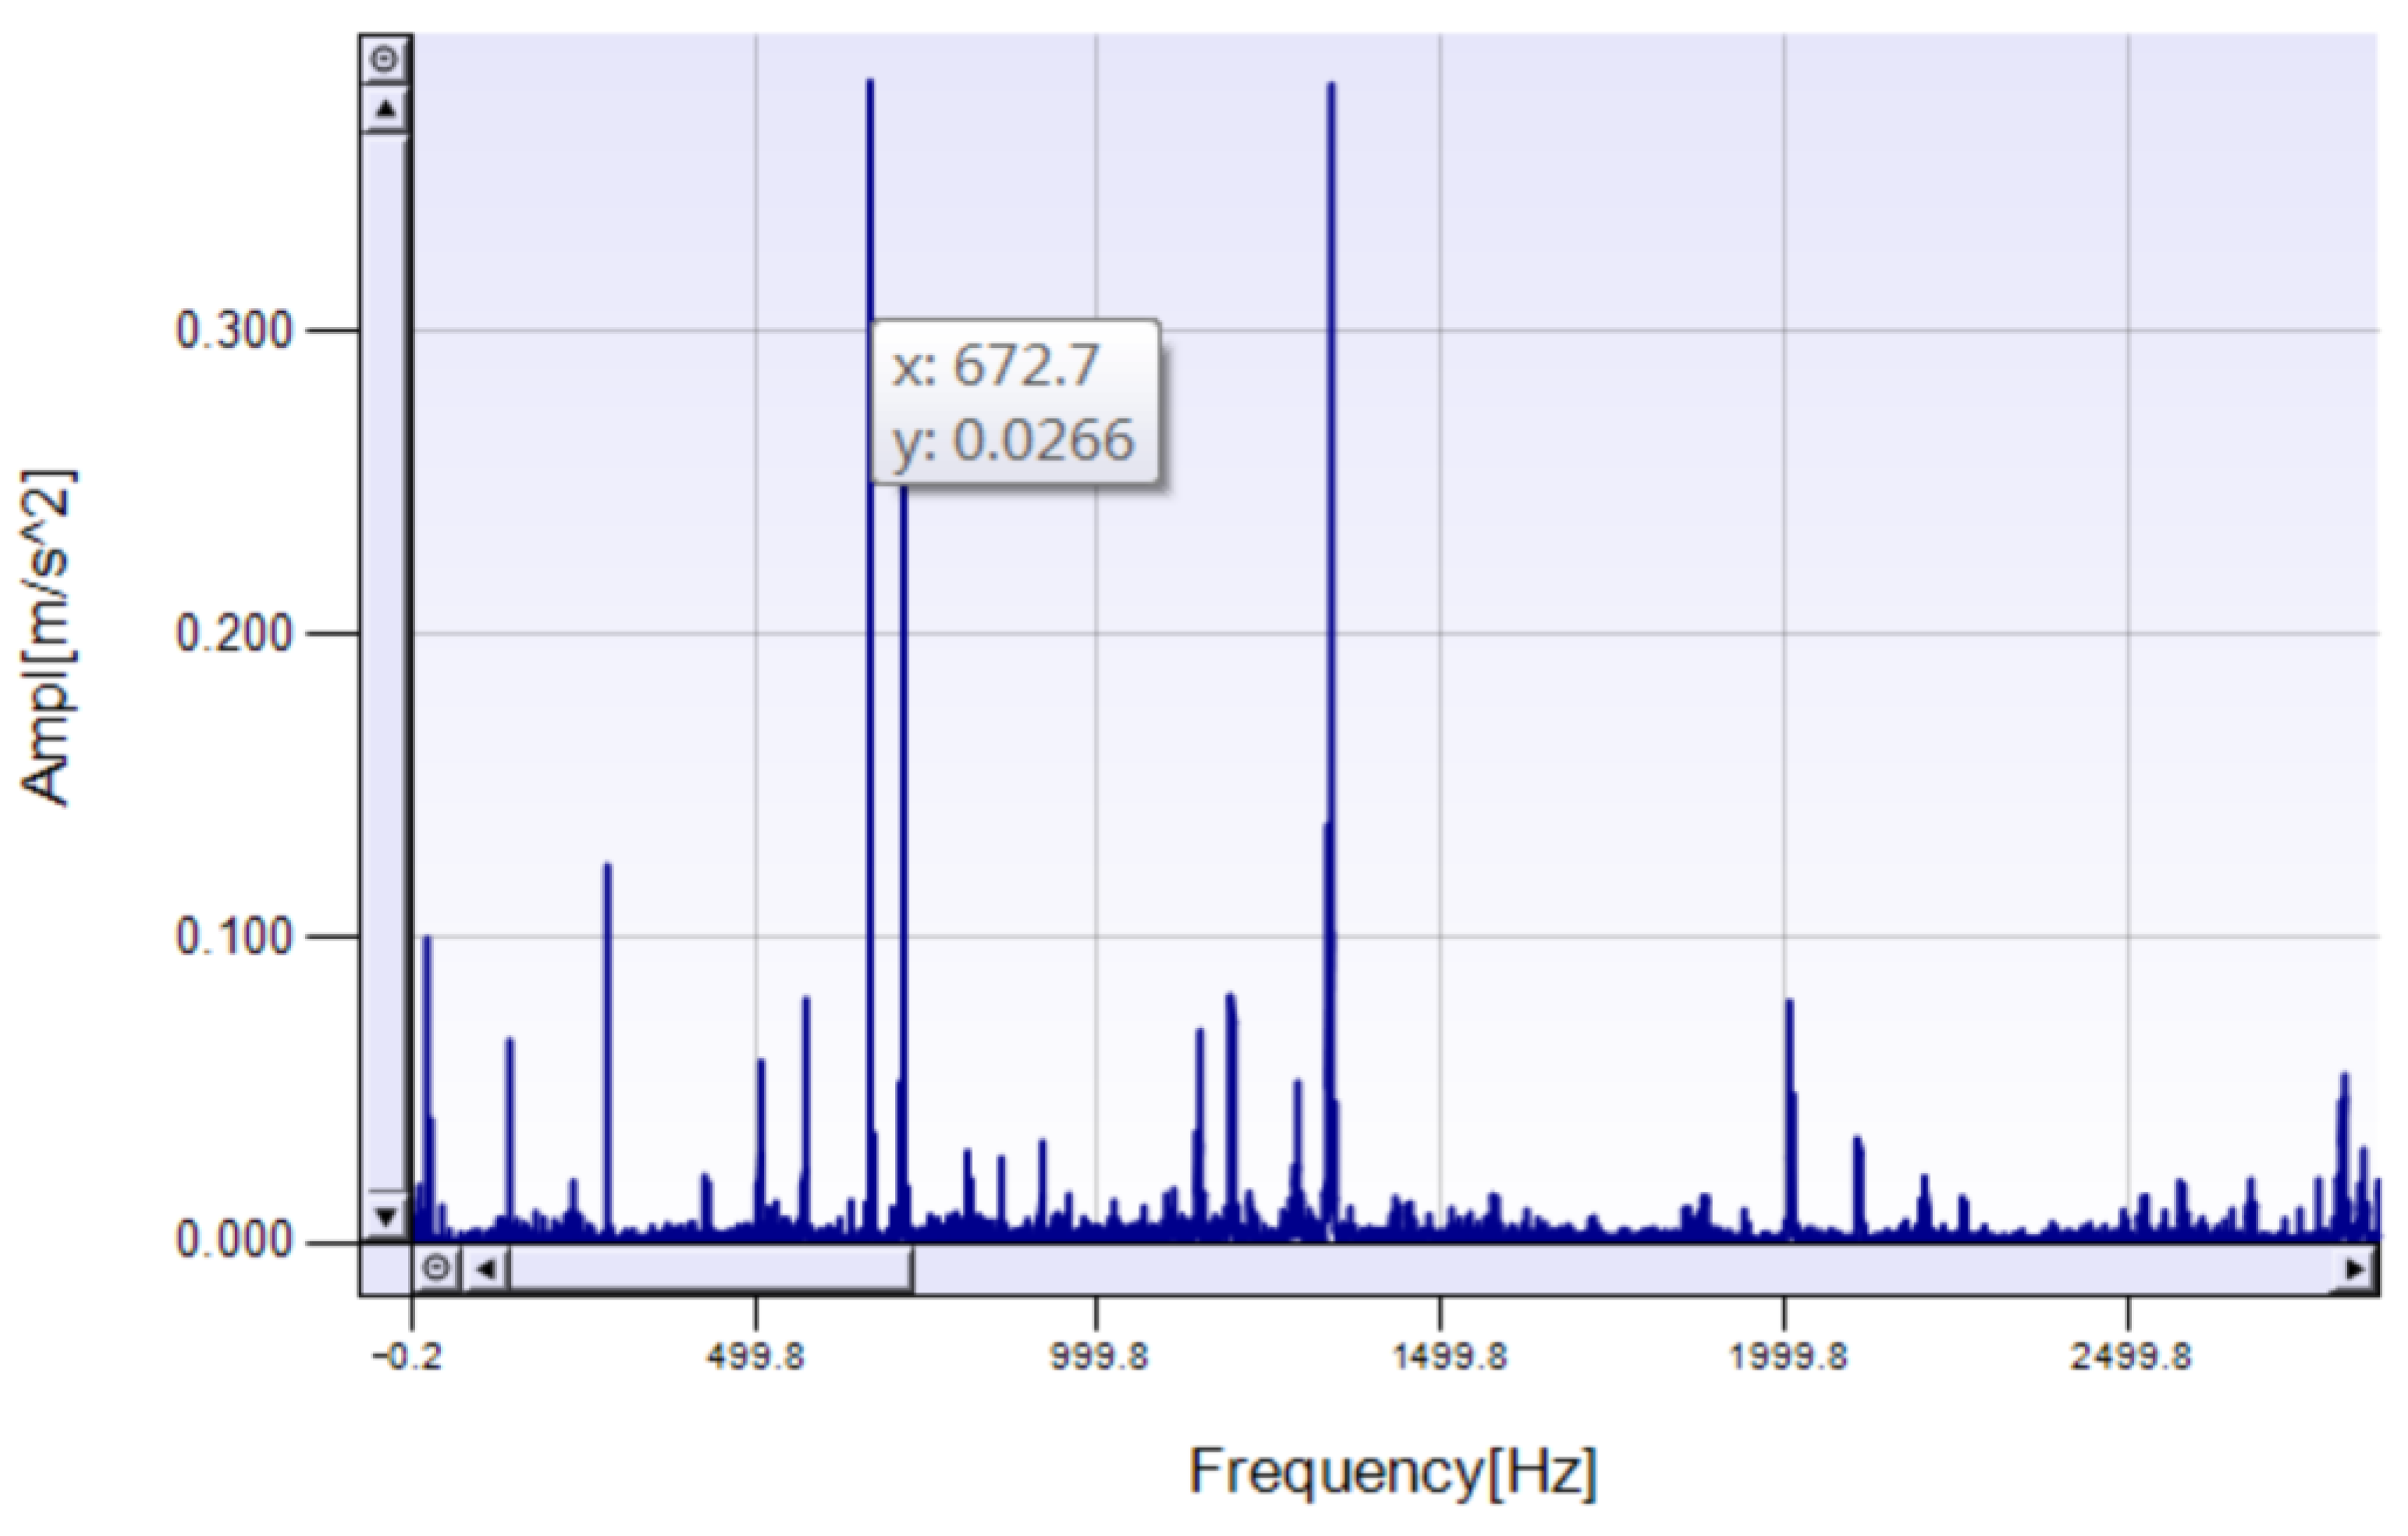
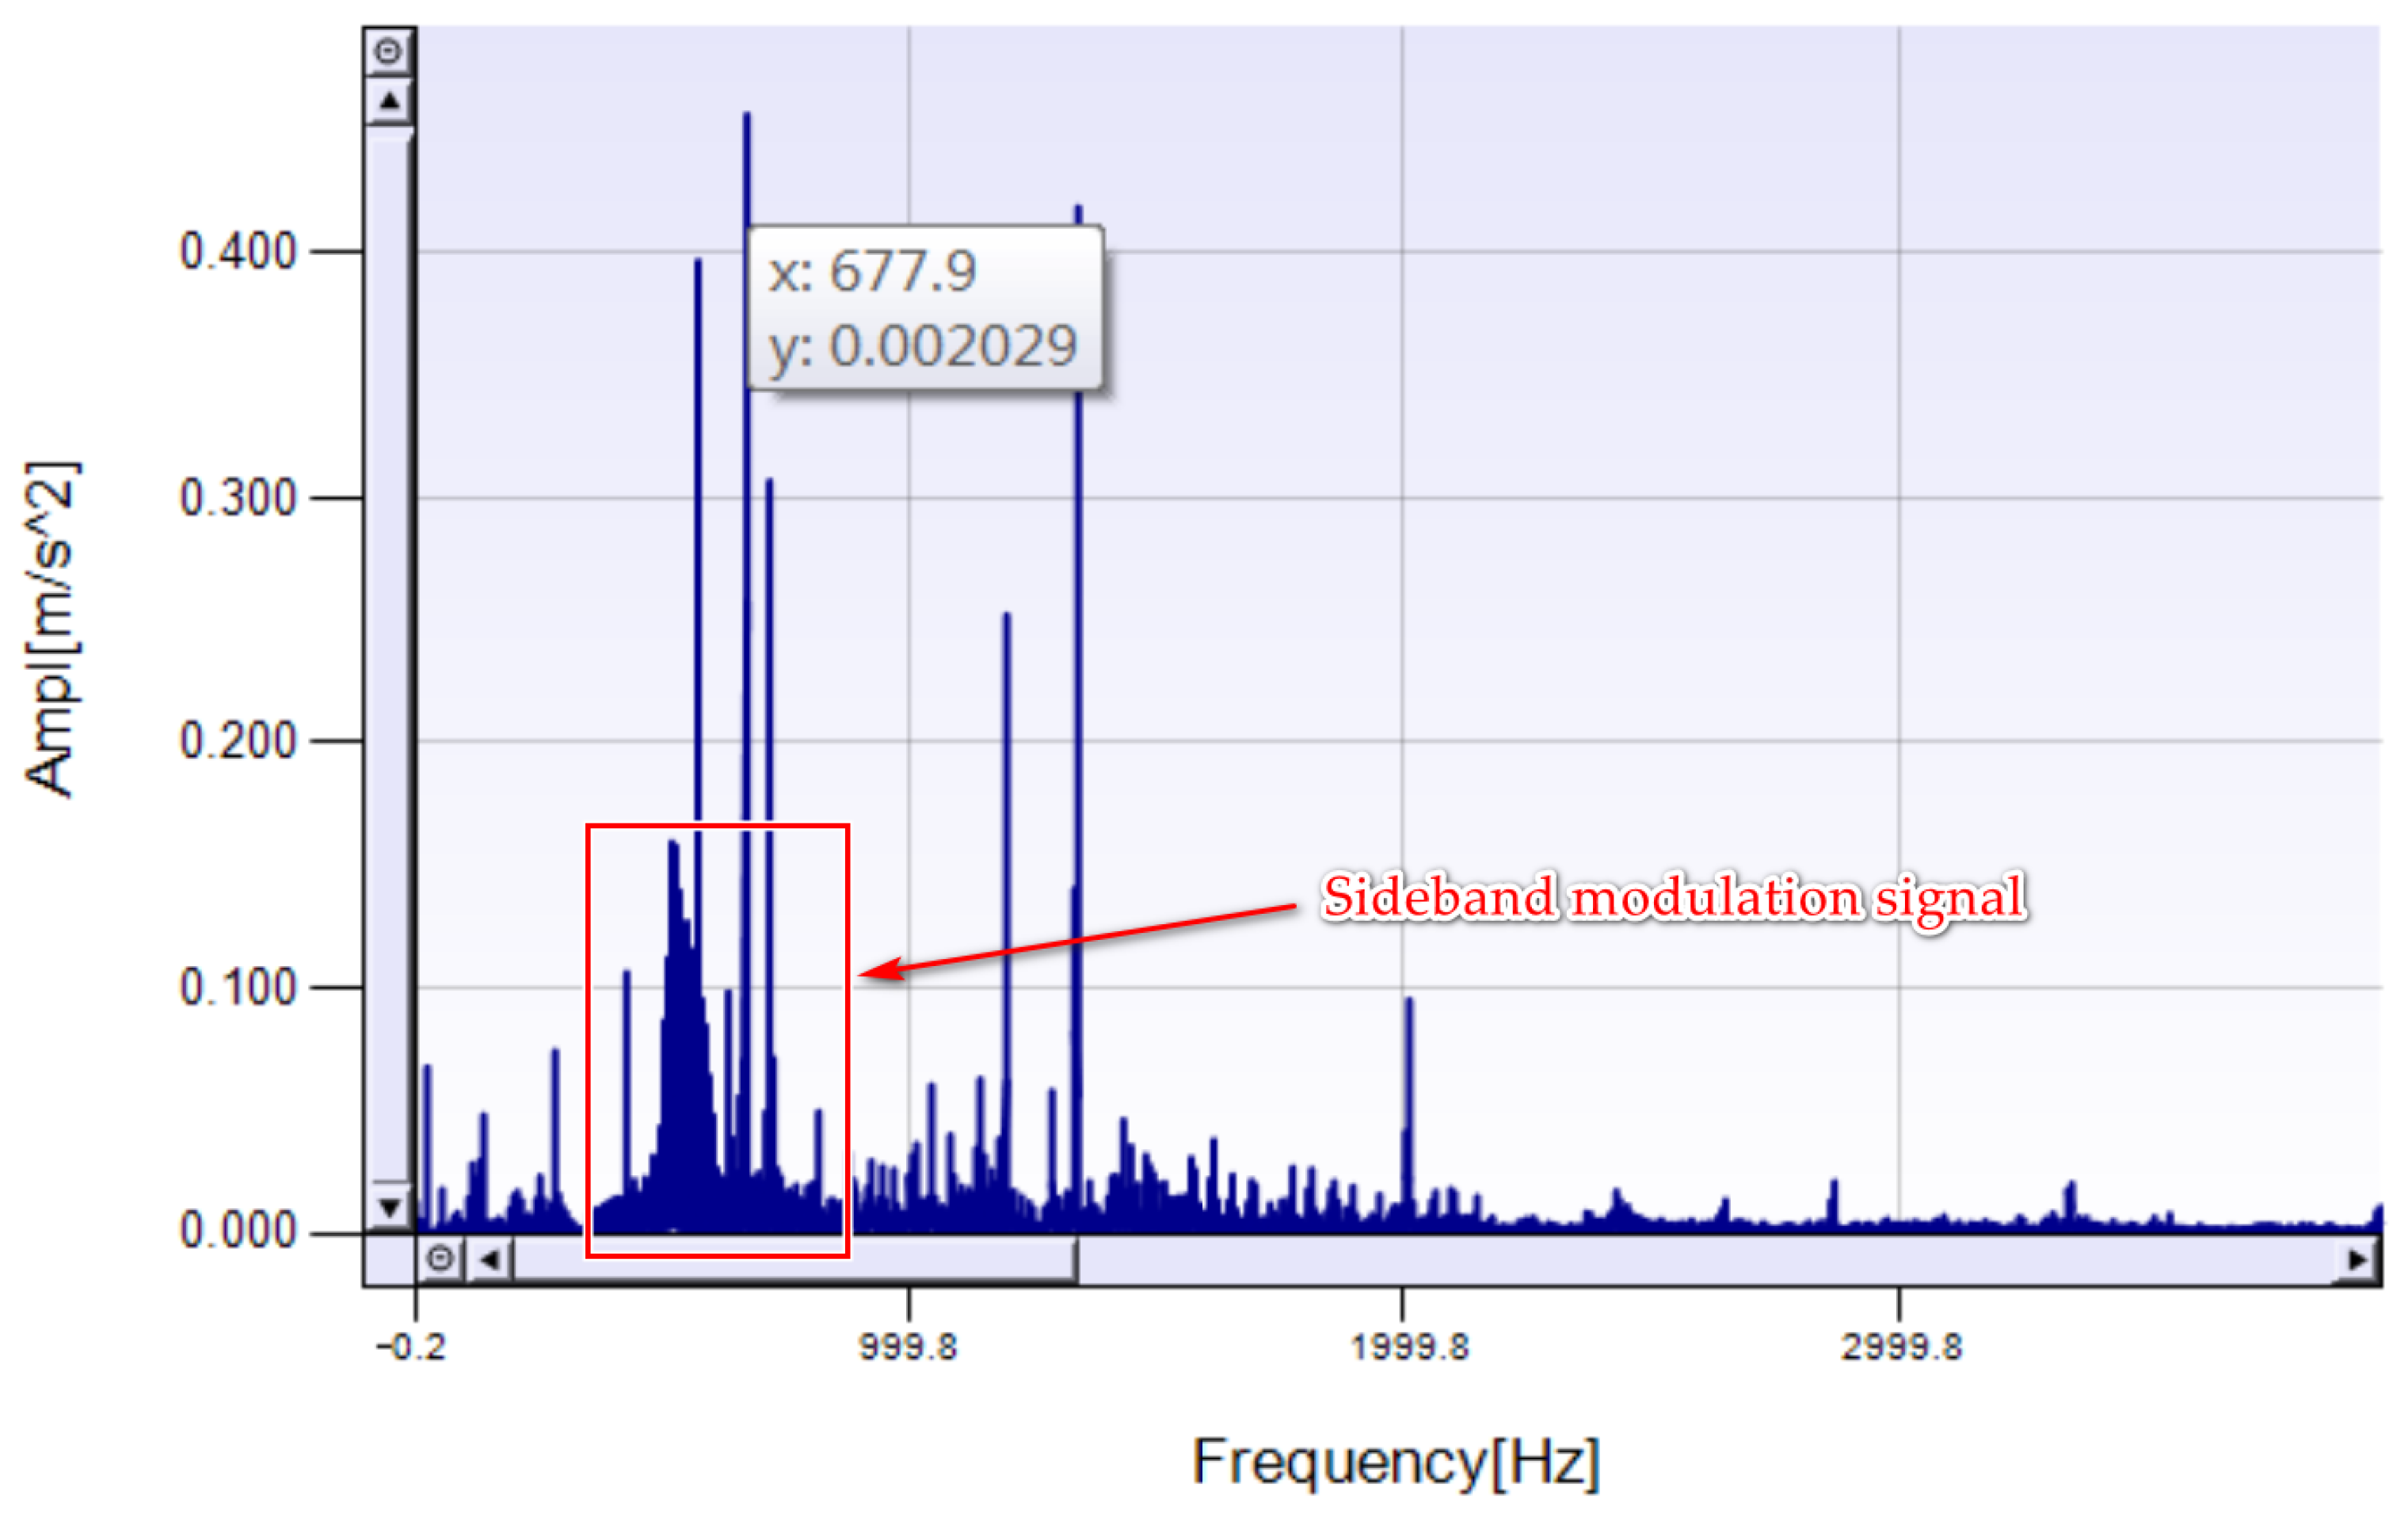
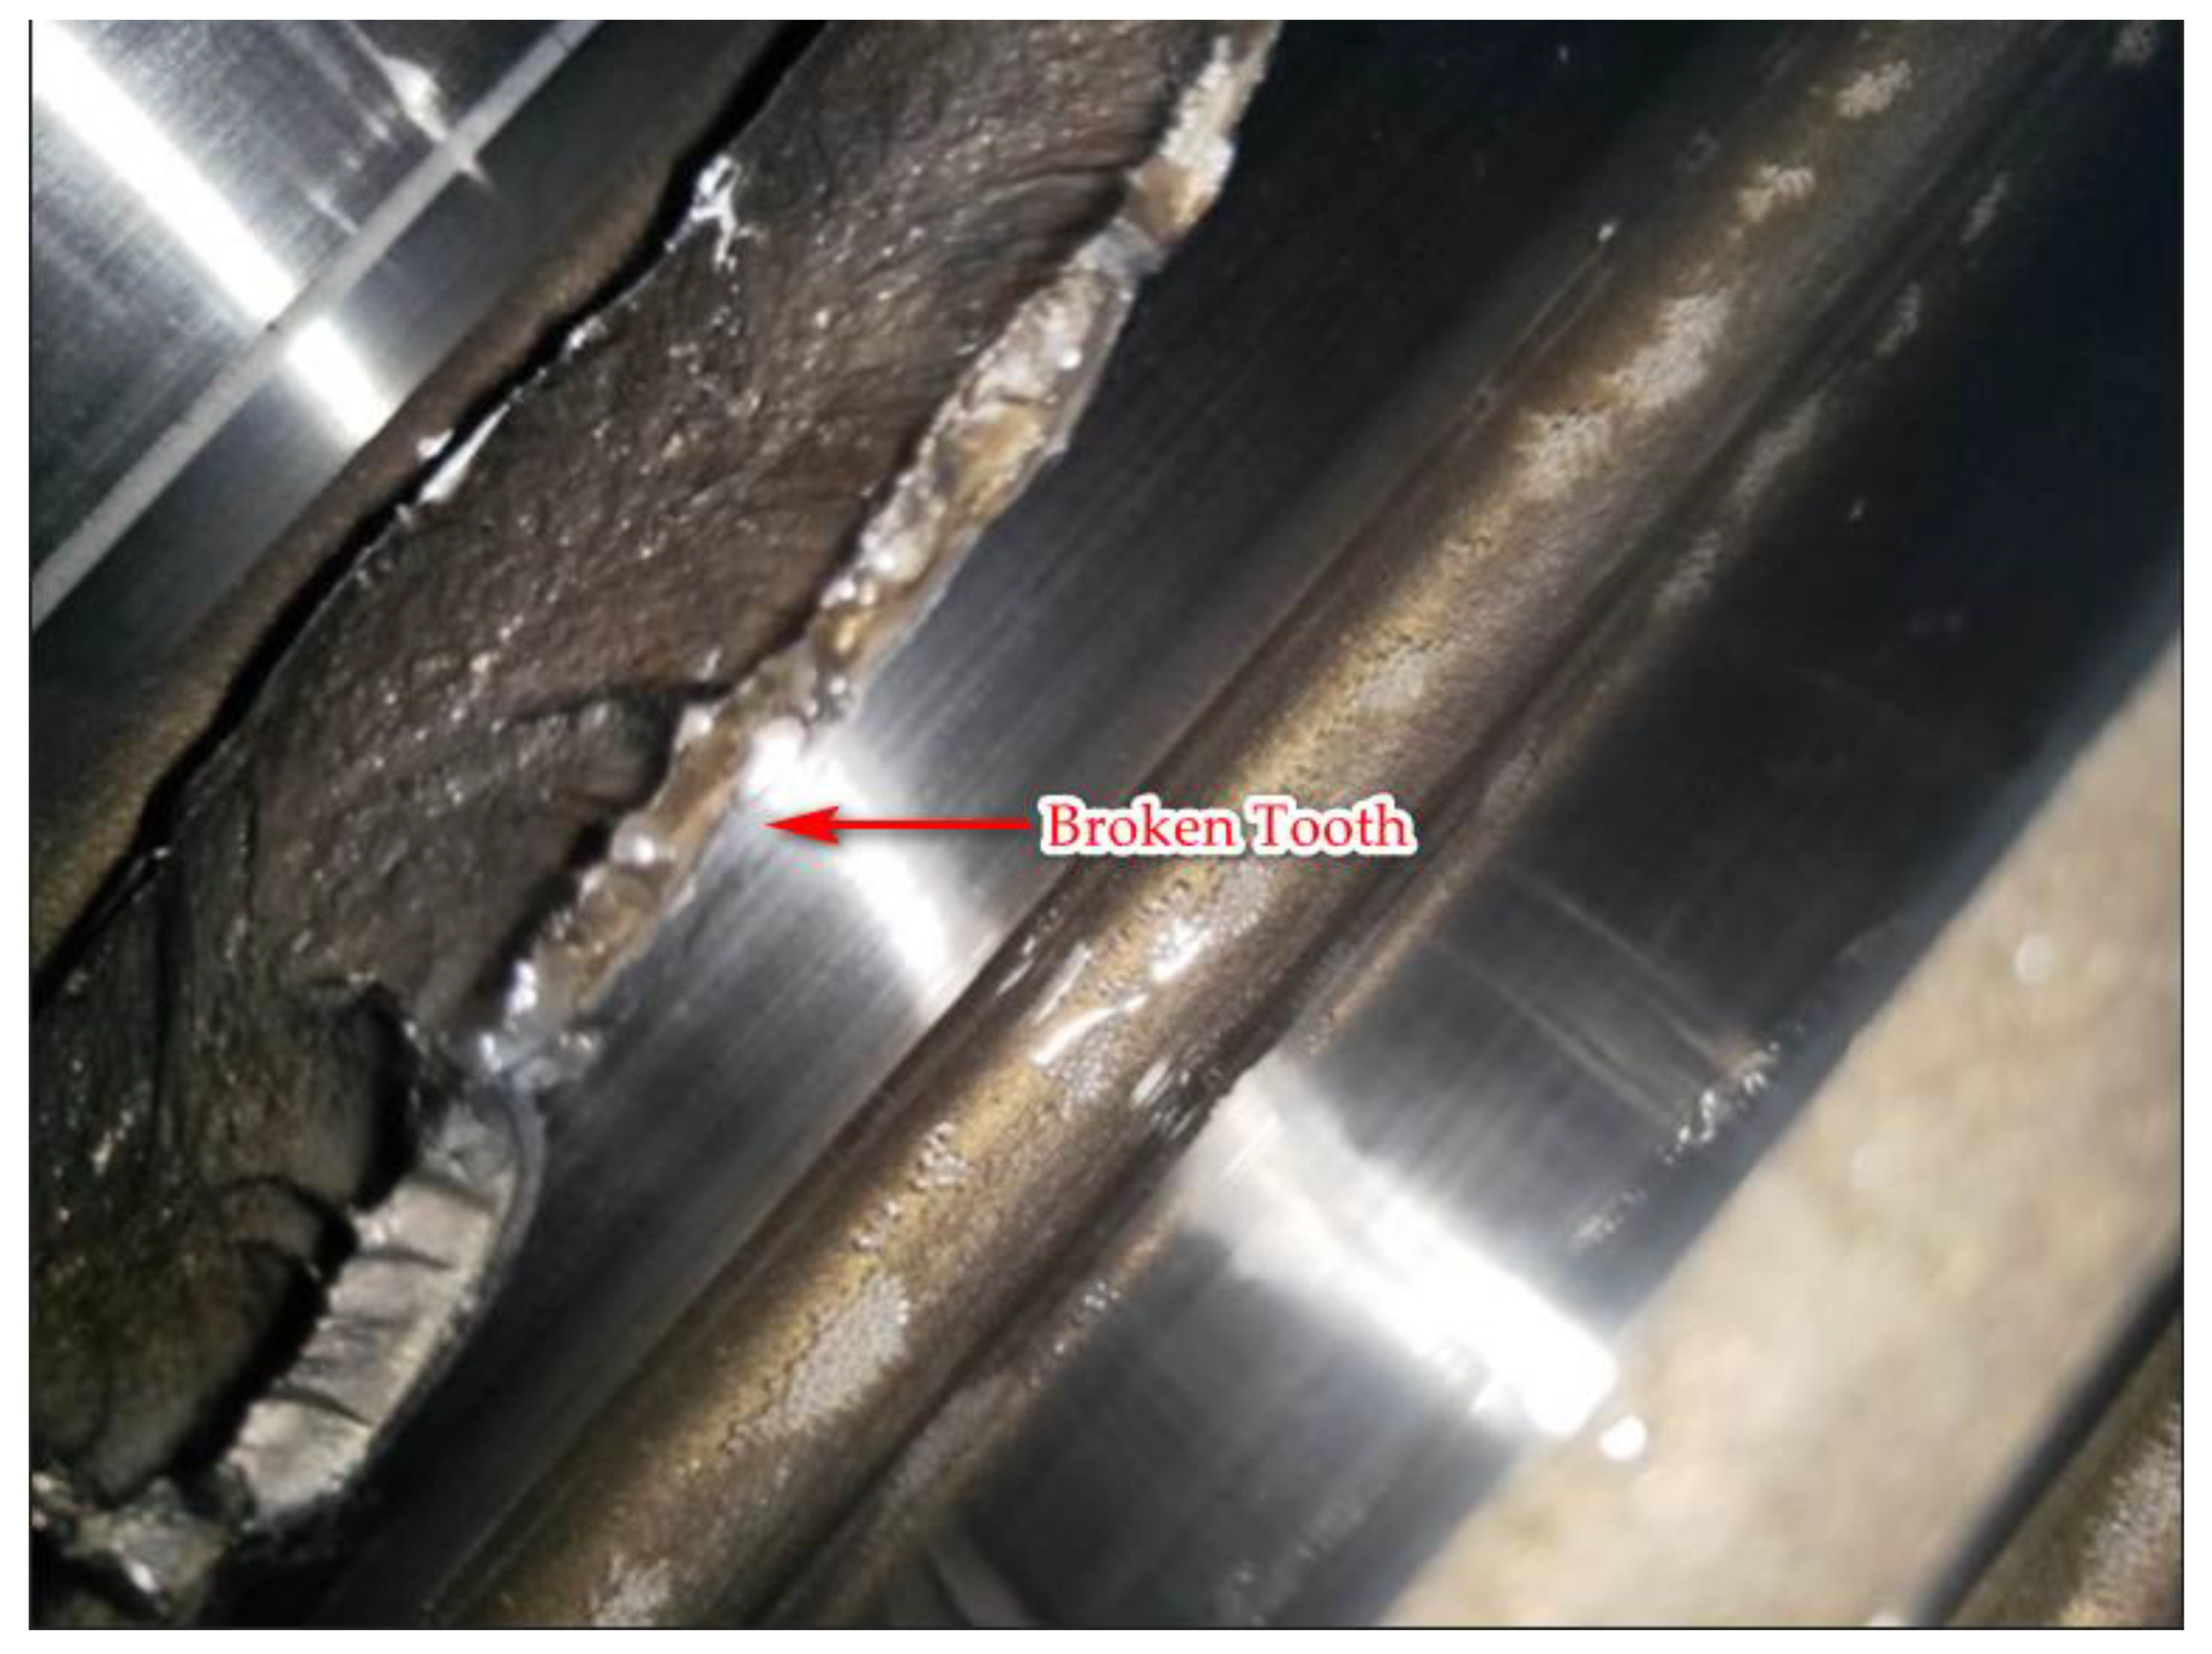
| #23 | Broken tooth | Gear at medium speed shaft | Sideband signal in frequency spectrum | Yes | - |
| #32 | Broken tooth | Minor gear at medium speed shaft | Sideband signal in frequency spectrum | Yes | - |
| #15 | Broken tooth | Minor gear at medium speed shaft | Sideband signal in frequency spectrum | Yes | - |
| #30 | Corrosion Tooth | Planet bearing | Abnormal peak in frequency spectrum near the characteristic frequency of planet bearing | No | 14 days |
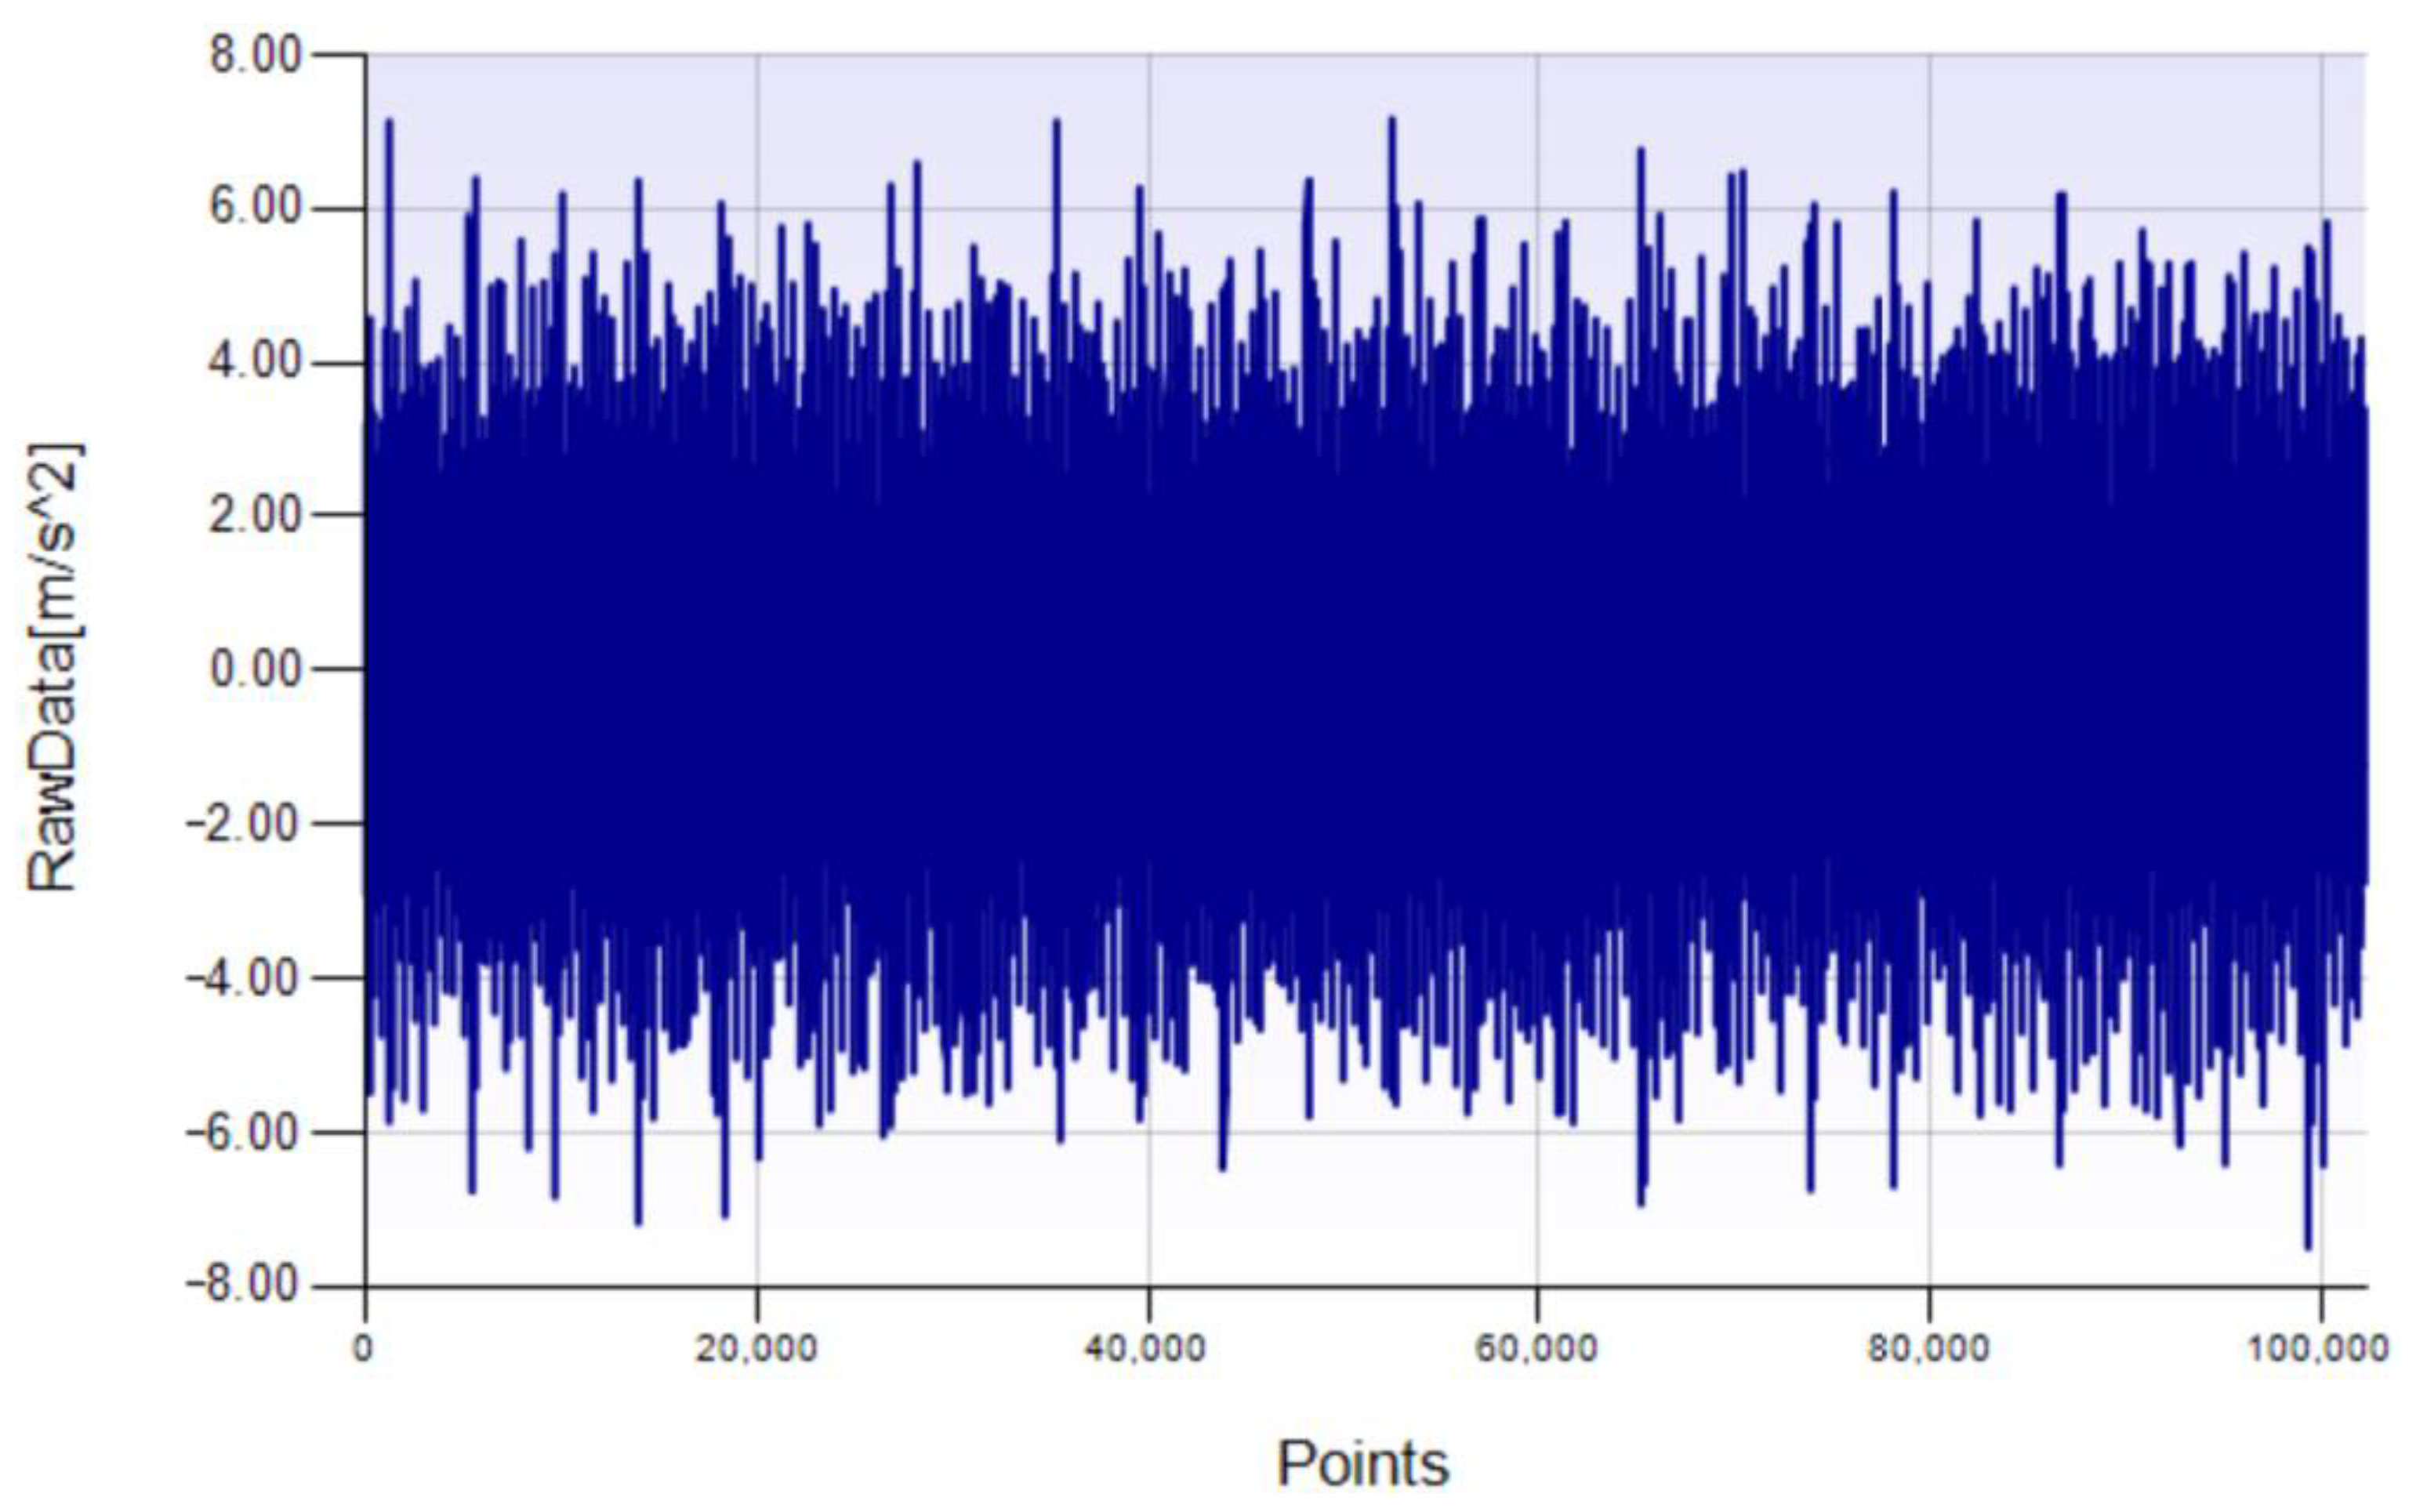
| #13 | Corrosion | Outer raceway of rear bearing | Exorbitant peak value of vibration signal | No | 5 days |
Publisher’s Note: MDPI stays neutral with regard to jurisdictional claims in published maps and institutional affiliations. |
© 2021 by the authors. Licensee MDPI, Basel, Switzerland. This article is an open access article distributed under the terms and conditions of the Creative Commons Attribution (CC BY) license (https://creativecommons.org/licenses/by/4.0/).
Share and Cite
Xu, Z.; Yang, P.; Zhao, Z.; Lai, C.S.; Lai, L.L.; Wang, X. Fault Diagnosis Approach of Main Drive Chain in Wind Turbine Based on Data Fusion. Appl. Sci. 2021, 11, 5804. https://doi.org/10.3390/app11135804
Xu Z, Yang P, Zhao Z, Lai CS, Lai LL, Wang X. Fault Diagnosis Approach of Main Drive Chain in Wind Turbine Based on Data Fusion. Applied Sciences. 2021; 11(13):5804. https://doi.org/10.3390/app11135804
Chicago/Turabian StyleXu, Zhen, Ping Yang, Zhuoli Zhao, Chun Sing Lai, Loi Lei Lai, and Xiaodong Wang. 2021. "Fault Diagnosis Approach of Main Drive Chain in Wind Turbine Based on Data Fusion" Applied Sciences 11, no. 13: 5804. https://doi.org/10.3390/app11135804
APA StyleXu, Z., Yang, P., Zhao, Z., Lai, C. S., Lai, L. L., & Wang, X. (2021). Fault Diagnosis Approach of Main Drive Chain in Wind Turbine Based on Data Fusion. Applied Sciences, 11(13), 5804. https://doi.org/10.3390/app11135804