Article

A Reaction–Diffusion–Reaction System for Forming Periodic Precipitation Bands of Cu-Fe-Based Prussian Blue Analogues

Department of Chemical and Biological Sciences, Faculty of Science, Japan Women’s University, 2-8-1 Mejirodai, Bunkyo-ku, Tokyo 112-8681, Japan
*
Author to whom correspondence should be addressed.
Appl. Sci. 2021, 11(11), 5000; https://doi.org/10.3390/app11115000
Submission received: 29 March 2021 / Revised: 18 May 2021 / Accepted: 24 May 2021 / Published: 28 May 2021
(This article belongs to the Section Applied Physics General)

Abstract

:

Featured Application

Material science and engineering.

Abstract

We propose a simple and novel system to form precipitation patterns of Cu-Fe-based Prussian blue analogues (Cu-Fe PBA) in agarose gel through coupled electrochemical reactions, reactant ion diffusion influenced by electric field, and precipitation reactions. The spatiotemporal evolution, spatial distribution, and crystallite morphologies of the precipitates were investigated by visual inspection, Fe Kα intensity distribution measurements, and optical and scanning electron microscope observations. The observed precipitation patterns and their evolution depended on the applied voltage. Multicolored periodic precipitation bands were stochastically formed under cyclic alternating voltage (4 V for 1 h and then 1 V for 4 h per cycle). The distances between adjacent bands were randomly distributed (0.30 ± 0.25 mm). The sizes and shapes of the crystallites generated in the gel were position-dependent. Cubic but fairly irregular crystallites (0.1–0.8 μm) were formed in the periodic bands, whereas definitely cube-shaped crystallites (1–3 μm) appeared close to the anode. These cube-like reddish–brown crystallites were assigned to Cu-FeII PBA. In some periodic bands, plate-like blue crystallites (assigned to Cu(OH)2) were also present. Future issues for potential applications of the observed periodic banding for selective preparation of Cu-Fe PBA crystallites were discussed.

1. Introduction

Liesegang bands (periodic precipitation bands of slightly soluble inorganic compounds in gels) are formed spontaneously when a precipitation reaction is coupled to the diffusion of reagents in a sample tube filled with hydrogels [1,2,3]. A typical setup for observing Liesegang bands (via the reaction–diffusion (RD) processes) is illustrated in Figure 1a. In this RD setup, two electrolytes are loaded in separate columns in a single sample tube. The longer gel column is placed at the bottom, where a continuous precipitation zone (sometimes called the “turbulent zone” [4]) and Liesegang bands form. The shorter column on top (in the form of a gel or aqueous solution) has a higher electrolyte concentration. These electrolytes are denoted as the “inner” and “outer” electrolytes, respectively.
Liesegang banding has been continuously investigated since its discovery in 1896 [1]. Today, it still attracts considerable interest as a self-organization phenomenon [5] that has the potential for spontaneously creating complex materials and functional devices [4,6,7]. However, only limited systems have been reported for forming Liesegang bands [2]. To apply such periodic banding in material science and engineering, it is important to widely explore systems in which Liesegang-band-like precipitation patterns could form.
From a technological point of view, it is important to control the spacing between the adjacent Liesegang bands. A powerful approach to change precipitation patterns is the use of an electric field [2,3]. In fact, the spacing of Liesegang bands has been reported to show a significant dependence on the direction and strength of electric fields [2,8,9,10,11] and alternating electric fields [2,12]. A schematic illustration of the RD setup used for examining Liesegang banding under an electric field is shown in Figure 1b.
In this study, we propose a simple reaction–diffusion–reaction (RDR) setup, where electrochemical reactions, diffusion of reactant ions influenced by electric field, and precipitation reactions are coupled to form periodic precipitation patterns in agarose gel (Figure 1c), which has not yet been investigated. Although the proposed RDR setup appears similar to the RD setup in Figure 1b, the processes occurring within these systems are quite different. Instead of diffusion from the outer electrolyte column, the reactant ions are produced at the electrodes through electrochemical reactions. Specifically, in a tube containing agarose gel, Cu2+ and [Fe(CN)6]4− ions are generated at the anode and cathode, respectively, when the applied voltage exceeds the sum of the overpotential of the electrodes (typically around 0.5 V in aqueous solutions at 25 °C [13]) and the potentials of the electrode reactions (Cu2+ + 2e = Cu + 0.340 V and [Fe(CN)6]3− + e = [Fe(CN)6]4− + 0.361 V [14]), i.e., ~1 V. The reactant ions are transported under the influences of the electric field and diffusion (similar to the setup in Figure 1b in this aspect) and react with each other to form precipitates of Cu-Fe-based Prussian blue analogues (Cu-Fe PBA), which are represented by the formula KxCuy[Fe(CN)6]z1−znH2O. Note that here □ indicates Fe(CN)6 vacancies, i.e., defects arising from missing Fe(CN)6 moieties (x = 2, y = z = 1, and n = 0 for Cu-FeII PBA with no Fe(CN)6 vacancies, whereas x = y = z = 1 and n = 0 for Cu-FeIII PBA with no Fe(CN)6 vacancies). Crucially, the concentrations of reactant ions can be controlled in situ by varying the voltage of the electrodes.
The proposed RDR setup could expand the applications of precipitation patterning in material science and engineering. Because the reactant ions are generated from the electrodes, various changes can be made to their concentrations during the experiment to yield different precipitation patterns. For instance, pulsatile concentration changes are easily achievable by tuning the voltage of the power supply. Such tuning is capable of generating diverse precipitation patterns. Moreover, because the electrodes are generally made of metals, their microfabrication is relatively easy. This workability could expand the use of periodic banding for micro- and nanotechnology, which was opened up by Grzybowski’s group using a wet stamping technique (WETS) [4,6,7].
It should be noted that Cu-Fe PBA have attracted significant attention as interesting functional materials for electrodes [15,16], hydrogen storage [17], and CO2 adsorption [18]. Generally, the properties of Prussian blue analogues (PBA) are strongly influenced by the Fe(CN)6 vacancies, which are correlated with the crystal structure, crystallite morphology, and preparation processes [19,20,21,22]. Interestingly, the sizes and shapes of Mn-Fe-based PBA (Mn-Fe PBA) crystallites in Liesegang bands have been reported to depend on the band position [23]. Therefore, if Liesegang band-like periodic patterns of Cu-Fe PBA could form in the proposed RDR setup, then they may be used for simultaneously obtaining Cu-Fe PBA crystallites varying in size and shape (i.e., having different functional properties), and the periodic bands of interest could be subsequently cut out and examined/applied specifically. This possibility is interesting for applications in material science and engineering.
Considering the abovementioned novelty and potential applicability, this pilot study examined the patterning of precipitates formed using the RDR setup shown in Figure 1c, as well as their crystallite morphologies.

2. Materials and Methods

2.1. Reagents

Analytical reagent grade K3[Fe(CN)6], K4[Fe(CN)6]∙3H2O, and CuCl2∙2H2O were obtained from Wako Pure Chemical Industries (Osaka, Japan). Agarose for electrophoresis (gel strength: 1800–2300 g/cm3) was purchased from Kanto Chemical (Tokyo, Japan). All chemicals were used without further purification. All aqueous solutions were prepared using deionized water that had been purified from tap water using a cartridge water purifier (G-10, Organo, Tokyo, Japan).

2.2. Preparation of Gel Samples and Optical Microscope Observation

The sample tube filled with agarose gel containing [Fe(CN)6]3− ions was prepared as follows. K3[Fe(CN)6] powder was dissolved in deionized water at 25 °C to form a 0.050 M [Fe(CN)6]3− solution (30 mL). After adding 2.0 mass% agarose, the mixture was stirred vigorously at 98 °C for 30 s to produce a uniform [Fe(CN)6]3− agarose sol. Note that the density of the employed agarose sol was very high in order to suppress gel shrinkage when a voltage is applied. Using a Pasteur pipette, the prepared sol was transferred to plastic straws (4 mm diameter and ~50 mm long), whose bottoms had been plugged by Cu rods (HIKARI, CM395-4; 4 mm diameter and ~20 mm long), which were used as the cathodes. Because the sol was viscous and solidified quickly (within 1000 s), it did not leak from the bottoms of the straws. Plastic straws were employed as sample holders because they are simple to process and use, low-cost, highly transparent to X-rays, and allow the easy introduction of viscous samples [24]. The hot sol in the straw was allowed to cool to 25 °C, thus forming a solidified gel. The height of the gel column in the sample tube was ~40 mm.
Another Cu rod (HIKARI, CM395-3; 3 mm diameter and ~20 mm long) was placed atop the gel as an anode. This Cu rod was narrower than that at the tube bottom. Because it did not fit tightly inside the straw, the Cu anode could maintain contact with the gel surface even when the electric field caused the gel sample to contract. The cathode and anode were connected to a programmable power supply (1696B, B&K Precision, Yorba Linda, CA, USA). During voltage application at 25 °C for 100 h (current < 1 mA), the precipitation patterns formed in the sample tube were monitored using a digital camera (IXY650, Canon, Japan). The formed patterns were further monitored for 50 h without voltage application, and thus the total observation time was 150 h. The voltage application period of 100 h was chosen because the precipitation patterns showed almost no further changes after ~90 h of constant voltage application. We monitored the sample tube for another 50 h, because the precipitation patterns formed under cyclic alternating voltage conditions sometimes changed noticeably after stopping the applied voltage (as will be shown later).
After monitoring the formed pattern, the gel sample was pulled out of the straw and repeatedly immersed in deionized water (~200 mL) until the water no longer showed the characteristic yellow color of unreacted [Fe(CN)6]3− ions. This soaking process typically took 3 days. The gel sample was then placed in the straw one more time and plugged at both ends by styrene-resin stoppers covered with Parafilm. The repacked gel sample was examined using an optical microscope (SKM-S31C-PC, Saitoh Kougaku, Japan) and then mounted on a handmade holder (acrylic resin, 80 mm × 30 mm × 10 mm (h × w × d)) for X-ray fluorescence (XRF) experiments.
For comparison, the conventional RD setup (illustrated in Figure 1a) was also used to produce precipitation patterns of Cu-Fe PBA in agarose gels (1.0–2.0 mass% agarose). In this case, gel columns containing [Fe(CN)6]3− and [Fe(CN)6]4− ions were separately prepared in glass tubes (4 mm diameter and 60 mm long) in a manner similar to the above description. These gel columns were employed as the inner electrolyte gels, their height was ~35 mm, and the concentration of [Fe(CN)6]3− or [Fe(CN)6]4− therein was 0.010–0.100 M. For the outer electrolyte gel containing Cu2+ ions, CuCl2∙2H2O powder was dissolved in deionized water at 25 °C. After adding 1.0 mass% agarose, the mixture was vigorously stirred at 98 °C for 30 s to prepare a uniform Cu2+ sol (0.100–0.500 M). This sol was poured over the inner electrolyte ([Fe(CN)6]3−/[Fe(CN)6]4−) gel columns using a Pasteur pipette, and it solidified into a gel (height: ~20 mm) within 1000 s.

2.3. Fe Kα Intensity Distribution Measurements of Gel Samples

Laboratory XRF experiments were conducted using a homemade setup, the details of which have been provided previously [25]. Briefly, the excitation source was Cu Kα1 X-rays from an 18-kW generator (RU-300, Rigaku, Tokyo, Japan) operating at 40 kV and 60 mA, and the beam was focused to within 0.5 mm in the horizontal direction by an SiO2 ( 10 1 ¯ 1 ) Johansson-type crystal monochromator. The sample tube mounted on the holder was placed perpendicular to the incident X-ray beam, which had a linear shape, on a computer-controlled X-Z stage. XRF signals from the sample tube were detected using a silicon PIN detector (XR-100CR, Amptek, Bedford, MA, USA), and the data were collected for 90 s using a multichannel analyzer (MCA8000A, Amptek).
The distribution of Fe Kα intensity from the sample tube in the X-direction was monitored at 25 °C by moving the sample tube in the same direction in 0.5- or 1.0-mm increments. After subtracting the constant background from the Fe Kα peak, the integrated intensities over 6214–6647 eV were used to determine the Fe Kα intensity distribution. In situ time-resolved Fe Kα distributions during the evolution of precipitation patterns (as reported in previous studies [25,26,27,28,29,30]) were not measured, because the Fe Kα intensity from the unreacted [Fe(CN)6]3− ions was too strong to allow examination of the distribution of Cu-Fe PBA formed in the tube.

2.4. SEM Observation of Crystallites in the Precipitation Patterns

After the XRF measurements, the gel sample was pulled out of the sample tube and cut into ~1-mm-thick sections. The sections were allowed to dry for a few days in the ambient laboratory environment, stuck on double-sided adhesive carbon tape, and mounted on the aluminum stub of the field-emission scanning electron microscope (SEM; SU8220, Hitachi, Japan). SEM observation was conducted at 2.0 kV at working distances of 3.3–3.9 mm. Several images were acquired with a gradual increase in magnification to observe the crystallites formed in the gel sample.

3. Results

3.1. Precipitation Patterns of Cu-Fe PBA in the Conventional RD Setup for Observing Liesegang Bands

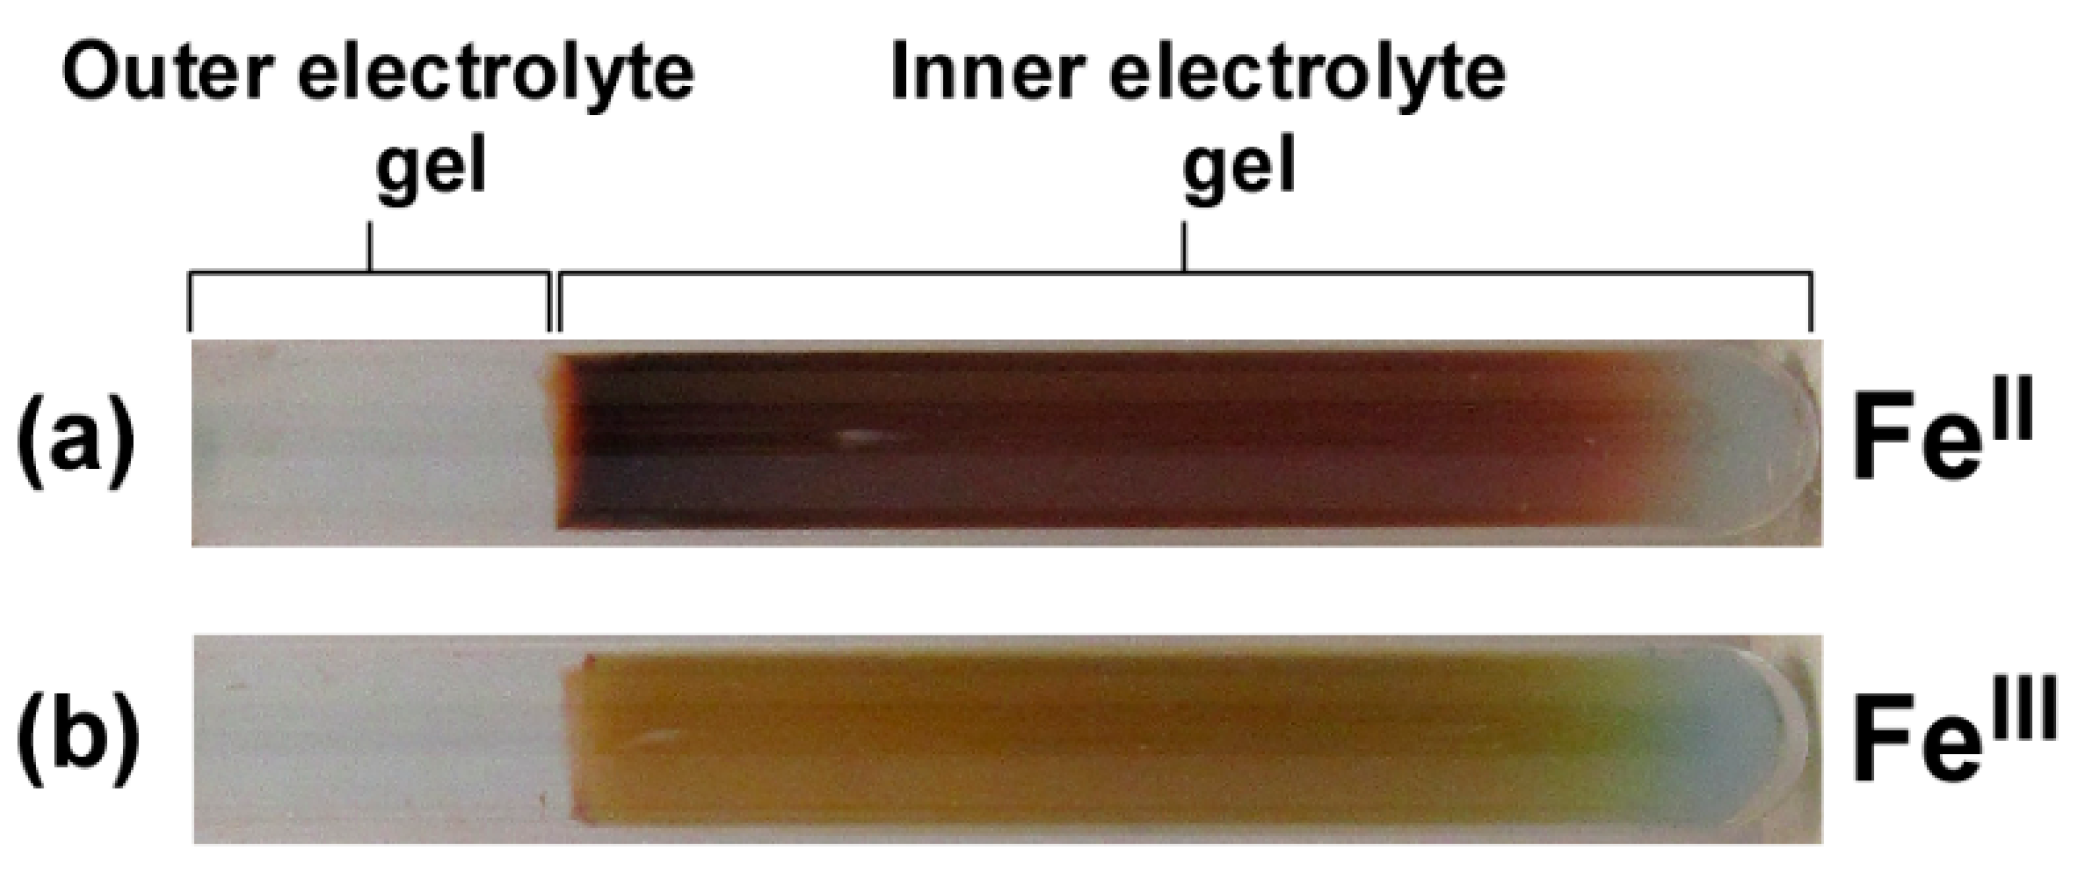
Figure 2 shows the typical precipitation patterns of Cu-Fe PBA formed in the conventional RD setup (Figure 1a). It was found that the Cu-Fe PBA tended to produce a continuous precipitation band in agarose gels, regardless of preparation conditions such as the initial electrolyte concentration and gel density. Similar trends have also been reported for Co-Fe-based PBA (Co-Fe PBA) [25,26] and Prussian blue (PB) [23,25,27], whereas Mn-Fe PBA tend to generate periodic (Liesegang) bands [28,29]. The color of the precipitates depends on the oxidation states of Fe: reddish–brown for Cu-FeII PBA containing [Fe(CN)6]4− ions (Figure 2a), and ocher for Cu-FeIII PBA containing [Fe(CN)6]3− ions (Figure 2b).
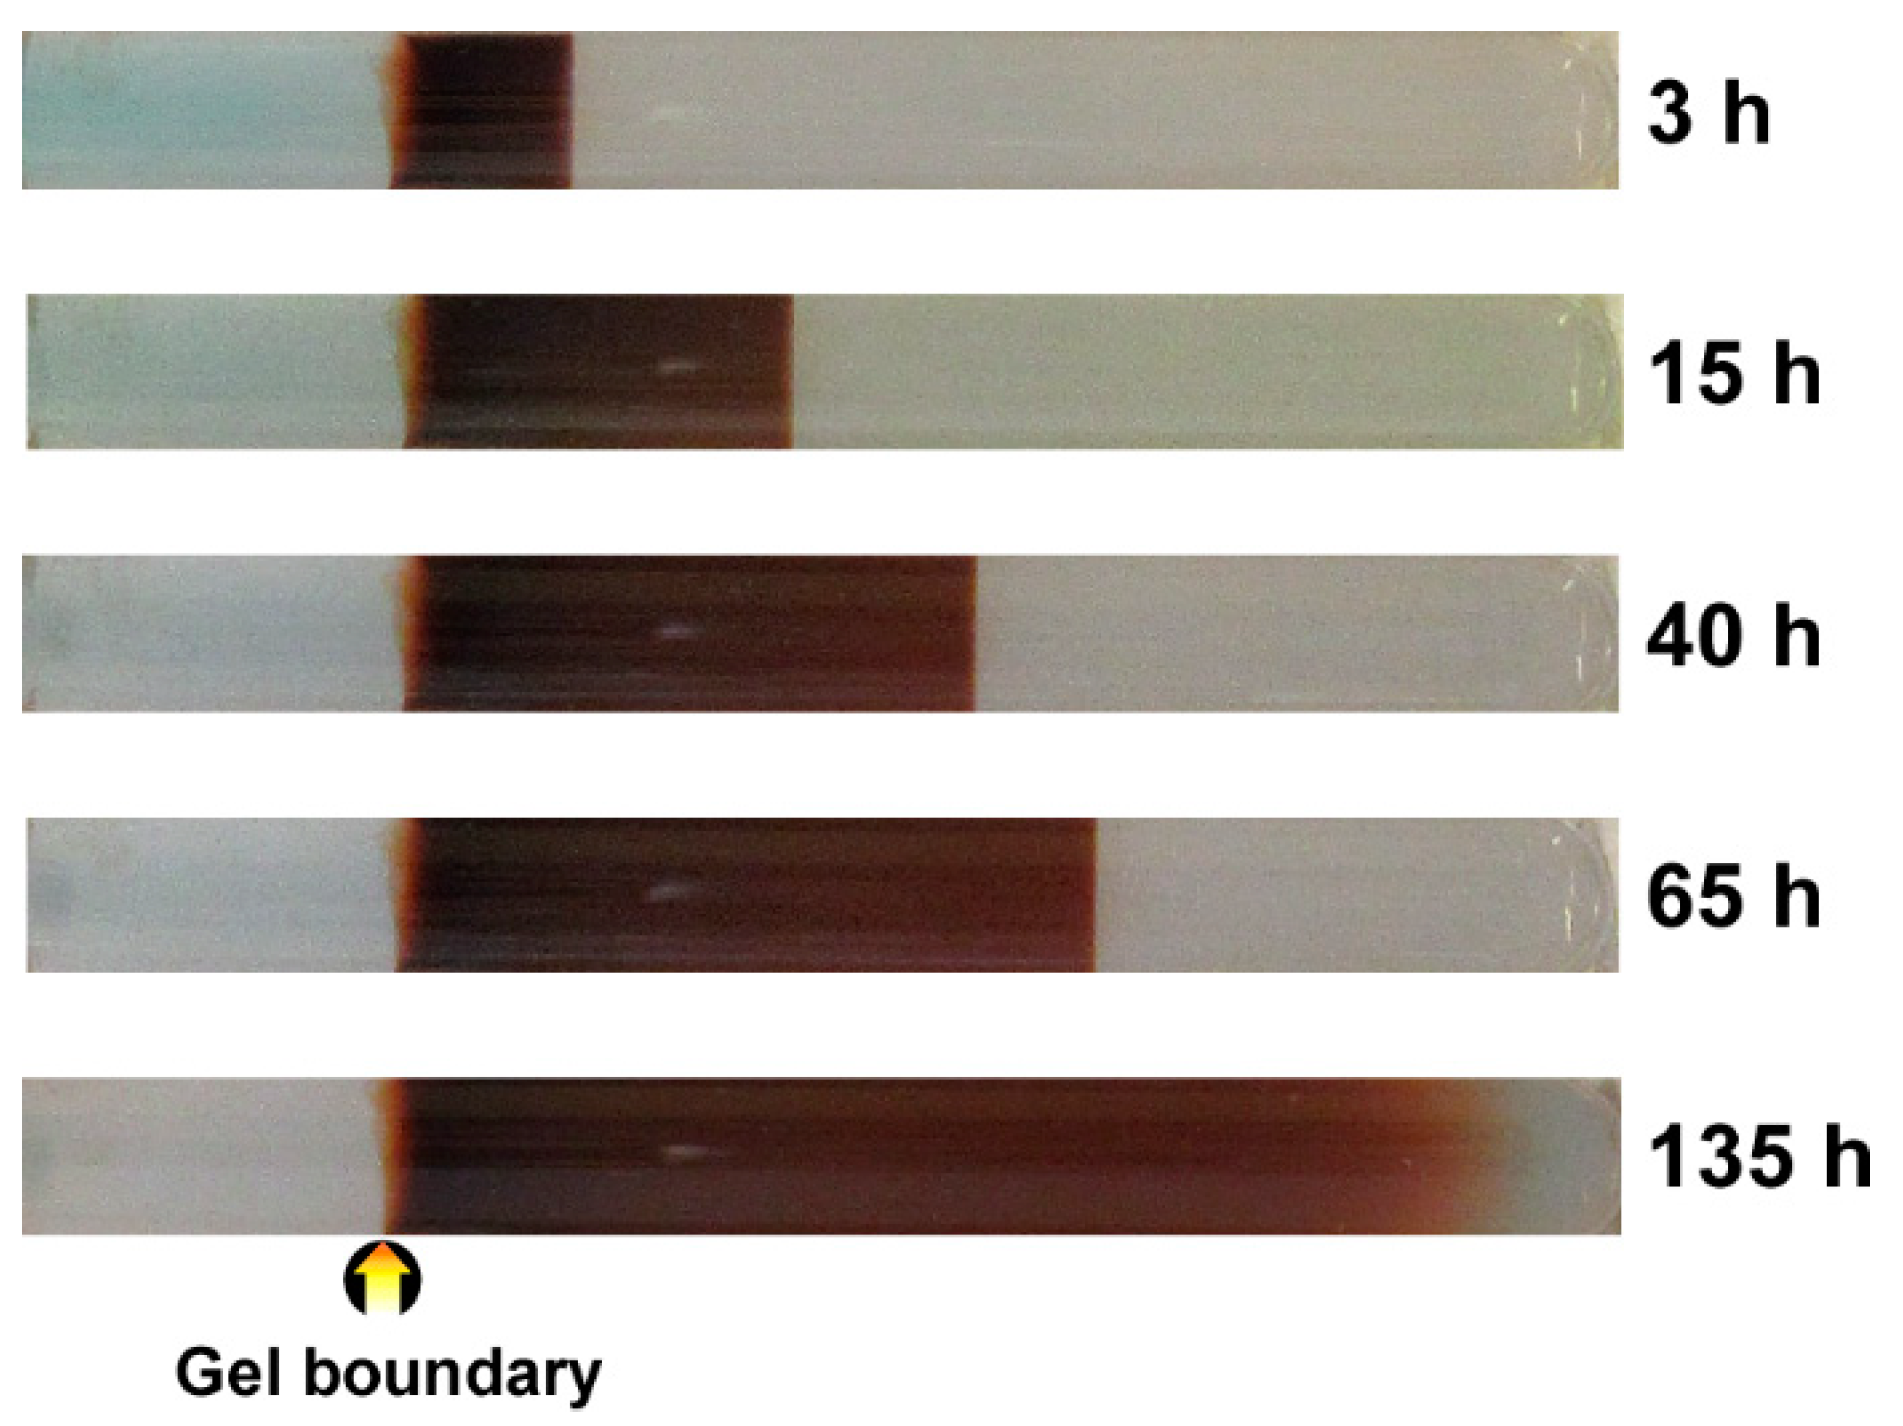
As shown in Figure 3, a continuous band formed near the gel boundary immediately after adding the outer electrolyte (Cu2+) sol. This band expanded monotonously with time in the inner electrolyte gel (according to the elapsed time indicated at the right of each image) without generating Liesegang bands. Such monotonous development of the precipitation band is, again, similar to that observed in Co-Fe PBA systems [26].

3.2. Formation of Multicolored Patterns at Constant Voltage in the RDR Setup

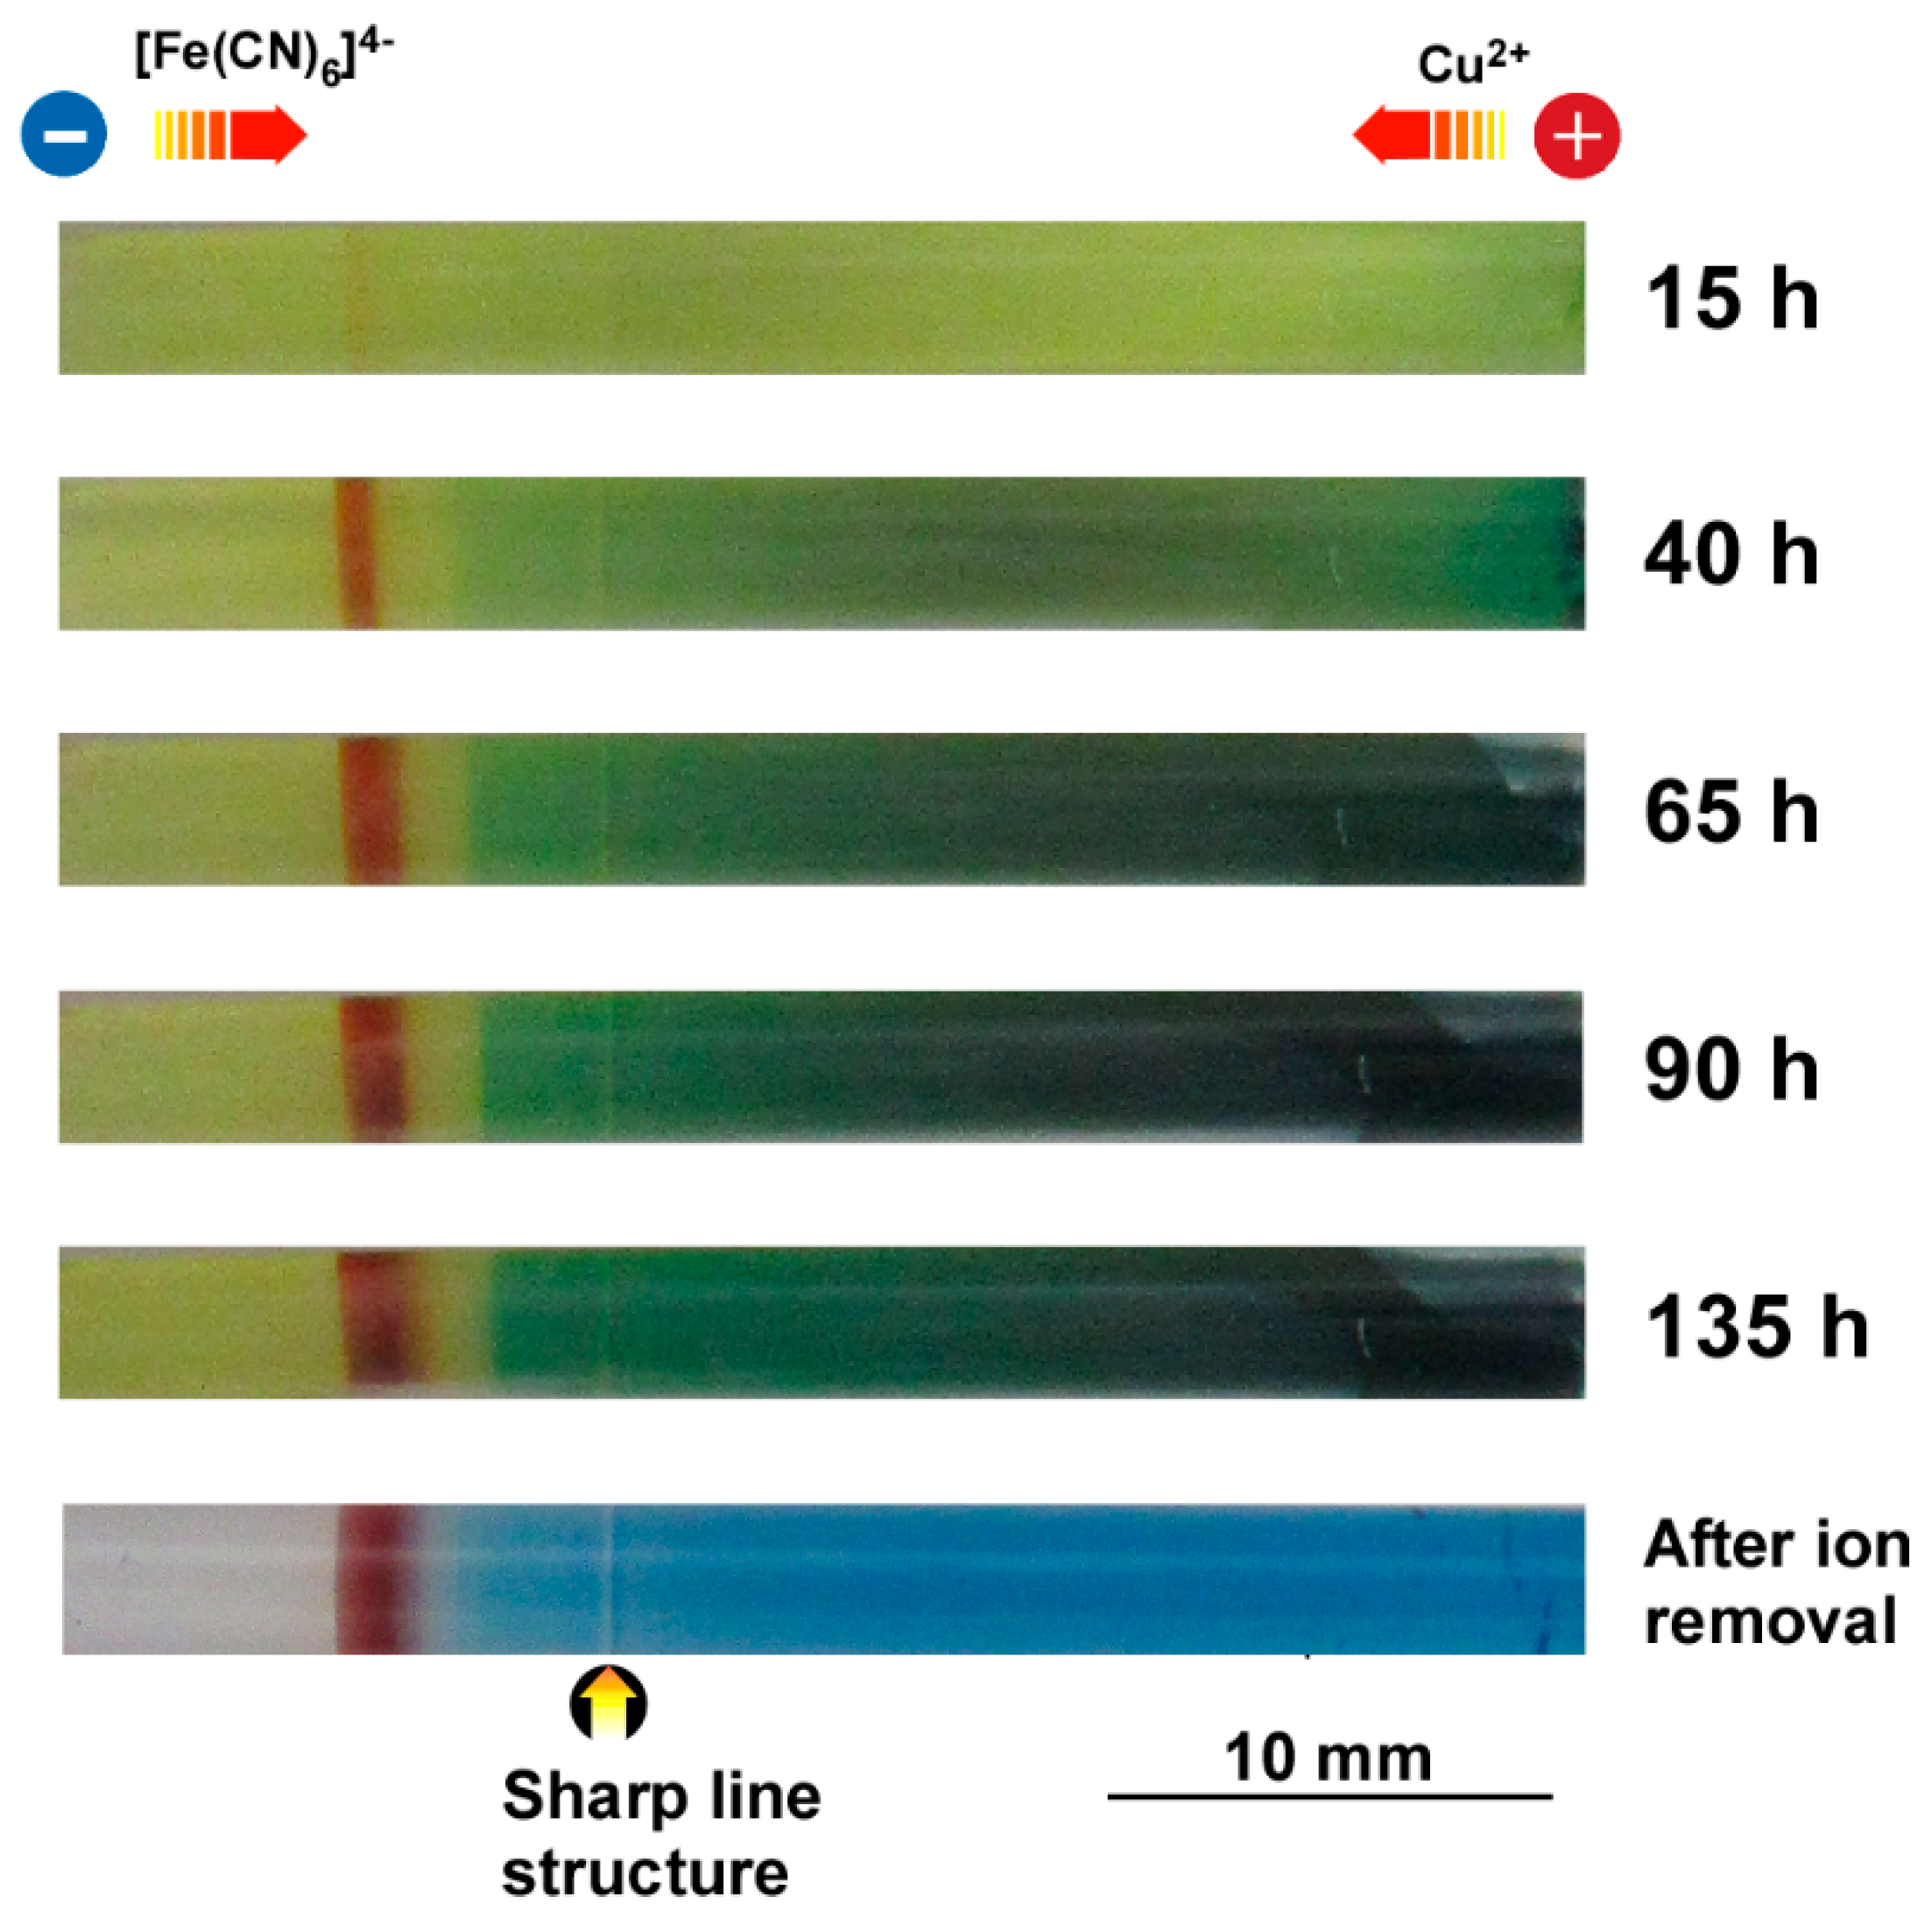
Figure 4 shows the spatiotemporal evolution of a multicolored pattern formed in the sample tube using the proposed RDR setup at an applied constant voltage of 2 V for 100 h (plus an additional monitoring period of 50 h without voltage application). The top of this figure illustrates the charges of the electrodes and the directions of reactant ion movement induced by the electric field.
After 15 h of voltage application, a faint, short reddish–brown band formed at ~8 mm from the cathode surface. After 40 h, the color of this band became deeper, suggesting the accumulation of Cu-FeII PBA (see Figure 2). The boundary of the band became clear on the cathode side, and its position did not change over the observation time (100 + 50 = 150 h).
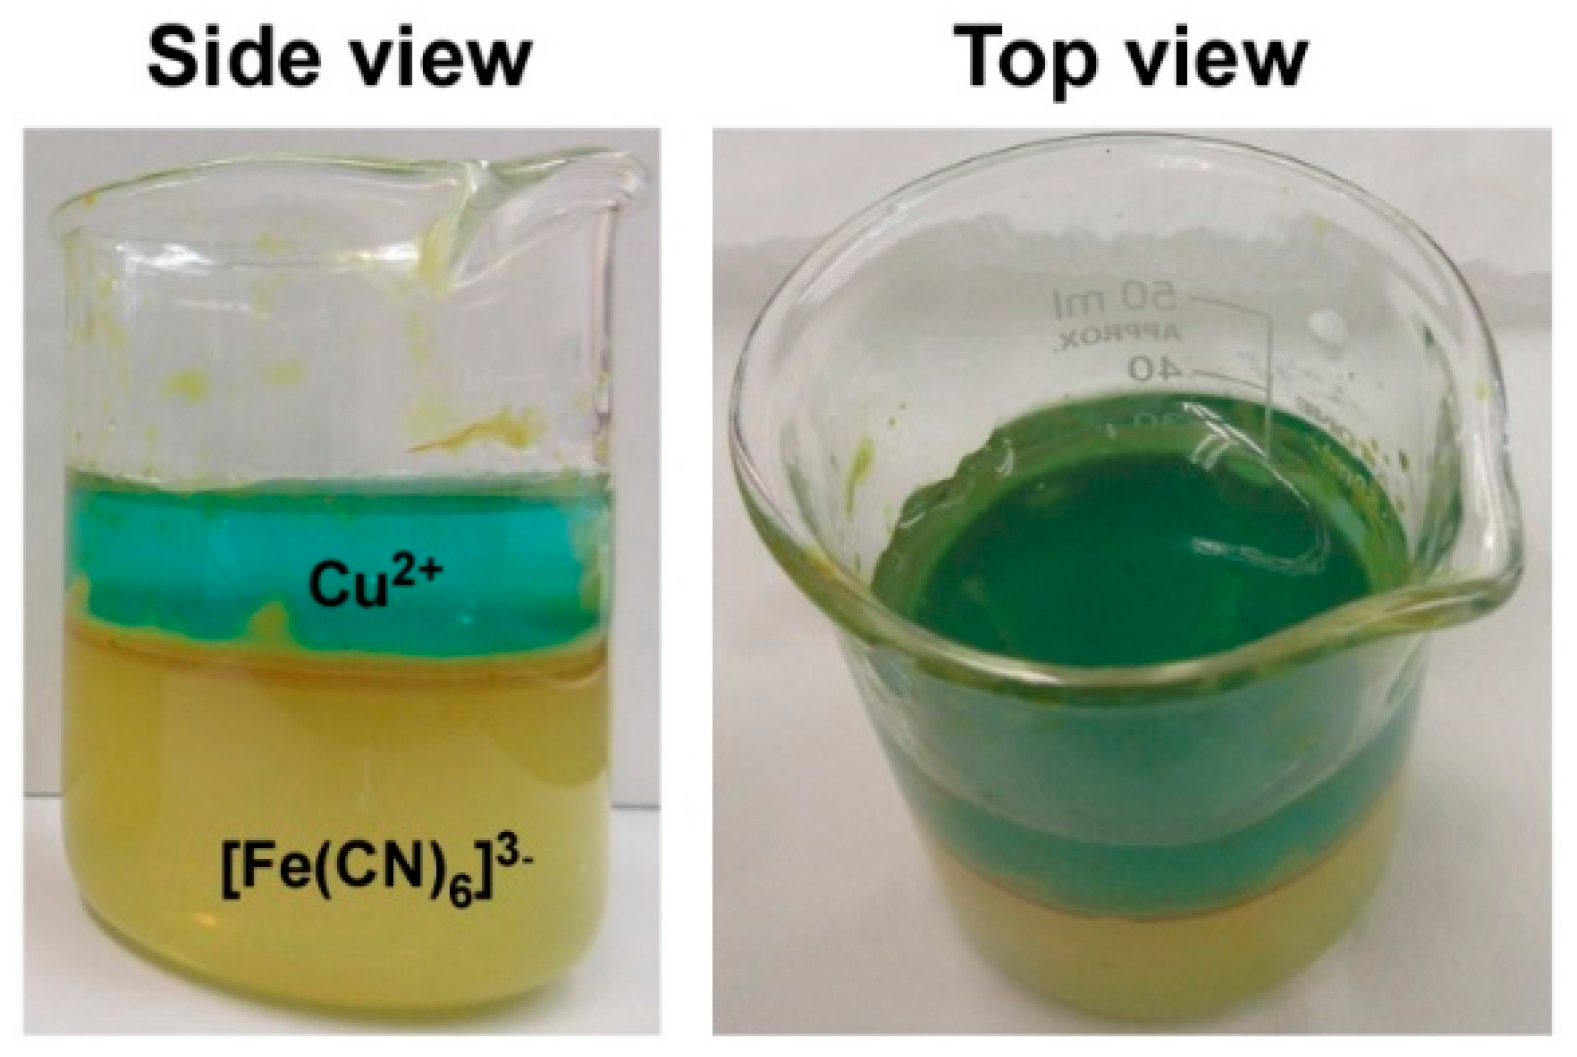
After 40 h, a wide region on the anode side became green. Typically, aqueous Cu2+ ions give a blue color in gel/solution, but they could appear green when mixed with [Fe(CN)6]3− ions, which give a yellow color (Figure 5). Thus, the green color in the sample tube suggests the accumulation of aqueous Cu2+ ions without generating Cu-FeIII PBA, which are typically ocher (Figure 2b).
After 65 h, the reddish–brown band, which was not periodic but continuous, propagated toward the anode by ~3.5 mm in the movement direction of the [Fe(CN)6]4− ions, and the green color at the anode side deepened. The reason why the precipitate front propagated only toward the anode side is not clear currently. However, one possible cause is that, on voltage application, [Fe(CN)6]3− ions (as well as [Fe(CN)6]4− ions generated from the cathode) become depleted near the cathode over time as a result of their transport to the anode side, thus preventing the precipitation of Cu-Fe PBA near the cathode. Meanwhile, such depletion is less likely at the anode side.
After 90 h, the pattern was well-developed and showed almost no further changes, even after stopping the voltage application at 100 h (compare the images taken at 90 and 135 h). Interestingly, the characteristic yellow color of [Fe(CN)6]3− ions still remained near the cathode after 90 h, suggesting that (1) the applied constant voltage of 2 V only moved [Fe(CN)6]3− ions slowly, and hence (2) diffusion contributed significantly to ion transport, nucleation, and crystallization in the sample tube.
The last image in Figure 4 was obtained after removing the unreacted ions. The yellow color disappeared, but the reddish–brown band persisted. Interestingly, the characteristic blue color of aqueous Cu2+ ions also remained over a wide area at the anode side (right side), suggesting that the Cu2+ ions formed sparingly soluble Cu(OH)2 precipitates. The formation of Cu(OH)2 precipitates in the sample tube is possible because OH ions could be generated by a side reaction at the cathode ( 2 H 2 O + 2 e H 2 + 2 OH ) and then migrate to the anode side under the influence of the static electric field to react with Cu2+ ions. Note also that the ocher color characteristic of Cu-FeIII PBA was not observed, suggesting that [Fe(CN)6]3− ions are less reactive with aqueous Cu2+ ions than [Fe(CN)6]4− and OH ions in the proposed RDR setup.
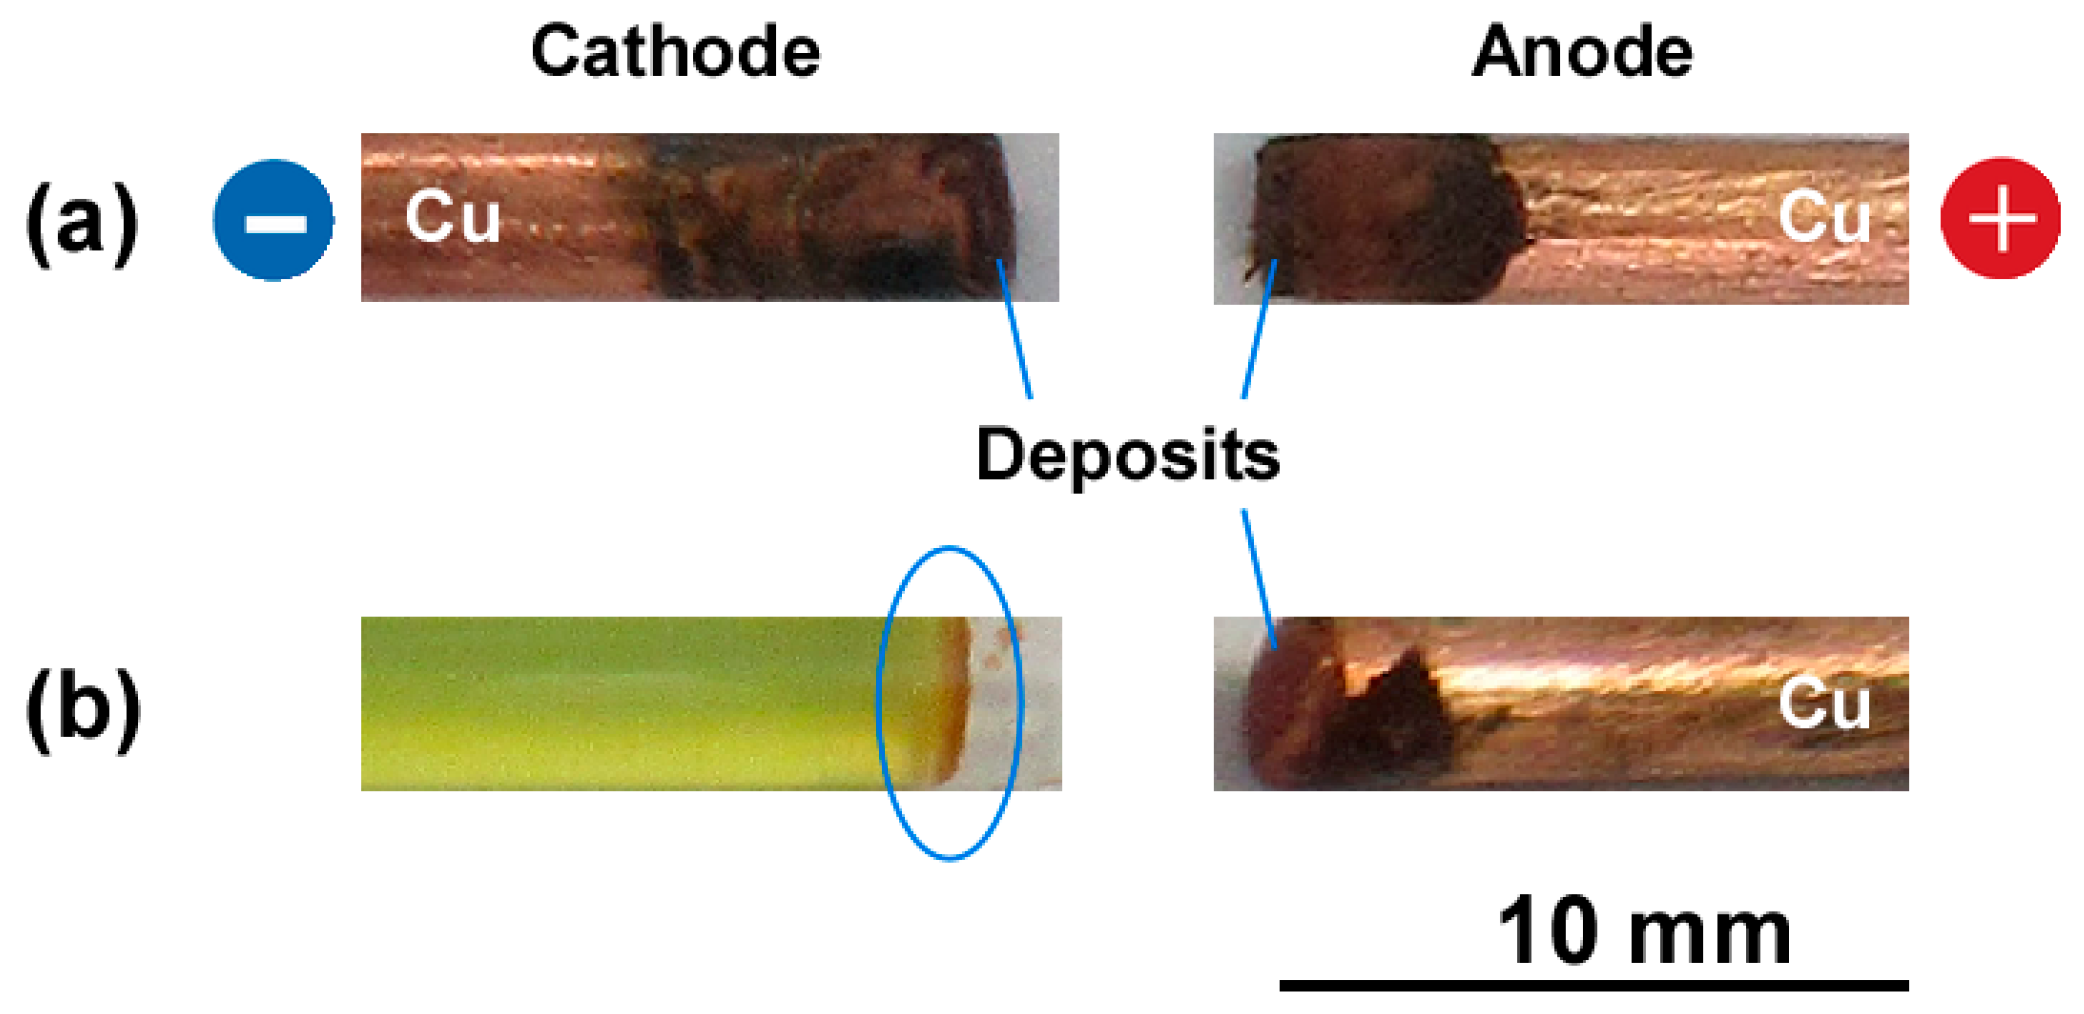
It should be noted that Cu-Fe PBA can also be formed on the Cu electrodes. Figure 6a shows significant amounts of deposits at the cathode and anode after 100 h at 2 V. These deposits were firmly bonded to the electrodes, and hence the electrodes required polishing with sandpaper of different grades (#120, #240, and #400) after the experiments. Moreover, Figure 6b shows that the boundary between the [Fe(CN)6]3− gel and Cu rod is sufficiently reactive to form a small amount of reddish–brown compounds (probably Cu-FeII PBA) without voltage application. This reactivity can be explained as follows. At the boundary without an applied voltage, reactant ions of Cu-FeII PBA (Cu2+ and [Fe(CN)6]4−) can be generated through the following reactions: Cu → Cu2+ + 2e (at the Cu metal surface) and 2[Fe(CN)6]3− + 2e →2[Fe(CN)6]4− (at the gel surface in contact with Cu). At the Cu cathode/anode, the Cu2+/[Fe(CN)6]4− ions can react with electrochemically generated [Fe(CN)6]4−/Cu2+ ions to produce Cu-FeII PBA precipitates. At the anode, direct electrochemical production of Fe-CuII PBA is also possible through the following reaction (for simplicity, the Fe(CN)6 vacancies and the additional H2O are ignored): Cu + 2K+ + [FeIII(CN)6]3− → K2Cu [FeII(CN)6] (Cu-FeII PBA) + e. Additional discussion concerning the formation of Cu-Fe PBA precipitates near/on the electrodes will be provided later.
Figure 7 shows the results obtained when changing the applied voltage from 2 to 4 V. The observations are similar to those obtained at 2 V in the following aspects. (1) A single (i.e., non-periodic) reddish–brown band was formed on the cathode side. (2) A wide region on the anode side turned green. (3) The generated pattern showed almost no change after 90 h, and the gel near the cathode remained yellow.
On the other hand, the reddish–brown and green colors generated at 4 V were deeper than those generated at 2 V, suggesting greater amounts of Cu-FeII PBA precipitates and aqueous Cu2+-related compounds, respectively. Moreover, compared to the behavior observed at 2 V, band propagation to the anode side was considerably suppressed at 4 V, and the resultant band was narrower (approximately 2 mm vs. 3.5 mm). This finding suggests that increasing the applied voltage from 2 to 4 V is effective in restricting the broadening of the Cu-FeII PBA precipitation band.
Interestingly, a sharp line structure appeared in the green region after 40 h at 4 V (Figure 7). This structure remained at the same location and was distinguishable after removing the unreacted ions. As discussed in a previous study concerning Mn-Fe PBA precipitates in water-glass gels [29], these light-colored band-in-band structures can form in slightly soluble precipitates when there is a local shortage of the constituent compounds. Thus, the line structure in Figure 7 suggests again the coexistence of slightly soluble precipitates, such as Cu(OH)2, in the blue region of the gel sample after removing unreacted ions.
In addition, the gel sample occasionally shrunk during the application of 4 V constant voltage, mainly at the cathode side. At higher voltages, such shrinkage occurred more frequently and prevented detailed observations. Additionally, at higher voltages, (1) the yellow color near the cathode rapidly disappeared without forming the reddish–brown band (e.g., within 40 h at 8 V), and (2) the contact between the cathode and gel was frequently lost because of the formation of bubbles (possibly H2) on the cathode. Meanwhile, at applied voltages below 2 V, the reddish–brown color of the band formed in the sample tube was very light, even after 100 h, suggesting that the concentration of generated Cu-FeII PBA was very low. Thus, in the current setup, the applied constant voltages for examining the precipitation patterns in detail were limited to 2 to 4 V.

3.3. Formation of Multicolored Periodic Bands under Cyclic Alternating Voltage in the RDR Setup

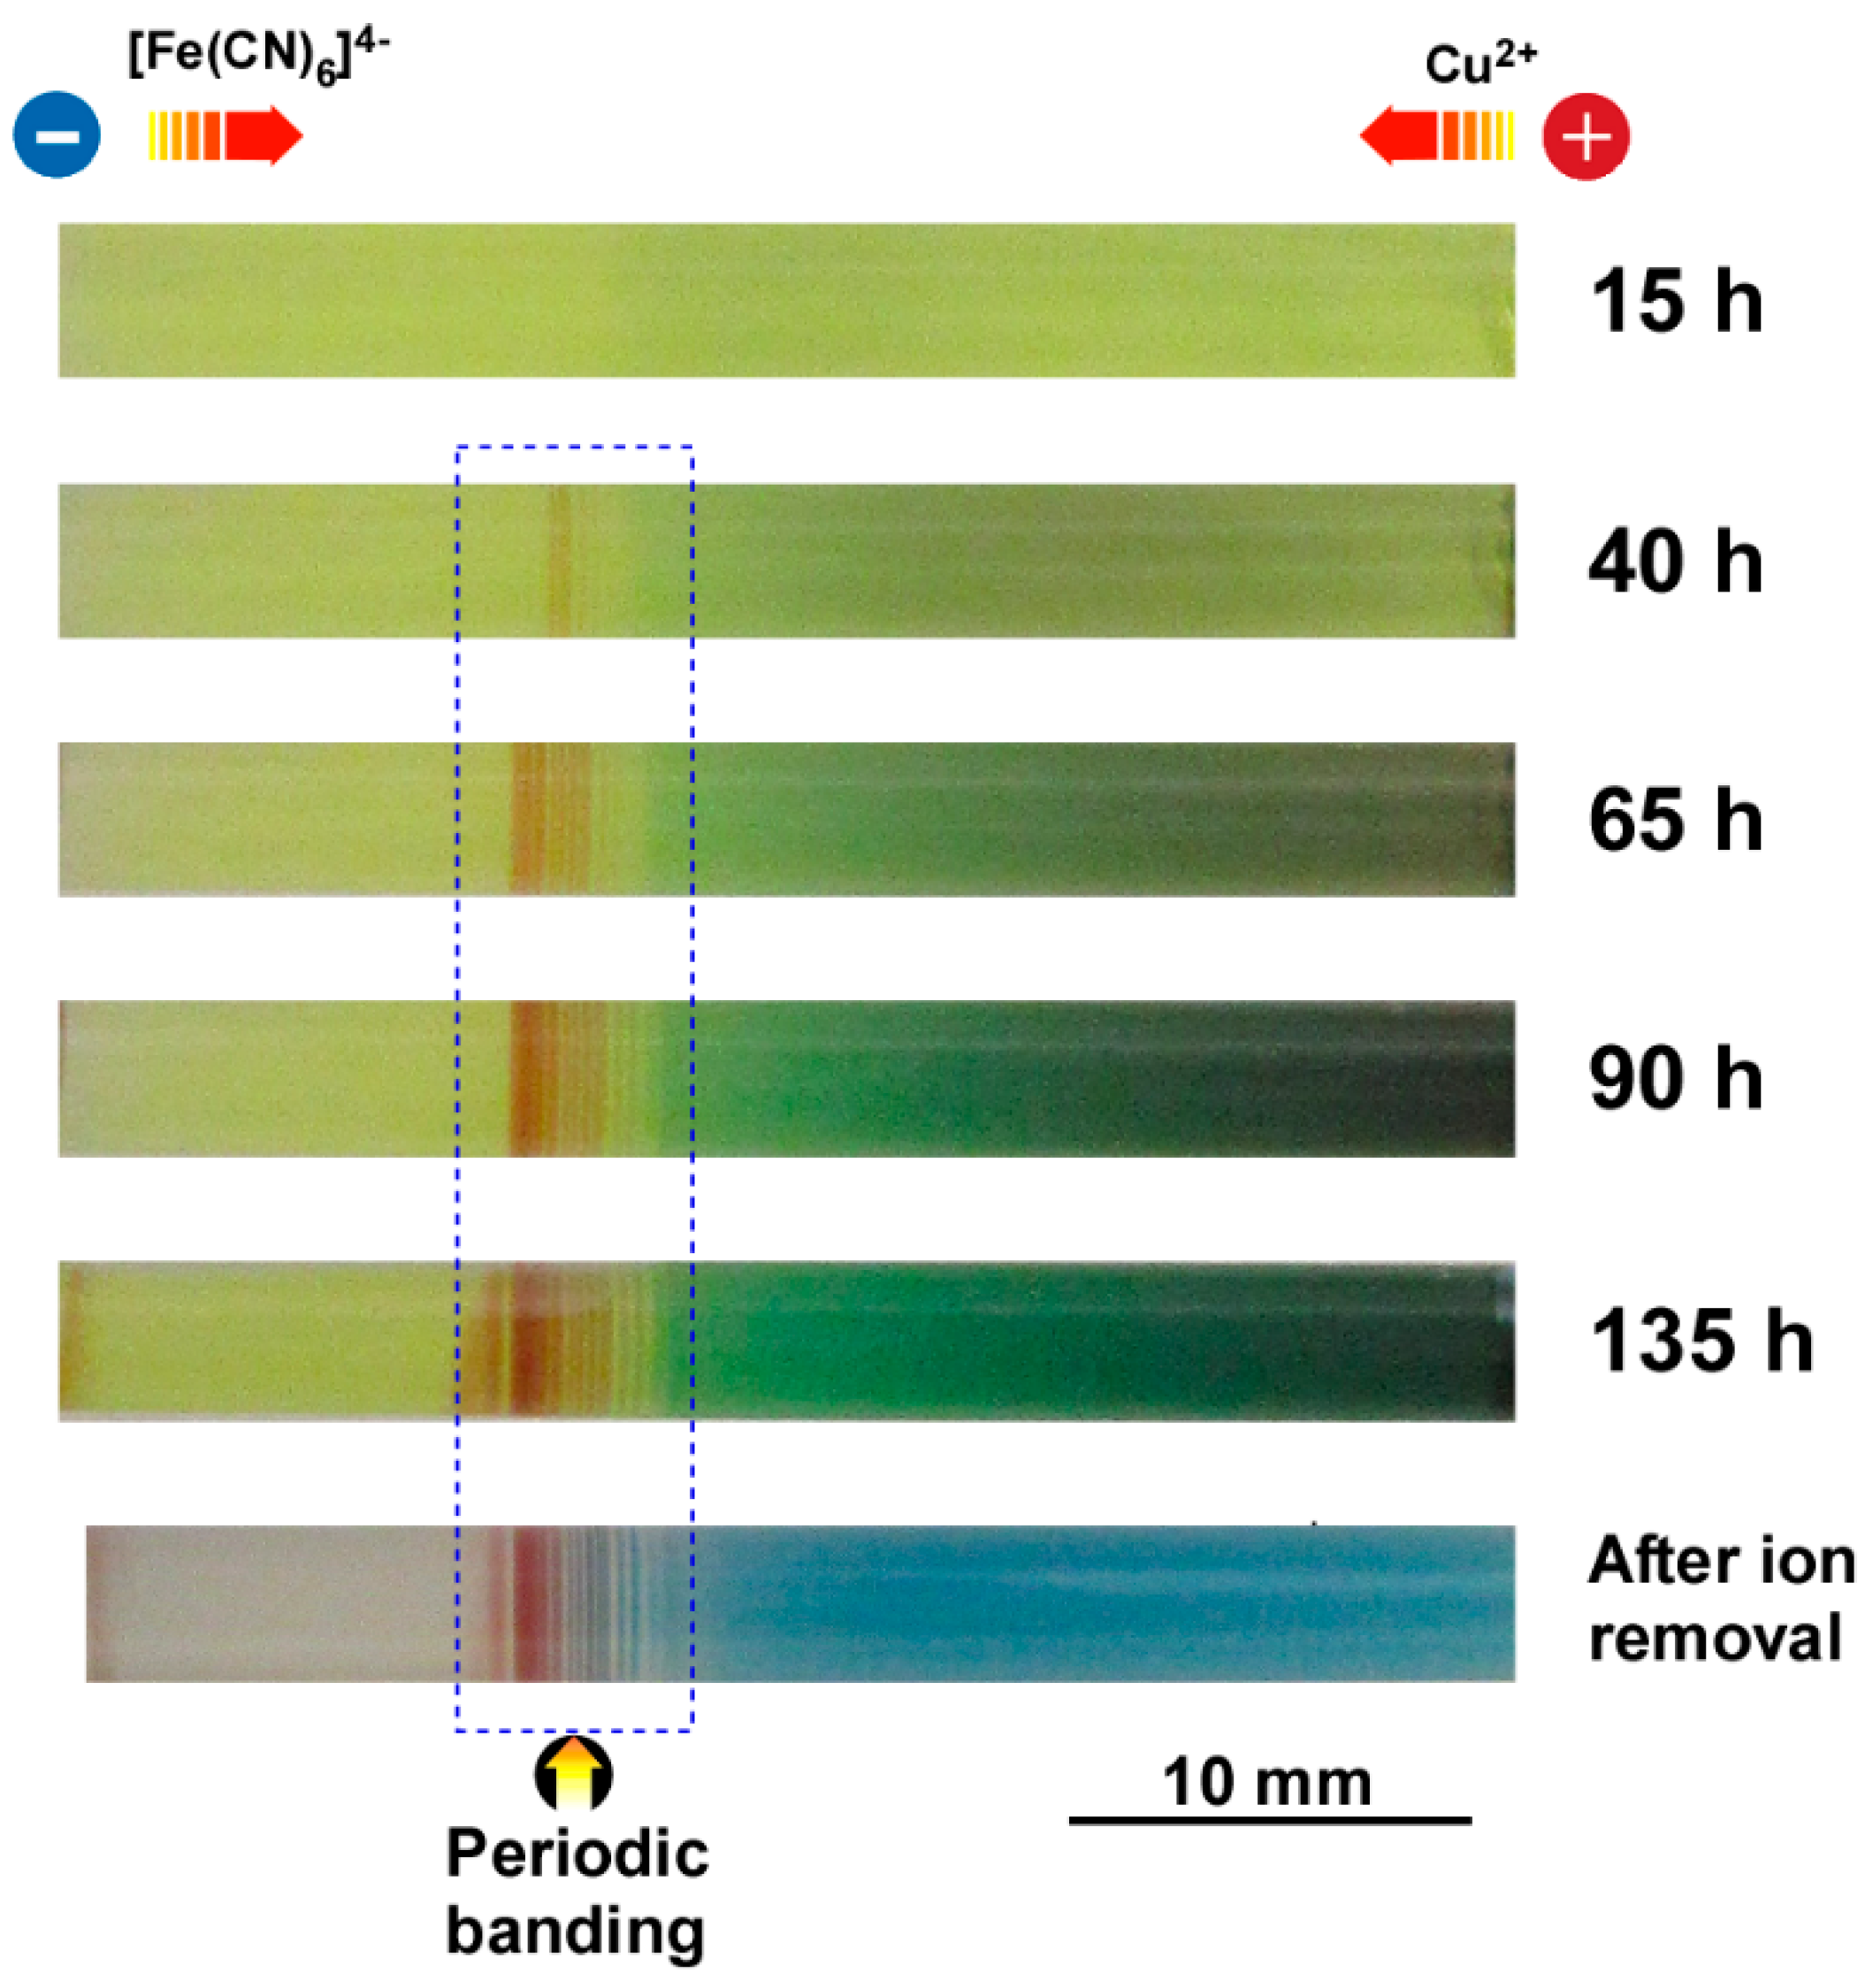
Figure 8 shows the spatiotemporal evolution of a typical multicolored pattern formed in the sample tube under an applied cyclic alternating voltage: i.e., 4 V for 1 h and then 1 V for 4 h per cycle for a total of 20 cycles. In this cyclic voltage sequence, fewer reactant ions will be produced at 1 V and diffusion should exert a stronger effect on the residual ions to induce the formation of wide, diffuse precipitation patterns. In contrast, more reactant ions will be produced at 4 V and the stronger electric field should have a greater influence on the ions, thus producing narrow, thick precipitation bands, as suggested by the constant voltage experiments.
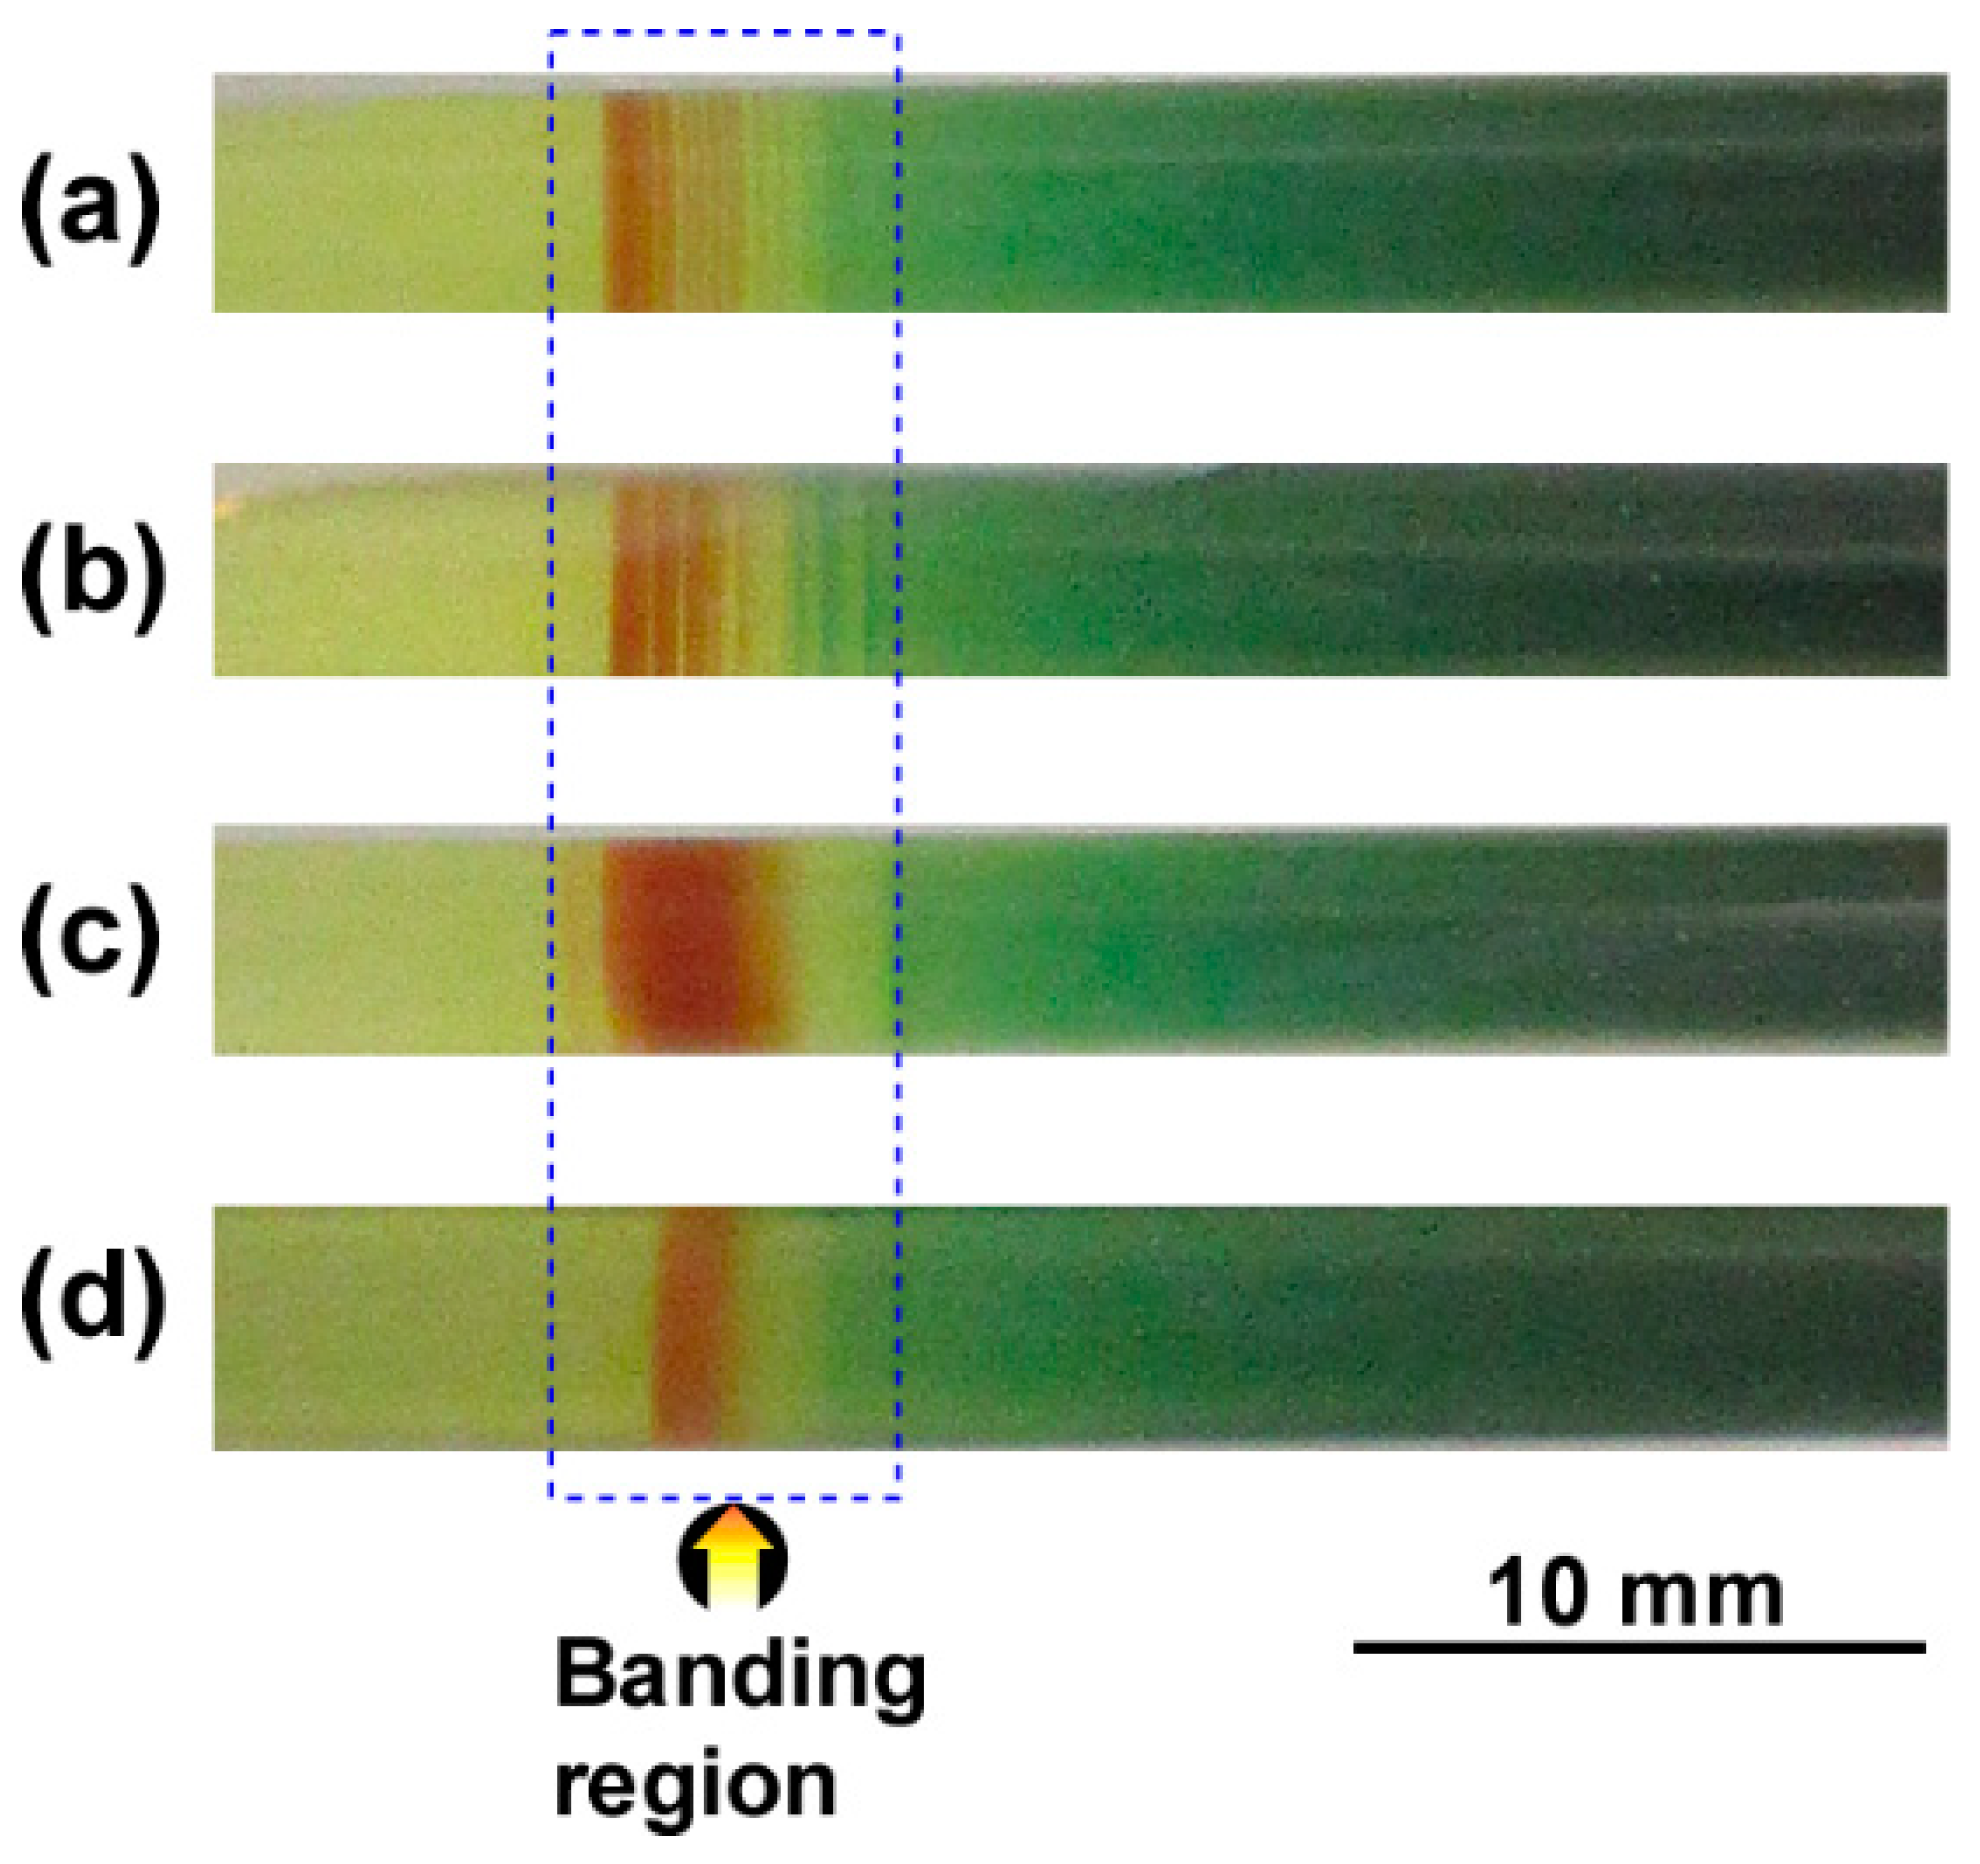
After 15 h of cyclic voltage application (3 cycles), the wide region at the anode side became slightly green. However, no marked reddish–brown band was observed, which is unlike the observations at constant voltages of 2 and 4 V (see Figure 4 and Figure 7). After 40 h (8 cycles), several short, faint, and reddish–brown bands were formed near the cathode (~10 mm from its surface). After 65 h (13 cycles), the number of thin reddish–brown bands increased. It should be noted that the formation of these periodic bands was stochastic with a probability of ~50% (e.g., Figure 9a,b); in the other ~50% of cases, an almost continuous band was formed (e.g., Figure 9c,d). Either way, during the formation of the reddish–brown band(s), the green region became gradually deeper in color. Interestingly, even after stopping the voltage application, occasionally the formation of periodic bands continued (compare the patterns obtained after 90 (18 cycles) and 135 h (35 h after 20 cycles) in Figure 8).
These stochastically formed periodic bands showed the following common features. (1) The periodic bands were formed within a relatively narrow region (<5 mm). (2) The number of residual bands after removing unreacted ions was within 12 ± 5. (3) The spaces between the adjacent bands were within 0.30 ± 0.25 mm after removing unreacted ions (details will be discussed later). (4) The periodic bands maintained their positions during the observation time, similar to the unusual Liesegang bands previously found in a Co-Fe PBA system [30]. (5) After removing unreacted ions, several periodic bands became blue instead of reddish–brown, strongly suggesting the presence of Cu(OH)2 precipitates (as already suggested by Figure 4 and Figure 7).
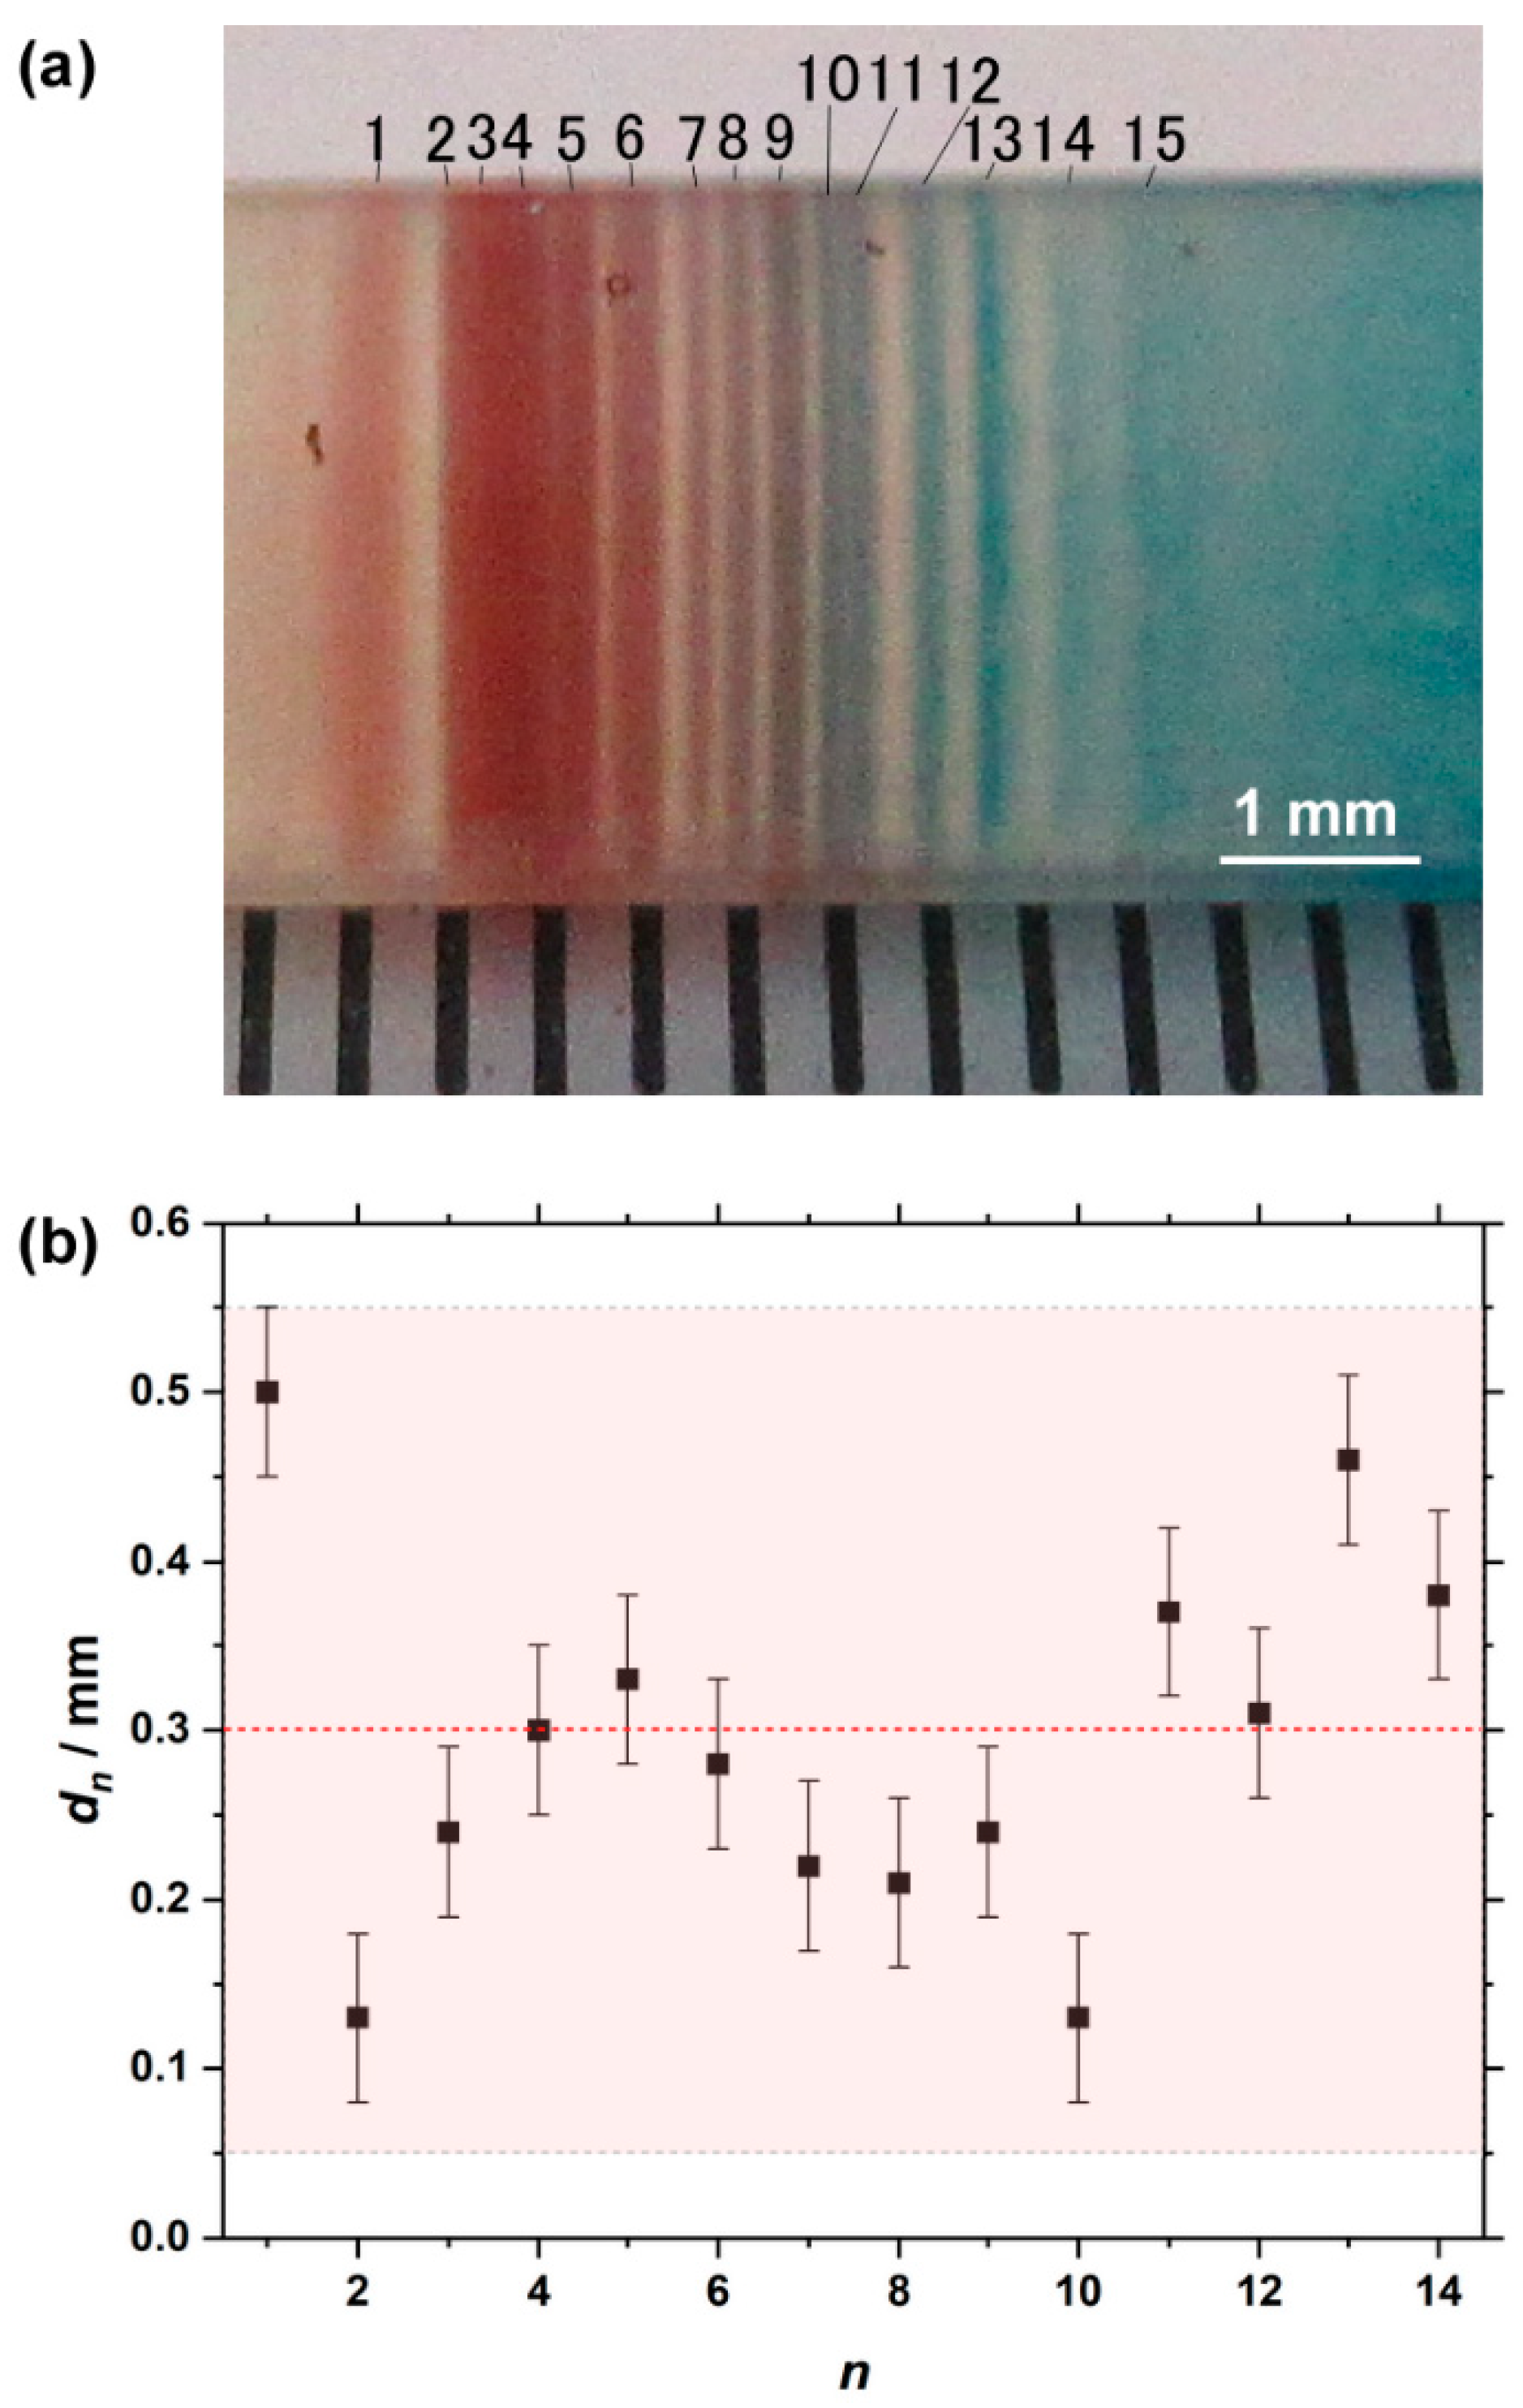
Figure 10a is an enlarged image of the multicolored periodic bands after removing unreacted ions (bottom image in Figure 8) together with 0.5 mm graduations for ease of comparison. These periodic bands are numbered from n = 1 (the cathode side) to 15 (the anode side). Their positions (Xn) were measured using the graduations with an accuracy of ±0.05 mm to determine the band spacing dn = Xn+1Xn, which is plotted in Figure 10b.
It is well known that Liesegang bands tend to follow an empirical scaling law, the so-called spacing law, irrespective of the electrolyte pair and the geometry of the system: Xn+1/Xn = 1 + p, where p > 0 for most systems [1,2,3,4,5]. This law can also be described as d n = X n + 1 X n = p X n = p X 1 ( 1 + p ) n 1 = ( 1 + p ) d n 1 because d n 1 = p X 1 ( 1 + p ) n 2 , indicating that the dn value increases monotonically with n (for p > 0).
Figure 10b indicates that the obtained dn values did not increase monotonically, thus failing to obey the spacing law. Rather, they were randomly distributed around an average value (0.30 mm) with a broad dispersion (±0.25 mm), as mentioned before. It is not surprising that the dn values disobey the spacing law, because the mechanism to form periodic bands in the current RDR setup (Figure 1c) is fundamentally different from that in the conventional RD setup used to examine Liesegang banding (Figure 1a). Note that the average dn value (0.30 mm) is comparable to its dispersion (±0.25 mm). This means that the periodic bands can easily overlap to form almost continuous bands (as found in Figure 9c,d), particularly when relatively broad bands (such as the bands of n = 1–4 in Figure 10a) form stochastically. Thus, Figure 10 implies that expanding the band spacing may improve the probability of periodic band formation. The related experimental issues will be discussed later.

3.4. Fe Kα Intensity Distribution of the Pattern Formed under Cyclic Alternating Voltage

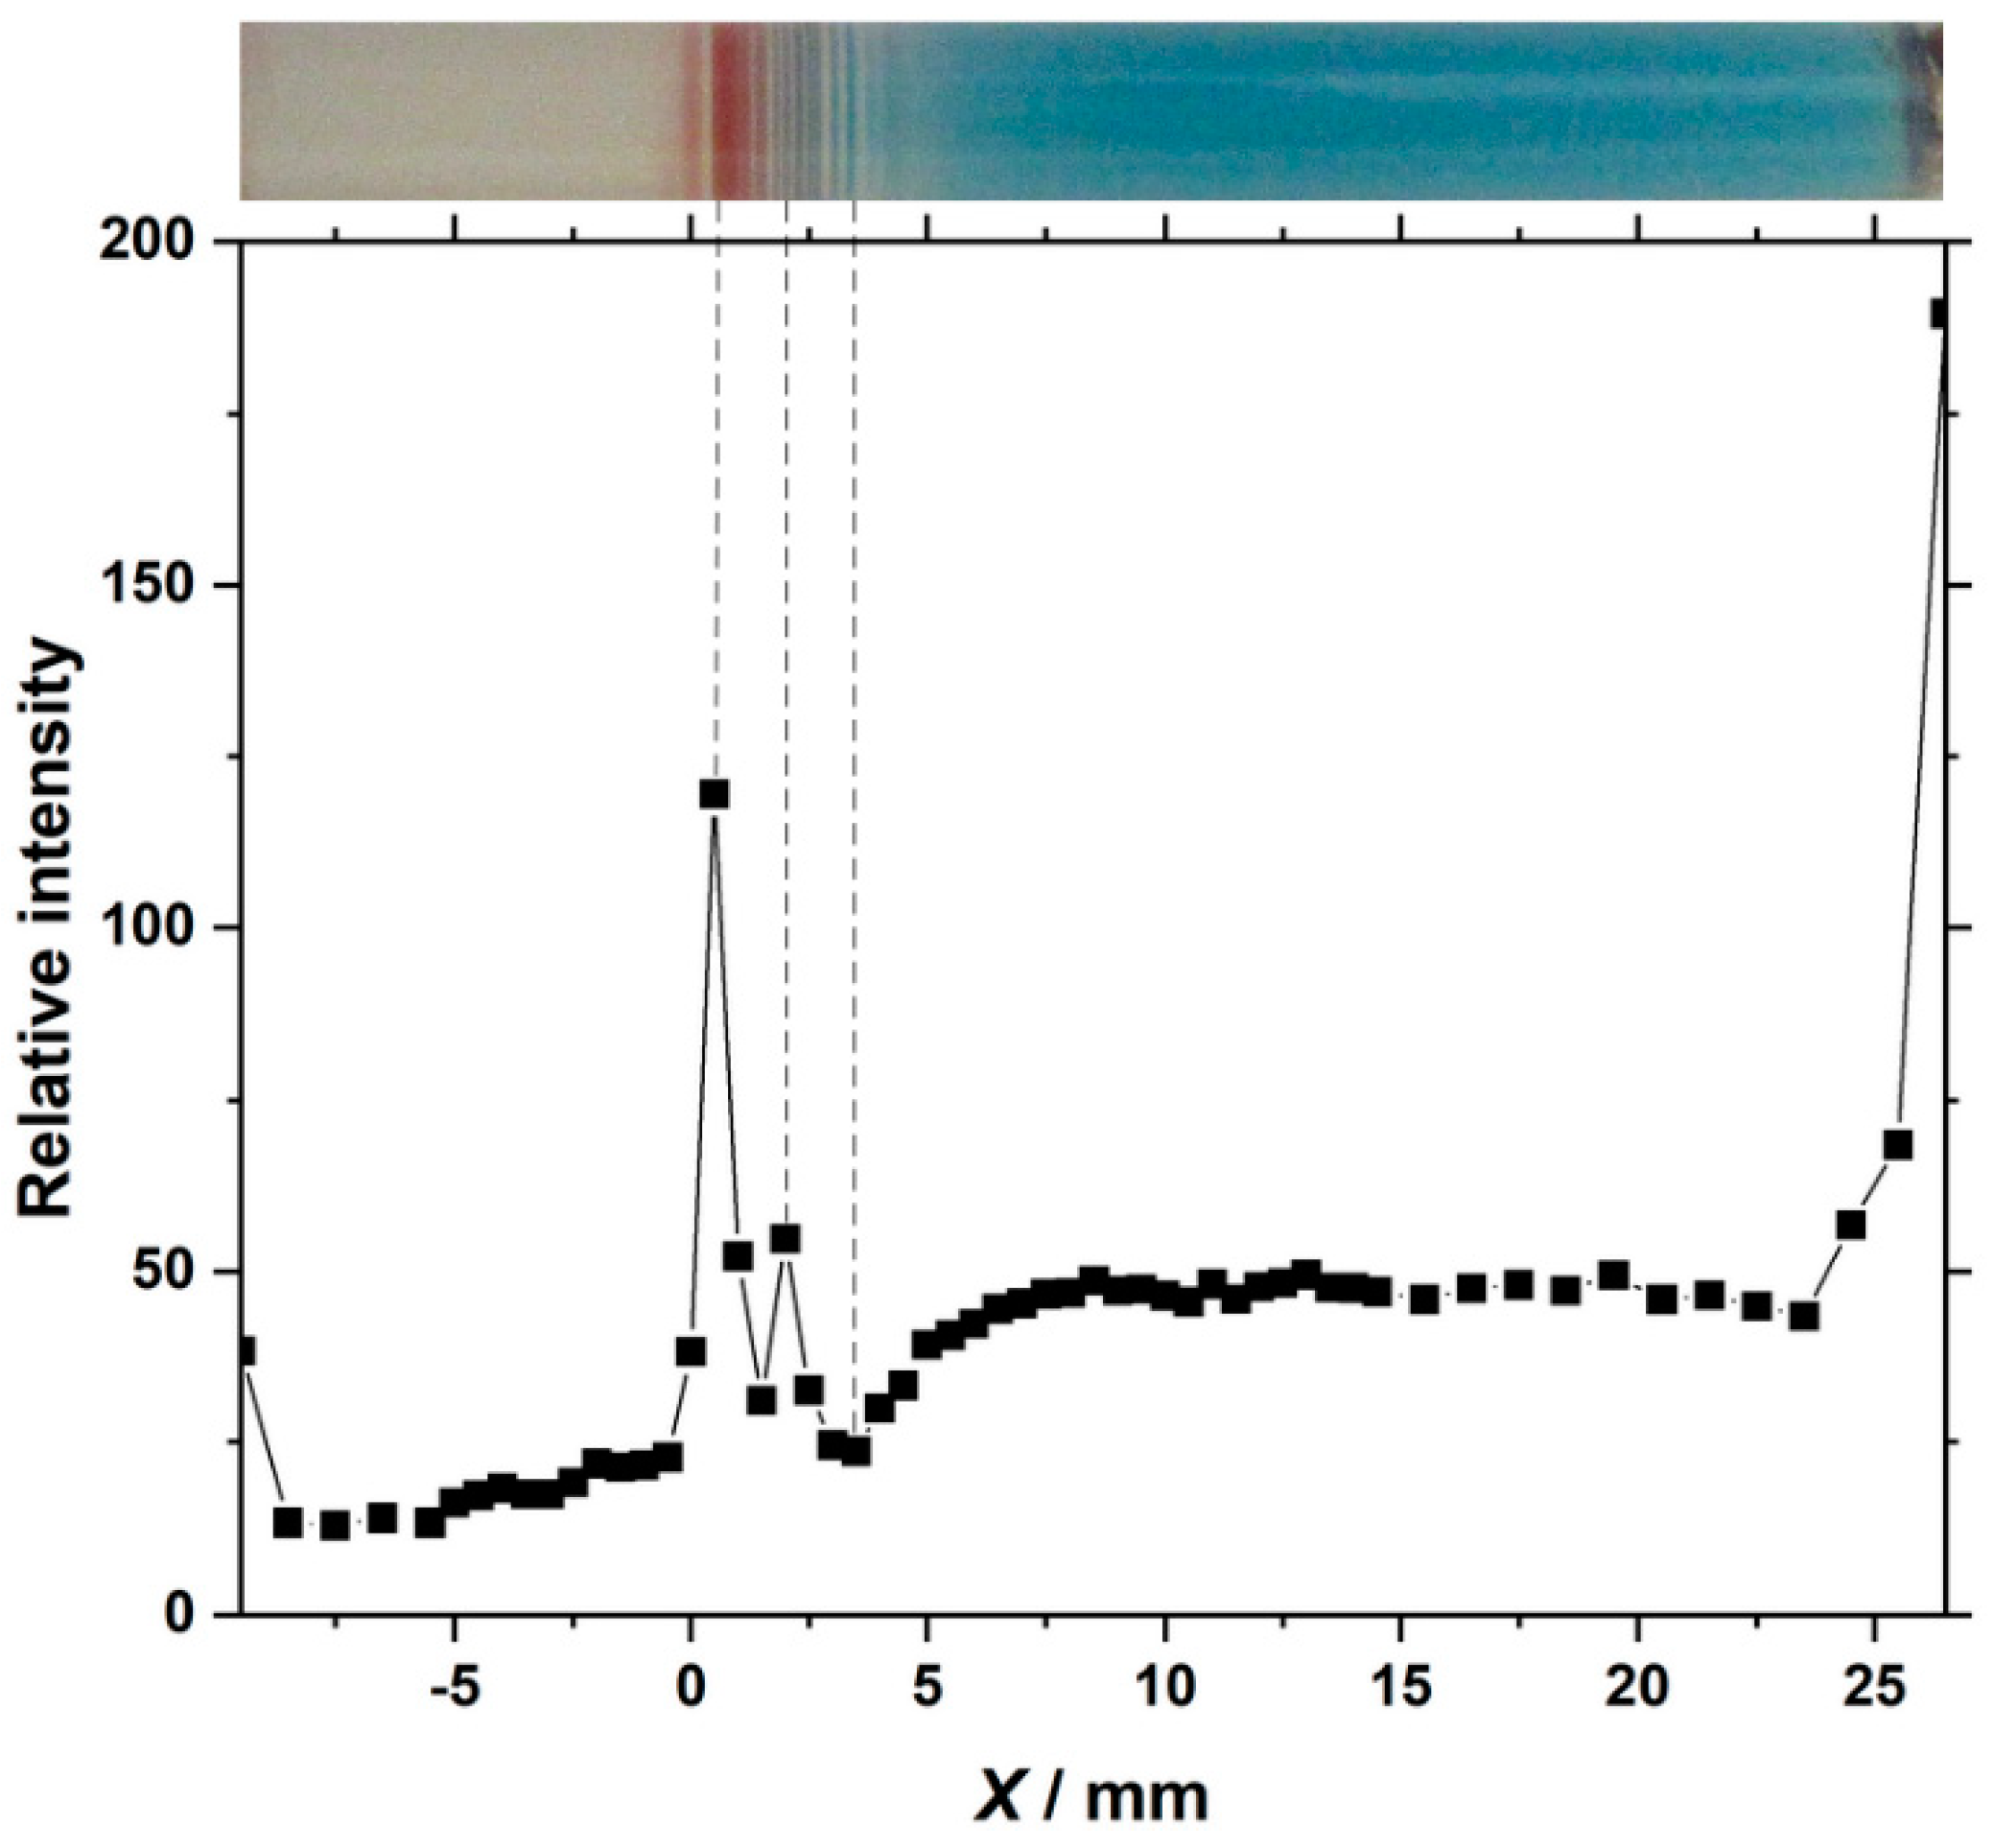
Figure 11 shows the Fe Kα intensity distribution of the gel sample having multicolored periodic bands (shown in Figure 8 and Figure 10) formed under the cyclic alternating voltage. The horizontal axis indicates the distance from the periodic band of n = 1 (X), where X > 0 is on the anode side. The vertical axis is the relative Fe Kα intensity. As already shown in previous studies [27,28], the Fe Kα distributions of gel samples with formed PBA precipitates provide a good estimate of the Fe elemental distributions. Because the current XRF experiments were conducted after removing the unreacted [Fe(CN)6]3− ions, the measured Fe Kα distribution should approximate the distribution of Cu-Fe PBA formed in the gel sample.
The Fe Kα intensity was relatively strong in regions close to the electrodes (X = −9.0 and 26.0 mm). This result is consistent with the fact that considerable amounts of deposits (probably Cu-FeII PBA) were present at the electrodes (Figure 6). Interestingly, a strong Fe Kα intensity (~125 in Figure 11) was also observed in the reddish–brown periodic bands on the cathode side (n = 2–4 in Figure 10a, named “main bands” hereafter) with a sharp peak at X = 0.5 ± 0.25 mm (the uncertainty is due to the focus size of incident X-rays), strongly suggesting that Cu-FeII PBA specifically accumulated in the main bands. Such highly localized precipitation is expected to cause the depletion of reactant ions (and, thus, also Cu-Fe PBA) nearby. Indeed, the Fe Kα intensity around the main bands was low, resulting in a broad valley-like structure around X = 3.0 mm where the blue periodic bands (n ≥ 12) are located. This finding supports the hypothesis that the blue bands mainly consist of Cu(OH)2 instead of Cu-Fe PBA, as indicated by the blue color itself. Except for the main bands, other reddish–brown periodic bands (denoted “non-main reddish–brown (RB) bands” hereafter) did not have very strong Fe Kα intensities, although there was a weak peak at X = 2.0 mm corresponding to the position of non-main RB bands of n = 7–9. Therefore, it is likely that the non-main RB bands did not contain significant quantities of Cu-FeII PBA.
Note that the Fe Kα intensities of the wide blue region (8.0 < X < 23.0 mm) are comparable to those of the non-main RB bands. Thus, to our surprise, Cu-Fe PBA (reddish–brown or ocher in color) also existed in the blue region. Their amount there is estimated to be ~2/5 of that in the main bands, based on the Fe Kα intensities (approximately 50 vs. 125). Additional explanation of this interesting feature is given in the next section.

3.5. Microscopic Observation of the Pattern Formed under Cyclic Alternating Voltage

Figure 12 shows the optical microscopy images (×1000) of the gel sample having multicolored periodic bands formed under the cyclic alternating voltage (the corresponding Fe Kα distribution is shown in Figure 11). The positions where the images were acquired are indicated in the uppermost panel.
Many reddish–brown crystallites approximately 1–10 μm in size are visible in Figure 12, not only in regions close to the electrodes (Figure 12a,e, where the crystallite sizes were relatively large) and the main bands (Figure 12b) but also in the blue region (Figure 12c,d). This finding strongly suggests that micrometer-sized Cu-FeII PBA crystallites (which are too small to be seen by the naked eye) were generated over a wide region in the gel sample under the applied cyclic alternating voltage. The existence of these crystallites in the blue region can explain the non-negligible Fe Kα intensities observed at 5.0 < X < 23.0 mm in Figure 11. On the other hand, the approximately flat Fe Kα distribution in the blue region suggests an even probability of Cu-FeII PBA crystallite formation there. The mechanism that generated these widely dispersed crystallites remains unclear at present and requires future research.
At position b in Figure 12 (the main band, n = 2), the crystallites are visible against the reddish–brown background, suggesting that finer Cu-FeII PBA crystallites (<1 μm) also contribute to the main bands. The ratio between the quantities of larger crystallites (particles in Figure 12b, 1–10 μm) and smaller crystallites (reddish–brown background in Figure 12b, <1 μm) in the main bands was estimated as follows. A comparison between Figure 12b and 12d shows that the main bands and the blue region have comparable numbers of large crystallites. As mentioned above concerning the Fe Kα distribution, the amount of Cu-FeII PBA in the blue region (where most of the crystallites are larger ones) is ~2/5 of that in the main bands. Thus, approximately 1 − 2/5 = 3/5 of the Cu-FeII PBA are expected to exist as smaller crystallites in the main bands. In other words, the quantities of larger and smaller crystallites have a ratio of ~2/3, suggesting a dominance of smaller crystallites in the main bands.

3.6. SEM Observation of the Pattern Formed under Cyclic Alternating Voltage

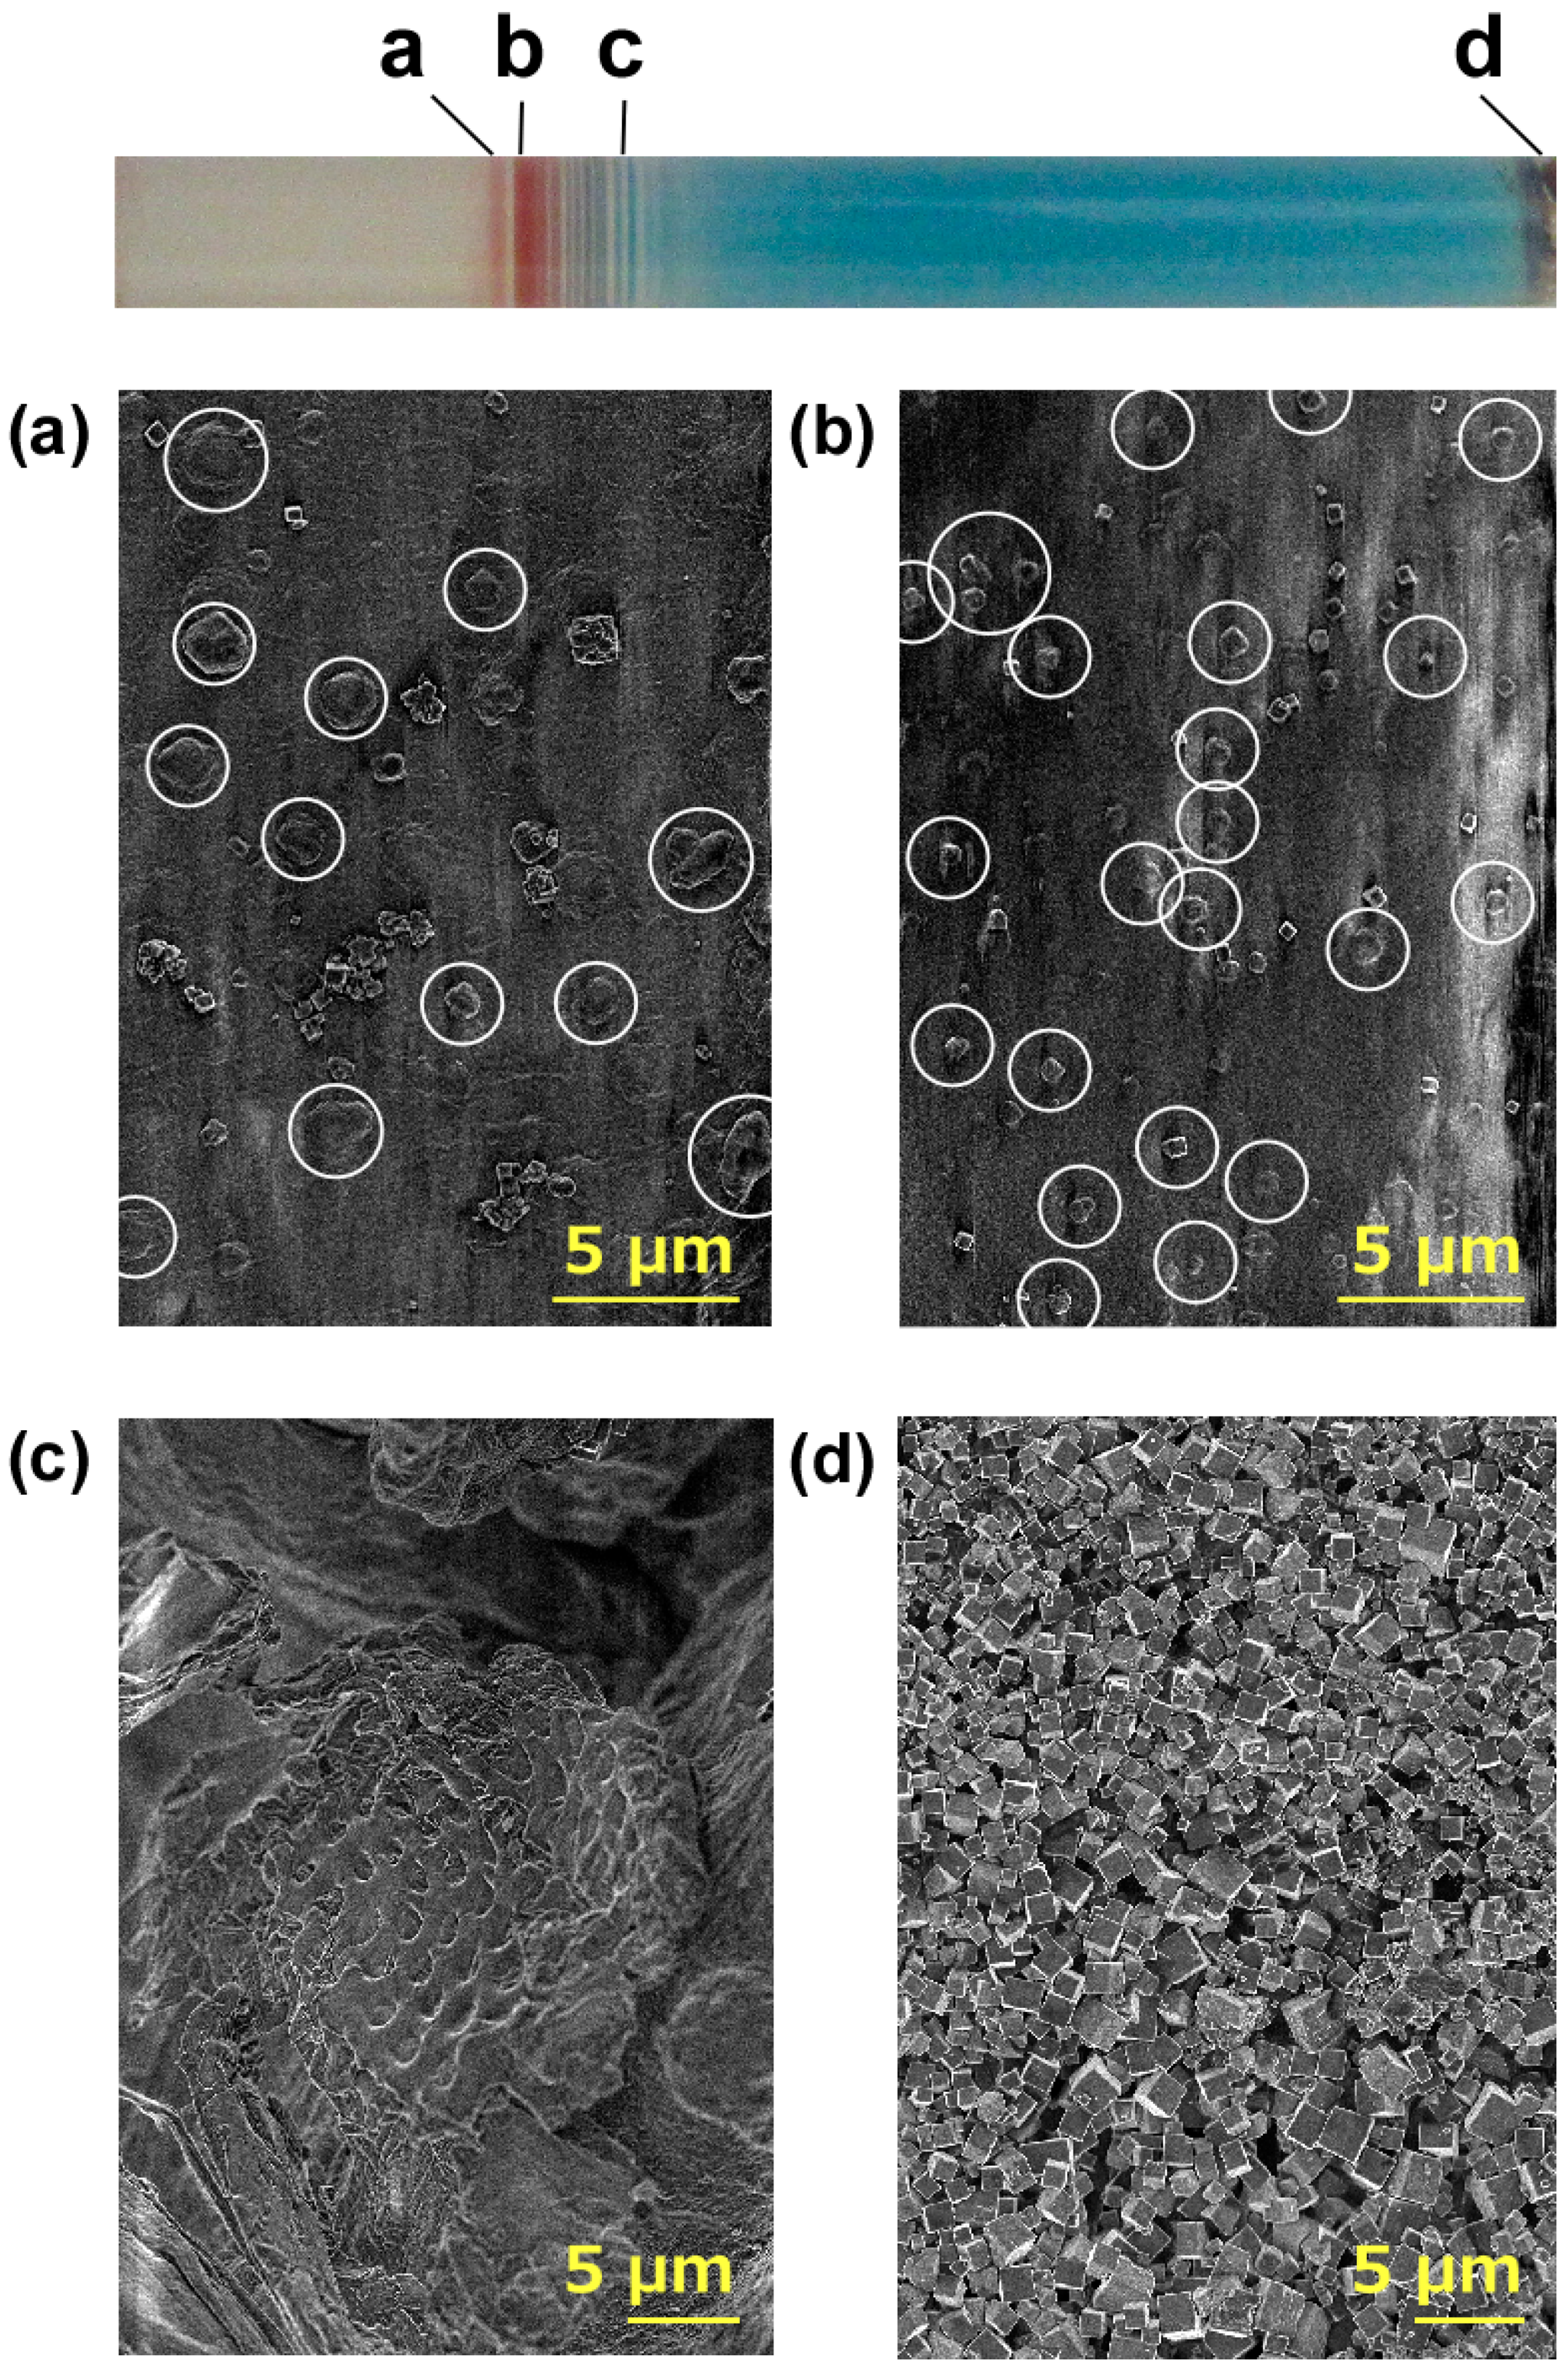
Figure 13 shows SEM images of the gel sample having multicolored periodic bands formed under the cyclic alternating voltage (other results related to the same sample are shown in Figure 8 and Figure 10, Figure 11 and Figure 12). Figure 13a–c was obtained for the periodic bands of n = 1 (the non-main RB band), 2 (the main band), and 12 (the blue band), respectively. For comparison, a region close to the anode is also shown in Figure 13d.
As shown in Figure 13d, precipitates close to the anode consisted of crystallites that were definitely cubic, which is characteristic of PBA [23]. In accordance with the relatively high Fe Kα intensity in Figure 11 (i.e., a large amount of Cu-Fe PBA), there were numerous crystallites. The crystallite sizes (1–3 μm on each side) are somewhat smaller than those of Mn-Fe PBA crystallites formed in agarose gels in the conventional RD setup for Liesegang banding (3–10 μm on each side) [23]. Despite the different (but comparable) sizes, Figure 13d is very similar to the SEM images acquired previously for precipitation bands of Mn-Fe PBA in agarose gels [23,31].
Figure 13b is an SEM image of precipitates formed in the main band of n = 2. These precipitates also consisted of cube-like crystallites, even though their sizes were considerably smaller (0.1–0.8 μm on each side) and the shapes were not perfectly cubic, suggesting the existence of many defects. These small crystallites can be considered to form the reddish–brown background observed in Figure 12b.
The somewhat irregular shapes of the crystallites in Figure 13b may be a disappointment if one expects well-defined PBA crystallites with few defects for use as electrodes [15,16,20] or magnets [19]. However, when used as adsorbents or catalysts, smaller PBA crystallites with many defects would be advantageous because of their inherently large surface area. Indeed, the importance of defects (i.e., porosity) has been reported in several studies on the adsorption/catalytic properties of PBA [17,18,20,21,22,32].
Figure 13a is an SEM image of the precipitates formed in the non-main RB band of n = 1. Interestingly, in addition to the cube-like crystallites, there were also plate-like crystallites (indicated by white circles). This finding strongly suggests that the non-main RB bands consisted of two types of crystallites, namely plate-like Cu(OH)2 and cube-like Cu-Fe PBA.
Figure 13c is an SEM image of the precipitates formed in the blue band of n = 12. Unlike the other images, this image shows only a few cube-like crystallites as expected. Instead, plate-like crystallites were dominant and even formed laminates with the size of ~25 μm. This finding also suggests the large contribution of Cu(OH)2 to the blue periodic bands.

4. Discussion

The position-dependent size and shape of crystallites formed in the proposed RDR setup (Figure 13) suggest the potential applications of the observed periodic banding phenomenon for selective preparation of PBA, as mentioned in the introduction. Unfortunately, the current periodic banding only occurred stochastically (having a probability of ~50%), and some byproducts were also present. To establish RDR banding systems for practical applications in material science and engineering, better control over the periodic bands is required, especially concerning (1) the amounts, sizes, and shapes of crystallites, (2) the amounts of formed byproducts, (3) the spacing between bands, and (4) reproducibility.
First, achieving the above objectives requires a deeper understanding of the observed periodic banding, in which the dn values are randomly distributed around an average (Figure 10). Currently, no mathematical model could explain such precipitation banding. As a starting point towards a theoretical framework, the models of Liesegang bands may be useful. Modern theoretical models for Liesegang banding can be approximately classified into pre- or post-nucleation models, depending on the sequence of elementary events [1,2,3,5,33,34,35,36]. Pre-nucleation models assume that the precipitation bands are formed as a result of repeated cycles of the supersaturation, nucleation, and depletion of the reaction products. In these models, the crystallites are formed by rapid nucleation and crystallization triggered by supersaturation, and hence they should be relatively small in size and irregular in shape [23]. In contrast, post-nucleation models assume the competitive growth of small particles of reaction products (including crystallites). According to these models, the crystallites in Liesegang bands must be relatively large in size because most of them have undergone Ostwald ripening [23]. Overall, the sizes and shapes of the crystallites in Liesegang bands can be used to identify the dominant formation processes: small and irregular crystallites are likely formed according to the pre-nucleation models, whereas relatively large crystallites indicate the dominance of the post-nucleation processes.
Although Liesegang banding (via RD processes) and the currently studied banding (via RDR processes) have different mechanisms, the correlation between the dominant processes in precipitation banding and the sizes/shapes of the resultant crystallites should remain valid. The SEM image in Figure 13b is more consistent with pre-nucleation models, i.e., rapid nucleation and crystallization triggered by supersaturation were dominant in forming the main bands. Nevertheless, this suggestion is qualitative and tentative, and more quantitative and comprehensive models are required.
Second, the optimal experimental conditions to produce well-controlled periodic bands should be further explored. Conventional precipitation banding of PBA in gels (using the RD setup in Figure 1a) is known to be dependent on the experimental conditions, including the gel type [29], gel density [29], and presence of magnetic fields [37]. The precipitation patterns formed using the proposed RDR setup should be examined while varying these factors (as well as the initial concentration of [Fe(CN)6]3− and the gel length). The optimal external potential, including the voltage, period, and number of cycles for cyclic alternating voltage application, should also be explored further. Additionally, variation in the sizes, materials, and shapes of the electrodes may also have interesting effects on the banding.
Third, the reaction products formed in the periodic bands, the blue region in the gel, and the anode and cathode regions should be more comprehensively characterized. For instance, the defect concentration in the cubic (Cu-Fe PBA) crystallites formed in these regions should be measured quantitatively and separately. Their local structure(s) around the Cu atoms and the crystallinity should also be investigated by X-ray absorption fine structure spectroscopy and X-ray diffractometry, respectively. The adsorption properties of the crystallites obtained by the proposed setup and conventional methods should be compared in the forms of both bulk and coated film. Additionally, the characteristics and distribution of the byproducts must be studied. For this purpose, more detailed SEM studies including cross-section analysis of the SEM images and micro-XRF mapping may be helpful.
Fourth, electrochemical processes at the boundaries between the Cu electrodes and agarose gel of the proposed setup should be further investigated. Electrochemical measurements capable of detecting currents at the μA level, including linear-sweep and/or cyclic voltammetry, may give a clue to this issue. Considering the environmental footprint of the proposed setup, its Faradaic efficiency should also be investigated.
Fifth, simple and effective methods should be developed for cleaning the electrodes. As shown in Figure 6a, considerable deposits accumulated on the electrodes, which could pose a serious problem when applying this method to microscale fabrication processes.
Sixth, extension of the RDR experiments to other PBA systems may expand the potential applications. PB, Co-Fe PBA, and Ni-Fe-based PBA could be easily produced using the current setup after substituting Fe, Co, and Ni anodes for the Cu anode, respectively.

5. Conclusions

We have proposed a simple and novel reaction–diffusion-reaction (RDR) setup for producing precipitation patterns in agarose gel. Under an applied cyclic alternating voltage, this setup can produce periodic precipitation bands containing cube-like reddish–brown crystallites (possibly Cu-FeII PBA). Although this banding happens stochastically even under identical conditions, it has not been observed in conventional reaction–diffusion (RD) setup for Liesegang banding. This new approach for periodic banding utilizing RDR processes has many interesting features. Meanwhile, many aspects of this banding phenomenon are currently unclear. Nevertheless, the novelty, the simpleness, and the associated potential applications in material science and engineering warrant further investigation of the proposed RDR system.

Author Contributions

Conceptualization, H.H.; methodology, H.H.; investigation, H.H. and T.S.; resources, H.H.; data curation, H.H.; writing—original draft preparation, H.H.; writing—review and editing, H.H.; visualization, H.H. and T.S.; supervision, H.H.; project administration, H.H.; funding acquisition, H.H. All authors have read and agreed to the published version of the manuscript.

Funding

This research was funded by JSPS KAKENHI, grant number JP19K05409.

Institutional Review Board Statement

Not applicable.

Informed Consent Statement

Not applicable.

Data Availability Statement

Not applicable.

Acknowledgments

The authors are grateful to M. Inamura, M. Kuchi-ishi, M. Ishikawa, K. Suzuki, R. Someya, and R. Furukawa of Japan Women’s University for their help with sample preparation. SEM operation were carried out by T. Takagi and A. Takahashi of the Laboratory of Electron Microscopy, Japan Women’s University.

Conflicts of Interest

The authors declare no conflict of interest.

References

  1. Henisch, H. Crystals in Gels and Liesegang Rings; Cambridge University Press: Cambridge, UK, 1988; pp. 116–175. [Google Scholar]
  2. Nabika, H. Liesegang phenomena: Spontaneous pattern formation engineered by chemical reactions. Curr. Phys. Chem. 2015, 5, 5–20. [Google Scholar] [CrossRef]
  3. Nabika, H.; Itatani, M.; Lagzi, I. Pattern formation in precipitation reactions: The Liesegang phenomenon. Langmuir 2020, 36, 481–497. [Google Scholar] [CrossRef]
  4. Grzybowski, B.A. Chemistry in Motion: Reaction-Diffusion Systems for Micro- and Nanotechnology; John Wiley & Sons: Chichester, UK, 2009; pp. 93–163. [Google Scholar]
  5. Nakouzi, E.; Steinbock, O. Self-organization in precipitation reactions far from the equilibrium. Sci. Adv. 2016, 2, e1601144. [Google Scholar] [CrossRef] [Green Version]
  6. Grzybowski, B.A.; Bishop, K.J.M.; Campbell, C.J.; Fialkowski, M.; Smoukov, S.K. Micro- and nanotechnology via reaction-diffusion. Soft Matter 2005, 1, 114–128. [Google Scholar] [CrossRef]
  7. Grzybowski, B.A.; Campbell, C.J. Fabrication using ‘programmed’ reactions. Mater. Today 2007, 10, 38–46. [Google Scholar] [CrossRef]
  8. Das, I.; Pushkarna, A.; Chand, S. Electrical field effect on periodic precipitation and chemical waves in gel media in batch and continuous-flow reactors. J. Colloid Interface Sci. 1992, 150, 178–186. [Google Scholar] [CrossRef]
  9. Lagzi, I. Formation of Liesegang patterns in an electric field. Phys. Chem. Chem. Phys. 2002, 4, 1268–1270. [Google Scholar] [CrossRef]
  10. Shreif, Z.; Mandalian, L.; Abi-Haydar, A.; Sultan, R. Taming ring morphology in 2D Co(OH)2 Liesegang patterns. Phys. Chem. Chem. Phys. 2004, 6, 3461–3466. [Google Scholar] [CrossRef]
  11. Bena, I.; Droz, M.; Lagzi, I.; Martens, K.; Rácz, Z.; Volford, A. Designed patterns: Flexible control of precipitation through electric currents. Phys. Rev. Lett. 2008, 101, 075701. [Google Scholar] [CrossRef] [Green Version]
  12. Karam, T.; Sultan, R. Effect of an alternating current electric field on Co(OH)2 periodic precipitation. Chem. Phys. 2013, 412, 7–12. [Google Scholar] [CrossRef]
  13. Heard, D.M.; Lennox, A.J.J. Electrode materials in modern organic electrochemistry. Angew. Chem. Int. Ed. 2020, 59, 18866–18884. [Google Scholar] [CrossRef]
  14. Bard, A.J.; Parsons, R.; Jordan, J. Standard Potentials in Aqueous Solution; Dekker: New York, NY, USA, 1985; p. 827. [Google Scholar]
  15. Wessells, C.D.; Huggins, R.A.; Cui, Y. Copper hexacyanoferrate battery electrodes with long cycle life and high power. Nat. Commun. 2011, 2, 550. [Google Scholar] [CrossRef] [Green Version]
  16. Lu, Y.; Wang, L.; Cheng, J.; Goodenough, J.B. Prussian blue: A new framework of electrode materials for sodium batteries. Chem. Commun. 2012, 48, 6544–6546. [Google Scholar] [CrossRef] [PubMed]
  17. Kaye, S.S.; Long, J.R. The role of vacancies in the hydrogen storage properties of Prussian blue analogues. Catal. Today 2007, 120, 311–316. [Google Scholar] [CrossRef]
  18. Svensson, G.; Grins, J.; Eklöf, D.; Eriksson, L.; Wardecki, D.; Thoral, C.; Bodoignet, L. Influence of the presence of different alkali cations and the amount of Fe(CN)6 vacancies on CO2 adsorption on copper hexacyanoferrates. Materials 2019, 12, 3371. [Google Scholar] [CrossRef] [PubMed] [Green Version]
  19. Verdaguer, M.; Girolami, G. Magnetic Prussian blue analogs. In Magnetism: Molecules to Materials V; Miller, J.S., Drillon, M., Eds.; Wiley–VCH Verlag GmbH & Co. KGaA: Weinheim, Germany, 2004; pp. 283–346. [Google Scholar]
  20. Li, W.-J.; Han, C.; Cheng, G.; Chou, S.-L.; Liu, H.-K.; Dou, S.-X. Chemical properties, structural properties, and energy storage applications of Prussian blue analogues. Small 2019, 15, 1900470. [Google Scholar] [CrossRef]
  21. Azhar, A.; Li, Y.; Cai, Z.; Zakaria, M.B.; Masud, M.K.; Hossain, M.S.; Kim, J.; Zhang, W.; Na, J.; Yamauchi, Y.; et al. Nanoarchitectonics: A new materials horizon for Prussian blue and its analogues. Bull. Chem. Soc. Jpn. 2019, 92, 875–904. [Google Scholar] [CrossRef]
  22. Yu, Z.-Y.; Duan, Y.; Liu, J.-D.; Chen, Y.; Liu, X.-K.; Liu, W.; Ma, T.; Li, Y.; Zheng, X.-S.; Yao, T.; et al. Unconventional CN vacancies suppress iron-leaching in Prussian blue analogue pre-catalyst for boosted oxygen evolution catalysis. Nat. Commun. 2019, 10, 2799. [Google Scholar] [CrossRef] [Green Version]
  23. Hayashi, H.; Aoki, S.; Suzuki, T. Spontaneous precipitation pattern formation by crystallites of Mn-Fe-based Prussian blue analogues in agarose gel. RSC Adv. 2019, 9, 36240–36247. [Google Scholar] [CrossRef] [Green Version]
  24. Hayashi, H.; Takaishi, M. Low-cost, high-performance sample cell for X-ray spectroscopy of solutions and gels made from plastic straw. Anal. Sci. 2019, 35, 651–657. [Google Scholar] [CrossRef] [Green Version]
  25. Hayashi, H.; Sato, Y.; Aoki, S.; Takaishi, M. In situ XRF analysis of Cs adsorption by the precipitation bands of Prussian blue analogues formed in agarose gels. J. Anal. At. Spectrom. 2019, 34, 979–985. [Google Scholar] [CrossRef]
  26. Hayashi, H.; Abe, H. An X-ray Spectroscopic study of Co-Fe-based Prussian blue analog gels. Bull. Chem. Soc. Jpn. 2016, 89, 1510–1517. [Google Scholar] [CrossRef]
  27. Hayashi, H.; Abe, H. A combined X-ray spectroscopic study on the multicolored pattern formation in gels containing FeCl3 and K3[Fe(CN)6]. J. Anal. At. Spectrom. 2016, 31, 912–923. [Google Scholar] [CrossRef]
  28. Hayashi, H.; Abe, H. X-ray spectroscopic analysis of Liesegang patterns in Mn-Fe-based Prussian blue analogs. J. Anal. At. Spectrom. 2016, 31, 1658–1672. [Google Scholar] [CrossRef]
  29. Hayashi, H.; Abe, H. Gel-state dependencies of brown patterns of Mn-Fe-based Prussian blue analogues studied by combined X-ray spectroscopies. Bull. Chem. Soc. Jpn. 2017, 90, 807–819. [Google Scholar] [CrossRef]
  30. Hayashi, H.; Sato, Y.; Abe, H. X-ray spectroscopic analysis of stochastic, periodic precipitation in Co-Fe-based Prussian blue analogues. J. Anal. At. Spectrom. 2018, 33, 957–966. [Google Scholar] [CrossRef]
  31. Hayashi, H.; Aoki, S.; Takaishi, M.; Sato, Y.; Abe, H. An XAFS study of Cs adsorption by the precipitation bands of Mn-Fe-based Prussian blue analogues spontaneously formed in agarose gel. Phys. Chem. Chem. Phys. 2019, 21, 22553–22562. [Google Scholar] [CrossRef]
  32. Estelrich, J.; Busquets, M.A. Prussian blue: A safe pigment with zeolitic-like activity. Int. J. Mol. Sci. 2021, 22, 780. [Google Scholar] [CrossRef]
  33. Sadek, S.; Sultan, R. Liesegang patterns in nature: A diverse scenery across the sciences. In Precipitation Patterns in Reaction-Diffusion Systems; Lagzi, I., Ed.; Research Signpost: Kerala, India, 2010; pp. 1–43. [Google Scholar]
  34. Izsák, F.; Lagzi, I. Models of Liesegang pattern formation. In Precipitation Patterns in Reaction-Diffusion Systems; Lagzi, I., Ed.; Research Signpost: Kerala, India, 2010; pp. 207–217. [Google Scholar]
  35. Chacron, M.; L’Heureux, I. A new model of periodic precipitation incorporating nucleation, growth and ripening. Phys. Lett. A 1999, 263, 70–77. [Google Scholar] [CrossRef]
  36. L’Heureux, I.; Bektursunova, R. Modeling Liesegang periodic precipitation patterns in geochemical systems. In Precipitation Patterns in Reaction-Diffusion Systems; Lagzi, I., Ed.; Research Signpost: Kerala, India, 2010; pp. 45–71. [Google Scholar]
  37. Hayashi, H.; Aoki, S.; Abe, H. Magnetic-field-induced painting-out of precipitation bands of Mn-Fe-based Prussian blue analogues in water-glass gels. ACS Omega 2018, 3, 4494–4501. [Google Scholar] [CrossRef]
Figure 1. Schematic illustrations of the (a) conventional reaction–diffusion (RD) setup to observe Liesegang banding [1,4,5], (b) previously reported RD setup to examine the effects of electric field on Liesegang bands [8,10,11], and (c) currently proposed reaction–diffusion–reaction (RDR) setup where electrochemical reactions, diffusion of reactant ions influenced by electric field, and precipitation reactions are coupled to form precipitation patterns of Cu-Fe PBA in agarose gel. The arrows in (a) and (b) indicate the movement directions of reactant ions supplied from the outer electrolyte column. Note that the ion movement in (c) is different due to changes in the supply of reactant ions. For further discussion see the text.
Applsci 11 05000 g001
Figure 2. Well-developed precipitation patterns of Cu-Fe PBA formed at 25 °C in the conventional RD setup (schematically shown in Figure 1a) under the following initial conditions. Outer electrolyte gel: [Cu2+] = 0.250 M and 1.0 mass% agarose. Inner electrolyte gel: (a) [[Fe(CN)6]4−] = 0.025 M and (b) [[Fe(CN)6]3−] = 0.025 M, both with 1.5 mass% agarose. The elapsed time after the addition of the outer electrolyte sol was 135 h.
Applsci 11 05000 g002
Figure 3. Spatiotemporal evolution of a precipitation band of Cu-FeII PBA formed at 25 °C in the conventional RD setup under the following initial conditions. Outer electrolyte gel: [Cu2+] = 0.250 M and 1.0 mass% agarose. Inner electrolyte gel: [[Fe(CN)6]4−] = 0.025 M and 1.5 mass% agarose. The elapsed time after the addition of the outer electrolyte sol is indicated at the right of each image. The arrow at the bottom indicates the position of the gel boundary.
Applsci 11 05000 g003
Figure 4. Spatiotemporal evolution of a multicolored pattern formed at 25 °C in the sample tube using the proposed RDR setup under an applied constant voltage of 2 V. The initial conditions are as follows: [[Fe(CN)6]3−] = 0.050 M and 2.0 mass% agarose. The elapsed time after voltage application is indicated at the right of each image. Bottom image: the pattern after removing unreacted ions. A scale bar is provided at the bottom of the image. Top: illustration of the charges of the electrodes and the movement direction of reactant ions induced by the electric field.
Applsci 11 05000 g004
Figure 5. Side and top views of a beaker in which an agarose gel containing Cu2+ ions was placed atop an agarose gel containing [Fe(CN)6]3− ions at 25 °C for 300 s. The initial conditions of these gels are as follows. The Cu2+ gel: [Cu2+] = 0.200 M and 1.0 mass% agarose. The [Fe(CN)6]3− gel: [[Fe(CN)6]3−] = 0.040 M and 1.5 mass% agarose. When seen from above, the blue Cu2+ gel appears green.
Applsci 11 05000 g005
Figure 6. (a) Images of the Cu cathode and anode after applying 2 V across the sample tube for 100 h. (b) Images of the gel sample (left) after contacting a Cu rod (right) without voltage application for 100 h. Reddish–brown deposits were observed on these Cu rods, as well as at the gel boundary (in the ellipse). A scale bar is provided at the bottom of the image.
Applsci 11 05000 g006
Figure 7. Spatiotemporal evolution of a multicolored pattern formed at 25 °C in the sample tube under an applied constant voltage of 4 V. The initial conditions are as follows: [[Fe(CN)6]3−] = 0.050 M and 2.0 mass% agarose. The elapsed time after voltage application is indicated at the right of each image. Bottom: the pattern after removing unreacted ions. The arrow at the bottom indicates the positions of the sharp line structure. A scale bar is also provided at the bottom of the image. Top: illustration of the charges of the electrodes and the movement direction of reactant ions induced by the electric field.
Applsci 11 05000 g007
Figure 8. Spatiotemporal evolution of a typical multicolored pattern formed at 25 °C in the sample tube under 20 cycles of 4 V (1 h)–1 V (4 h). The initial conditions are as follows: [[Fe(CN)6]3−] = 0.050 M and 2.0 mass% agarose. The elapsed time after initial voltage application is indicated at the right of each image. Bottom: the pattern after removing unreacted ions. The arrow at the bottom indicates the region where periodic bands were formed. A scale bar is also provided at the bottom of the image. Top: illustration of the charges of the electrodes and the movement directions of reactant ions induced by the electric field.
Applsci 11 05000 g008
Figure 9. Stochastic formation of periodic bands under the cyclic alternating voltage application. Periodic bands such as (a) and (b) were generated with a probability of ~50%, and an almost continuous band such as (c) and (d) was generated in the other ~50% cases even under identical experimental conditions. These images were obtained at 90 h after the initial voltage application. The arrow at the bottom indicates the region where reddish–brown precipitation bands were formed. A scale bar is also provided at the bottom of the image.
Applsci 11 05000 g009
Figure 10. (a) Periodic bands formed in the sample tube under the cyclic alternating voltage application. The bands are numbered from 1 (the cathode side) to 15 (the anode side). For comparison, 0.5 mm graduations are also shown at the bottom of the image. (b) Distances between the adjacent bands in (a): dn = Xn+1Xn. The average value and dispersion are shown by the red broken line and pink shaded area, respectively.
Applsci 11 05000 g010
Figure 11. Fe Kα intensity distribution of the multicolored pattern formed under the cyclic alternating voltage, obtained after removing the unreacted ions. An image of the gel sample is displayed at the top to facilitate comparison with the periodic bands.
Applsci 11 05000 g011
Figure 12. Microscopic images (×1000) of the multicolored pattern formed under the cyclic alternating voltage application, obtained after removing unreacted ions. The positions where these microscopic images were acquired are indicated in the uppermost panel. The size of the grid boxes in each image (which were employed for estimating sizes of the crystallites) is 50 μm. The crystallites observed in (ce) are indicated by white circles to guide the eye.
Applsci 11 05000 g012
Figure 13. SEM images (×5000 for (a) and (b); ×3000 for (c) and (d)) of the multicolored pattern formed under the cyclic alternating voltage application, obtained after removing unreacted ions. The positions where these SEM images were acquired are indicated in the uppermost panel. The plate-like crystallites in (a) and the irregularly shaped (albeit cube-like) crystallites in (b) are indicated by white circles to guide the eye. Scale bars (which were employed for estimating the sizes of the crystallites) are provided in each image.
Applsci 11 05000 g013
Publisher’s Note: MDPI stays neutral with regard to jurisdictional claims in published maps and institutional affiliations.