
In-Process Measurement of Three-Dimensional Deformations Based on Speckle Photography


1
Bremen Institute for Metrology, Automation and Quality Science, University of Bremen, Linzer Str. 13, 28359 Bremen, Germany
2
MAPEX Center for Materials and Processes, University of Bremen, P.O. Box 330440, 28334 Bremen, Germany
*
Author to whom correspondence should be addressed.
Appl. Sci. 2021, 11(11), 4981; https://doi.org/10.3390/app11114981
Submission received: 6 May 2021
/
Revised: 17 May 2021
/
Accepted: 25 May 2021
/
Published: 28 May 2021
(This article belongs to the Special Issue Optical In-Process Measurement Systems)
Abstract
:In the concept of the process signature, the relationship between a material load and the modification remaining in the workpiece is used to better understand and optimize manufacturing processes. The basic prerequisite for this is to be able to measure the loads occurring during the machining process in the form of mechanical deformations. Speckle photography is suitable for this in-process measurement task and is already used in a variety of ways for in-plane deformation measurements. The shortcoming of this fast and robust measurement technique based on image correlation techniques is that out-of-plane deformations in the direction of the measurement system cannot be detected and increases the measurement error of in-plane deformations. In this paper, we investigate a method that infers local out-of-plane motions of the workpiece surface from the decorrelation of speckle patterns and is thus able to reconstruct three-dimensional deformation fields. The implementation of the evaluation method enables a fast reconstruction of 3D deformation fields, so that the in-process capability remains given. First measurements in a deep rolling process show that dynamic deformations underneath the die can be captured and demonstrate the suitability of the speckle method for manufacturing process analysis.
1. Introduction
The functionality of technical surfaces is significantly influenced by the manufacturing process [1,2,3]. This applies in particular to processes which aim to change the surface layer properties of the workpiece in a suitable manner. However, the targeted generation of, e.g., depth hardness gradients is challenging—even under laboratory conditions [2]. The reasons are that material loads occurring during the machining process in the form of displacements and strains, which are responsible for the material modifications, cannot be measured and that a lack of process knowledge exists. Therefore, the targeted material modifications are only adjusted via the machining parameters or process variables of the machine tools in an iterative way [4,5,6]. A remedy can be provided by the introduced concept of process signatures [7], which focuses on the internal mechanisms and the influencing quantities [8], leading to a material change to describing the workpiece modification. To gain a deeper understanding of the manufacturing process, the study of process signatures, which correlate the material changes occurring with the acting internal mechanical material loads, is ongoing. The use of process signatures not only enables a better understanding of the process, but also allows a comparison of seemingly different manufacturing processes. As a result, processes and process chains can be optimized to improve functional properties and reduce manufacturing costs [7].
Although a variety of characterization methods for the resulting material modifications exists, the metrological recording of the material loads in the ongoing production process remains a needed prerequisite. Mechanical workpiece loads can be calculated by comparing or correlating images taken before and during the occurrence of the deformation. In contrast to Digital Image Correlation (DIC), the method of Digital Speckle Photography (DSP) [9] is much more precise, especially on low-contrast surfaces. In terms of its maximum achievable resolution, the method is limited only by Heisenberg’s uncertainty principle [10]. The in-process capability and suitability of the speckle photography method for two-dimensional deformation measurement in the image plane with resolutions of less than 20 nm [11] has already been demonstrated in several manufacturing applications [12,13,14,15]. However, since mechanical machining causes at least a biaxial stress state and, thus, a triaxial strain state in the workpiece via the machining forces, a reconstruction of three-dimensional deformation fields is required for a complete metrological description of the loads.
Even though original speckle photography is only suitable for two-dimensional in-plane measurements, various method derivatives exist to obtain out-of-plane deformation information as well. In this context, Khodadad et al. [16] propose a combination of speckle photography and speckle interferometry. The robust setup uses only one camera and can determine three-dimensional displacements with a resolution of 0.6 µm. The method introduced by Fricke-Begemann [17] uses the decorrelation of the speckle patterns associated with the out-of-plane motion, i.e., the speckle correlation functions changing with the motion are evaluated. The determined measurement uncertainties here are significantly lower than in the approach of Khodadad et al. [16] and are in the range of one tenth of the wavelength.
Therefore, the aim of this paper is the realization of a solely speckle-photographic in-process measurement system for the acquisition of three-dimensional load fields. In a first practical implementation, the deformation fields in a manufacturing rolling process are to be measured. The open questions in the context of speckle-photographic 3D deformation measurement in manufacturing processes are to what extent such a measurement system is suitable for use in the harsh manufacturing environment and to what extent the proposed algorithms are sufficient for in-process measurement. Furthermore, it must be clarified in which functional relationship the speckle decorrelation is related to displacements in the out-of-plane axis and how a calibration of this axis needs to be performed.
Accordingly, this paper is organized as follows: Section 2 describes the challenges of three-dimensional deformation measurement by speckle photography, especially in deformation evaluation according to Fricke-Begemann [17]. Moreover, an alternative approach and its implementation in the context of sub-pixel interpolation is presented. After the demonstration of calibration strategies, the first in-process measurements during deep rolling follow in Section 3. Section 4 discusses the reconstruction of the three-dimensional deformation or displacement field, followed by a summary and an outlook in Section 5.
2. Materials and Methods
2.1. In-Plane Speckle Photography
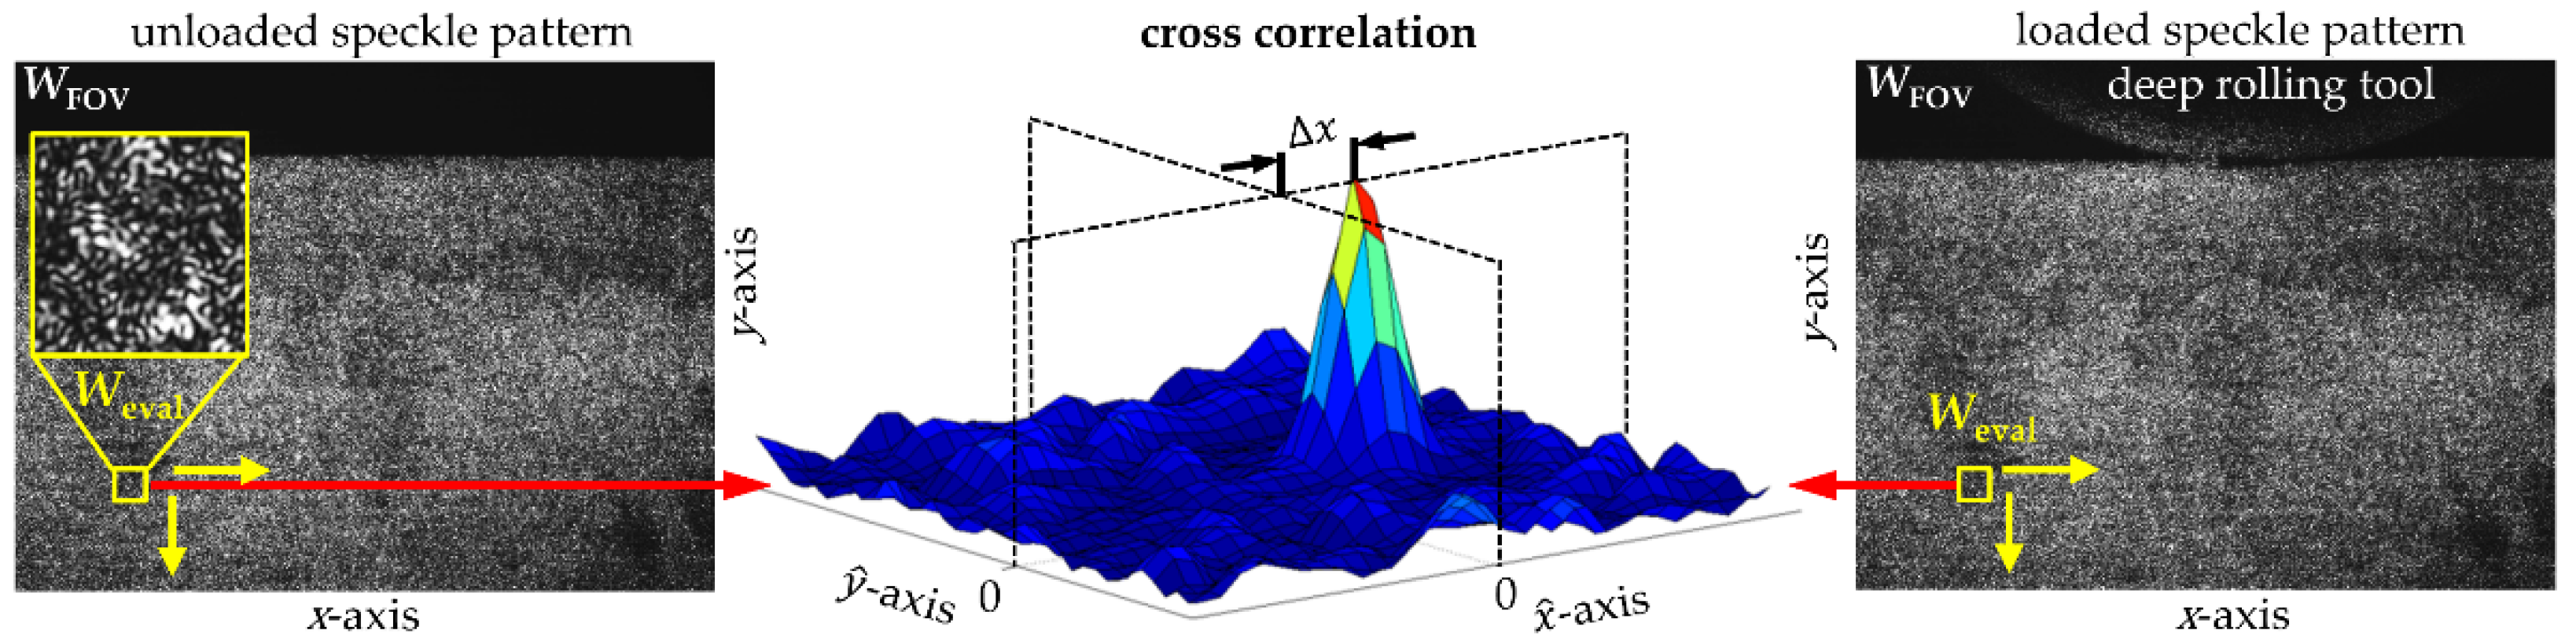
When illuminating a rough surface, a so-called speckle pattern is formed in the image plane of an imaging camera system by constructive and destructive interference (see zoomed area Weval in Figure 1). Here, each surface point on the object surface, with the coordinates ξ and ψ, is assigned to a point (x,y) on the camera chip. If a point (ξ,ψ) of the surface is shifted in-plane by Δξ or Δψ due to deformation, the corresponding point (x,y) in the image plane is shifted by Δx or Δy, respectively. This shift can be analyzed via the maximum of the cross-correlation function according to Figure 1. In order to measure a global deformation field of many object points in a region of interest WFOV, a small local evaluation window Weval is rasterized across the overall image WFOV.
In order to determine the position of the maximum of the cross-correlation that is shown in Figure 1 with sub-pixel accuracy, interpolation methods are used based on curve approximation. The currently used sub-pixel interpolation algorithm, according to Nobach and Honkanen [18], determines the shift of the maximum (Δx,Δy) using an elliptic Gaussian function
with the variables , which is fitted into to the cross-correlation function. It can be rewritten as:
with
The shift components ∆x, ∆y of the maximum are then obtained from the Equations (3)–(8) as follows [18]:
The relationship between the displacements ∆x, ∆y in the image plane and the respective object displacements Δξ, Δψ within the measuring area are finally obtained according to the magnification A of the imaging system:
2.2. Three-Dimensional Speckle Photography in Out-of-Plane Direction
For the initially targeted objective of an extended understanding of the manufacturing process, the acquisition of information about the 3D deformation field is essential. Speckle photographic approaches are in principle also suitable for this purpose, since the recorded speckle patterns basically represent sections through the three-dimensional structure of the wave field. Figure 2a shows an example of the measured three-dimensional structure of the speckle pattern, for a ζ-shift of the measurement plane.
The cross-correlation for pure in-plane displacements Δξ, Δψ is shown in Figure 2b. Deformations and displacements of the surface in the out-of-plane direction (Δζ), however, lead to a decorrelation of the speckle patterns, which means a reduced amplitude of the cross-correlation maximum (compare Figure 2b,c). This decorrelation was previously considered as a disturbance of the measurement effect and was minimized by using higher measurement rates. The approach of Fricke-Begemann uses the decorrelation and derives the out-of-plane deformation of the measurement surface via an elaborate shape analysis of the power spectrum of the cross-correlated speckle patterns [17]. A maximum likelihood estimation is first used to determine the tilt angles of the surface points and based on this, comprehensive three-dimensional deformation measurements are finally reconstructed. However, laboratory investigations of simultaneous tilts and in-plane displacements of the measurement surface illustrate the problem that arises in separating tilt and in-plane displacement in this form of evaluation, see Figure 3.
Especially in the range of very small in-plane displacements (<1 pixel), as they are predominantly present in the in-process load measurements of manufacturing processes, the differences are hardly recognizable. While in-plane displacements in the cross-correlation (see Figure 1) are clearly recognizable by the displacement of the maximum without significantly influencing the shape of the curve, in the evaluation via the power spectrum both the in-plane displacement and the out-of-plane movement affect the shape of the curve. Even though the power spectrum is very sensitive to the tilts, complex fit and filter algorithms are required to separate the two components. First approaches for the analysis of a two-axis motion, consisting of a tilt in the ξ-axis and a displacement in ψ-direction, resulted in computation times in the double-digit minute range for the smallest evaluation windows. With regard to the parallelization of the evaluation algorithms and the goal of a fast in-process measurement, an alternative approach is therefore pursued. The cross-correlation allows for separating the in-plane and out-of-plane displacement information by evaluating the shift of the correlation maximum (see Figure 2b) and the broadening of the normalized cross-correlation function (see Figure 2c), respectively. The shape or the width of the correlation function is already evaluated in the context of the performed sub-pixel interpolation. Inherently hidden in the time-optimized interpolation is the width σ of the approximated Gaussian function . It can be considered as a value for the speckle decorrelation and thus for the out-of-plane deformation. According to the Equations (1), (5) and (8), the width components for the - or -direction read
While the functional relationship between the displacement of the maximum of the cross-correlation function and the in-plane displacement of a surface point is linearly related via the imaging scale A, the functional relationship between the out-of-plane shift Δζ and the width of the correlation function σx or σy is unknown yet. For the establishment of a respective calibration function, the relation Δζ(σx,σy) is investigated experimentally in the following.
2.3. Relationship between the Width of the Correlation Function and the Out-of-Plane Shift
In order to analyze the functional relationship Δζ(σx,σy), the laboratory setup of a speckle-photographic measurement system was realized, see Figure 4a.
The measurement object, a sandblasted sheet metal strip (400 mm × 50 mm) is illuminated with a collimated widened Omicron laser beam (λ = 405 nm). The illuminated area is observed and imaged with an Imaging Source camera (DMK 21AU04) through a Pentax 25 mm lens. Camera, laser and the center of the sheet metal strip (in the center of the measurement field) are fixed on a linear axis from PI company, Germany. The outer ends of the sheet metal strip, on the other hand, are fixed to the laboratory bench. Thus, a movement of the linear axis causes a bending of the sheet metal strip (yellow line in Figure 4a) and thus a relative movement between the center and its outer ends.
Figure 4b shows the global field of the respective locally calculated correlation function widths
for a linear axis displacement of 28 mm in ζ-direction with a total measurement field size of 30 mm × 40 mm. The parabolic bending around the dowel pin can be seen very well in the center of the image. The width of the correlation function increases significantly from the original 1.3 pixels to about 4 pixels. If looking in each case at the mean value of the width of the cross-correlation function along the y-axis at the position x = 0 in Figure 4b, one can see the linear relationship between the respective adjusted displacement of the linear axis and the broadening of the interpolated correlation function shown in Figure 5. The functional relationship between a changed loading condition with a resulting displacement Δζ and the resulting speckle decorrelation or change in the width Δσ of the Gaussian fit from Equation (1) is thus linear in nature, i.e.,
The indefinite sign for the calibration factor B results intuitively from Figure 2. The shift by +Δζ leads to the decorrelation of the speckle pattern to the same extent as a shift by −Δζ. While the calibration factor can be defined prior to a respective measurement on the basis of a defined displacement, the sign can only be determined via prior knowledge of the observed deformation process. In the case of the bending test, for example, the outer ends of the sheet metal strip will move away from the camera in negative ζ-direction, so that negative signs are to be expected. While the in-plane deformation (Δξ,Δψ) is linearly related to the displacement (Δx,Δy) of the maximum of the cross-correlation via the scaling factor A (Equations (11) and (12)), it is shown by Equation (16) that a linear relationship also results for the out-of-plane deformation Δζ via the factor B and the change in width of the cross-correlation function Δσ.
3. Results of In-Process Measurements in a Deep Rolling Process
3.1. Measurement Setup and Experimental Realization
Due to the expected strong out-of-plane movement in the edge area of the machined surface, the deep rolling process was selected as the manufacturing process to investigate first. The realized manufacturing process with the corresponding measurement setup is shown in Figure 6. Contrary to the intuitive idea, the setup is upside down and the rolling tool presses on the workpiece from below. The design was therefore chosen so that any cooling lubricant escaping from the hydraulic rolling tool is prevented by gravity from contaminating the measuring field located on the front surface and disturbing the measurement. The rotation axis of the cylindrical tungsten carbide tool with a diameter of 13 mm, which protrudes a few millimeters above the workpiece, is located in the ζ-axis of the specimen or measuring system. The ξψ-plane lies in the face of the hardened martensitic 42CrMo4 workpiece (150 mm × 70 mm × 20 mm). The tool moves while rolling with a loading of 350 bar in the negative ξ-direction with a feed rate of v = 0.02 mm/s (see Figure 6a).
The 8 mm × 6 mm measuring field is illuminated by a short pulse laser (tp = 1 ns, λ = 532 nm) from Horus via two deflection mirrors and observed with a 4K high speed camera CP70 from Optronis via a 90 mm Apo-Rodagon lens from Rodenstock (see Figure 6b). In the rolling process with its moderate feed rate, full-frame recordings could be made at a recording rate of 166 frames per second. The implemented manufacturing setup is also used for in situ X-ray diffraction analysis and residual stress measurement and is described in detail in [19].
3.2. Results of 3D-Deformation Measurements
The results of a three-dimensional load measurement for the deep rolling test are shown in Figure 7. Assuming a homogeneous workpiece, the evaluation range in ξ-direction is extended from 8 mm to 20 mm. For this purpose, the speckle-photographic deformation measurements of the time series—in the direction of movement of the tool—were stitched into an extended evaluation field [15,20]. The calibration of the ξ- and ψ-axis is done according to Equations (11) and (12) from the magnification A of the lens system.
The load measurements in the running deep rolling process show maximum deformation differences for the ξ- and ψ-direction at a depth of 800 µm. Accordingly, the equivalent stress maximum also occurs at this depth, which is in line with the expectations [19]. At the machined surface, the material is moved up to 100 µm in the direction of the tool movement (see Figure 7a). The minimum displacement in ψ-direction is located about 1 mm behind the contact point of the tool at position 14 mm and is -40 µm (see Figure 7b). In addition to the measured in-plane deformations in ξ- and ψ-direction, Figure 7c shows for the first time the out-of-plane component of the in-process characterization in the direction of the camera axis. The determined deformation in ζ-direction corresponds to the broadening of the correlation function or a decorrelation of the speckle patterns between unloaded and loaded state.
4. Discussion
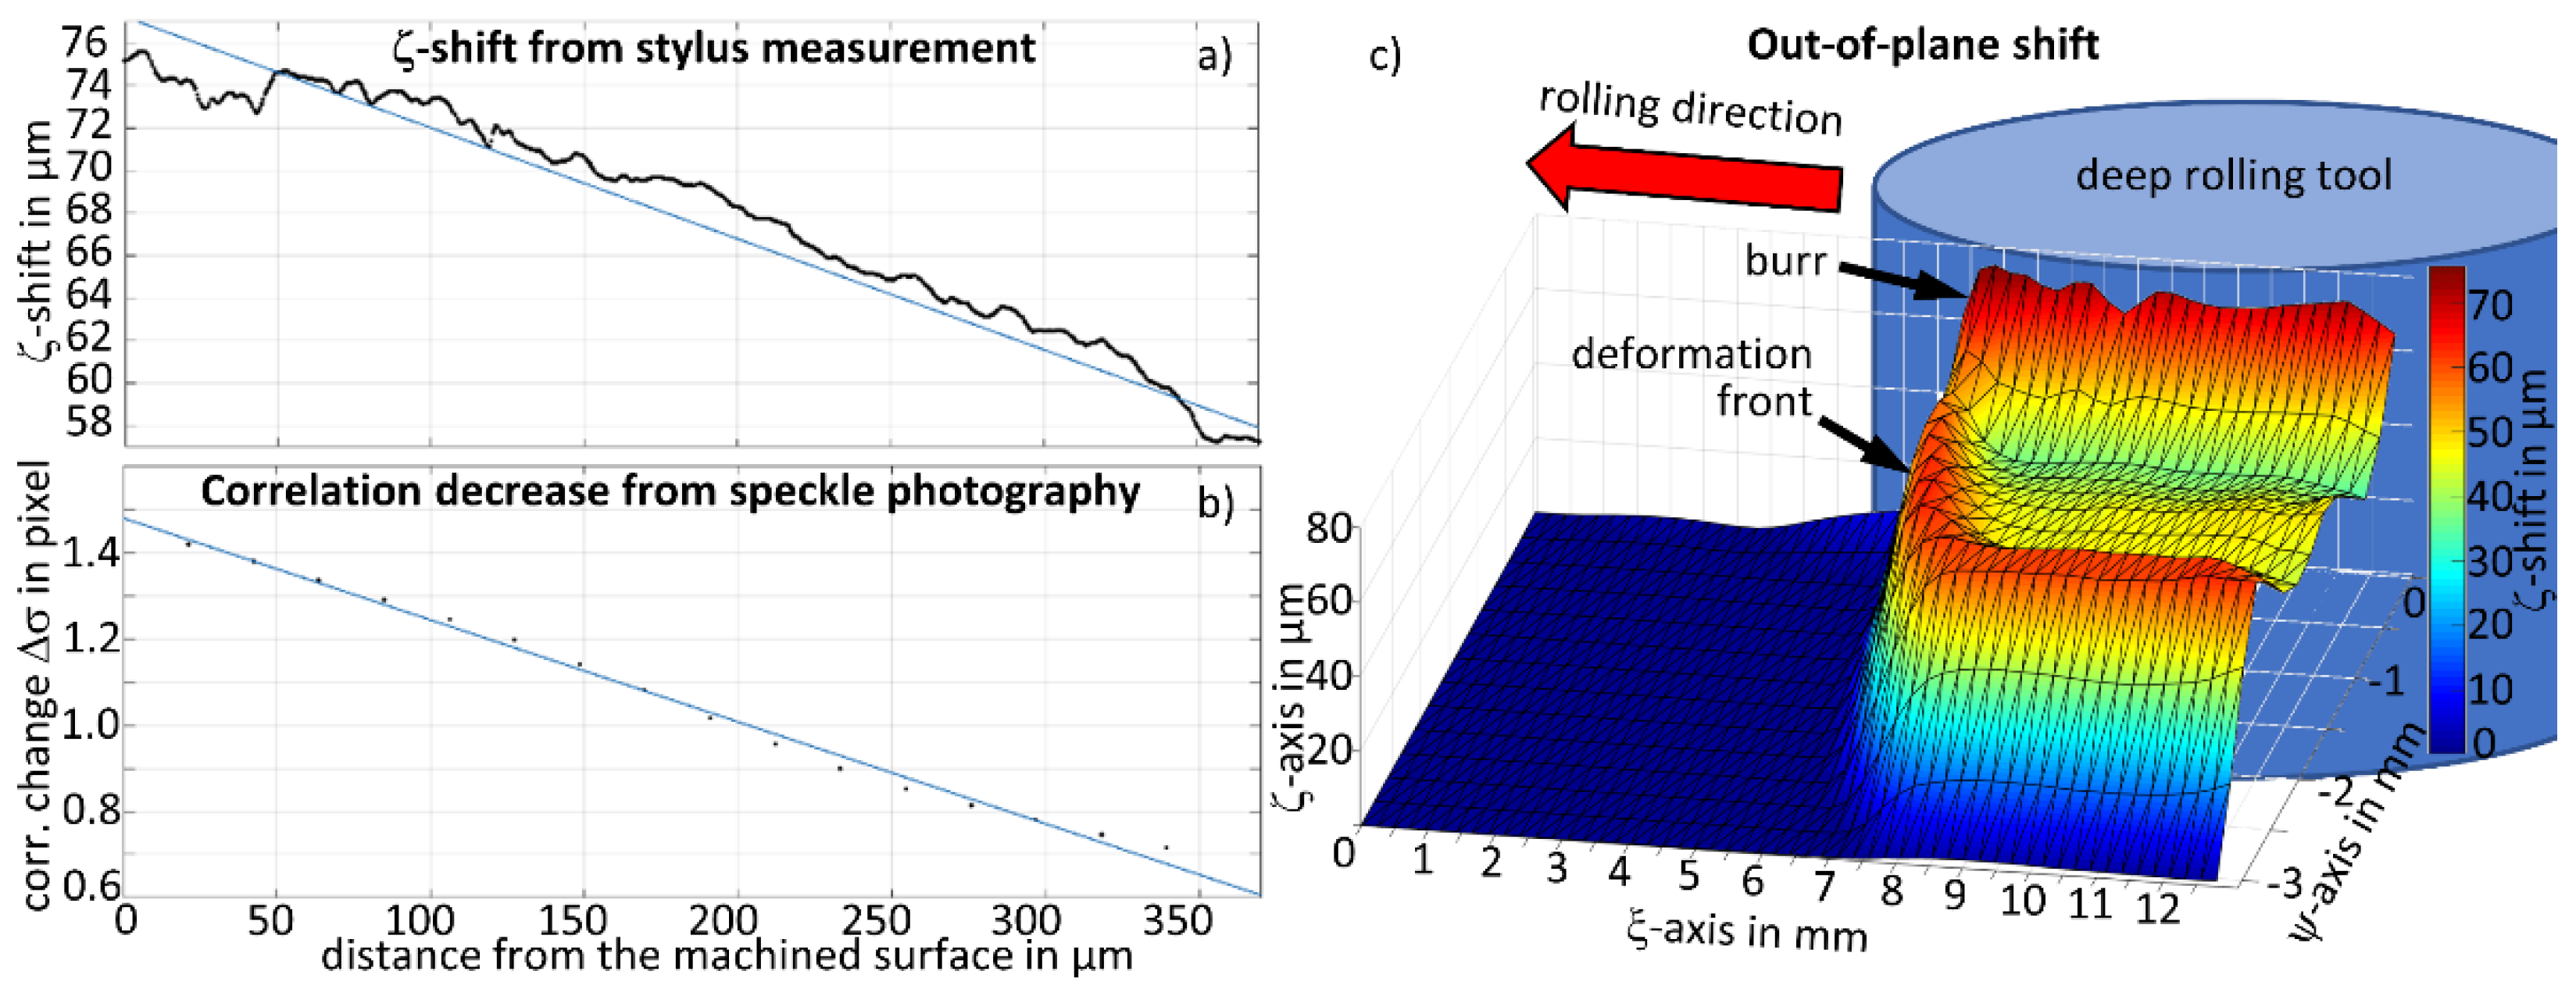
For a complete description of the three-dimensional displacement field, the only remaining task is to perform the calibration between the Δζ-displacement and the decrease of the correlation width Δσ according to Equation (16). In this case, the scaling or calibration of the ζ-axis is performed by a subsequent reference measurement with a stylus instrument (Mahr LD-120). For this purpose, the tactilely measured burr (see Figure 8a) was compared with the determined width of the correlation function (see Figure 8b). The approximately linear deformation of the burr in the section shown is reflected proportionally in the linear behavior of the correlation width Δσ and confirms the preliminary tests from Figure 5. Therefore, a linear correlation is identified and the ζ-axis is accordingly scaled for the speckle photographic measurement in Figure 8c. The evaluation of the speckle decorrelation basically does not provide any information about the sign of the measured Δζ-deformation (see Section 2.3). However, the evaluation succeeds due to the prior knowledge gained from the calibration measurements that the material is pressed outward in the direction of the camera.
Figure 8c clearly shows the strong burr formation at the edge of the workpiece with an extension of up to 80 µm, caused by the high rolling pressure of 350 bar applied to the 42CrMo4 sample. Highlighted in the measured data is the dynamic deformation front, which propagates like a ‘bow wave’ in front of the tool. It is exactly this dynamic deformation front that has so far caused problems in the interpretation of the measured data, since the accompanying decorrelation of the speckle patterns could not be explained. The acquisition of load dynamics shows that speckle photography is suitable for measuring and evaluating three-dimensional deformation fields within ongoing manufacturing processes. In particular, the analysis of the load dynamics is a key to the establishment of process signatures described above as well as for a comparison with corresponding simulations of the manufacturing process and illustrates the great potential of this in-process measurement technique.
5. Conclusions and Outlook
Laboratory investigations in the context of the analysis of the functional relationship between the decorrelation of measured speckle patterns or the broadening of the correlation function Δσ and the out-of-plane deformation Δζ confirm a linear behavior. Moreover, the additional computational effort for the determination of Δσ in the sub-pixel evaluation is negligible, which means that the parallelizability of the algorithms remains given and three-dimensional in-process deformation measurements during the rolling process become possible. The measurements during deep rolling show the dynamic deformations below the tool. From these deformations, the strain and thus the load during the die engagement can be calculated directly via the formation of the gradients. In particular, the ‘bow wave’ of out-of-plane deformation moving ahead of the tool shows that the local mechanical material loads can be much more pronounced than the workpiece modifications remaining in the material. In order to better understand manufacturing processes, 3D speckle photography can thus make an important contribution in the context of the sought-after process signatures.
While the calibration of the ξ- and ψ-displacement can be performed via the imaging scale of the camera system, this is only possible for the ζ-axis via a subsequent reference measurement with a stylus instrument. The ambiguity with regard to the direction of the displacement can also be eliminated by the additional information from the reference measurement. In order to ensure in-process capability in various manufacturing processes, the realization of a self-calibration of the measuring system is planned for the future. For this purpose, a three-axis piezo stack is to be used, via which the system can be calibrated before each individual measurement by means of defined, homogeneous displacements. In addition to the calibration, it is thus simultaneously possible to eliminate optical distortions—for example due to misalignments of the measuring system—already during the measurement and to carry out quantitative 3D deformation measurements in running manufacturing processes.
Author Contributions
Conceptualization, A.T.; investigation, A.T.; methodology, D.S. and A.F.; supervision, A.F.; writing—original draft, A.T.; writing—review and editing, D.S. and A.F. All authors have read and agreed to the published version of the manuscript.
Funding
This research was funded by the German Research Foundation (DFG) for subproject C06 ’Surface optical measurement of mechanical working material loads‘ within the Transregional Cooperative Research Center SFB/TRR136.
Institutional Review Board Statement
Not applicable.
Informed Consent Statement
Not applicable.
Data Availability Statement
The data presented in this study are not available.
Acknowledgments
The authors thank Heiner Meyer (SFB/TRR136, subproject C01) and their colleagues from the Leibniz Institute for Materials Engineering IWT for the friendly support during the conduction of the in-process measurements.
Conflicts of Interest
The authors declare no conflict of interest. The founding sponsors had no role in the design of the study; in the collection, analyses, or interpretation of data; in the writing of the manuscript, and in the decision to publish the results.
References
- Field, M.; Kahles, J.F. Review of Surface Integrity of Machined Components. CIRP Ann. Manuf. Technol. 1971, 20, 153–163. [Google Scholar]
- Jawahir, I.S.; Brinksmeier, E.; M’Saoubi, R.; Aspinwall, D.K.; Outeiro, J.C.; Meyer, D.; Umbrello, D.; Jayal, A.D. Surface integrity in material removal processes: Recent advances. CIRP Ann. 2011, 60, 603–626. [Google Scholar] [CrossRef]
- Habschied, M.; de Graaff, B.; Klumpp, A.; Schulze, V. Fertigung und Eigenspannungen. HTM J. Heat Treat. Mater. 2015, 70, 111–121. [Google Scholar] [CrossRef]
- Liang, S.Y.; Su, J.-C. Residual Stress Modeling in Orthogonal Machining. CIRP Ann. 2007, 56, 65–68. [Google Scholar] [CrossRef]
- Lazoglu, I.; Ulutan, D.; Alaca, B.E. An enhanced analytical model for residual stress prediction in machining. CIRP Ann. 2008, 57, 81–84. [Google Scholar] [CrossRef]
- Brinksmeier, E.; Heinzel, C.; Garbrecht, M.; Sölter, J.; Reucher, G. Residual Stresses in High Speed Turning of Thin-Walled Cylindrical Workpieces. Int. J. Autom. Technol. 2011, 5, 313–319. [Google Scholar] [CrossRef]
- Brinksmeier, E.; Klocke, F.; Lucca, D.A.; Sölter, J.; Meyer, D. Process Signatures—A New Approach to Solve the Inverse Surface Integrity Problem in Machining Processes. Procedia CIRP 2014, 13, 429–434. [Google Scholar] [CrossRef] [Green Version]
- Greenwood, G.W.; Johnson, R.H. The deformation of metals under small stresses during phase transformations. Proc. R. Soc. London. Ser. A Math. Phys. Sci. 1965, 283, 403–422. [Google Scholar]
- Parks, V.J. The range of speckle metrology. Exp. Mech. 1980, 20, 181–191. [Google Scholar] [CrossRef]
- Fischer, A. Fundamental uncertainty limit of optical flow velocimetry according to Heisenberg’s uncertainty principle. Appl. Opt. 2016, 55, 8787–8795. [Google Scholar] [CrossRef] [PubMed]
- Tausendfreund, A.; Stöbener, D.; Ströbel, G. In-process measurements of strain fields during grinding. In Proceedings of the 16th International Conference of the European Society for Precision Engineering and Nanotechnology (Euspen), Nottingham, UK, 30 May–3 June 2016; pp. 85–86. [Google Scholar]
- Tausendfreund, A.; Borchers, F.; Kohls, E.; Kuschel, S.; Stöbener, D.; Heinzel, C.; Fischer, A. Investigations on Material Loads during Grinding by Speckle Photography. J. Manuf. Mater. Process. 2018, 2, 71. [Google Scholar] [CrossRef] [Green Version]
- Tausendfreund, A.; Stöbener, D.; Fischer, A. Precise In-Process Strain Measurements for the Investigation of Surface Modification Mechanisms. J. Manuf. Mater. Process. 2018, 2, 9. [Google Scholar] [CrossRef] [Green Version]
- Tausendfreund, A.; Stöbener, D.; Fischer, A. Induction of Highly Dynamic Shock Waves in Machining Processes with Multiple Loads and Short Tool Impacts. Appl. Sci. 2019, 9, 2293. [Google Scholar] [CrossRef] [Green Version]
- Tausendfreund, A.; Stöbener, D.; Fischer, A. In-process workpiece deformation measurements under the rough environments of manufacturing technology. Procedia CIRP 2020, 87, 409–414. [Google Scholar] [CrossRef]
- Khodadad, D.; Singh, A.K.; Pedrini, G.; Sjödahl, M. Full-field 3D deformation measurement: Comparison between speckle phase and displacement evaluation. Appl. Opt. 2016, 55, 7735–7743. [Google Scholar] [CrossRef] [PubMed]
- Fricke-Begemann, T. Optical Measurement of Deformation Fields and Surface Processes with Digital Speckle Correlation. Ph.D. Thesis, University of Oldenburg, Oldenburg, Germany, 2002. [Google Scholar]
- Nobach, H.; Honkanen, M. Two-dimensional Gaussian regression for sub-pixel displacement estimation in particle image velocimetry or particle position estimation in particle tracking velocimetry. Exp. Fluids 2005, 38, 511–515. [Google Scholar] [CrossRef]
- Meyer, H.; Epp, J. In Situ X-ray Diffraction Analysis of Stresses during Deep Rolling of Steel. Quantum Beam Sci. 2018, 2, 11. [Google Scholar] [CrossRef] [Green Version]
- Tausendfreund, A.; Stöbener, D.; Fischer, A. Messung thermomechanischer Beanspruchungen in laufenden Schleifprozessen. tm-Tech. Mess. 2020, 87, 201–209. [Google Scholar] [CrossRef]
Figure 1.
Evaluation principle of speckle photography for the measurement of the two-dimensional in-plane deformation.
Figure 1.
Evaluation principle of speckle photography for the measurement of the two-dimensional in-plane deformation.

Figure 2.
Three-dimensional speckle pattern measured by shifting the camera and illumination system in the ζ-axis (a) and the calculated cross-correlation function of two evaluation windows shifted against each other in the y-direction (b) or in the ζ-direction (c).
Figure 2.
Three-dimensional speckle pattern measured by shifting the camera and illumination system in the ζ-axis (a) and the calculated cross-correlation function of two evaluation windows shifted against each other in the y-direction (b) or in the ζ-direction (c).
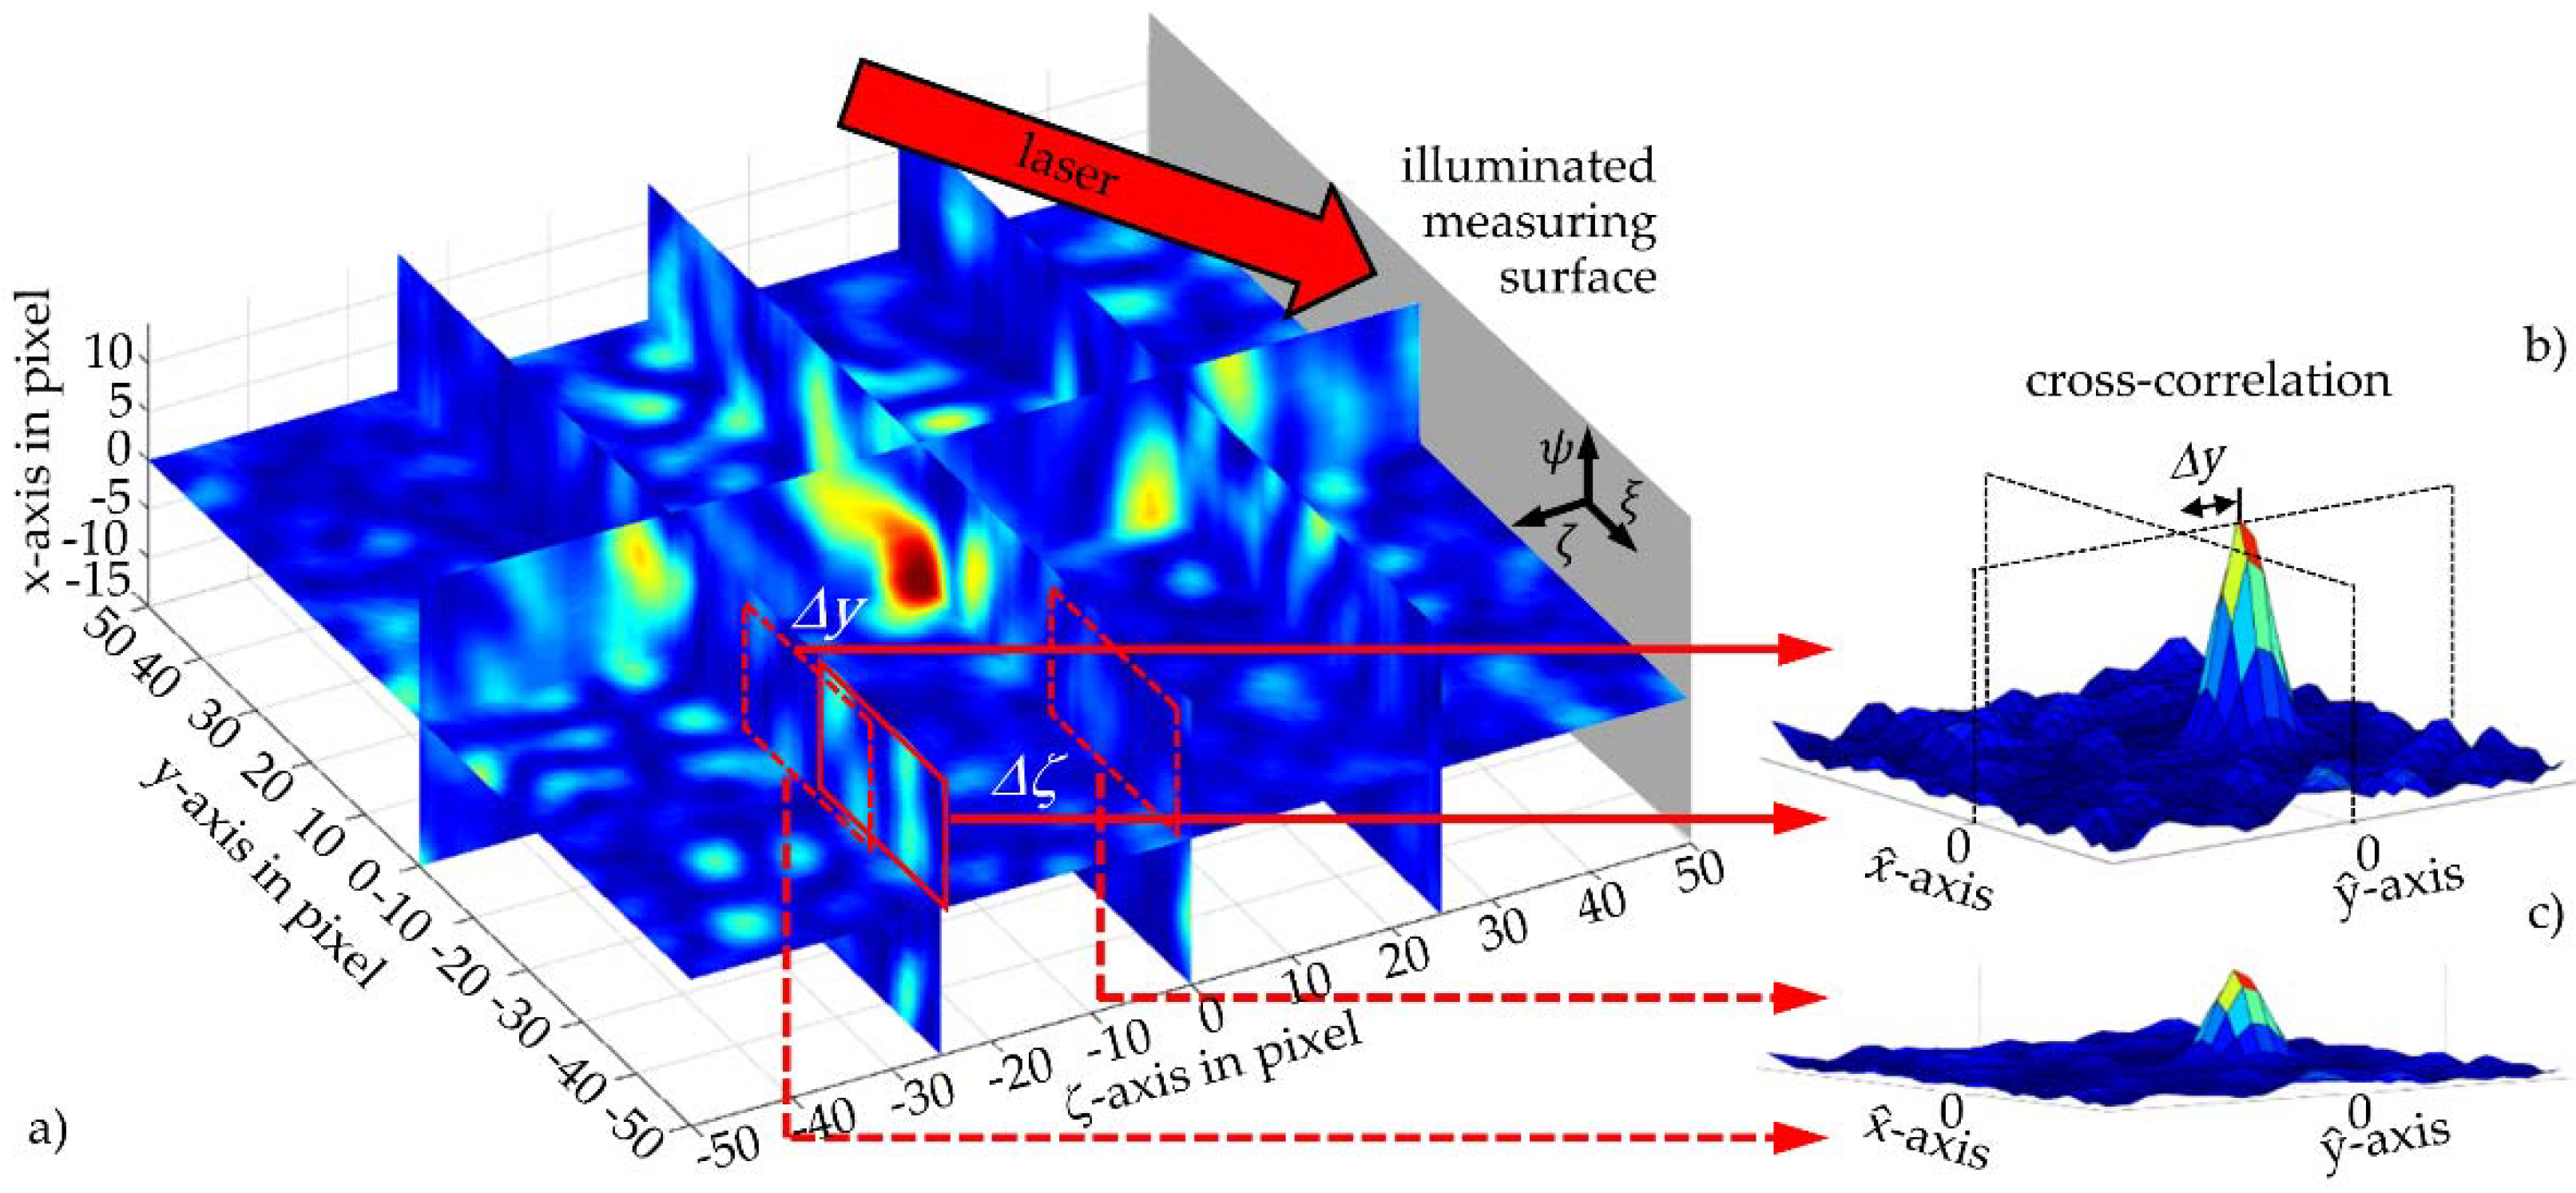
Figure 3.
Power spectra of two speckle patterns for tilted or additional displaced measurement surfaces.
Figure 3.
Power spectra of two speckle patterns for tilted or additional displaced measurement surfaces.
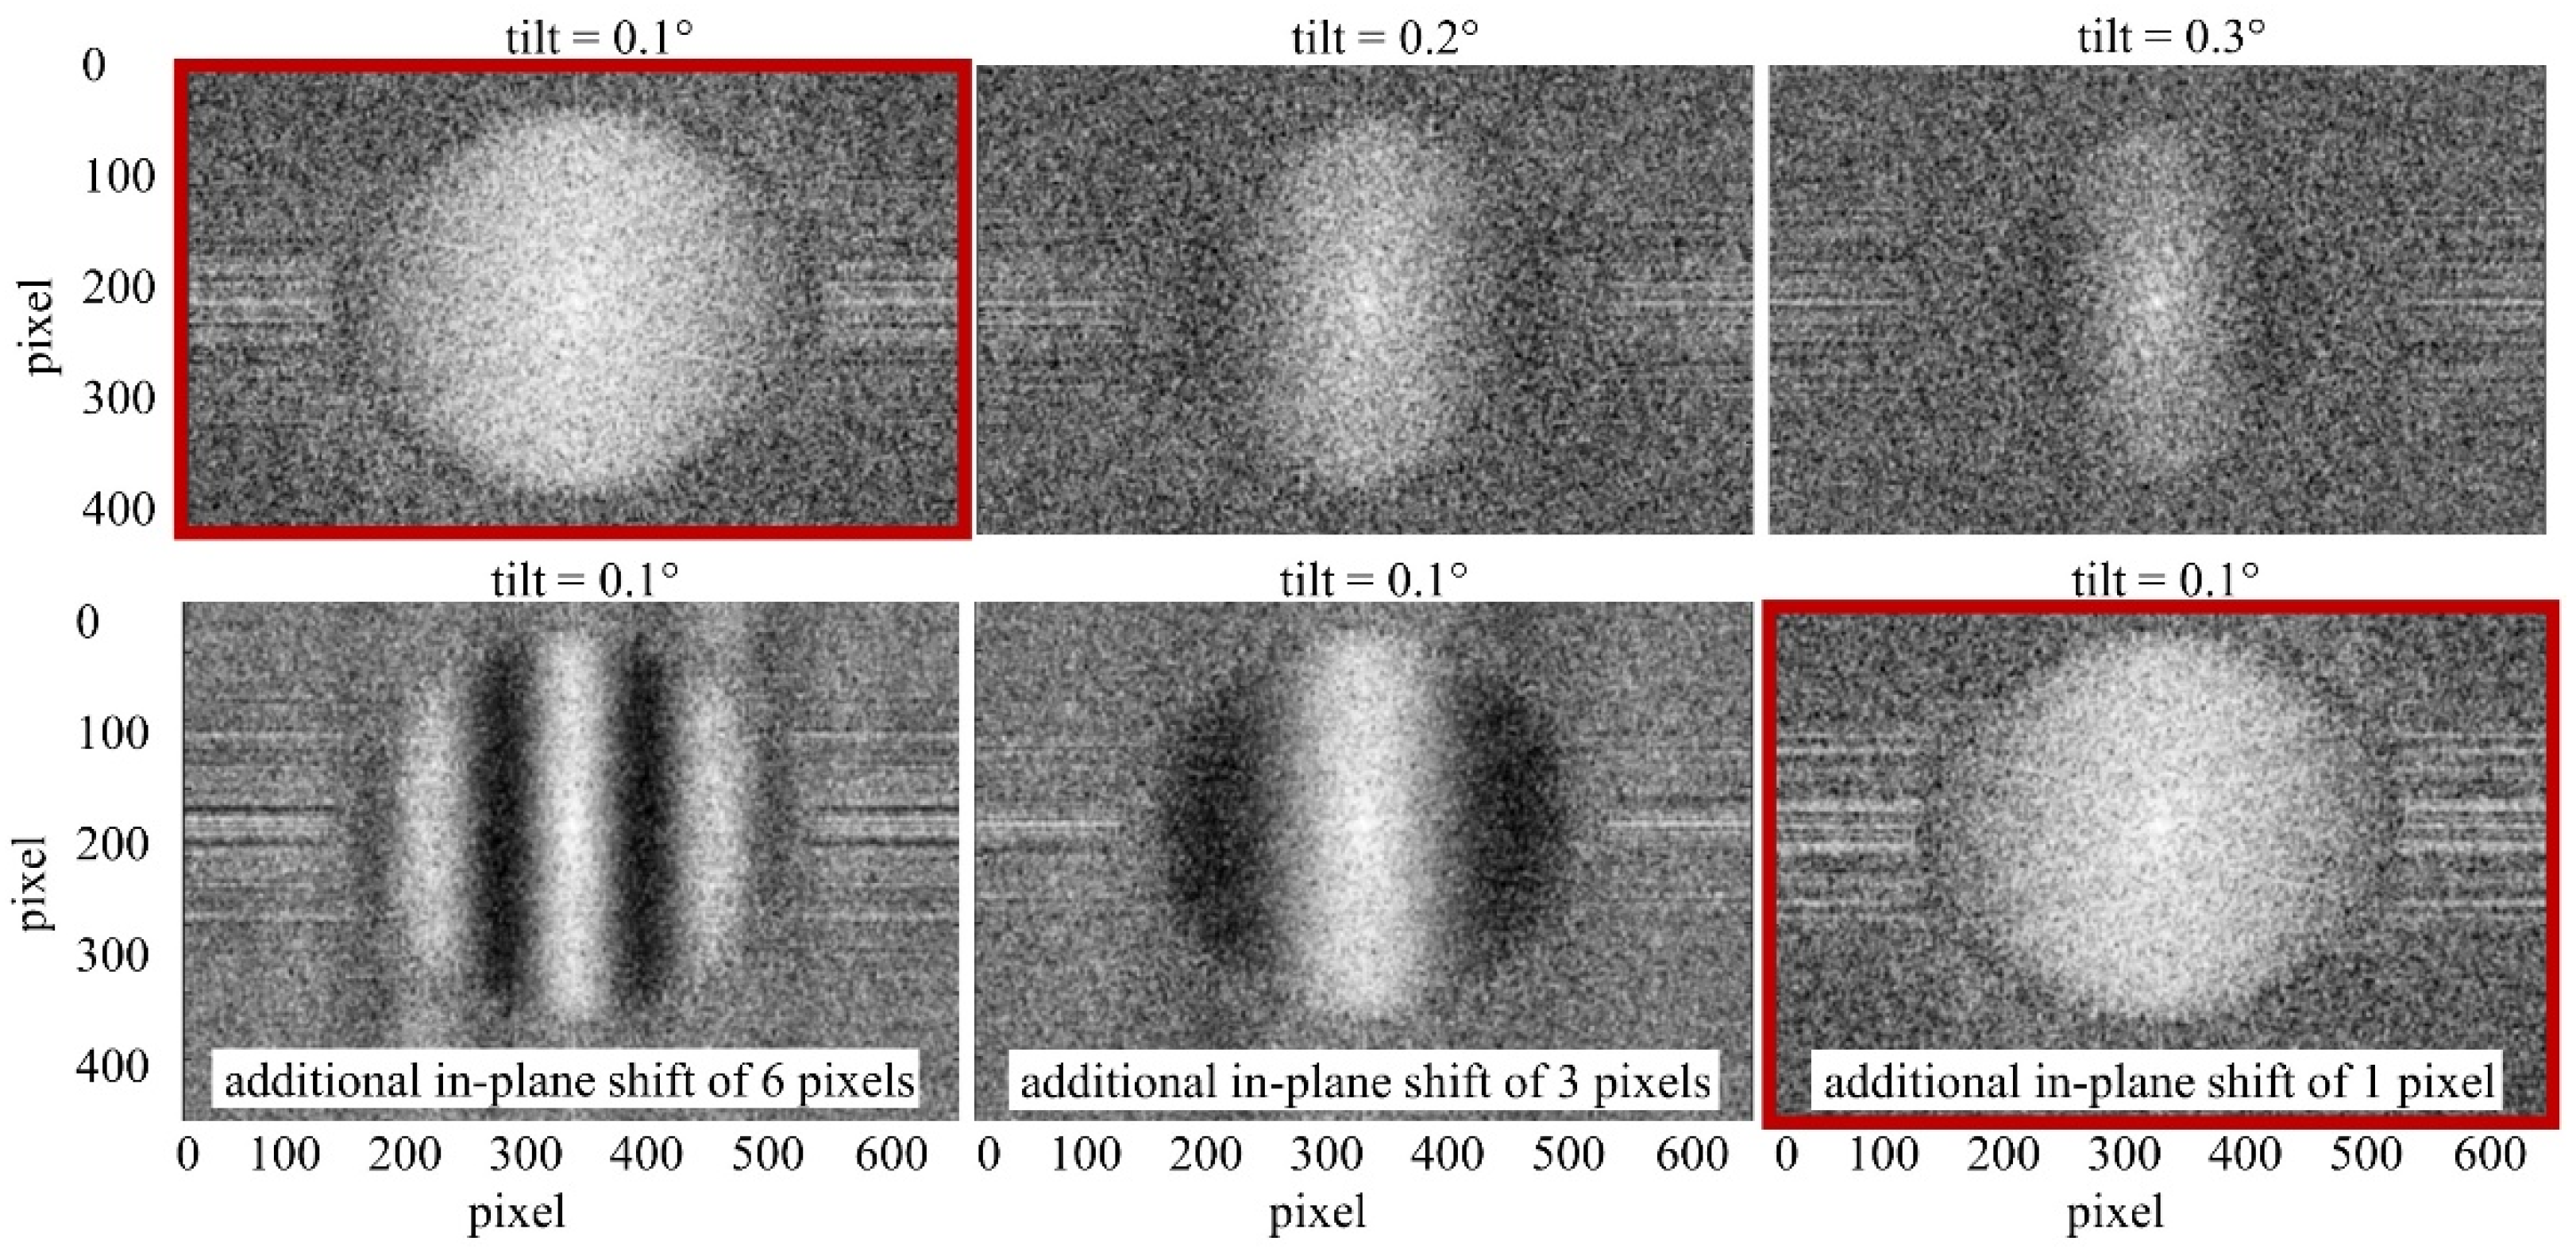
Figure 4.
Speckle-photographic laboratory experiment: (a) laboratory setup with indicated bending of the workpiece sheet over a locating dowel pin (yellow) fixed in the camera system; (b) field of the respective local widths of the correlation functions, at a linear axis displacement of 28 mm.
Figure 4.
Speckle-photographic laboratory experiment: (a) laboratory setup with indicated bending of the workpiece sheet over a locating dowel pin (yellow) fixed in the camera system; (b) field of the respective local widths of the correlation functions, at a linear axis displacement of 28 mm.
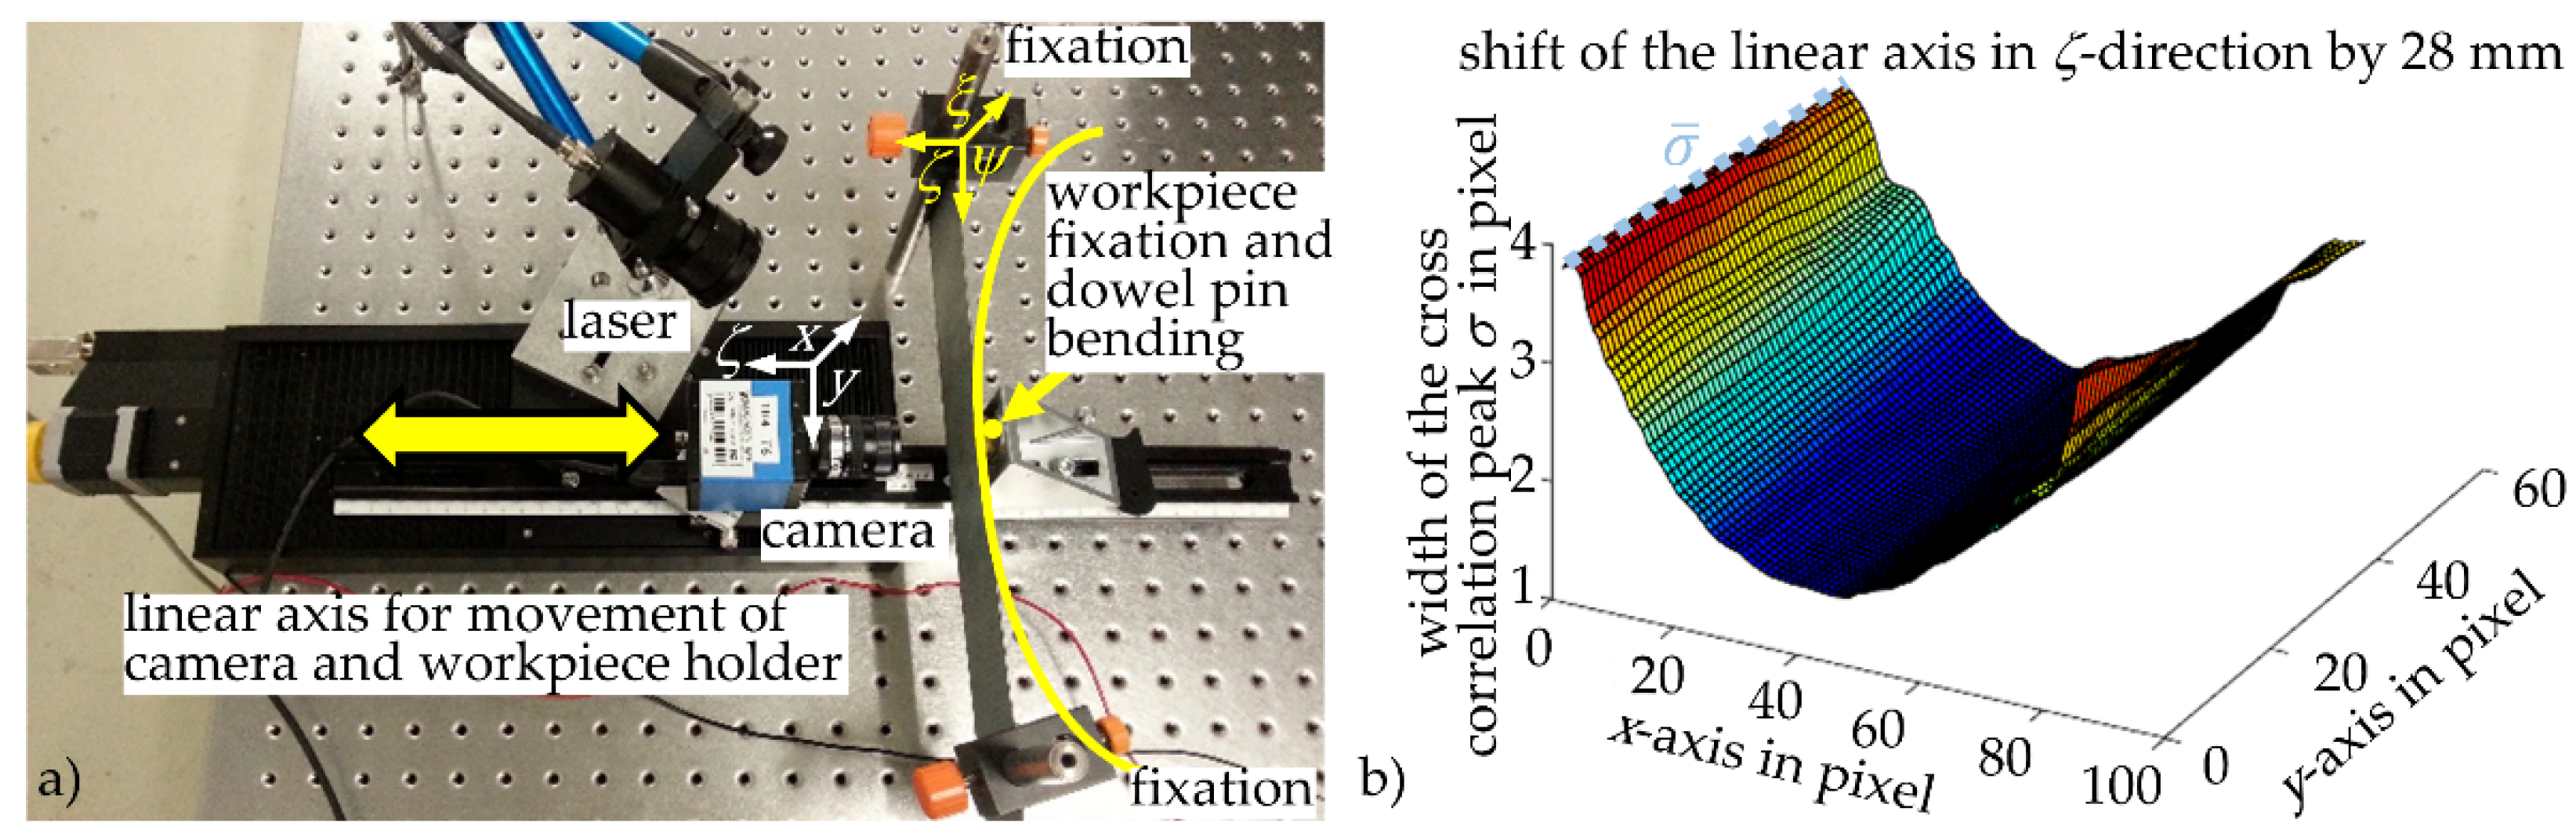
Figure 5.
Linear relationship between the width of the correlation function calculated in the sub-pixel interpolation and the shift of the linear axis in ζ-direction.
Figure 5.
Linear relationship between the width of the correlation function calculated in the sub-pixel interpolation and the shift of the linear axis in ζ-direction.
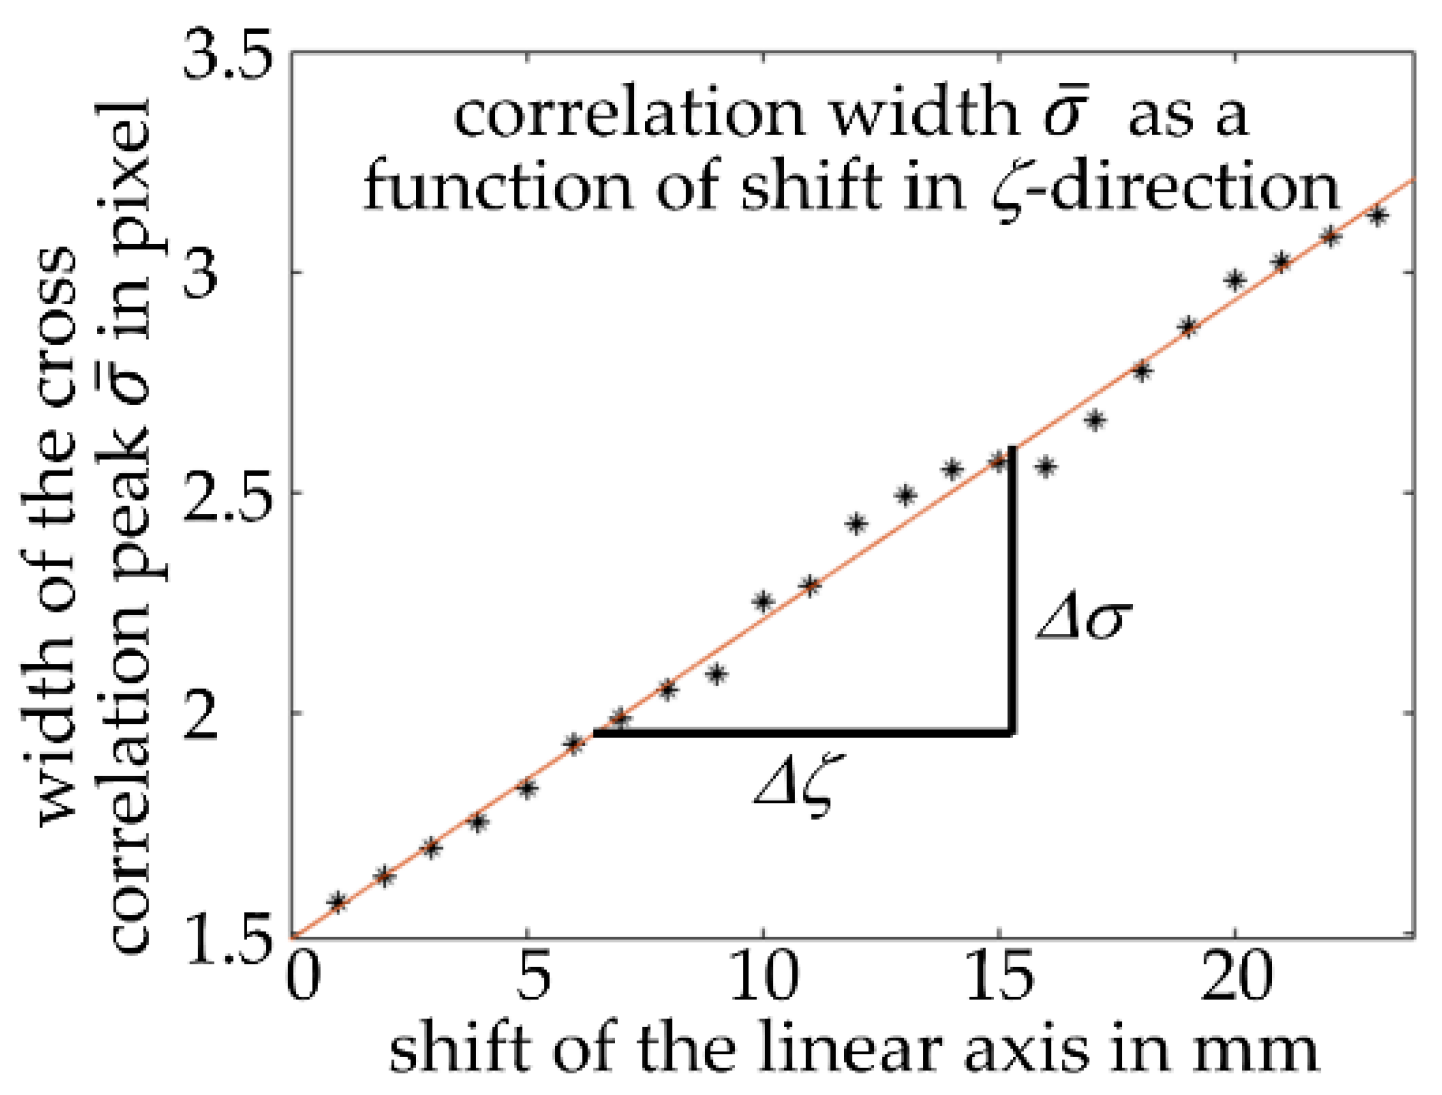
Figure 6.
Test setup for deep rolling: Basic measurement setup (a) and practical implementation with enlarged view from the opposite ζ-direction to the camera (b).
Figure 6.
Test setup for deep rolling: Basic measurement setup (a) and practical implementation with enlarged view from the opposite ζ-direction to the camera (b).
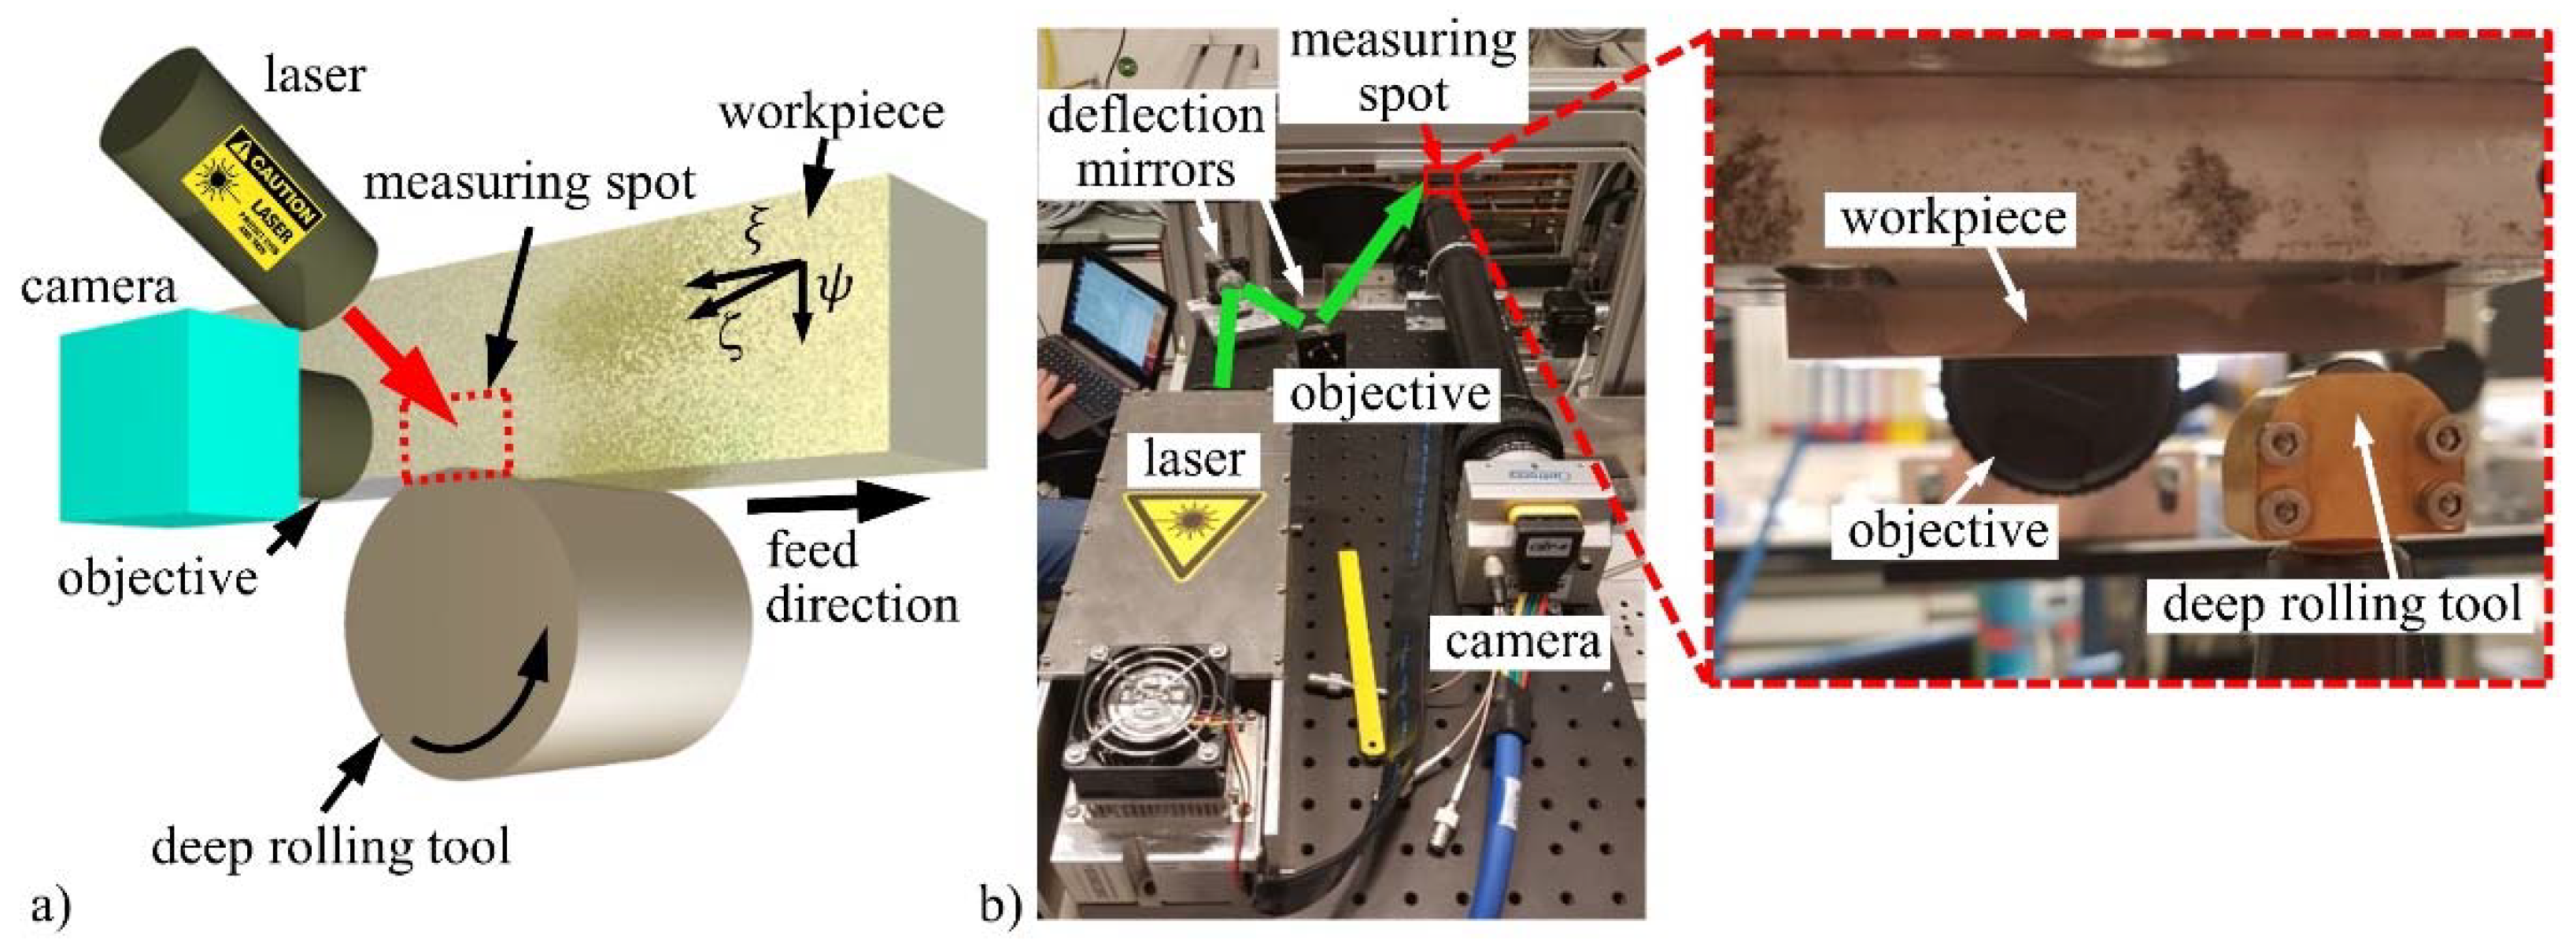
Figure 7.
In-process measurement in the deep rolling process: The occurring shifts in ξ-direction (a) and Ψ-direction (b) as well as the reduction of the calculated width of the correlation function resulting from the out-of-plane shift as a value for the ζ-shift (c) are shown.
Figure 7.
In-process measurement in the deep rolling process: The occurring shifts in ξ-direction (a) and Ψ-direction (b) as well as the reduction of the calculated width of the correlation function resulting from the out-of-plane shift as a value for the ζ-shift (c) are shown.
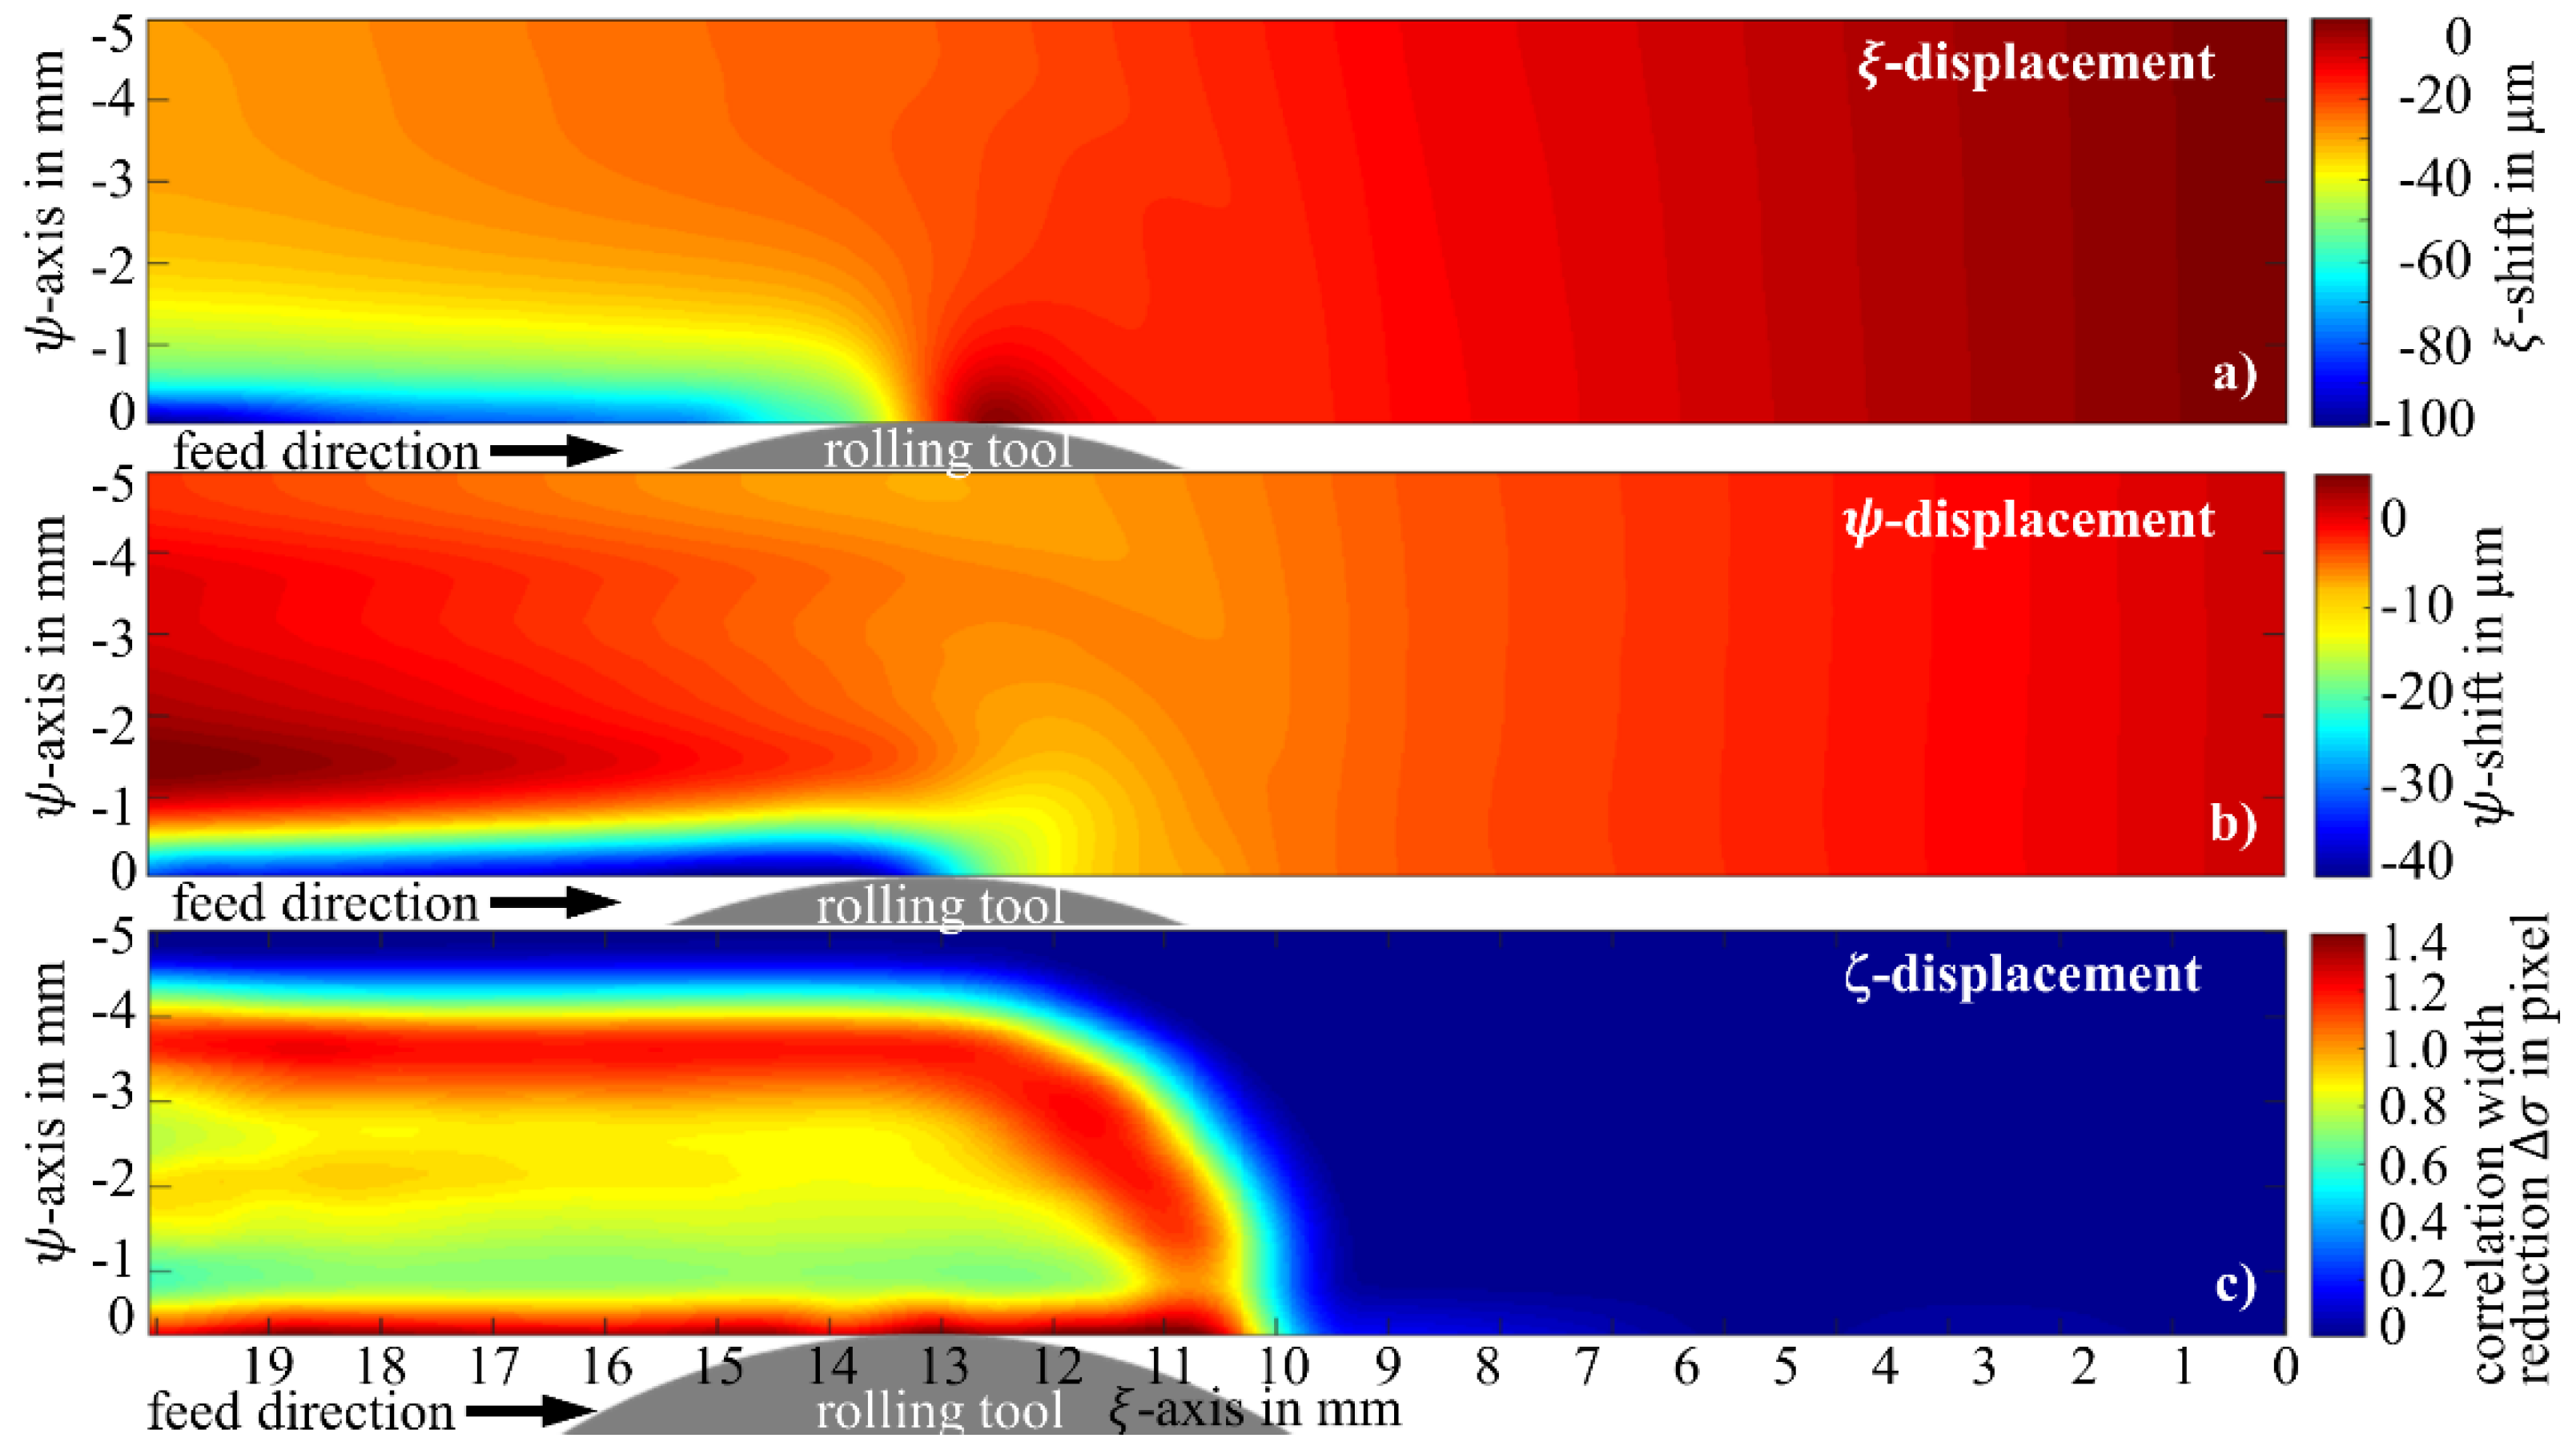
Figure 8.
3D deformation measurement in the deep rolling process. (a) Tactilely measured burr; (b) width of the correlation function as a function of the out-of-plane displacement of the burr; (c) speckle-photographically measured deformation field in the ζ-direction after calibration.
Figure 8.
3D deformation measurement in the deep rolling process. (a) Tactilely measured burr; (b) width of the correlation function as a function of the out-of-plane displacement of the burr; (c) speckle-photographically measured deformation field in the ζ-direction after calibration.
Publisher’s Note: MDPI stays neutral with regard to jurisdictional claims in published maps and institutional affiliations. |
© 2021 by the authors. Licensee MDPI, Basel, Switzerland. This article is an open access article distributed under the terms and conditions of the Creative Commons Attribution (CC BY) license (https://creativecommons.org/licenses/by/4.0/).
Share and Cite
MDPI and ACS Style
Tausendfreund, A.; Stöbener, D.; Fischer, A. In-Process Measurement of Three-Dimensional Deformations Based on Speckle Photography. Appl. Sci. 2021, 11, 4981. https://doi.org/10.3390/app11114981
AMA Style
Tausendfreund A, Stöbener D, Fischer A. In-Process Measurement of Three-Dimensional Deformations Based on Speckle Photography. Applied Sciences. 2021; 11(11):4981. https://doi.org/10.3390/app11114981
Chicago/Turabian StyleTausendfreund, Andreas, Dirk Stöbener, and Andreas Fischer. 2021. "In-Process Measurement of Three-Dimensional Deformations Based on Speckle Photography" Applied Sciences 11, no. 11: 4981. https://doi.org/10.3390/app11114981
Note that from the first issue of 2016, this journal uses article numbers instead of page numbers. See further details here.