Article

Chemotaxis Model for Drug Delivery Using Turing’s Instability and Non-Linear Diffusion

1
Department of Biomedical Technology, College of Applied Medical Sciences, King Saud University, P.O. Box 10219, Riyadh 11433, Saudi Arabia
2
College of Engineering and Technology, American University of the Middle East, Egaila 54200, Kuwait
3
École Centrale de Nantes, LMJL UMR6629 CNRS 1, Rue de la Noë, 44321 Nantes, France
*
Authors to whom correspondence should be addressed.
Appl. Sci. 2021, 11(11), 4979; https://doi.org/10.3390/app11114979
Submission received: 1 April 2021 / Revised: 25 May 2021 / Accepted: 26 May 2021 / Published: 28 May 2021
(This article belongs to the Section Applied Biosciences and Bioengineering)

Abstract

:

Featured Application

this work has a potential application in several domains especially in the field of drug delivery control and optimization for nanomedicine.

Abstract

This paper is devoted to the study of the chemotaxis model for drug delivery purposes. The pattern formation for a volume-filling with nonlinear diffusive terms is investigated. The proposed mathematical model is governed by a reaction–diffusion system modeling the interaction between the cell density and the concentration of the chemoattractant. We investigate the pattern formation for the model using Turing’s principle and linear stability analysis. An asymptotic expansion is used to linearize the nonlinear diffusive terms. Next, we introduce an implicit finite volume scheme; it is presented on a triangular mesh satisfying the orthogonality condition. Finally, numerical results showing the formation of the spatial pattern for the chemotaxis model are presented and analyzed. The results demonstrate promising progress in understanding the process of controlling and designing targeted drug delivery.

1. Introduction

In many societies, cancer is the leading cause of death and a serious health burden. Different anticancer and chemotherapy medicines have been created to combat these risky diseases [1]. The majority of chemotherapy drugs do not have a selective effect on cancer cells and can destroy healthy cells as well. As a result, supplying the medication directly to the tumor without affecting healthy tissues is a significant obstacle in cancer care [2,3].
Various attempts, such as “smart drug delivery” using nano/submicron droplets [4], have been made to resolve this problem. Researchers looking into smart drug distribution are having trouble figuring out how to get the drug to the right place at the right time.
Drug delivery is one of the most focused research areas for treating such complex diseases as cancerous tumors in various body organs such as the brain, breast, lungs, kidney, and heart.
Nanoparticles such as iron oxide are used in nanomedicine to diagnose and treat diseases, and MRI imaging with iron oxide was recently used to track drug delivery in mice. Bacteria were used to transport drugs to tumor sites [5], with chemoattractant gradients controlling the transport path.
Chemotaxis is a basic cell and organism guidance system that attracts microbes to sustenance, immune cells to infection sites. The Patlak–Keller–Segel (PKS) method is a good choice for modelers and analysts alike, and it is a portion of the capstone of biological modeling. Chemotaxis is the tendency of cells and living organisms to move in response to an external stimulus in their environment. Due to its critical function in cancer metastasis, embryogenesis, cell growth, inflammation, and wound healing [6], chemotaxis has been extensively studied in the last two decades [7,8].
Macrophages are known to migrate to areas of inflammation, which are typically where hypoxic tumors are found. In [9], a mathematical model of macrophage migration toward hypoxic tumor sites is suggested as a drug delivery vehicle. To demonstrate macrophage penetration into tumors, the authors propose a rough modeling process. They also look into the action and development of chemotaxis and chemokines, as well as the efficacy of drug-loaded macrophages for drug delivery. A growing avascular tumor spheroid serves as the basis for the model.
Chemotaxis is a subset of the reaction–diffusion systems method. Through self-organizing/pattern formation, reaction–diffusion systems create a wide range of spatiotemporal patterns, including propagating circular, spiral, and periodic waves. For the first time, such spatiotemporal patterns are observed in the Belousov–Zhabotinsky reaction system [10]. A standard model for explaining the pattern-forming mechanism is the reaction–diffusion system. Indeed, Alan Turing developed in his seminal paper [11] the idea that chemicals can react and diffuse in such a way that they create steady-state nonhomogeneous spatial patterns of chemical concentrations under certain conditions. Although a diffusion process generally brings uniform distribution of a substance, the scenario of Turing presents a non-uniform pattern as a stationary state in a reaction–diffusion system.
We can find a wide variety of reaction–diffusion systems in the fields of physics, chemistry, and biology [12]. One of the most popular reaction–diffusion systems is the chemotaxis model.
Chemotaxis is the feature movement of a cell along a chemical concentration gradient either toward the chemical stimulus, in which case the chemical is called chemoattractant, or away from the chemical stimulus, in which case the chemical is called chemo-repellent.
Theoretical and mathematical modeling of chemotaxis dates to the pioneering work of Patlak in the 1950s [13] and Keller and Segel in the 1970s [14,15].
The review article by Horstmann [16] provides a detailed introduction into the mathematics of the Keller–Segel (KS) model for chemotaxis. The general form of the Keller–Segel model in which we are interested is given by the system
t u = · D u u u χ u , v v + f   u , v , t v = D v v + g   u , v                                                                                      
In the above model, u denotes the cell density on a given bounded domain R 2 for a time t   0 ,   T   , T > 0 , and v describes the concentration of the chemoattractant. D u denotes the diffusivity of the cells (sometimes also called motility), while χ   u ,   v stands for the chemo-sensitivity; however, the coefficient D v represents the diffusivity of the chemicals. The function f   u ,   v describes cell growth and cell death, while g   u ,   v describes production and degradation of the chemoattractant. A key property of the above equations is their ability to give rise to spatial pattern formation when the chemical signal v acts as an auto-attractant, that is, when cells both produce and migrate up gradients of the chemical signal. The Keller–Segel model (1) is studied by many authors, e.g., see the review articles of Horstmann [16,17] and the paper [18]. From a numerical point of view, we motion that authors in [19] analyzed a finite volume method for the Keller–Segel model (1).
In this paper, we are interested in a squeezing probability modeling the elasticity feature of the cell, we study the pattern formation for the corresponding volume-filling chemotaxis model with nonlinear diffusive terms, and finally, we investigate numerically the generation of spatial patterns in a 2-D bounded domain.

2. Materials and Methods

2.1. Volume-Filling Chemotaxis Model

In this section, we consider the volume-filling chemotaxis model (1) for which we introduce the squeezing probability q of a cell finding space at its neighboring location. q is a non-increasing function concerning the cell density u , and also, it is nonlinear greater than the linear one that corresponds to the interpretation that the cells are solid blocks [8,20,21] and equals to zero when the maximum number of cells exceeds a certain number u ¯ .
The number u ¯ represents the total number of cells that can be accommodated at any site, also called the crowding capacity. We take the squeezing probability q reflecting the elasticity characteristic of the cells according to positive parameter γ , introduced in [22]:
q u   =   1 u u ¯ γ ,     0   u u   ¯ ,     0               ,                               u > u ¯ .                                            
In the following, the diffusion term and the cross-diffusion are given by
D u   = d 1 q u q u u   ;                                       χ u , v   = q u χ v   ;
where q is the squeezing probability for the cell finding space defined in (2), and d 1   is the diffusion coefficient. In the sequel, for the simplicity, we take d 2 = D v . Substituting these coefficients into system (1), we obtain
t u = . d 1 q u q u u u u q u χ u υ + f u , v t v = d 2 Δ υ + g u , v ,                                                                                                    
with zero flux boundary conditions on Σ T = × 0 ,   T
d 1 q u q u u u · n = 0 ,                     v · n = 0 ,                                                                                                                            
where n is the unit normal vector at the boundary and outward to . We assume that the initial conditions are non-negative, for all x
u x , 0   = u 0 x   0 ,   v x , 0   = v 0   x   0 .
Under realistic assumptions on the functions f , g , and q , the existence of global bounded classical solutions of system (3) object to the boundary conditions (4) that has been established in [22] by the maximum principle and Amman’s theory [23].

2.2. Pattern Formation

Pattern formation in mathematics is the process that, by changing a bifurcation parameter, the spatially homogeneous steady states lose stability due to spatially inhomogeneous perturbations, and stable inhomogeneous solutions arise.
In this section, we are interested in the pattern formation for the system (3) and (4). We derive here the necessary conditions for diffusion-driven instability (also called Turing instability) of the steady-state and the initiation of spatial pattern for the above-mentioned system. We look for the spatially homogeneous steady states by setting the kinetics on the right-hand side of Equation (3) to be zero:
f u , v   = 0 ,                   g u , v   = 0 .                                                        
We use the same technique as Murray [12,24]. We suppose that u s ,   v s is a positive solution of Equation (5); where u s ,   v s is a steady state of the system
t u = f u ,   v ,                   t v = g u ,   v .                                                        
We set
W =   u u s v v s                                                      
and the linearized system leads to
t W = A W ;               A = f u f v g u g v u s , v s .
where A is the stability matrix (i.e., the Jacobian matrix of system (6) at the steady state u s ,   v s .
From now on, we take the derivatives of f and g to be evaluated at the steady state u s ,   v s unless stated otherwise. Therefore, the conditions for which the steady state   u s ,   v s is linearly stable; that is, Re λ < 0, where λ is the eigenvalue of the matrix A, is guaranteed if
tr A   = f u + g v < 0 ,                   A   = f u g v f v g u > 0 .                                                        
Now, we consider the full chemotaxis model (3). We examine a small perturbation from the homogeneous steady state u s ,   v s of the form
u = u s + ε u ˜ x ,   t ,                   v = v s + ε v ˜ x ,   t ,                                                                            
where ε 1 is a small parameter strictly positive. f   is a smooth function, then using an asymptotic expansion we obtain
f u s + ε u ˜ ,   v s + ε v ˜   = f u s , v s   +   ε u ˜ f u u s , v s   +   ε v ˜ f v u s , v s   +   o ε 2
The system (3) transforms into the linearized system in (9) after performing the following steps:
t u = d 1 q u s     q u s u s u                                                                                                                                                                     u s q u s χ v s v + u f u + v f v , t u = d 2 v + u g u + v g v                                                                                                                                  
  • Asymptotic expansion for the functions g ,   q , and χ around u s ,   v s ;
  • Taking into account Equation (5);
  • Equating first-order terms with respect to ε ;
  • Neglecting higher-order terms, and dropping the tilde for the convenience.
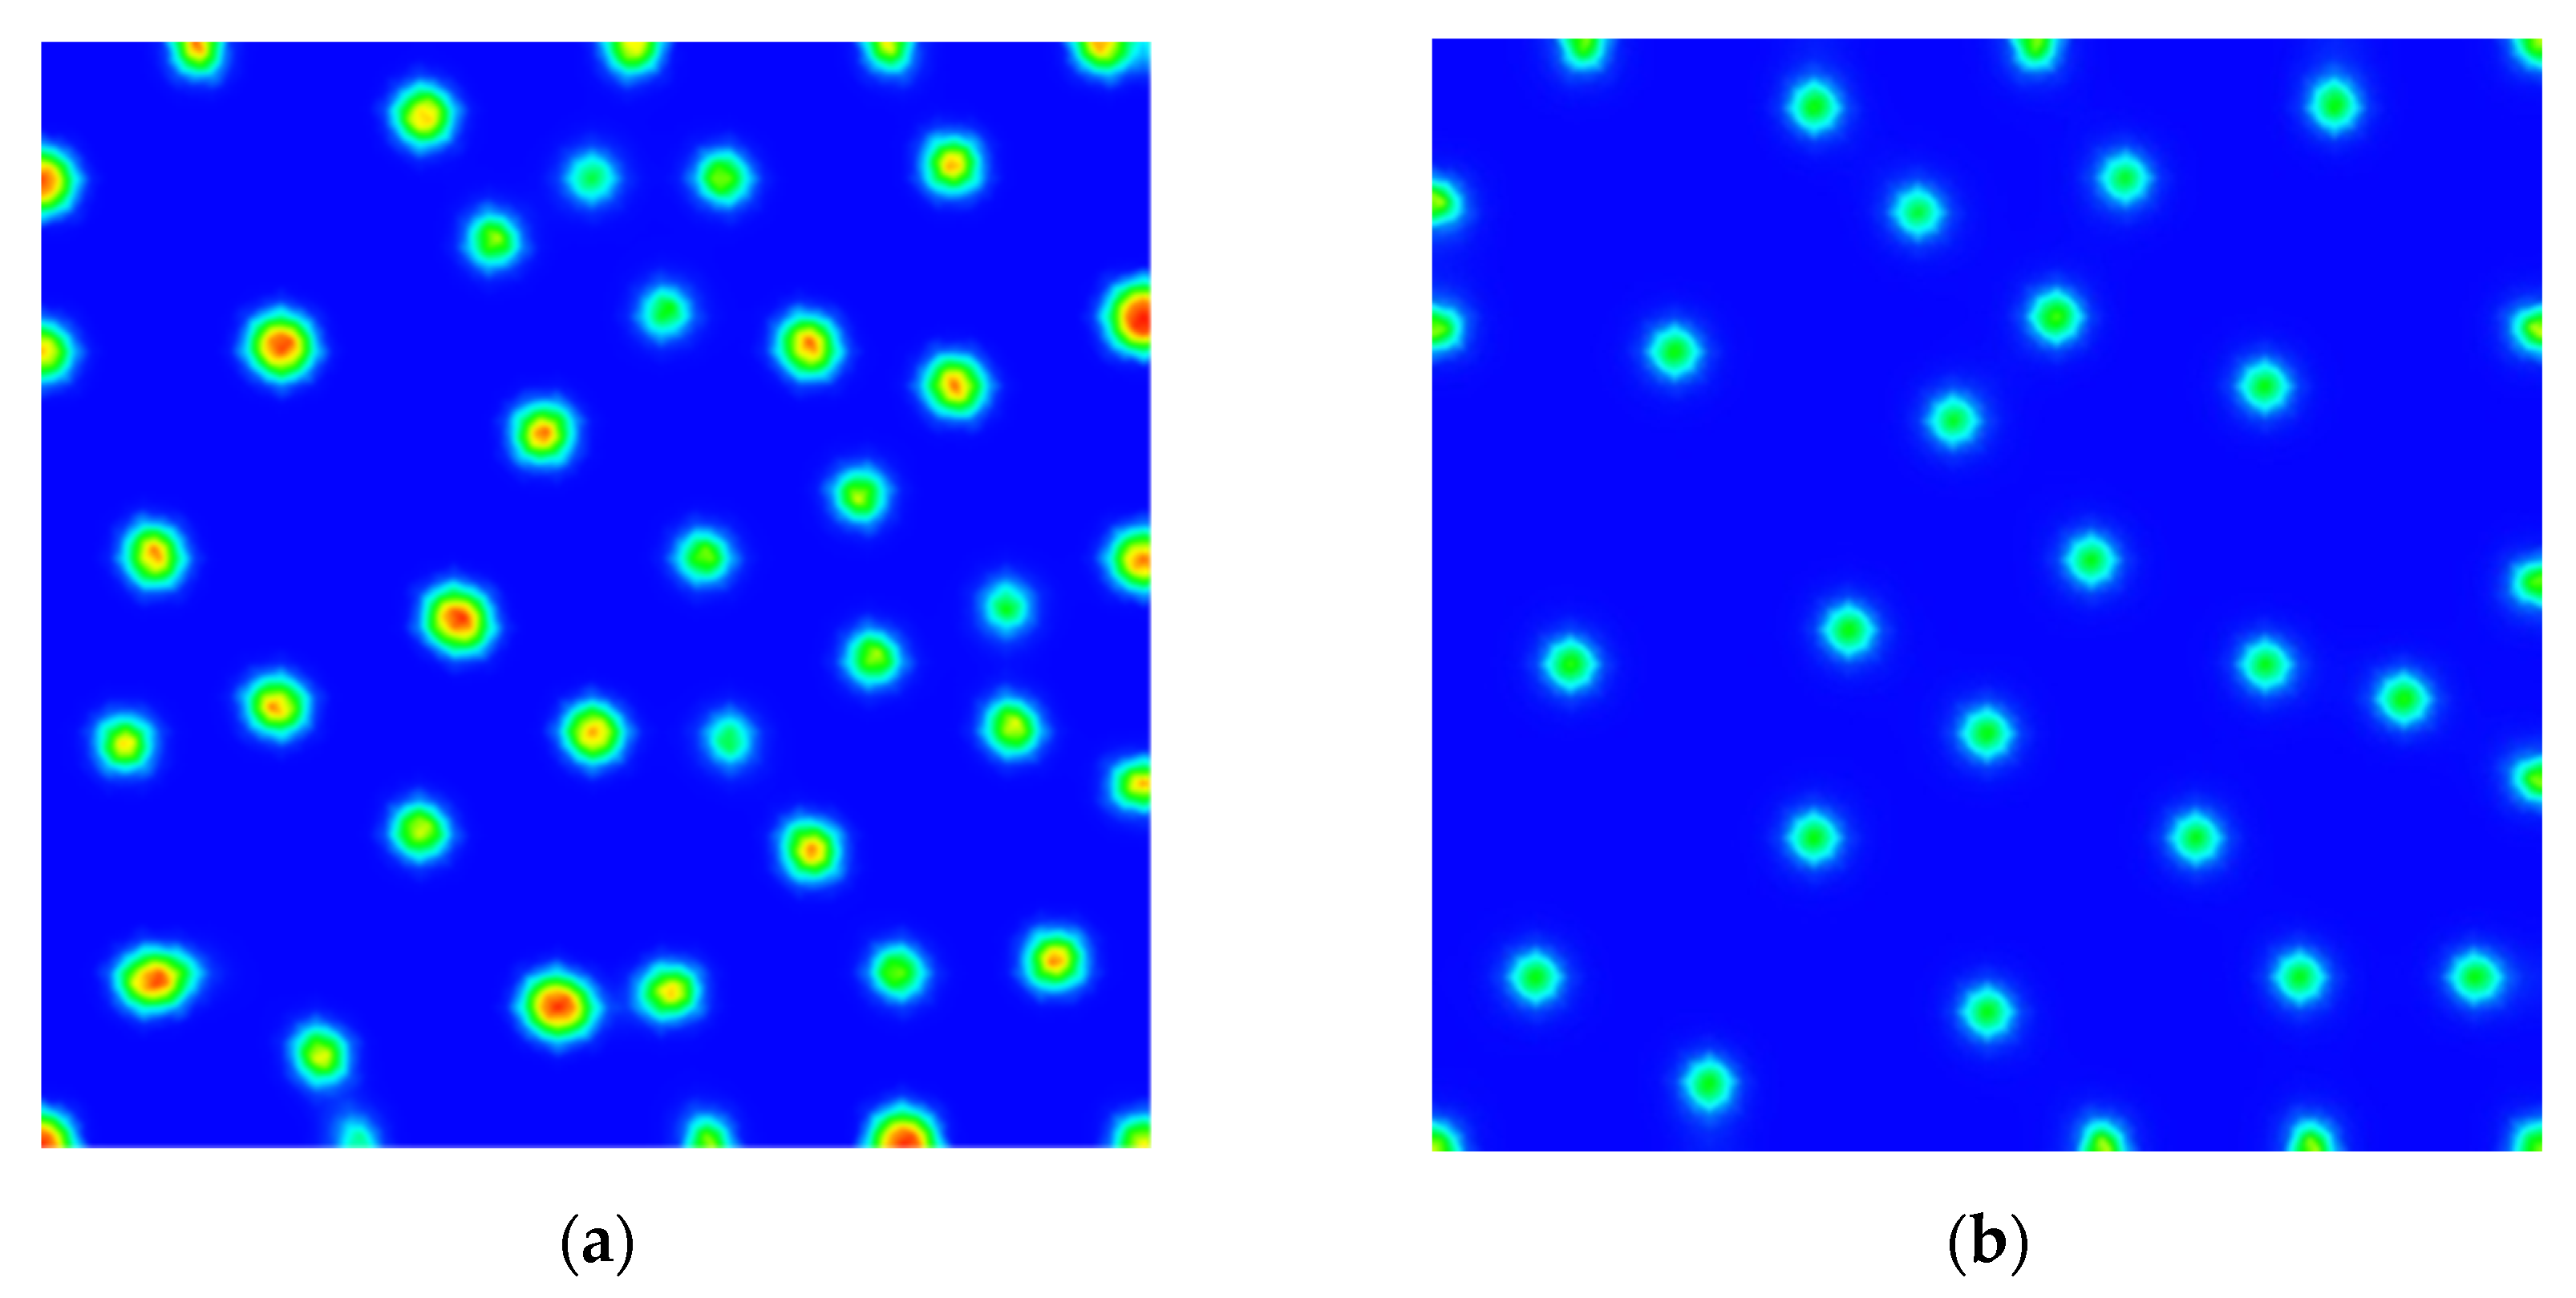
For simplicity, we denote by ζ s = q u s     q u s u s , ψ s = u s q u s   χ v s and by χ s = χ v s with the given functions in (14), one can deduce that ζ s > 0 and ψ s < 0 . In what follows, we perform the standard argument (e.g., [24], Chapter II). We obtain the dispersion relation associated with system (9)
λ 2 + a k 2 λ + b k 2   = 0 ,                                                                            
where a = a k 2 and b = b k 2 are two functions given by
a k 2   =   s d 1 + d 2 k 2 f u + g v ;                                                                                                           b k 2   = ζ s d 1 d 2 k 4 + ψ s g u d 2 f u ζ s d 1 g v k 2 + f u   g v f v   g u .
For the steady state to be unstable to spatial perturbations, we require Re λ > 0 for some k 0 . We remark that the sum of the eigenvalues is strictly negative since the function a k 2 is strictly positive due to the conditions (7). Thus, the instability can only happen if b k 2 becomes negative for some k     0 , i.e., the dispersion relation (10) has two roots with opposite signs. Carrying the function b k 2 , then the last condition requires that equation (11) be negative.
ζ s d 1 d 2 k 4 +   ψ s g u d 2 f u   ζ s d 1 g v k 2 + f u   g v f v   g u < 0 ,                    
Since we required that the determinant A   = f u g v f v g u > 0 from the conditions (7), the only possibility for inequality (11) to hold, is that the sum of the roots is positive. That leads to Equation (12)
                                                ψ s g u d 2 f u ζ s d 1 g v < 0 ,                                                                                            
Referring to the condition (11), and since ζ s d 1 d 2 is positive, it is necessary that the discriminant of b k 2 = 0 be positive. The discriminant of b k 2 is represented by the following equation:
ψ s g u d 2 f u ζ s d 1 g v 2 4 ζ s d 1 d 2 f u   g v f v   g u < 0 ,                              
Applying inequality (12), we obtain from this inequality that
ψ s g u d 2 f u ζ s d 1 g v < 2 ζ s d 1 d 2 f u   g v f v   g u .
In this paper we take specific functions in system (3), where f represents the cell density kinetics, the logistic growth, while g represents the chemo-attractant kinetics. A linear function depending on each of the variables u and v represents the chemoattractant growth with rate ν and the decay with rate δ due to dilution. They are given by the form
f u , v   = μ u 1 u u c ,                 g u , v   = ν u δ v                                                                        
Applying the same pattern formation analysis as before and for specific functions (14), we obtain the only necessary condition in Equation (15) for the generation of spatial patterns:
μ d 2 + δ D u c     χ v φ u c <   2 d 2 μ δ D u c                                                                                  
where φ u = u q u . In the sequel of this section, we investigate the range of unstable wave numbers for which, in addition to condition (15), we can expect pattern formation for system (3). To do this, we study the bifurcation with the chemo-sensitivity χ , the growth rate ν , and the decay rate δ of the chemoattractant. For the bifurcation parameter χ , we compute the bifurcation value χ c , and we obtain the following:
χ c = 2 d 2 μ δ D u c + μ d 2 + δ D u c v φ u c                                                                                    
Furthermore, the range of unstable wave numbers k 1 2 < k 2 < k 2 2 is obtained from the zeros of the equation b k 2   = 0 , and k 1 2   and   k 2 2 are defined as follows:
k 1 2 = S S 2 4 μ d 2   δ D u c 2 ε d 1 d 2 < k 2 < S + S 2 4 μ d 2   δ D u c 2 ε d 1 d 2 = k 2 2 ,
where S = μ d 2 δ D u c   +   χ v φ u c .
Figure 1 shows how the eigenvalue l varies as a function of k 2 for various χ . By analyzing this figure, we can deduce that the pattern formation can be expected when the values of χ exceed the critical values χ c , since there exists a range of wave numbers k 1 2 < k 2 < k 2 2 when the dispersion relation (10) passes through the critical values χ c .
Performing the same analysis as for the bifurcation parameter χ , we obtain evidence that that the pattern formation can also be supported by increasing the value of v above the critical value ν c or by decreasing the value of δ below the critical value δ c .

3. Results

Numerical Scheme and Simulations

In this section, we use a finite volume scheme to discretize system (3). Following [19], assuming that is an open bounded polygonal domain for which we consider an admissible mesh consisting of a triplet T   ,   E   ,   P   , where T is a family of disjoint open polygonal convex subsets of called control volumes, E is a family of subsets of   Ω ¯   containing the edges of the control volumes, and P is a family of points of satisfying the orthogonality condition; that is, the line segment joining the centers of two neighboring control volumes is orthogonal to the interface between these control volumes (see, e.g., [25]). We give some notations on the mesh:
The set of neighbors of K is denoted by N K , which is N K   = { L   T |   σ   E K ,     σ ¯   = K ¯ L ¯ } , where E K is the subset of E containing the edges of K . We denote by ƞ K , L   the unit normal vector to σ K , L = K ¯ L ¯ outward to K .
Integrating the equations of system (3) over each control volume K , and using the Green–Gauss formula, one can deduce the following discretization for system (3) for all K T :
U K 0 = 1 K   K u 0 x d x ,     V K 0 = 1 K   K v 0 x d x ,                                                    
for all K T and n   0 , , N :
K U K n + 1 U K n t L N K σ K , L d K , L A U L n + 1 A U K n + 1 + L N K G U K n + 1 ; U L n + 1 ; d V K , L n + 1                                                                                                       = K f U K n + 1 K V K n + 1 V K n t d 2 L N K σ K , L d K , L V L n + 1 V K n + 1   = K ν U K n δ V K n + 1                              
With the discrete unknowns U = U K n + 1 K T   and   V = V K n + 1 K T ,   n 0 , , N .   d V L , K n + 1 = σ K , L d K , L U L n + 1 U K n + 1 . The function A stands to a differentiable function defined by A u = 0 u D r d r   , while the function G is a numerical convection flux function defined by
G a , b ; c = c + Φ a + Φ b c Φ a + Φ b ,
where c + = max c , 0 ) ,   c = max c , 0 ,   and   Φ = χ ϕ ( u . Φ represents the nonincreasing part of Φ , and Φ represents the nondecreasing part of Φ . We refer to [19] for details about the convergence analysis of the discretized problem (17) and (18).
In the next section, we show the numerical simulations of the model (3) in two-dimensional space to illustrate our experimental results and to demonstrate the patterns generated by the system. The Newton algorithm is used to approach the solution of the nonlinear system defined by the first Equation of (18). This algorithm is coupled with a bigradient method to solve linear systems arising from the Newton algorithm process. The simulation of the model is applied in two-dimensional domain   = 0 ,   10   ×   0 ,   10 for which a non-uniform admissible grid is considered. The following data are considered for the numerical test: d 1 = 0.1 , d 2 = 1.0 , u c = 0.25 , u ¯ = 1.0 , μ = 0.5 , ν = 10.0 , δ = 10.0 , χ = 20 , and γ = 2 .
Further, our experimental simulation considers a small time step Δ t = 0.05 , and the numerical flux G is defined by Equation (19); we consider   Φ = Φ min z , u m and Φ = Φ max z , u m Φ u m , where u m = u ¯ γ + 1 γ . The aforementioned parameters yield to the homogeneous steady state, u s ,   v s   =   0.25 ,   0.25 , and to the range of unstable wave numbers 0.11 < k 2 < 426.36 .
Initially the cell density is located with as a small random perturbation around the homogeneous steady state; in our test, we take u   0 ,   x ,   y   = u s + rand 0 ,   1 . Meanwhile, for the chemoattractant, we take v 0 ,   x ,   y   = v s . Figure 2 shows the plot of the initial condition for the cell density distribution; the red regions correspond to the highest cell density so the cells are aggregated into a “random” distribution. A zero-flux boundary condition is imposed for the boundary conditions.
Figure 3 and Figure 4 show the evolution of the cell density in space for different time moments. It shows that the random distribution of the cell density leads to a merging process in all directions of the space at t = 0.05 s. Then after t = 0.85 s, the spatial patterns begin to form, and the aggregations start to merge and emerge and then to form uniform spot patterns as at time t = 14 s. Next, after time t = 30 s, these spot patterns stabilize (with a stationary L 2 -norm of solutions less than 10 14 ) to finally form 33 spatially inhomogeneous stable patterns as shown in the snapshot to the bottom of Figure 4.

4. Discussion

The mathematical analysis of chemotaxis models shows a plenitude of spatial patterns such as the chemotaxis models applied to skin pigmentation patterns [7,26,27]. That leads to aggregations of one type of pigment cell into a banded spatial pattern and to other models applied to the aggregation patterns in an epidemic disease [28], tumor growth [29], angiogenesis in tumor progression [30], and mathematical modeling of macrophages as vehicles for drug delivery to the tumor, as was used in [9]. Recently, direct transport of bacteria-based drug delivery vehicles was developed in [31], and iron oxide (IO) nanoparticles are used to track the chemotaxis of macrophages for the drug delivery control process using MRI imaging and visualization [5]. Here we investigated numerically the Turing instability and pattern formation in two dimensions for the chemotaxis model to show that the cell density stabilizes at a certain moment, thus verifying the theoretical results about pattern formation using an appropriate numerical scheme. Indeed, Figure 5 shows the time evolution of the cell density at the point (3.275; 3.1) in the red line, (8; 7.5) in the blue line, and (4.975; 2.825) in the cyan line. We observe that the cell density at the three points varies in response to the gradient of the chemoattractant, which plays an essential role to stop the aggregation of the cells. Next, the cell density stabilizes at the three points when the time t is greater or equal to 23 s, and we obtain the same result for the other spot patterns. Consequently, this stabilizing proves that the volume-filling chemotaxis model (3) generates stationary spatial patterns. These results demonstrate that our proposed chemotaxis model has a great potential to improve drug delivery processes.

5. Conclusions

In this article, we propose a mathematical model and a finite volume numerical method to simulate the pattern formation for the volume-filling chemotaxis model. We carry out conditions of pattern formation for the general volume-filling chemotaxis model with nonlinear diffusive terms. In the diffusive term, we apply a particular squeezing probability to describe the elasticity feature of the cells and to take into account that the cells are not solid blocks. In addition, we consider logistical growth to describe the cell kinetics. A two-dimensional numerical simulation is presented for nonzero kinetics to prove the generation of spatial inhomogeneous stable patterns for the volume-filling chemotaxis model. We have identified the mechanism for destabilizing the stationary solutions. We have found the conditions linking the biological parameters of the system in order to locate a tumor in space; consequently, the targeted drug delivery can be applied rigorously. These results need to be compared and completed by some experiments, which will be the subject of a future work.

Author Contributions

M.A. performed part of the experiments, data analysis, wrote part of the manuscript, and revised the manuscript critically. A.S. provided important intellectual content, wrote part of the manuscript, and revised the manuscript critically. M.I. performed the theoretical part of the reaction diffusion model, implemented the simulation, and wrote part of the manuscript. M.S. planned the work, provided important intellectual content regarding the method to be used, supervised the implementation, read the manuscript critically, and discussed the results. All authors have read and agreed to the published version of the manuscript.

Funding

This research was funded by the College of Applied Medical Sciences Research Centre and the Deanship of Scientific Research at King Saud University.

Institutional Review Board Statement

Not applicable.

Informed Consent Statement

Not applicable.

Acknowledgments

The authors extend their appreciation to the College of Applied Medical Sciences Research Centre and the Deanship of Scientific Research at King Saud University for its funding for this research.

Conflicts of Interest

The authors declare no conflict of interest.

References

  1. Espinosa, E.; Zamora, P.; Feliu, J.; González Barón, M. Classification of anticancer drugs—A new system based on therapeutic targets. Cancer Treat. Rev. 2003, 29, 515–523. [Google Scholar] [CrossRef]
  2. Djamgoz, M.B.A.; Fraser, S.P.; Brackenbury, W.J. In vivo evidence for voltage-gated sodium channel expression in carcinomas and potentiation of metastasis. Cancers 2019, 11, 1675. [Google Scholar] [CrossRef] [PubMed] [Green Version]
  3. Jandaghi, N.; Jahani, S.; Foroughi, M.M.; Kazemipour, M.; Ansari, M. Cerium-doped flower-shaped ZnO nano-crystallites as a sensing component for simultaneous electrochemical determination of epirubicin and methotrexate. Microchim. Acta 2020, 187. [Google Scholar] [CrossRef]
  4. Nastasa, V.; Samaras, K.; Andrei, I.; Pascu, M.; Karapantsios, T. Study of the formation of micro and nano-droplets containing immiscible solutions. Colloids Surf. A Physicochem. Eng. Asp. 2011, 382, 246–250. [Google Scholar] [CrossRef]
  5. Saad, A.S.; Al Faraj, A. 3D visualization of iron oxide nanoparticles in MRI of inflammatory model. J. Vis. 2014, 18, 1–8. [Google Scholar] [CrossRef]
  6. Coluccio, M.L.; D’Attimo, M.A.; Cristiani, C.M.; Candeloro, P.; Parrotta, E.; Dattola, E.; Guzzi, F.; Cuda, G.; Lamanna, E.; Carbone, E.; et al. A passive microfluidic device for chemotaxis studies. Micromachines 2019, 10, 551. [Google Scholar] [CrossRef] [Green Version]
  7. Painter, K.; Maini, P.; Othmer, H. Stripe formation in juvenile pomacanthus explained by a generalized turing mechanism with chemotaxis. Proc. Natl. Acad. Sci. USA 1999, 96, 5549–5554. [Google Scholar] [CrossRef] [PubMed] [Green Version]
  8. Painter, K.J.; Hillen, T. Volume-filling and quorum-sensing in models for chemosensitive movement. Can. Appl. Math. Q. 2002, 10, 501–543. [Google Scholar]
  9. Owen, M.R.; Byrne, H.M.; Lewis, C.E. Mathematical modelling of the use of macrophages as vehicles for drug delivery to hypoxic tumour sites. J. Theor. Biol. 2004, 226, 377–391. [Google Scholar] [CrossRef] [Green Version]
  10. Zhabotinsky, A.M. Periodical oxidation of malonic acid in solution (a study of the belousov reaction kinetics). Biofizika 1964, 9, 306–311. [Google Scholar]
  11. Turing, A.M. The chemical basis of morphogenesis. Phil. Trans. R. Soc. Lond. B 1952, 237, 37–72. [Google Scholar]
  12. Murray, J.D. Mathematical Biology: I. An Introduction; Springer: New York, NY, USA, 2002; Volume 17. [Google Scholar]
  13. Patlak, C.S. Random walk with persistence and external bias. Bull. Math. Biol. 1953, 15, 311–338. [Google Scholar] [CrossRef]
  14. Keller, E.F.; Segel, L.A. Initiation of slime mold aggregation viewed as an instability. J. Theor. Biol. 1970, 26, 399–415. [Google Scholar] [CrossRef]
  15. Keller, E.F.; Segel, L.A. Model for chemotaxis. J. Theor. Biol. 1971, 30, 225–234. [Google Scholar] [CrossRef]
  16. Horstmann, D. From 1970 until present: The Keller-Segel model in chemotaxis and its consequences. ii. Jahresber. Dtsch. Math. Ver. 2004, 106, 51–70. [Google Scholar]
  17. Horstmann, D. From 1970 until present: The Keller-Segel model in chemotaxis and its consequences. i. Jahresber. Dtsch. Math. Ver. 2003, 105, 103–165. [Google Scholar]
  18. Bendahmane, M.; Karlsen, K.H.; Urbano, J.M. On a two-sidedly degenerate chemotaxis model with volume-filling effect. Math. Model. Methods Appl. Sci. 2007, 17, 783–804. [Google Scholar] [CrossRef] [Green Version]
  19. Andreianov, B.; Bendahmane, M.; Saad, M. Finite volume methods for degenerate chemotaxis model. J. Comput. Appl. Math. 2011, 235, 4015–4031. [Google Scholar] [CrossRef] [Green Version]
  20. Schaaf, P.; Talbot, J. Surface exclusion effects in adsorption processes. J. Chem. Phys. 1989, 91, 4401–4409. [Google Scholar] [CrossRef]
  21. Potapov, A.; Hillen, T. Metastability in chemotaxis models. J. Dyn. Differ. Equat. 2005, 17, 293–330. [Google Scholar] [CrossRef] [Green Version]
  22. Wang, Z.; Hillen, T. Classical solutions and pattern formation for a volume filling chemotaxis model. Chaos Interdiscip. J. Nonlinear Sci. 2007, 17. [Google Scholar] [CrossRef]
  23. Amann, H. Nonhomogeneous linear and quasilinear elliptic and parabolic boundary value problems. Funct. Spaces Differ. Oper. Nonlinear Anal. 1993, 133, 9–126. [Google Scholar]
  24. Murray, J.D. Mathematical Biology II: Spatial Models and Biomedical Applications; Interdisciplinary Applied Mathematics; Springer: New York, NY, USA, 2003; Volume 18. [Google Scholar]
  25. Eymard, R.; Gallouet, T.; Herbin, R. Finite volume methods. Handb. Numer. Anal. 2000, 7, 713–1018. [Google Scholar]
  26. Murray, J.; Myerscough, M. Pigmentation pattern formation on snakes. J. Theor. Biol. 1991, 149, 339–360. [Google Scholar] [CrossRef]
  27. Yang, X.; Dormann, D.; Münsterberg, A.E.; Weijer, C.J. Cell movement patterns during gastrulation in the chick are controlled by positive and negative chemotaxis mediated by fgf4 and fgf8. Dev. Cell 2002, 3, 425–437. [Google Scholar] [CrossRef] [Green Version]
  28. Bendahmane, M.; Saad, M. Mathematical analysis and pattern formation for a partial immune system modeling the spread of an epidemic disease. Acta Appl. Math. 2010, 115, 17–42. [Google Scholar] [CrossRef]
  29. Chaplain, M.A.; Ganesh, M.; Graham, I.G. Spatio-temporal pattern formation on spherical surfaces: Numerical simulation and application to solid tumour growth. J. Math. Biol. 2001, 42, 387–423. [Google Scholar] [CrossRef] [PubMed]
  30. Byrne, H.; Chaplain, M.A. Mathematical models for tumour angiogenesis: Numerical simulations and nonlinear wave solutions. Bull. Math. Biol. 1995, 57, 461–486. [Google Scholar] [CrossRef]
  31. Sahari, A.; Traore, M.A.; Scharf, B.E.; Behkam, B. Directed transport of bacteria-based drug delivery vehicles: Bacterial chemotaxis dominates particle shape. Biomed. Microdevices 2014, 16, 717–725. [Google Scholar] [CrossRef]
Figure 1. Plot of the real part of the eigenvalue λ k 2   . varies as a function of k 2 defined by Equation (10). When χ > χ c , there is a range of unstable wave numbers k 1 2 < k 2 < k 2 2 for which the homogeneous steady state is linearly unstable.
Applsci 11 04979 g001
Figure 2. Initial condition of the cell density with a random small perturbation around the steady state 0.25 ≤ u ≤0.2599.
Applsci 11 04979 g002
Figure 3. Pattern formation for the model (3) at time t = 0.05 (a) with 3.10−3 ≤ u ≤ 0.995 and at time t = 0.9 (b) with 2.10−5 ≤ u ≤ 0.98.
Applsci 11 04979 g003
Figure 4. Pattern formation for the model (3) at time t = 14 (a) with 1.9 × 10⁻⁴u ≤ 0.98 and at time t = 30 (b) with 3.9 × 10⁻³u ≤ 0.832.
Applsci 11 04979 g004
Figure 5. The evolution of the cell density with respect to the time at three different points (3.275; 3.1) in the red line, (8; 7.5) in the blue line, and (4.975; 2.825) in the green line.
Applsci 11 04979 g005
Publisher’s Note: MDPI stays neutral with regard to jurisdictional claims in published maps and institutional affiliations.

