
Environmental Footprint Assessment of a Cleanup at Hypothetical Contaminated Site

 , , and
Abstract
1. Introduction
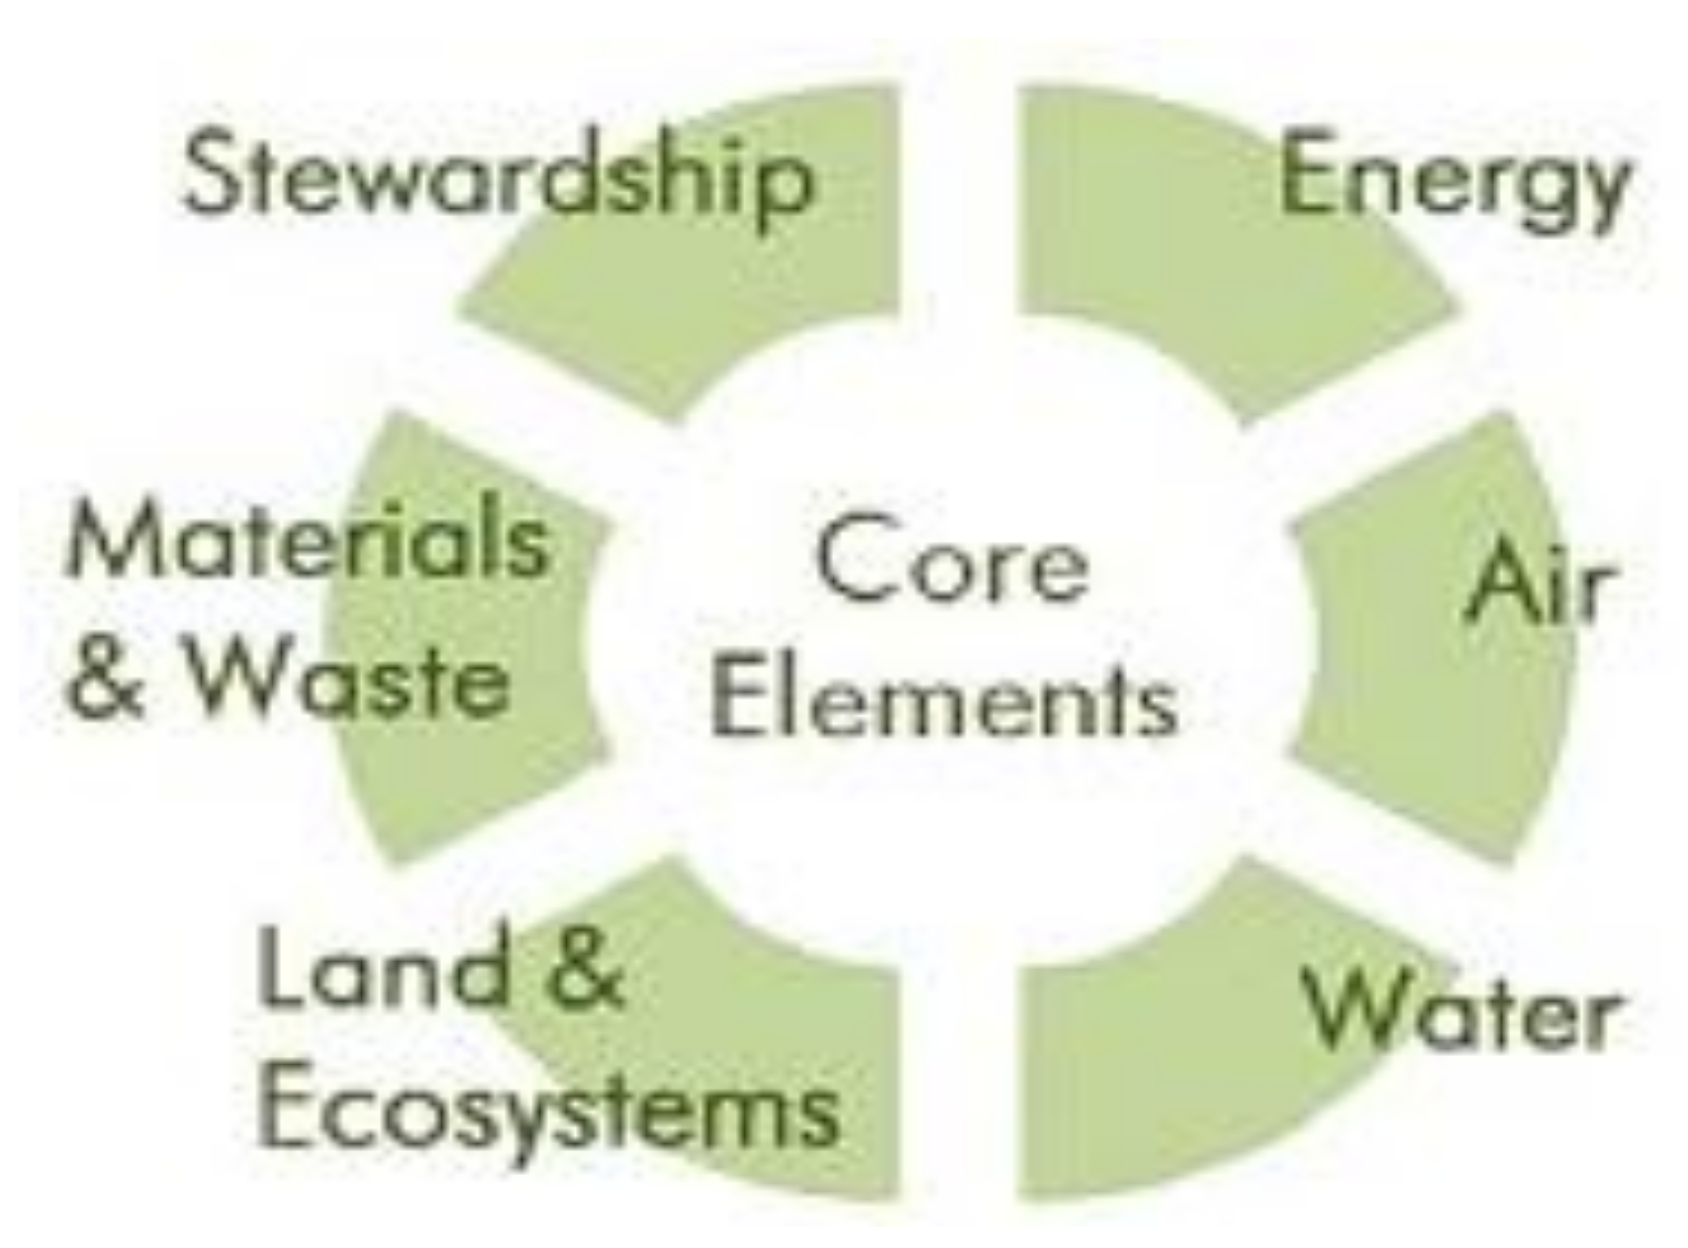
2. Core Elements of Green Remediation
2.1. Energy
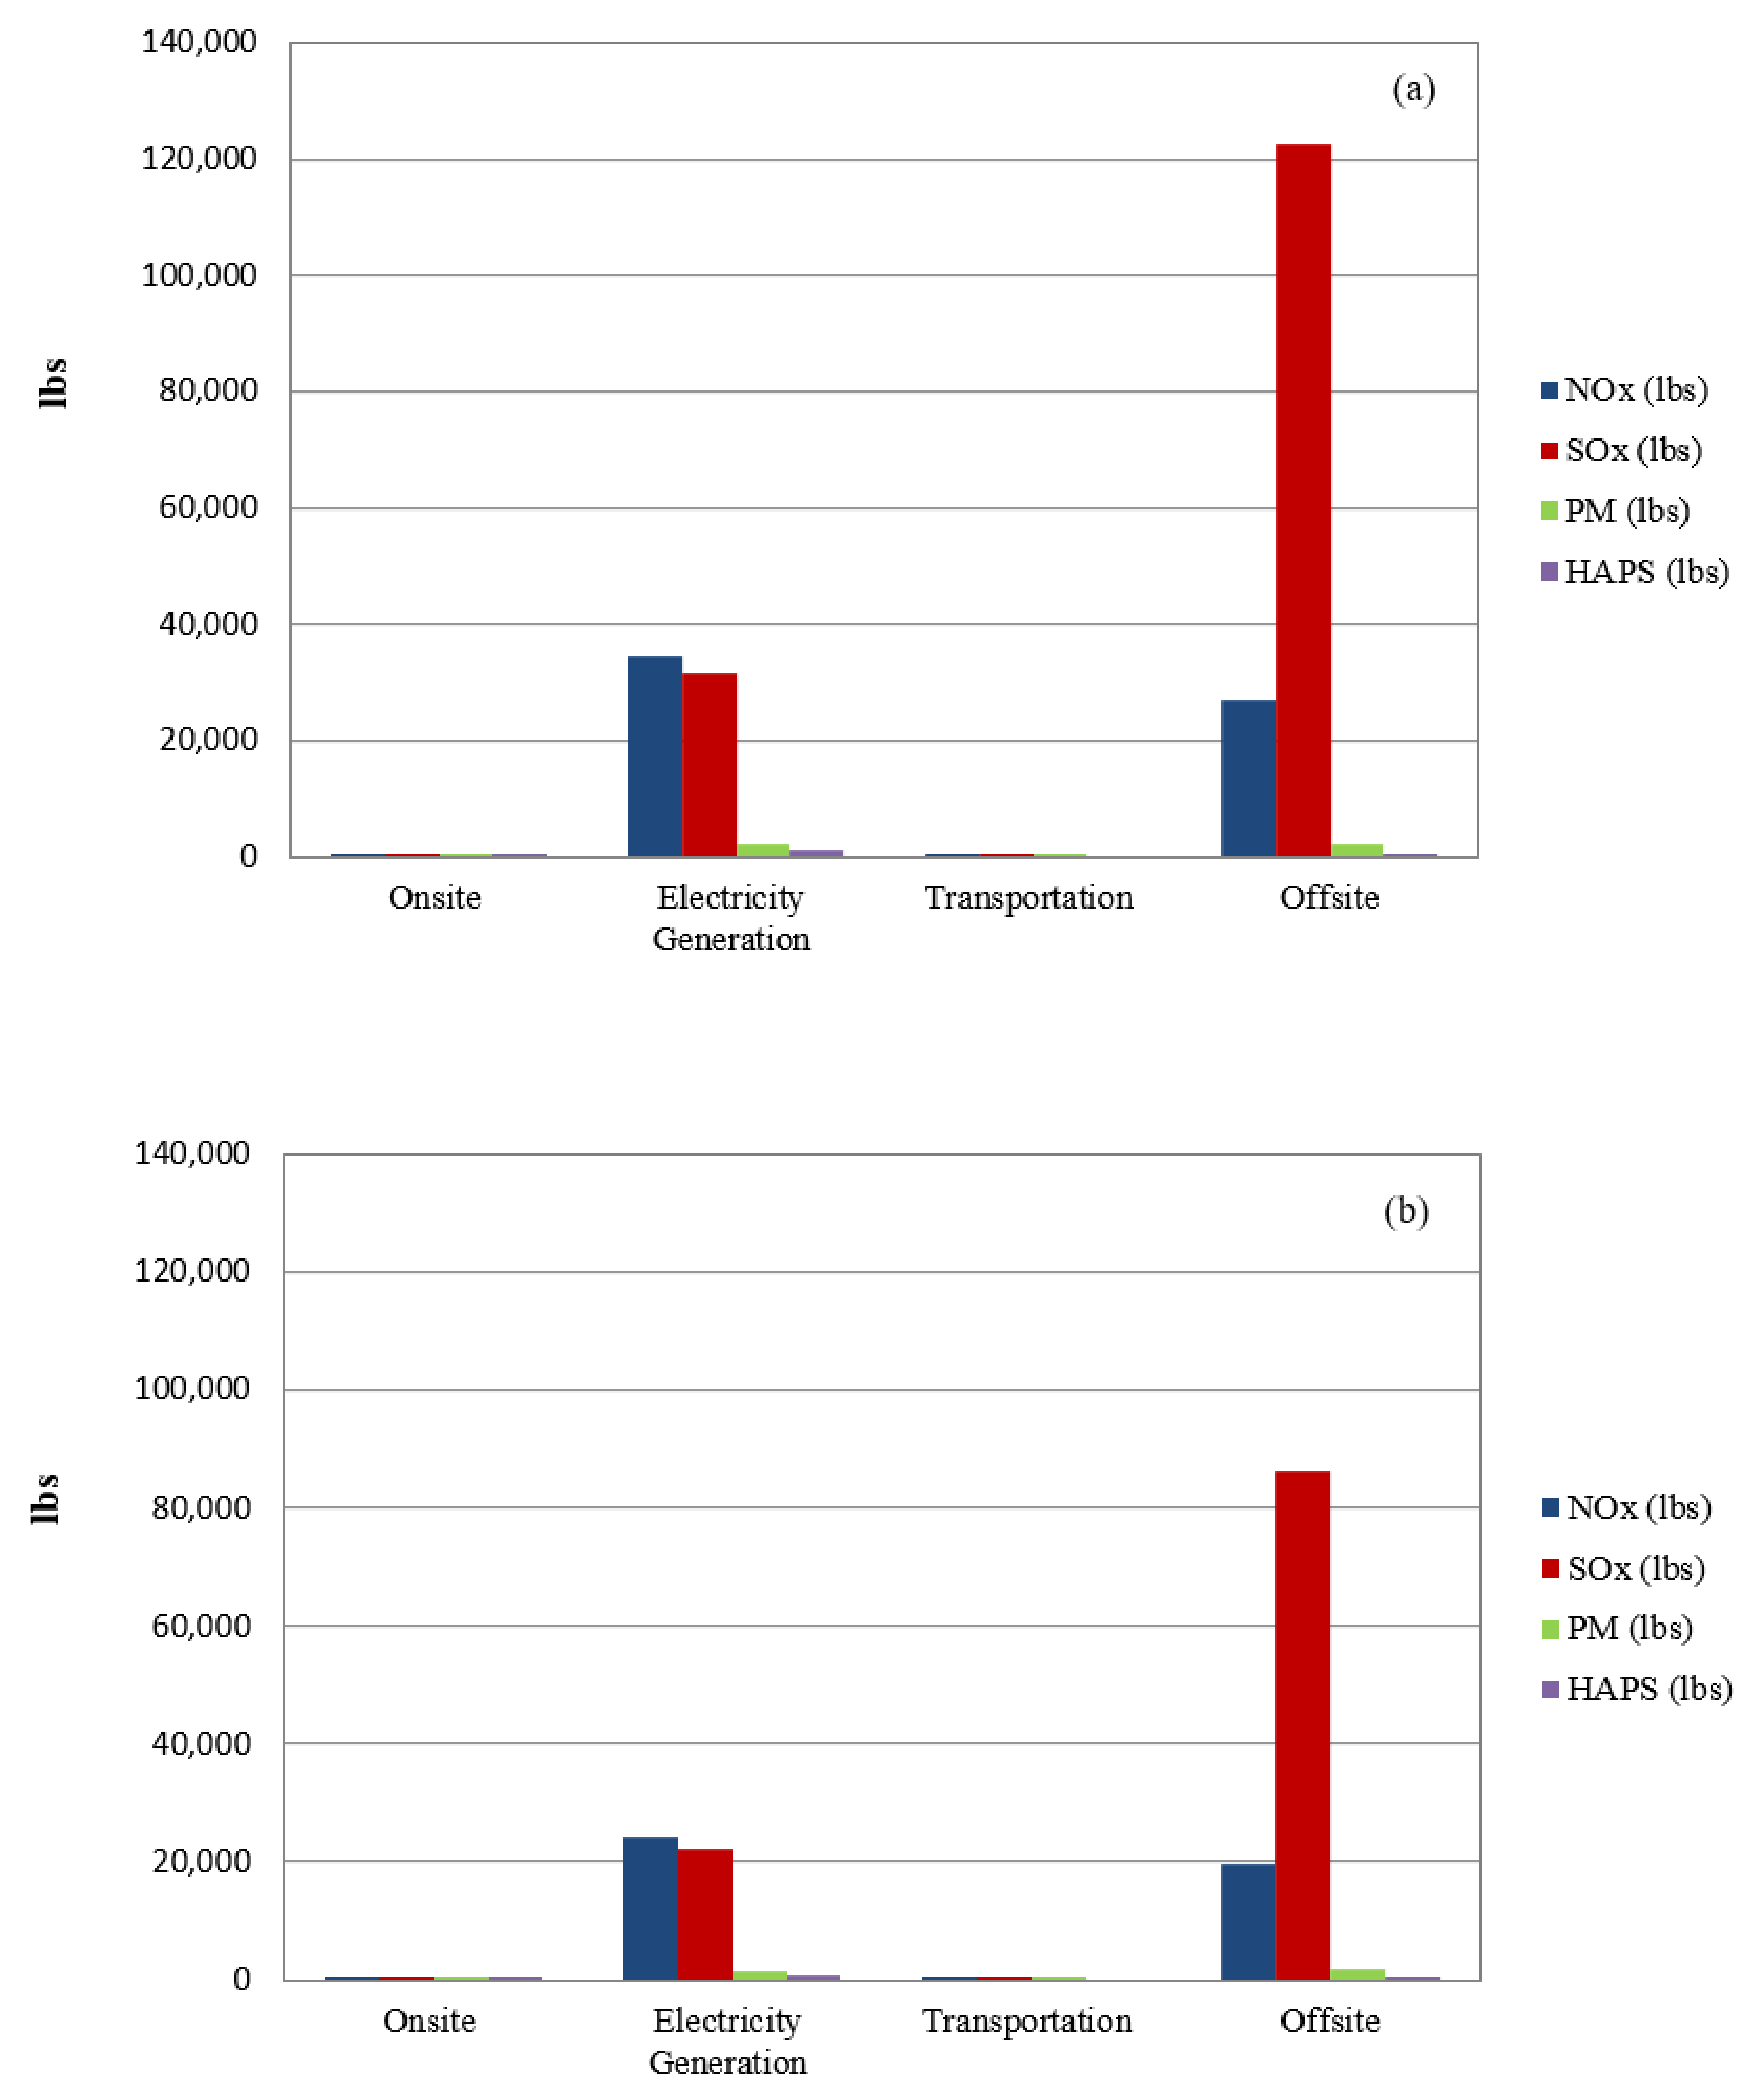
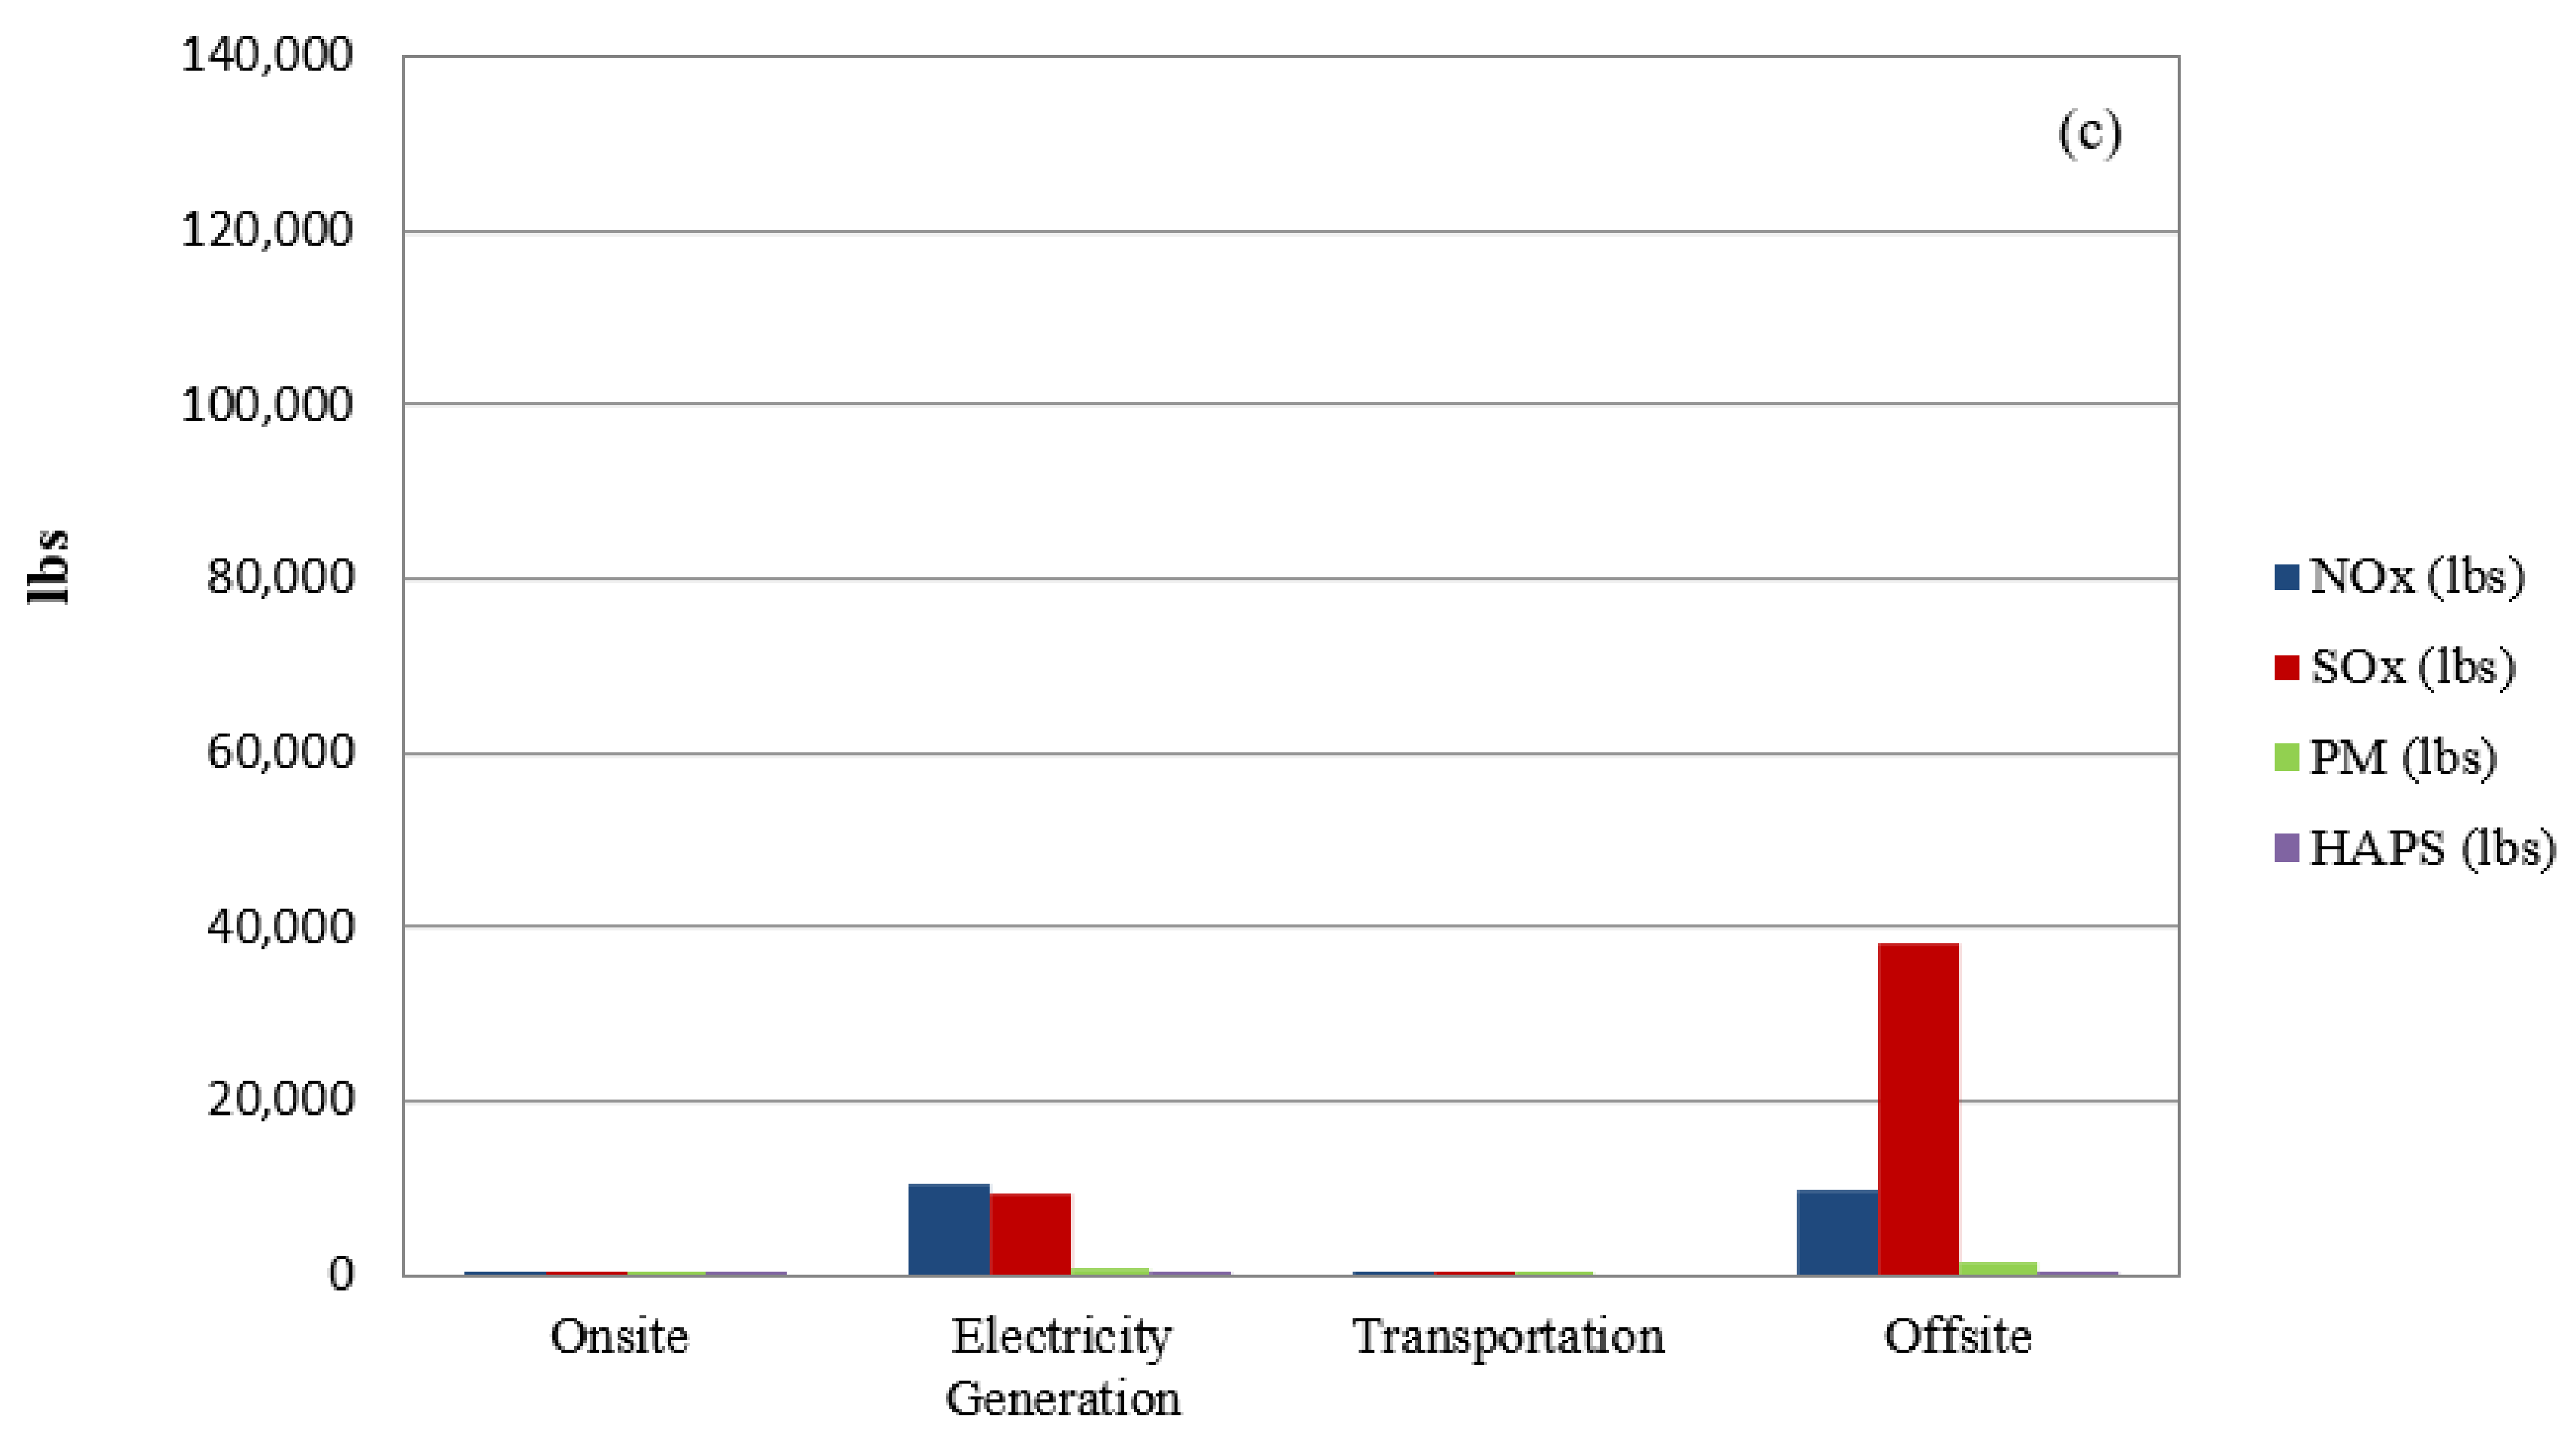
2.2. Air
2.3. Water
2.4. Land and Ecosystems
2.5. Materials and Wastes
2.6. Stewardship
3. Environmental Footprint of a Cleanup Project
3.1. Purpose
3.2. Limitations
3.3. Value
3.4. Level of Effort and Cost
4. Method and Material
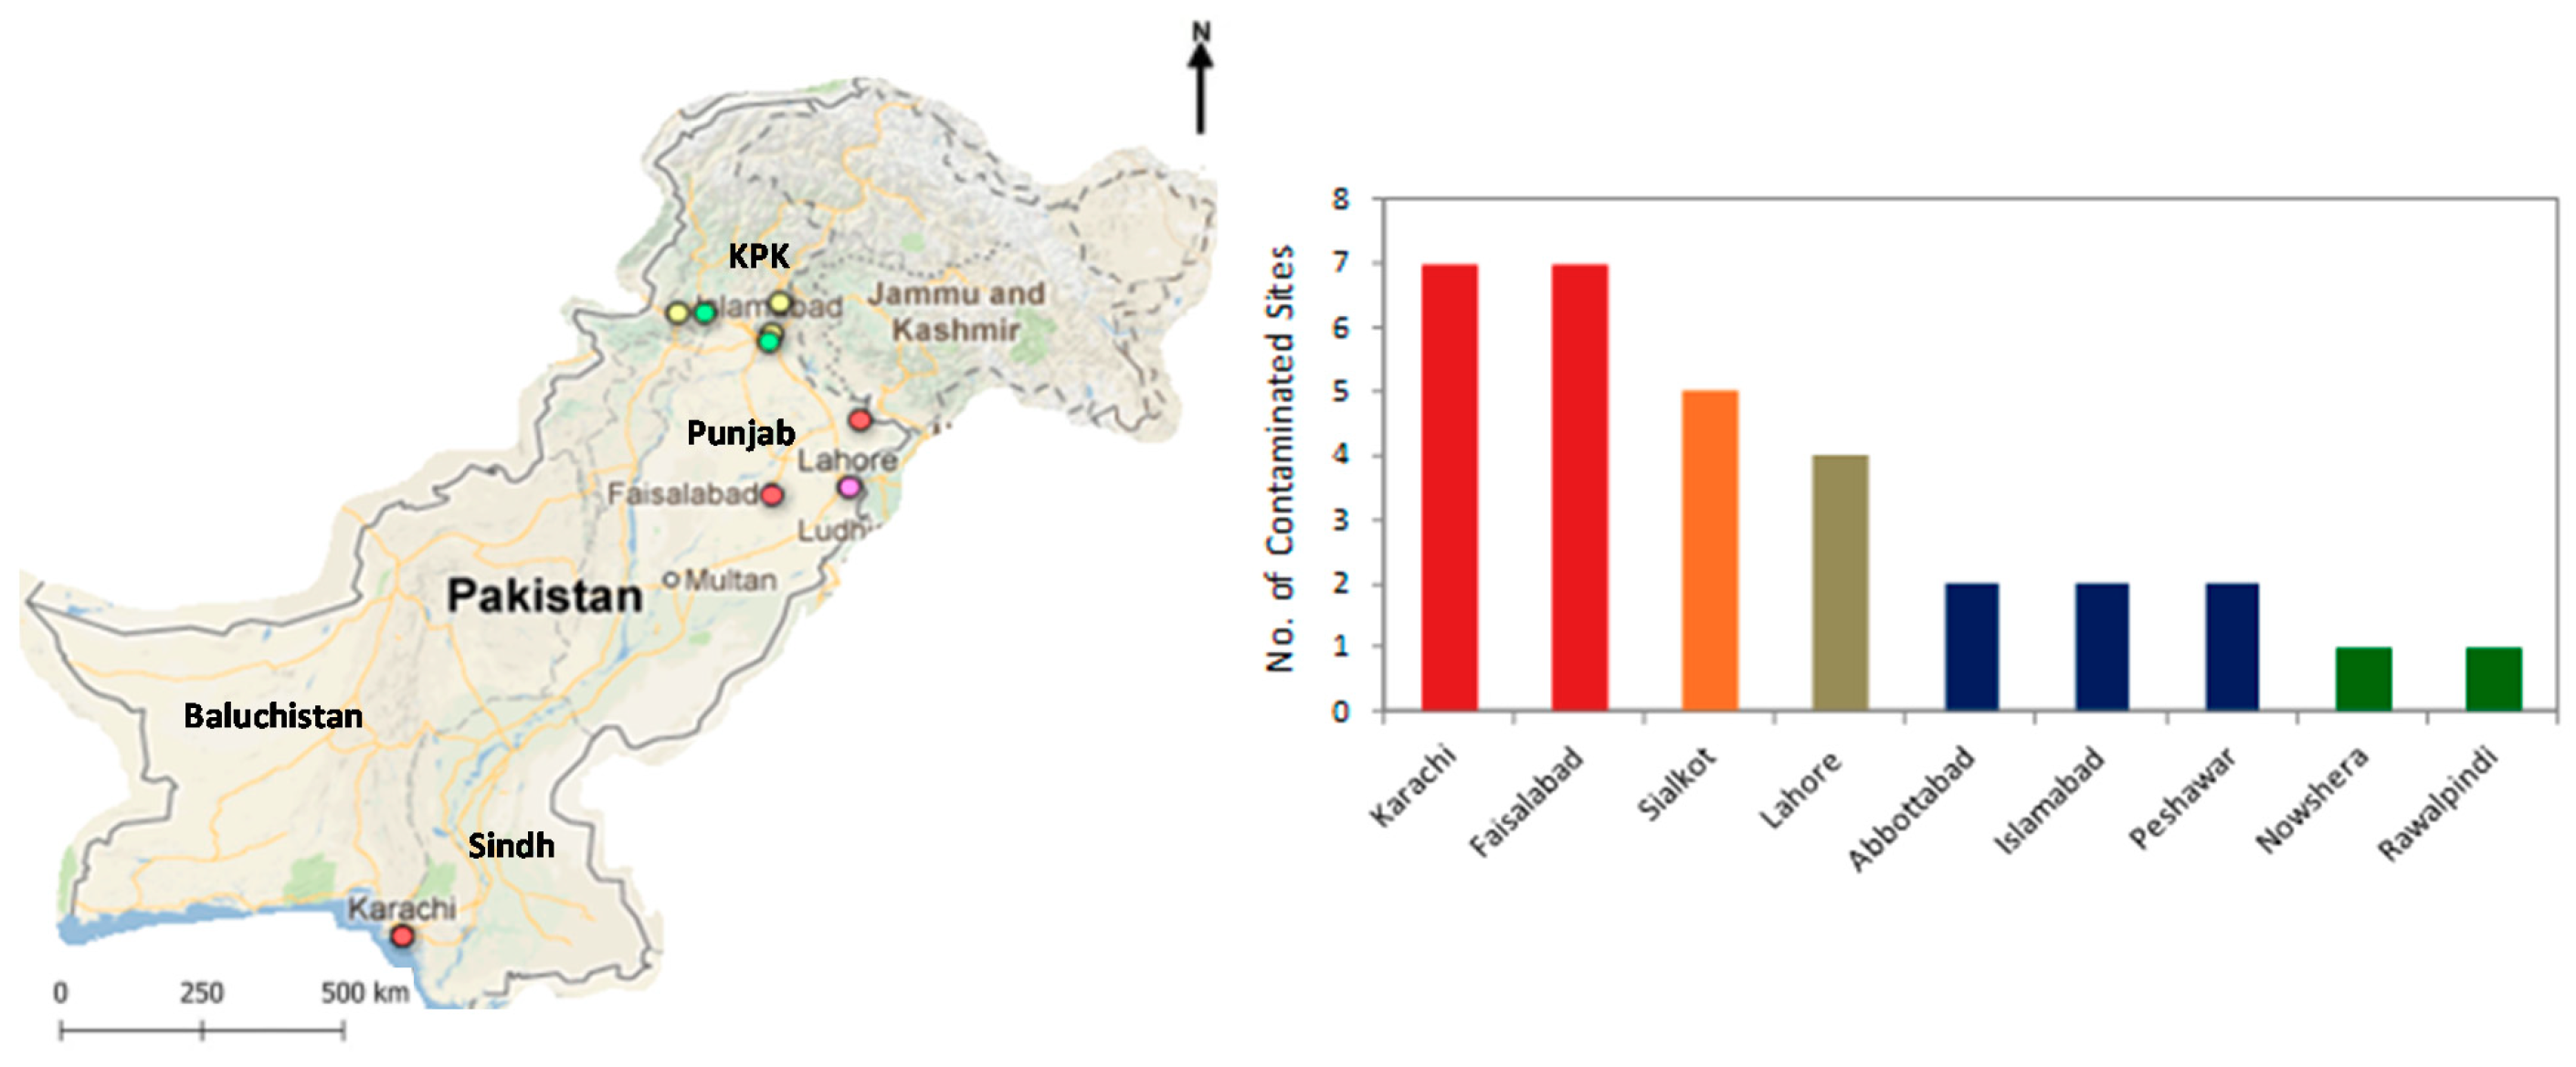
4.1. Site Selection
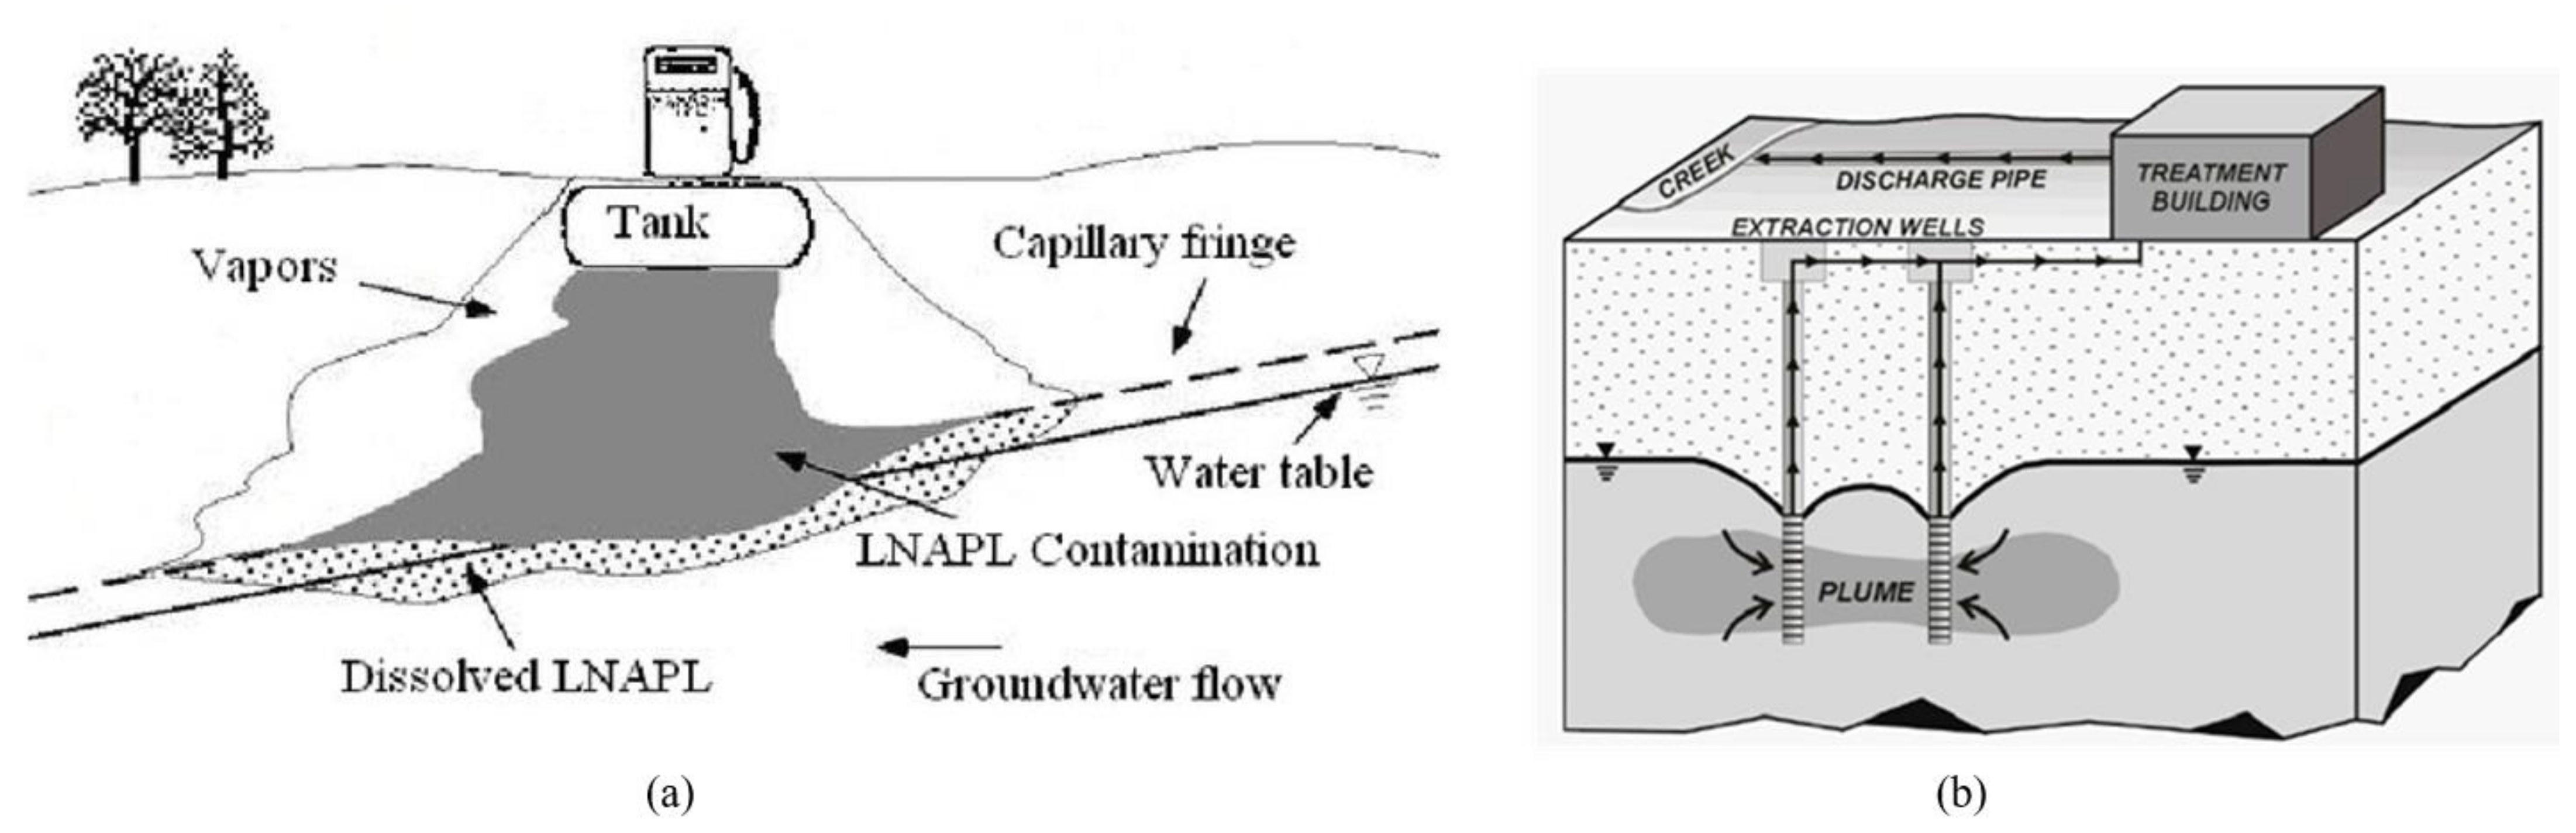
4.2. Hypothetical Situation
- Ten 6-inch extraction wells, each to 60 feet deep with 20-foot screens;
- 3000 feet of 6-inch HDPE piping with electrical conduit and wiring;
- 80 ft × 100 ft building that is 30 feet high;
- 200 ft × 200 ft reinforced concrete pad and containment area (20,000 ft3 of concrete).
4.3. Scenarios for Analysis
4.3.1. Cleanup without Any Renewable Energy Resources at All
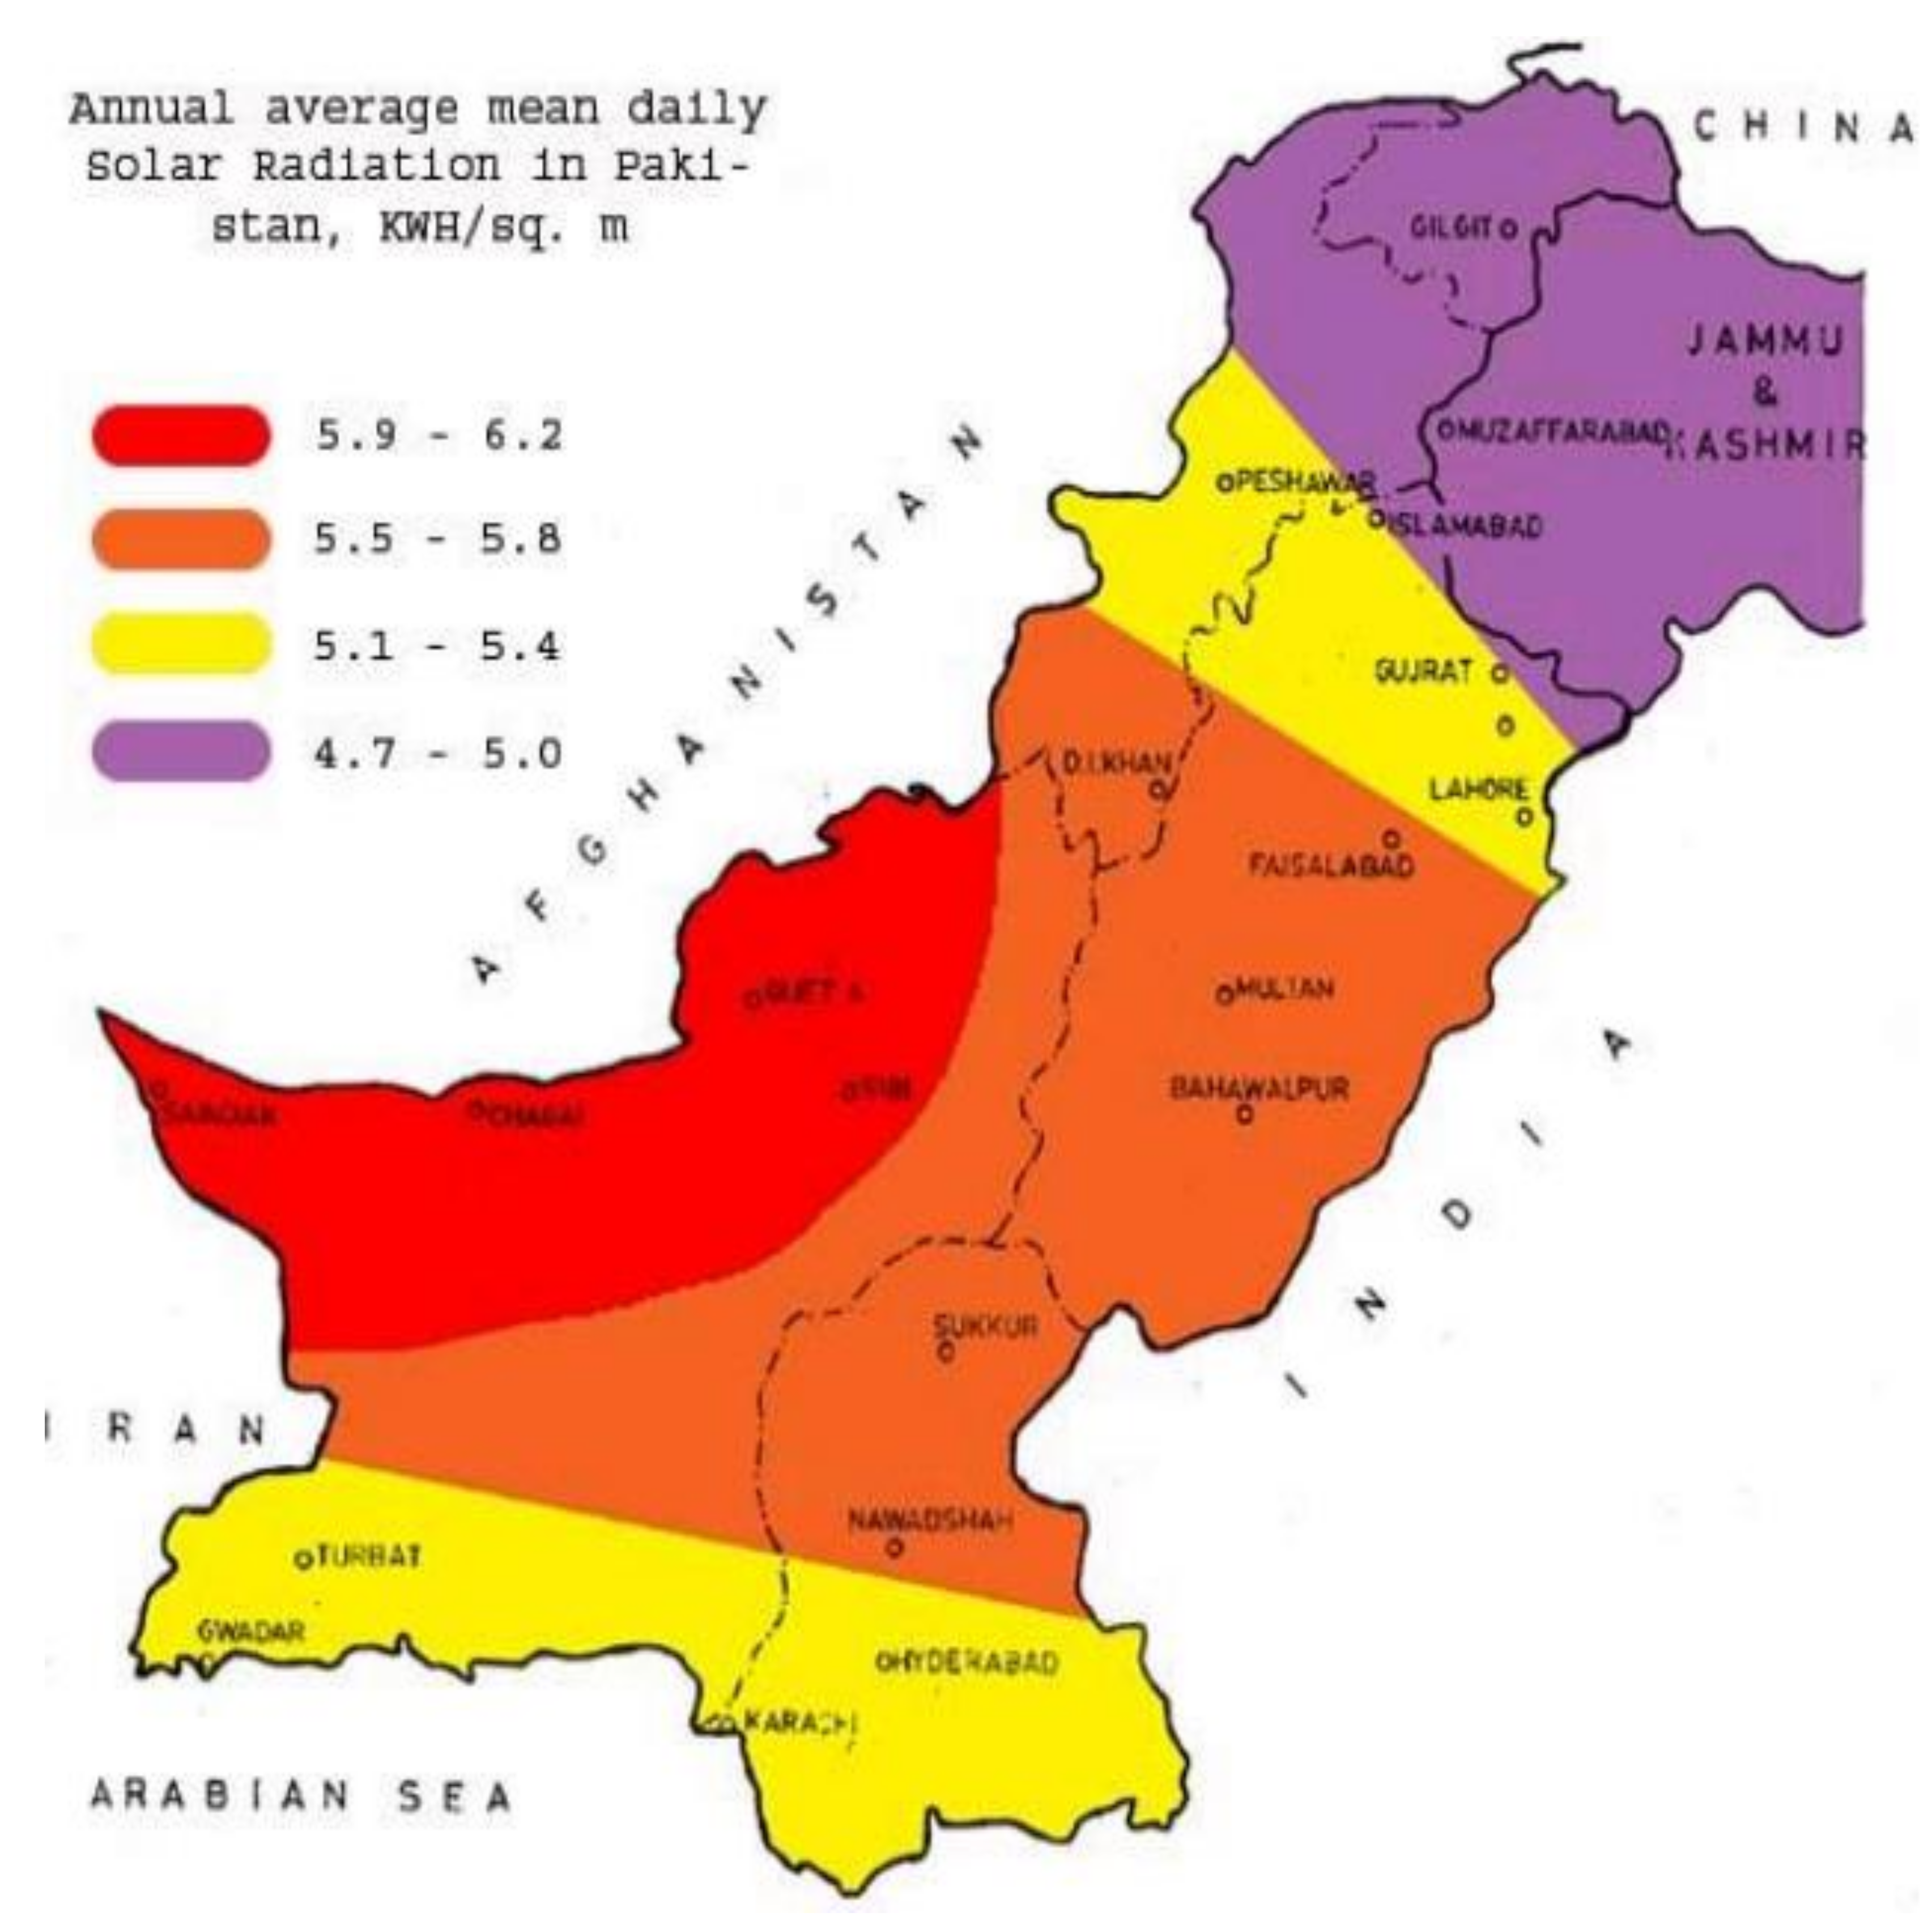
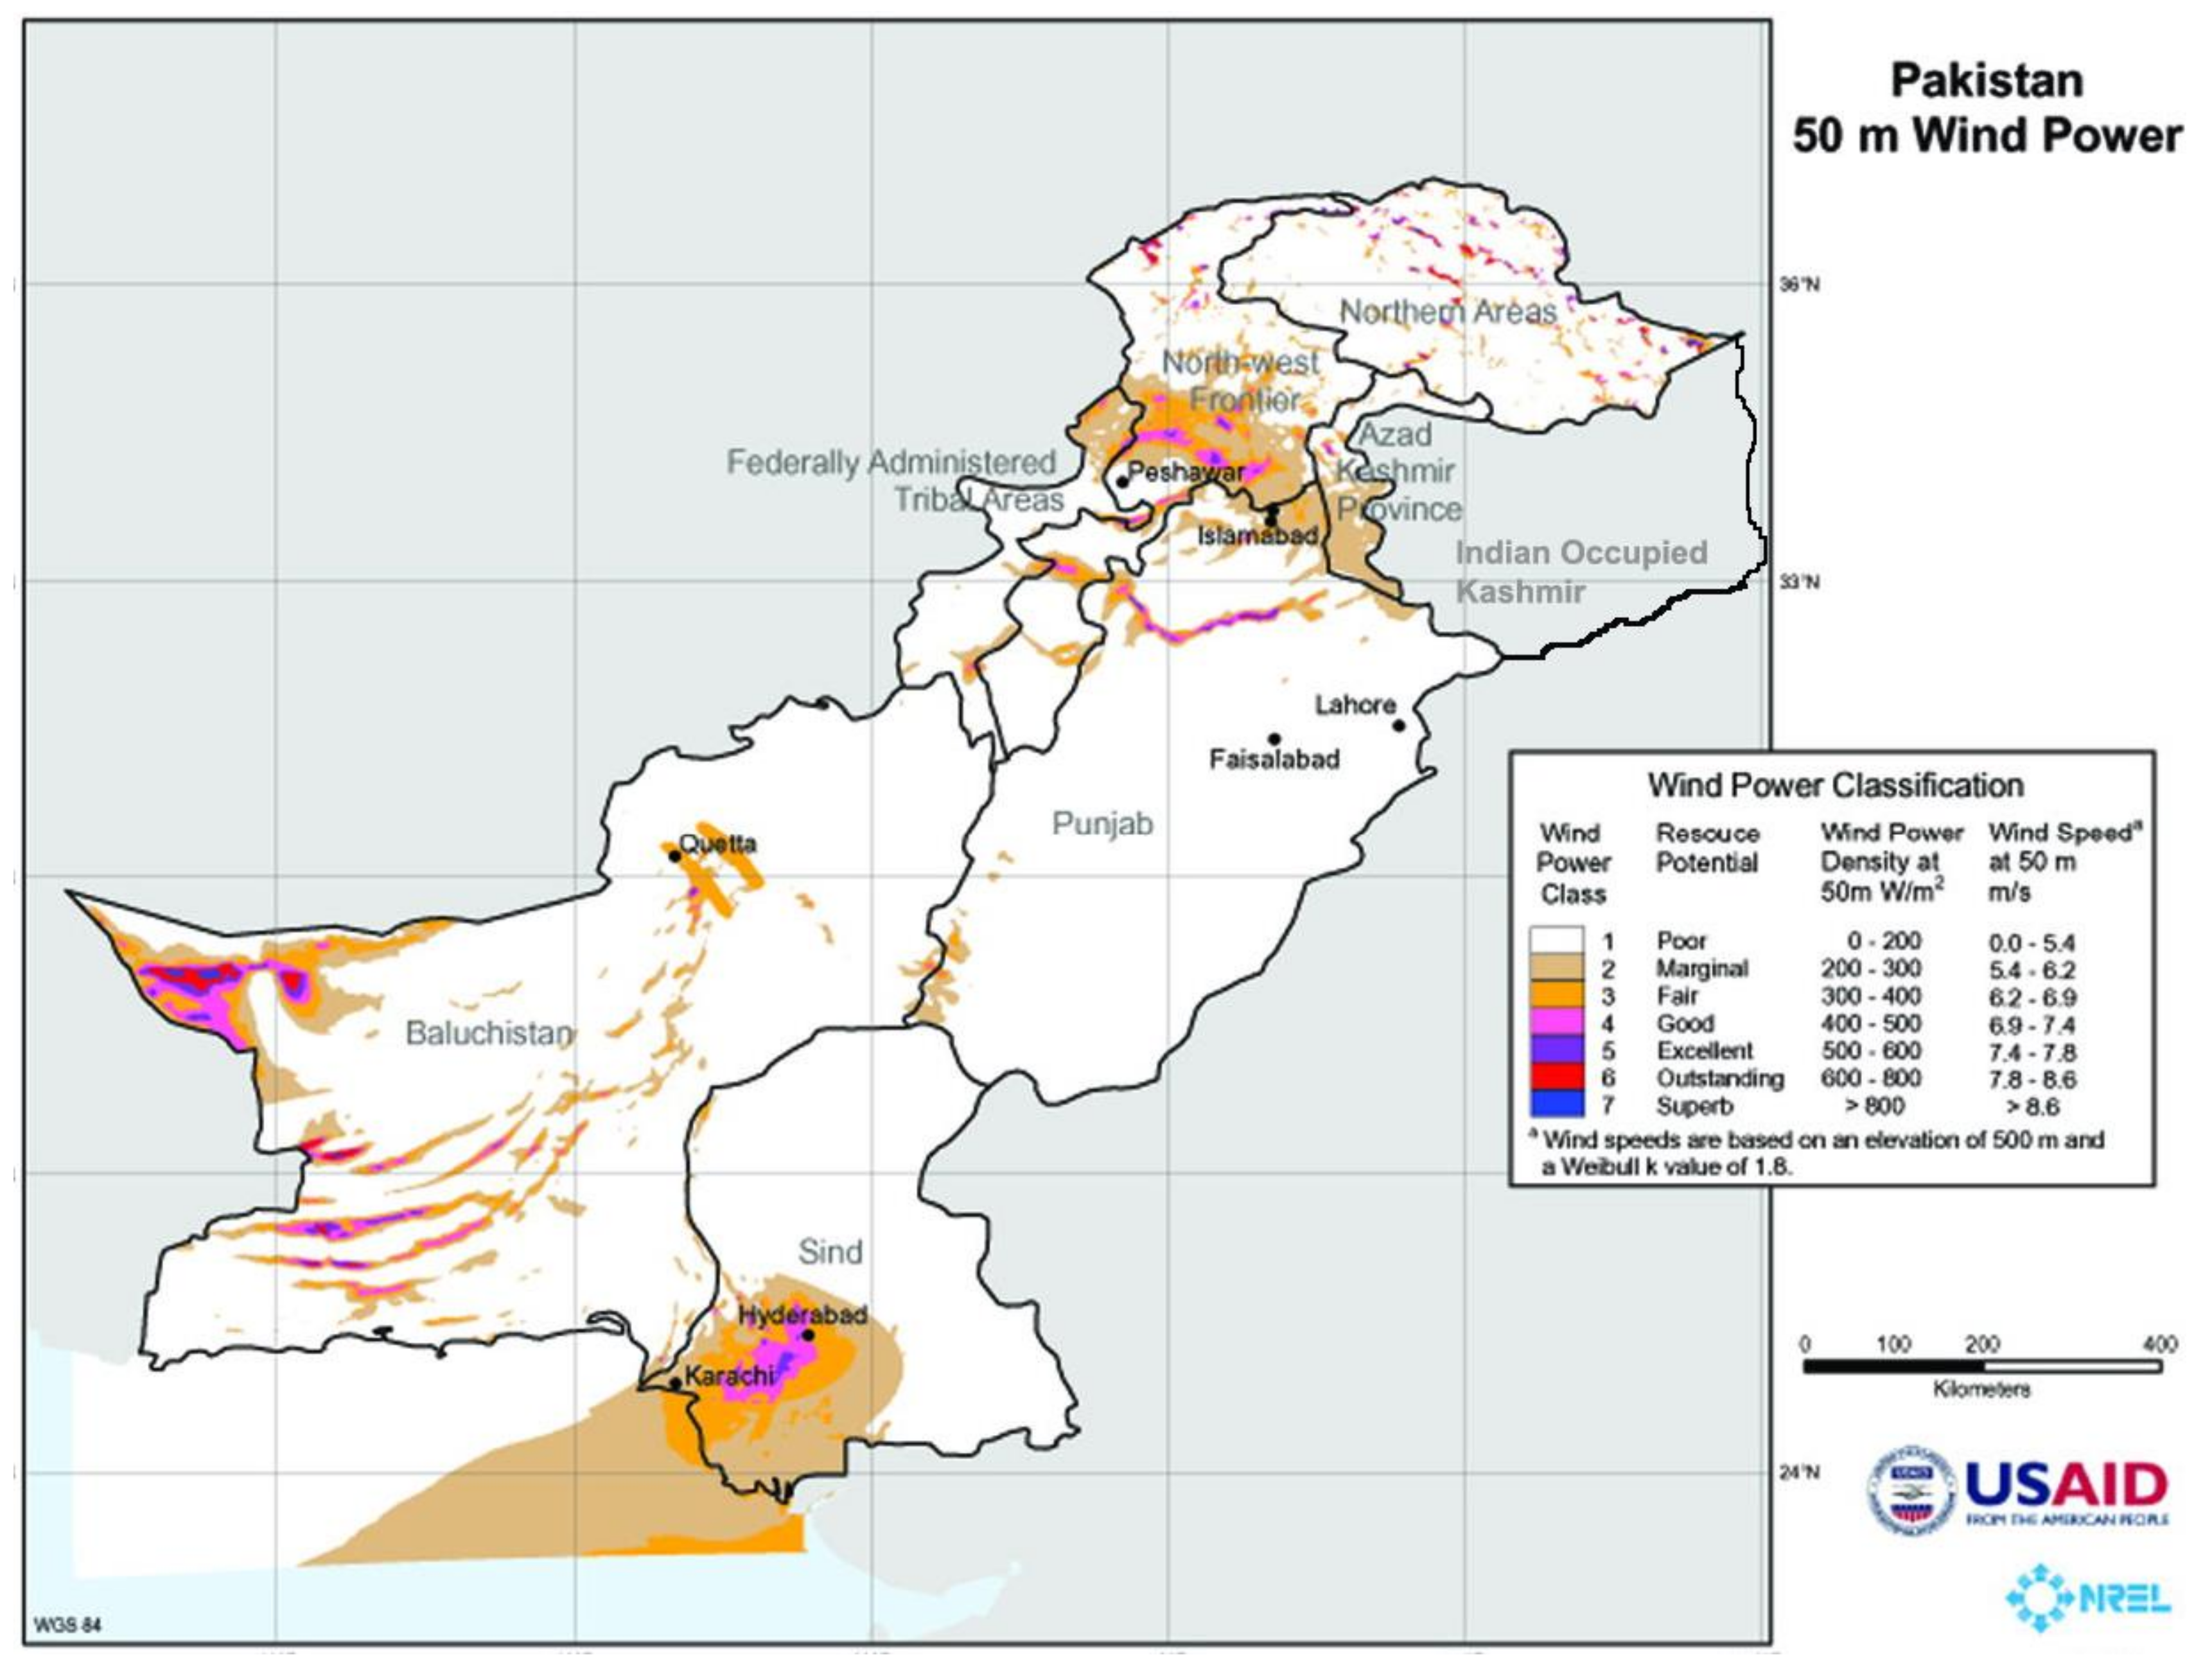
4.3.2. Cleanup with a Small Share of Renewable Energy Sources
4.3.3. Cleanup with a Large Share of Renewable Energy Sources
4.4. Green Remediation Metrics
4.4.1. Materials and Waste Metrics
4.4.2. Water Metrics
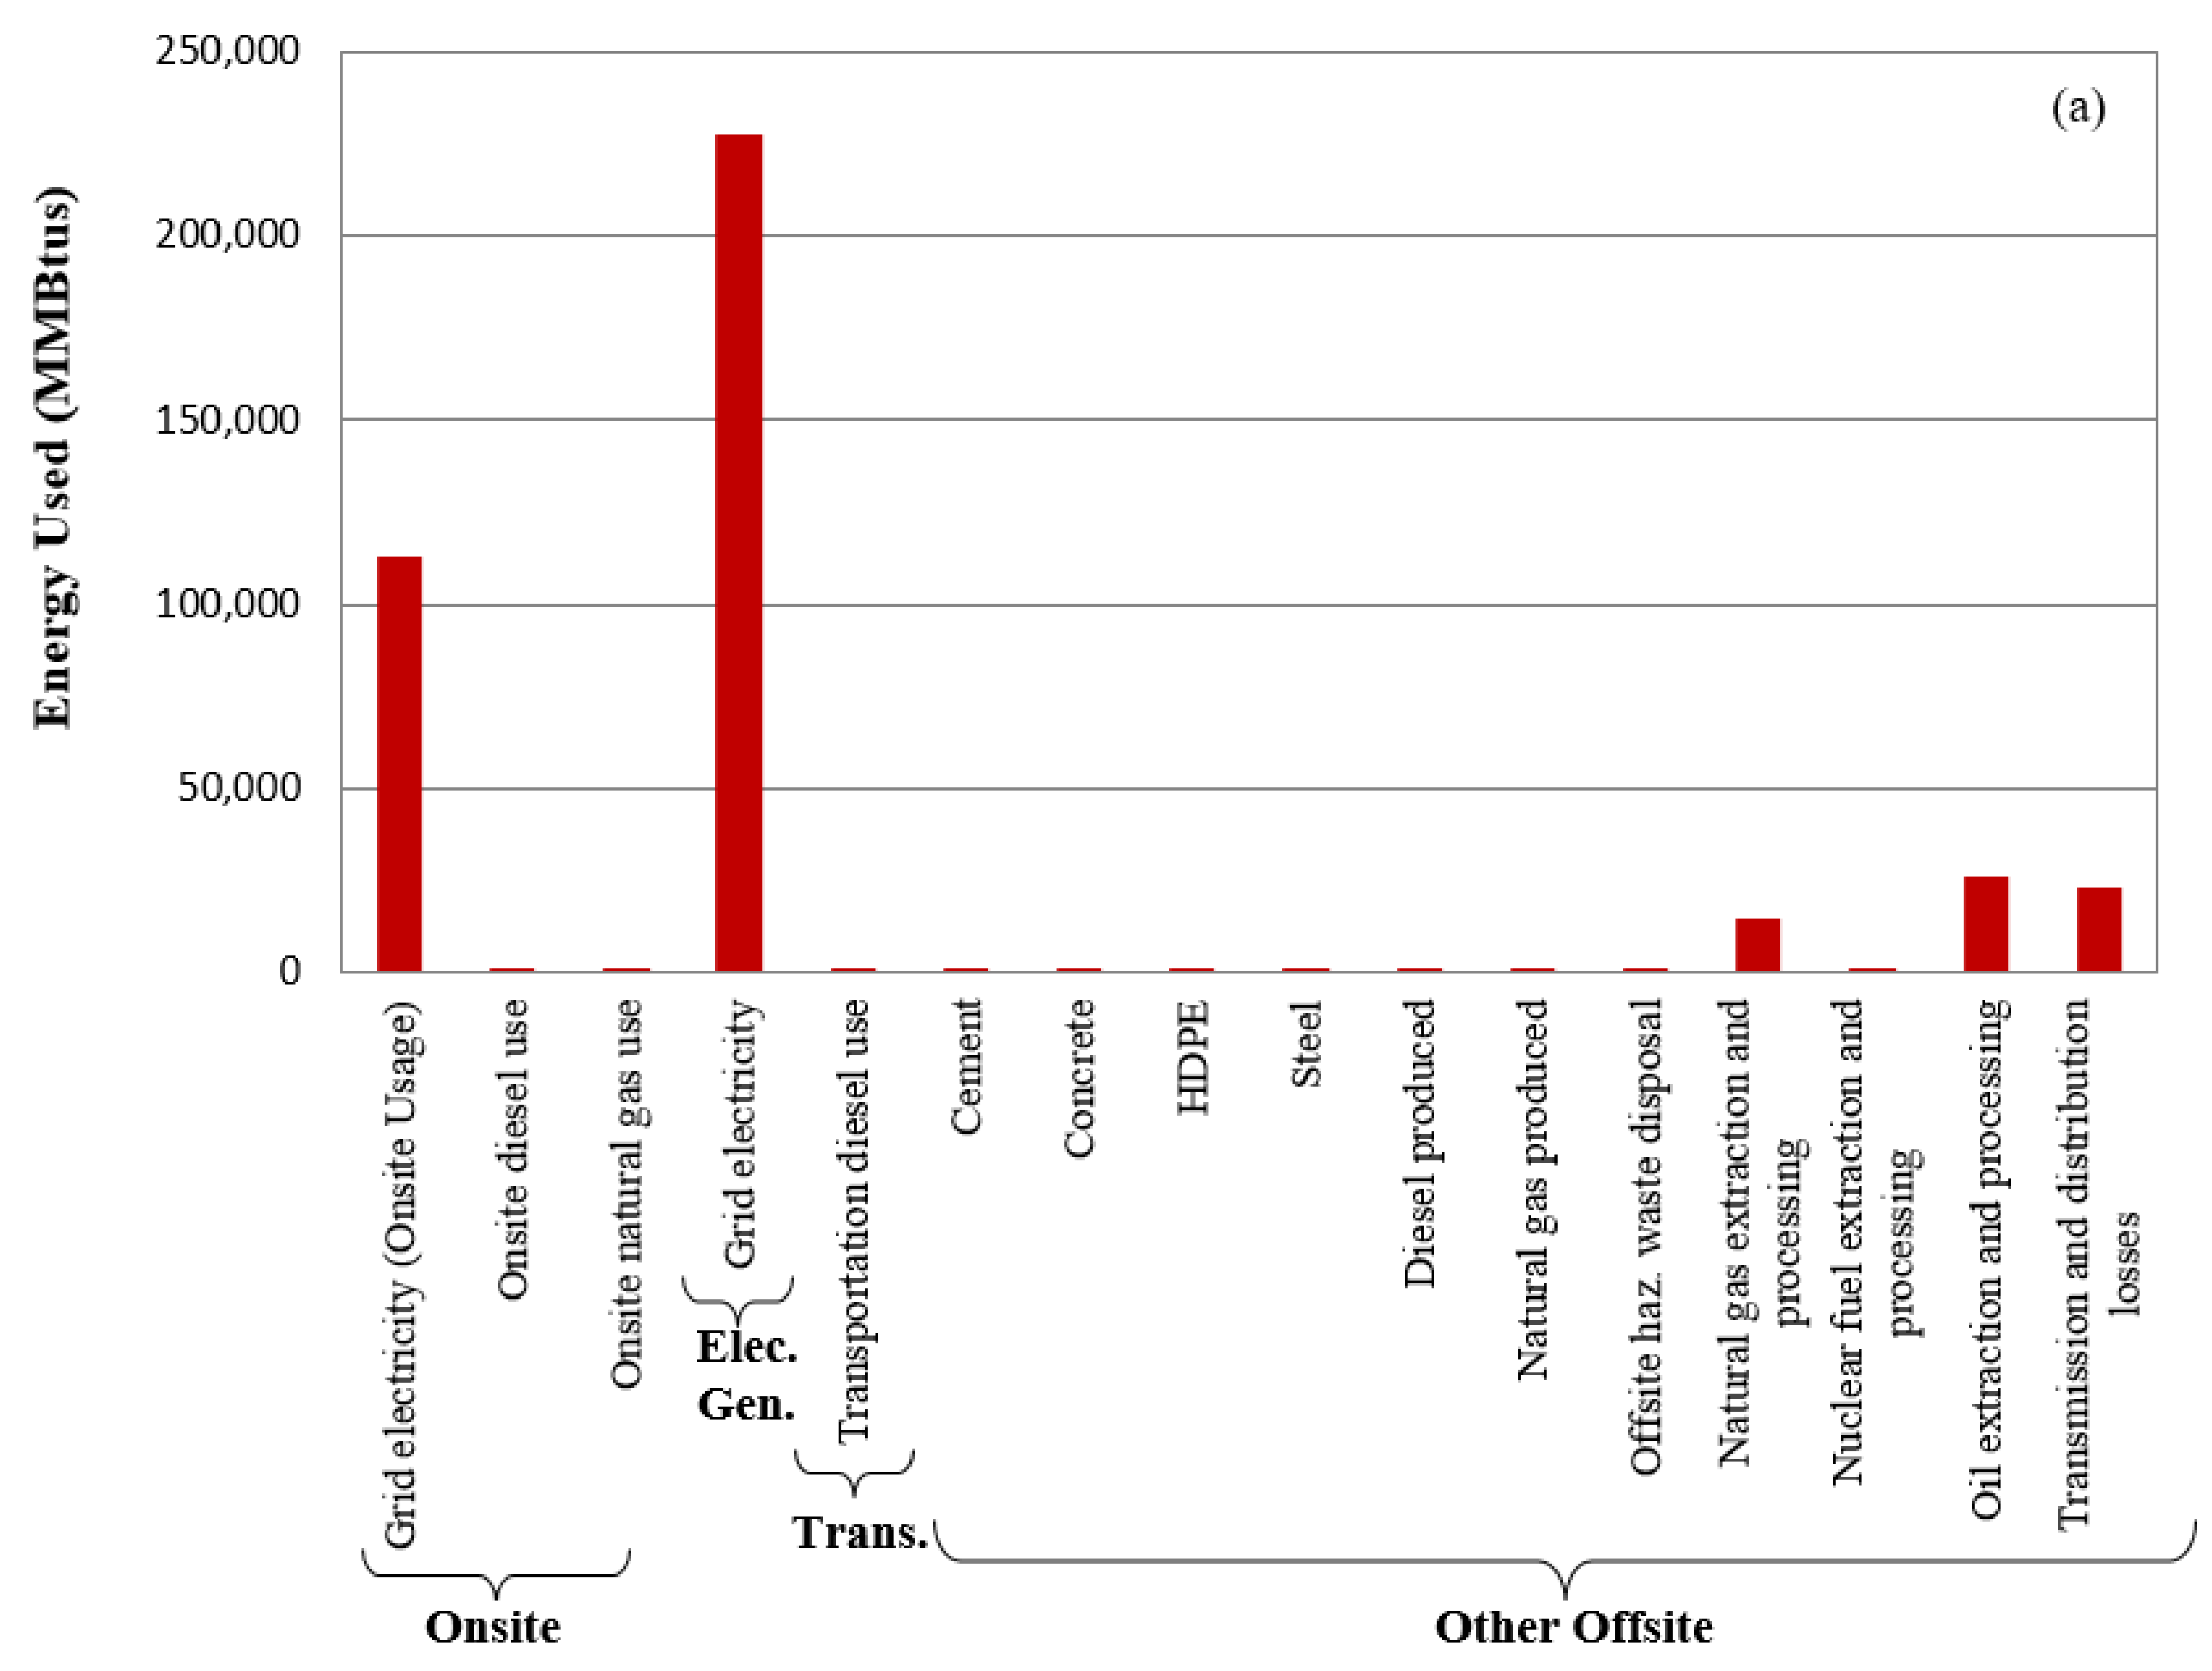
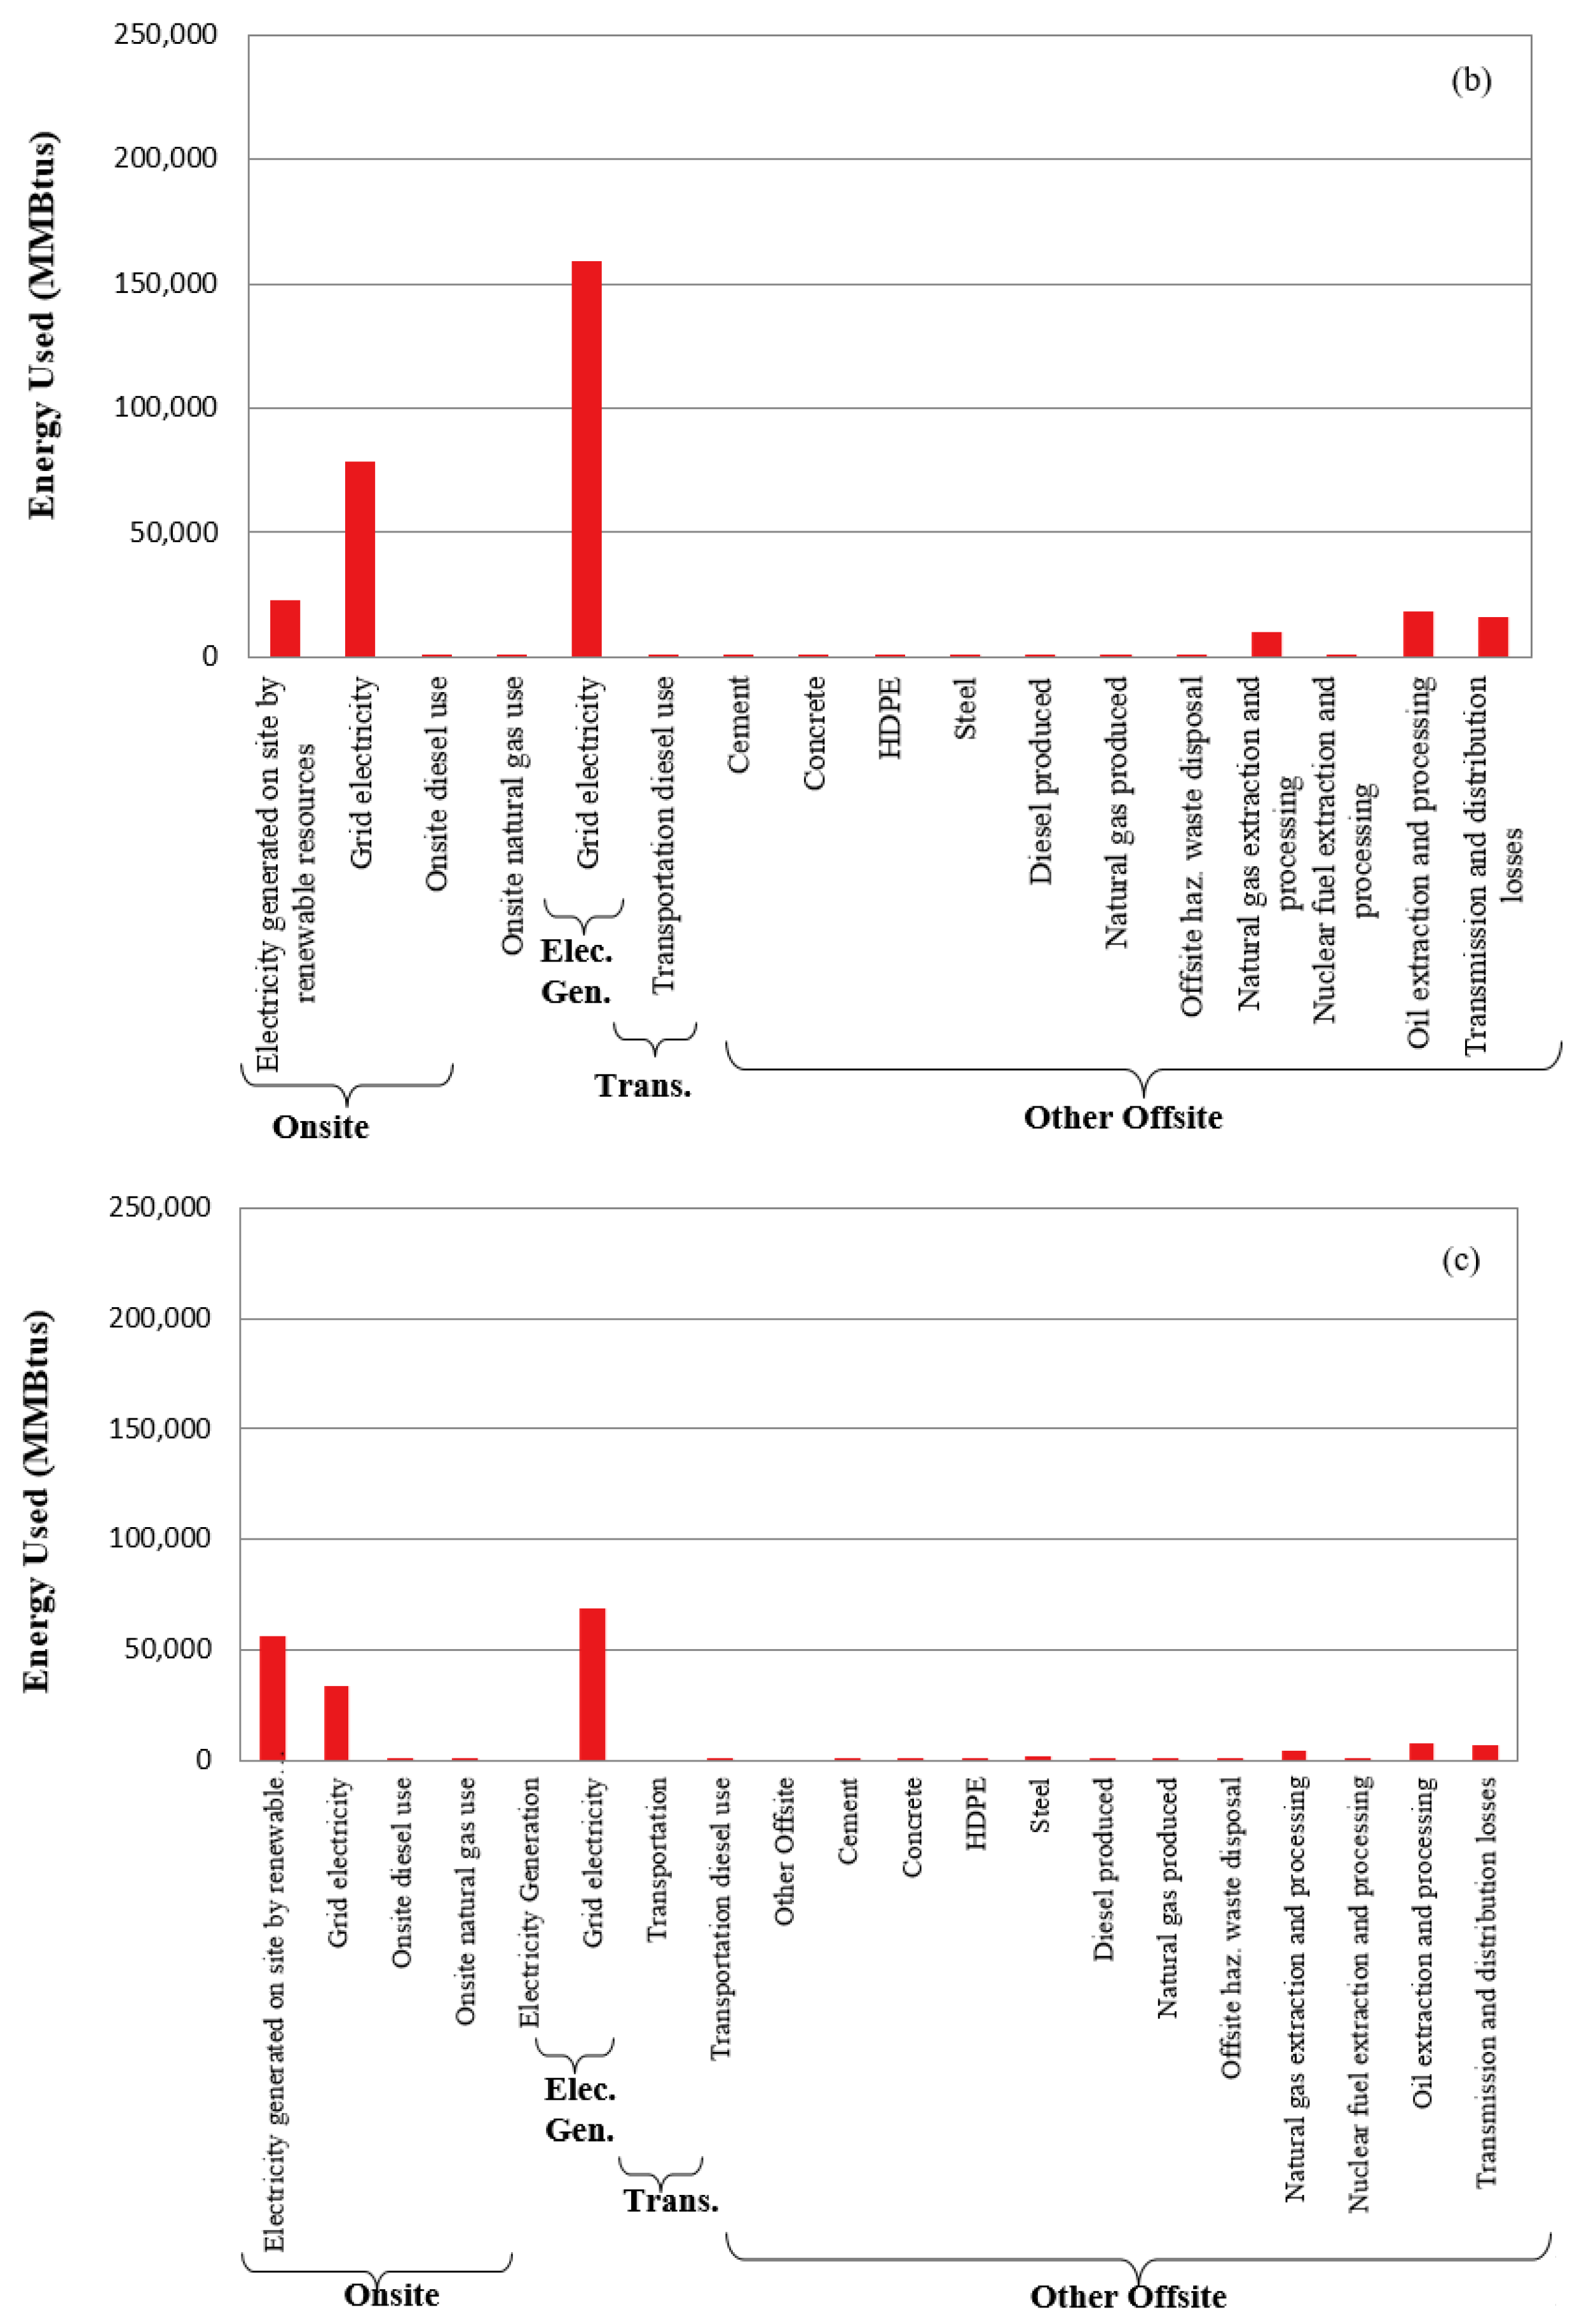
4.4.3. Energy Metrics
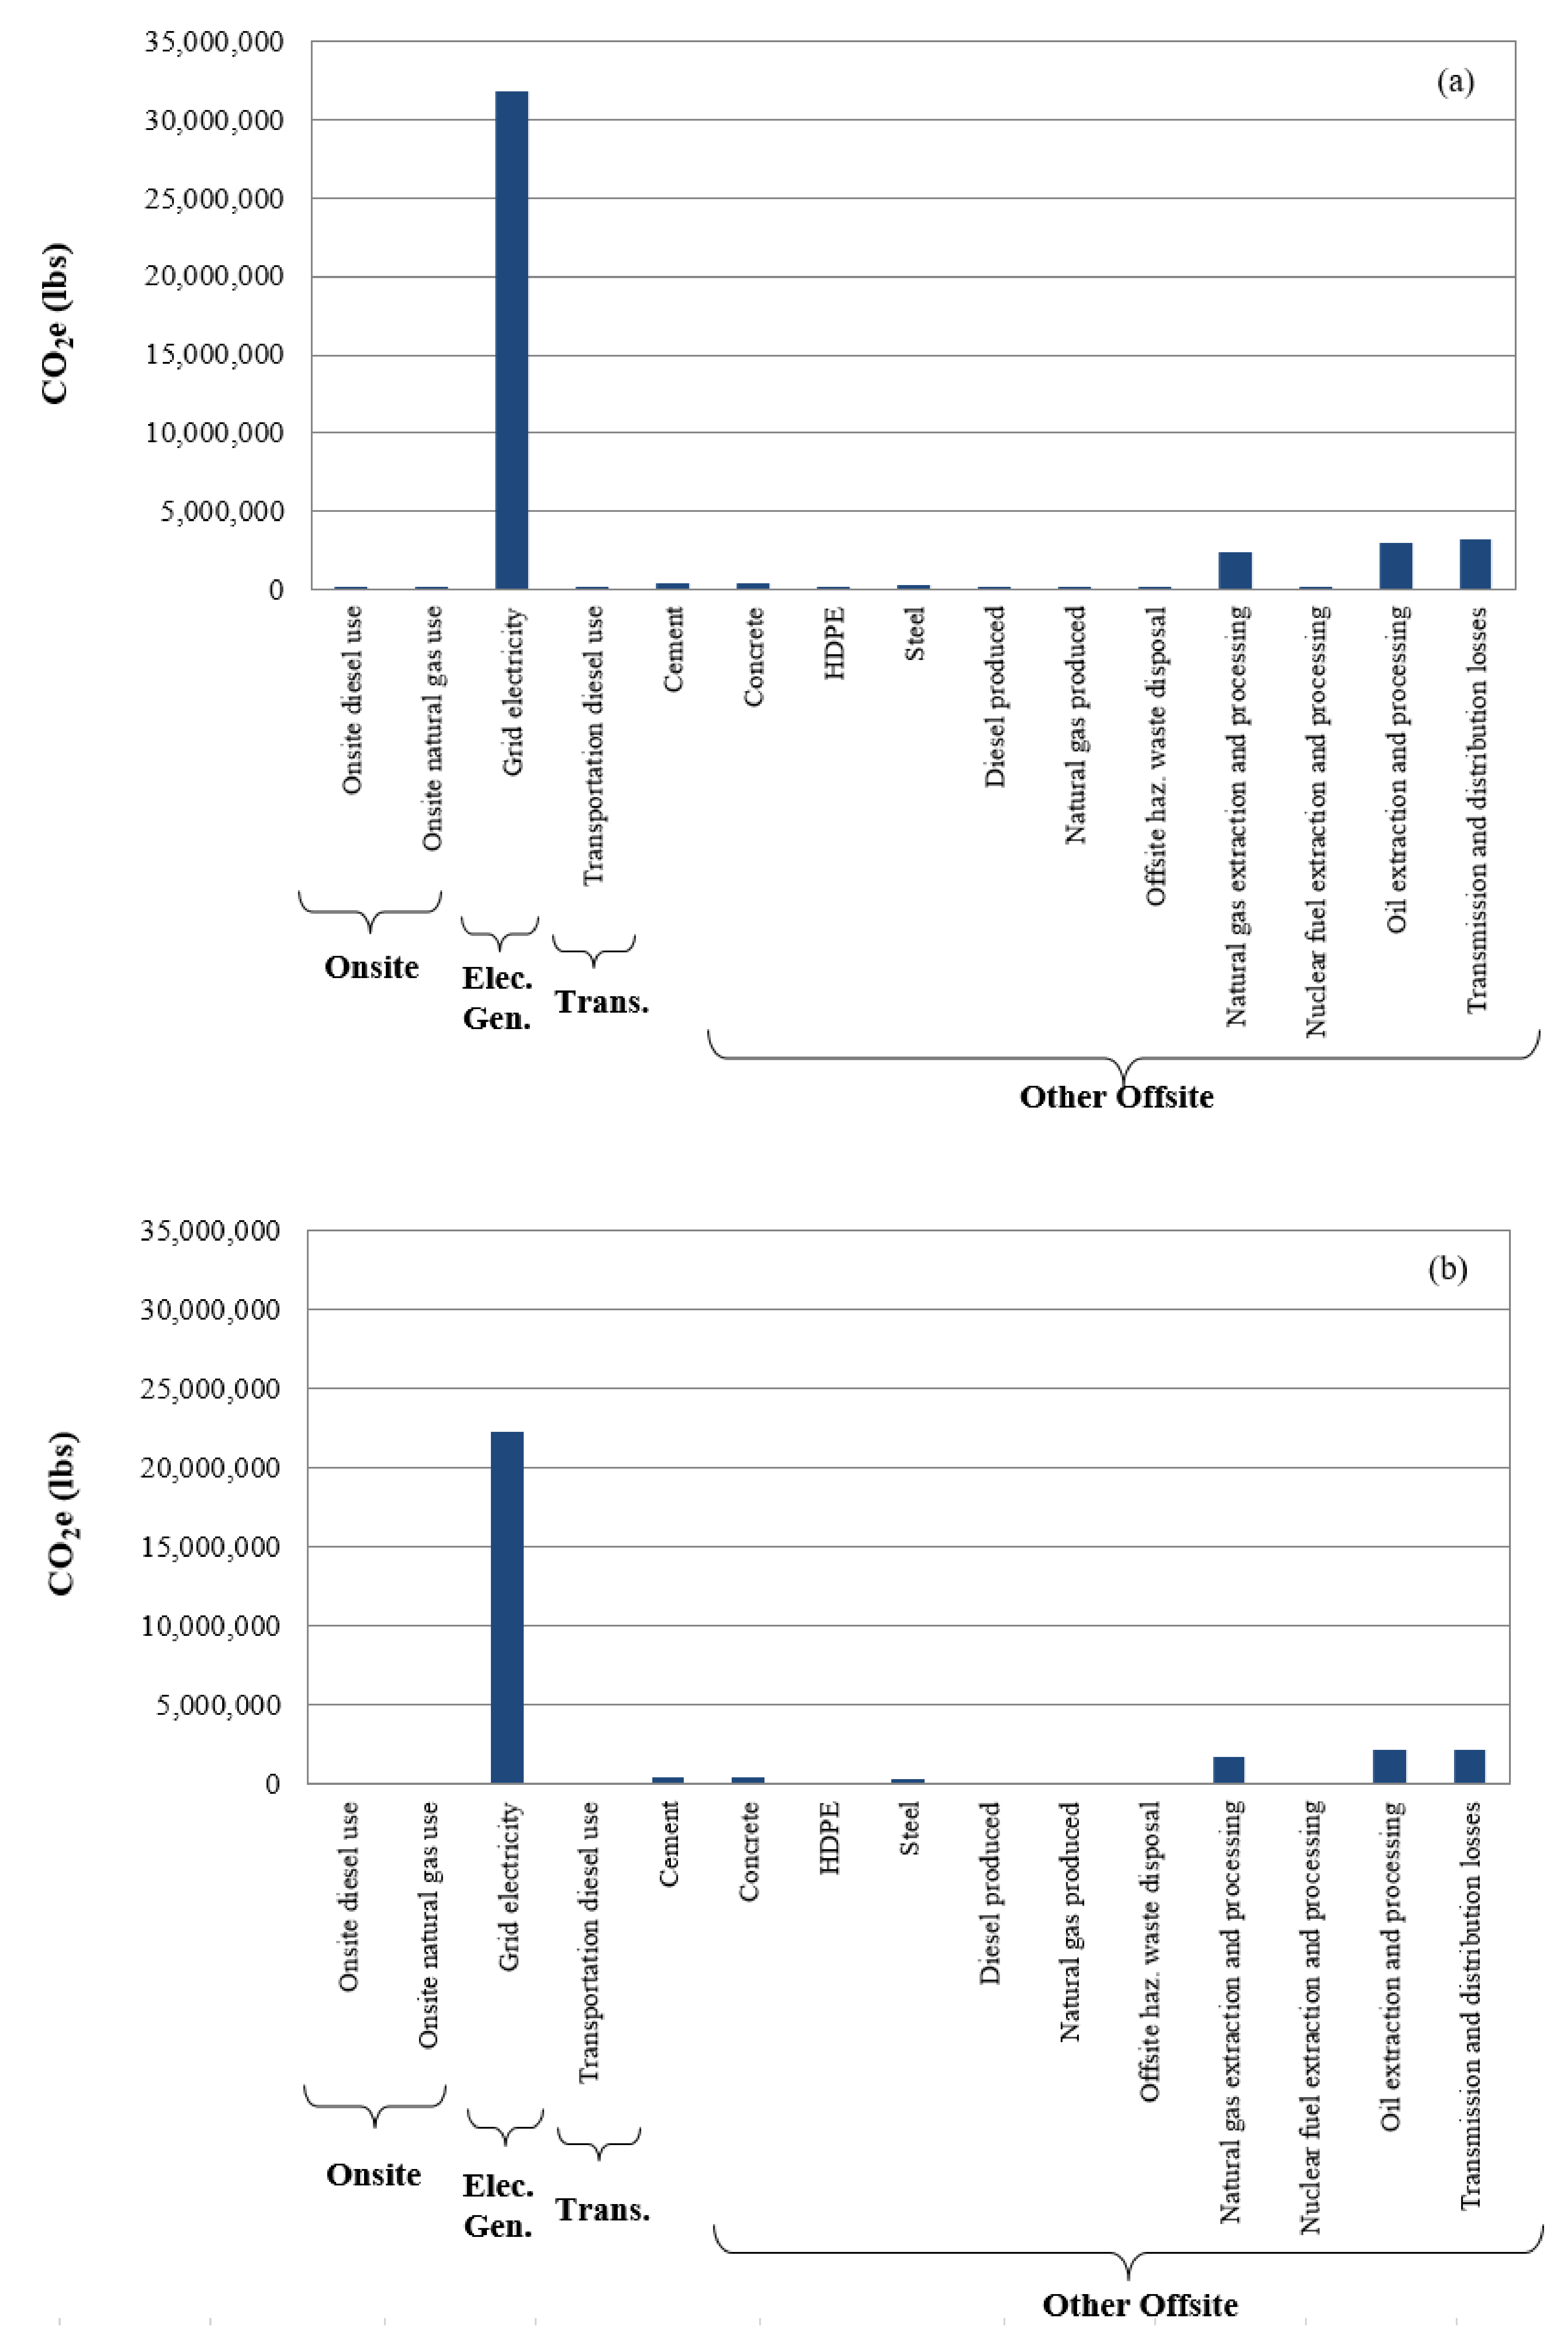
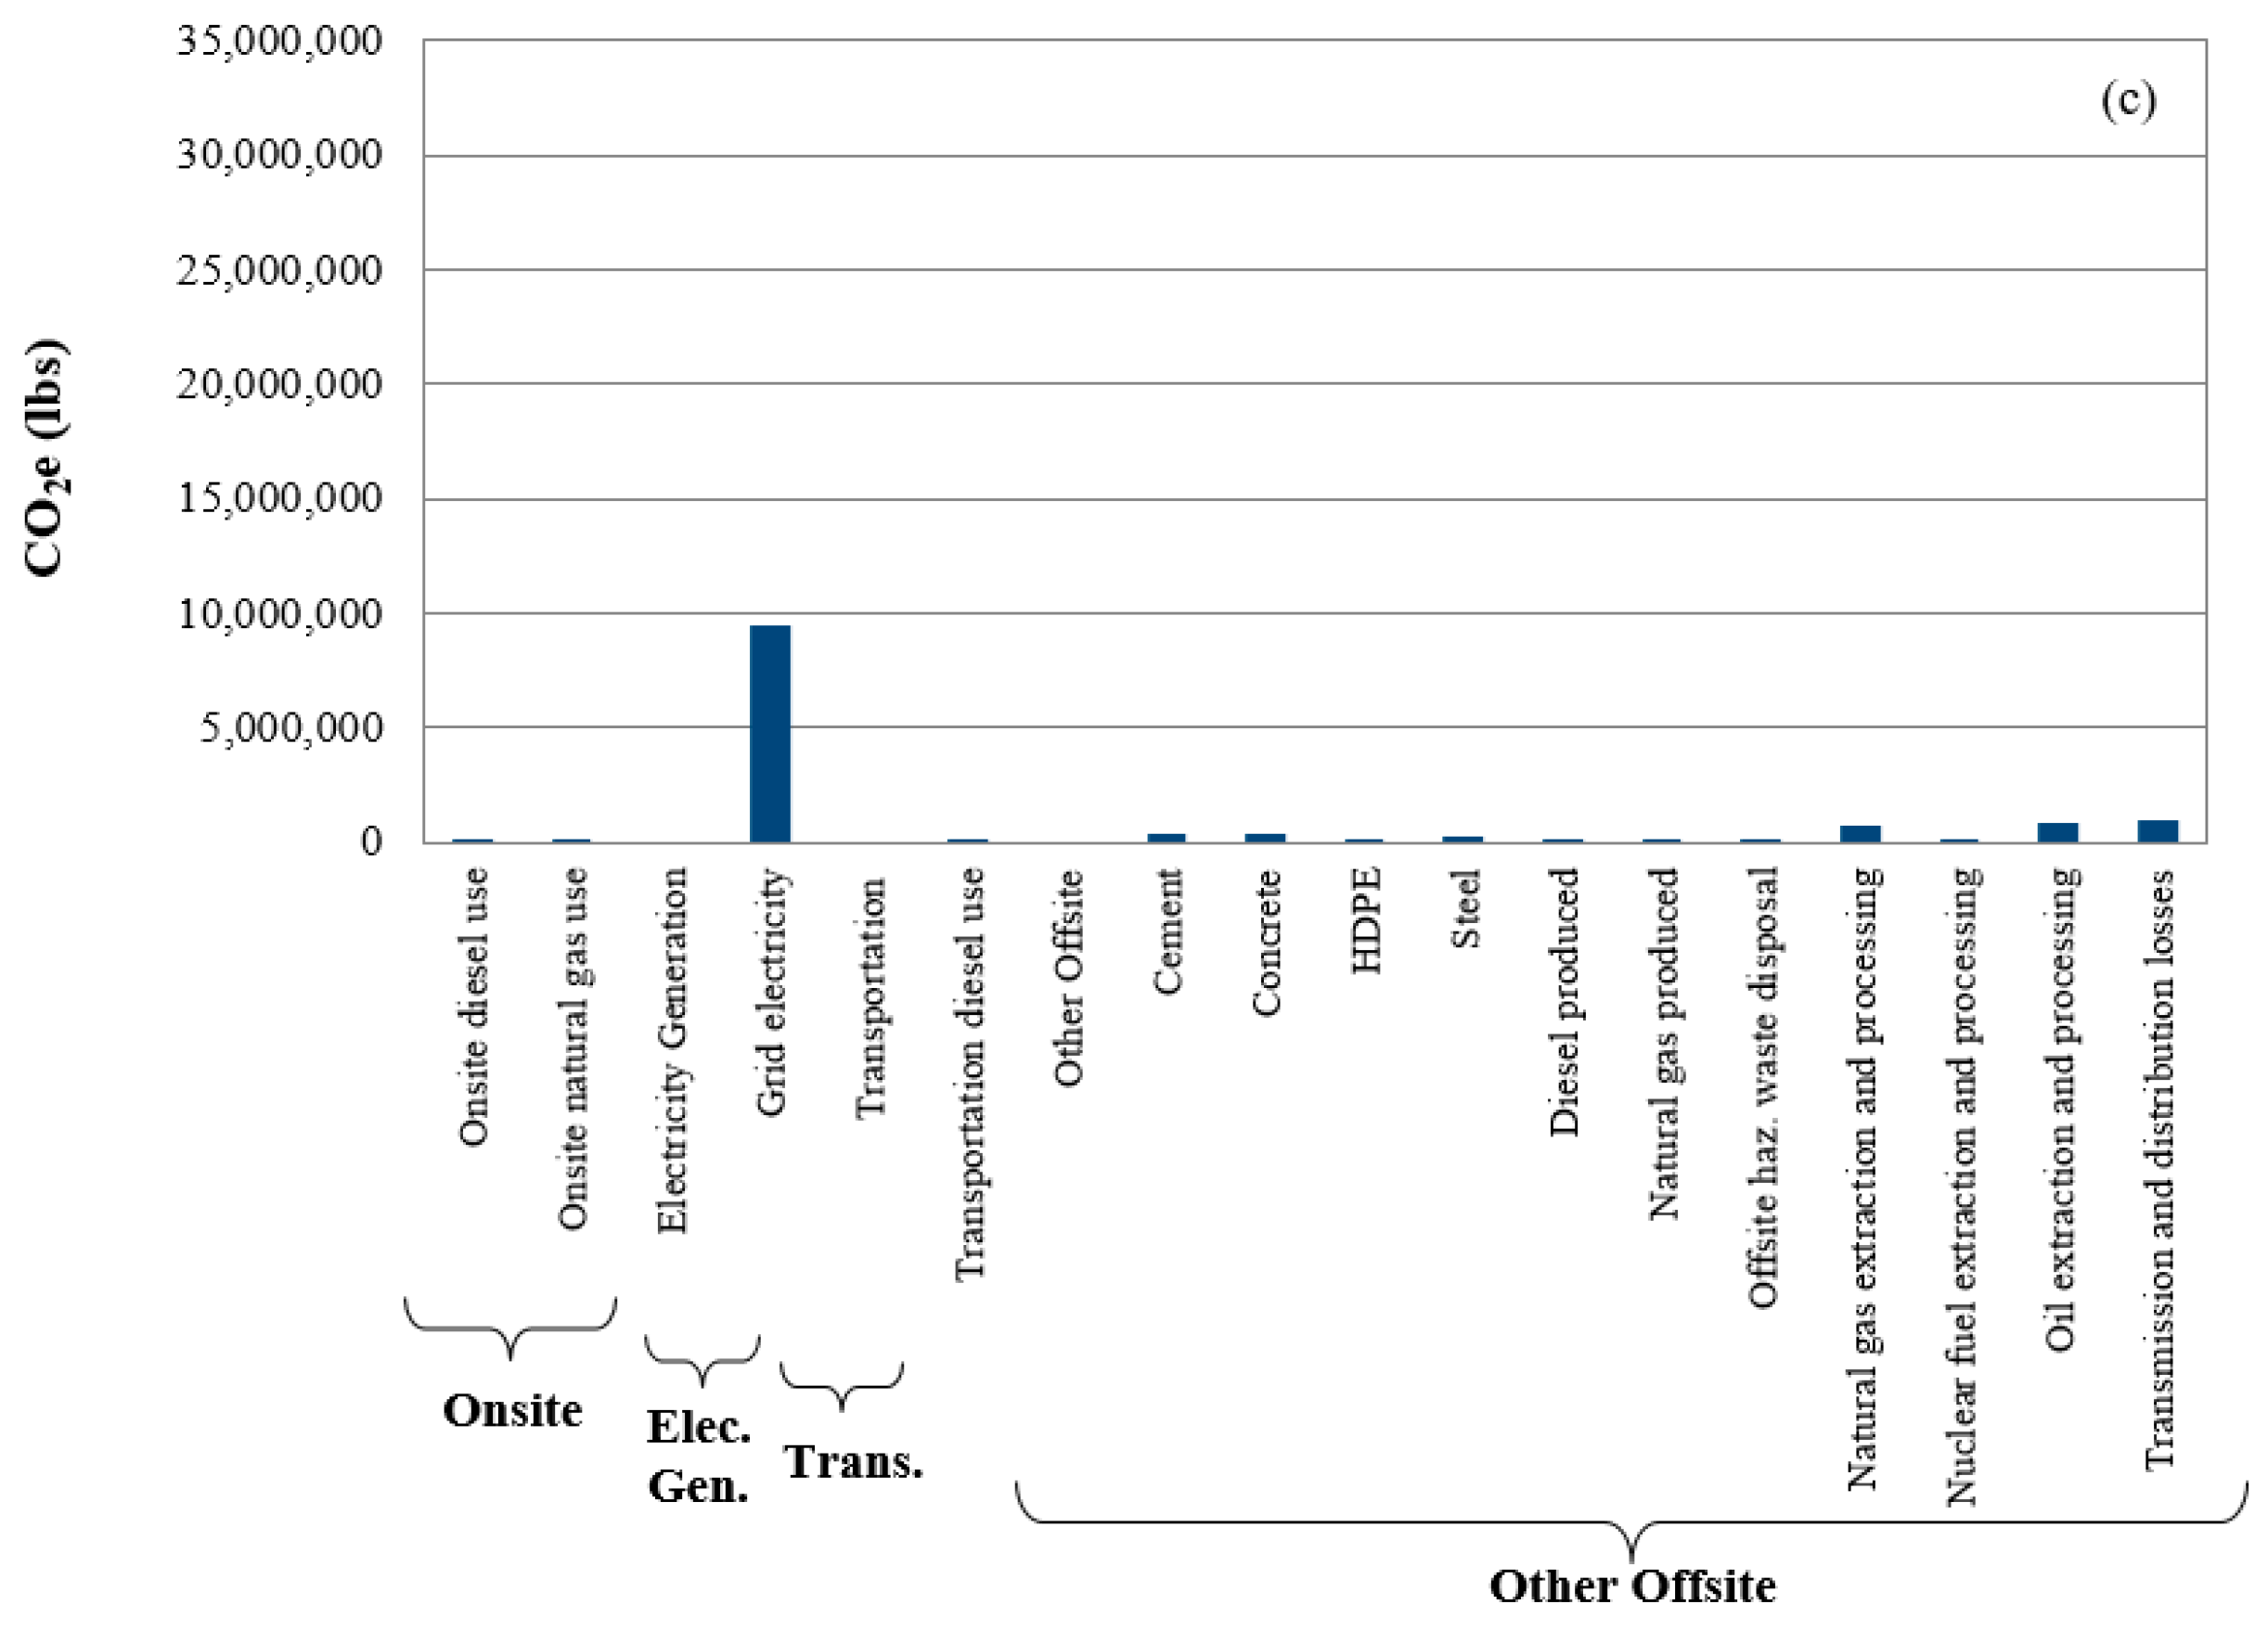
4.4.4. Air Metrics
4.4.5. Land and Ecosystem
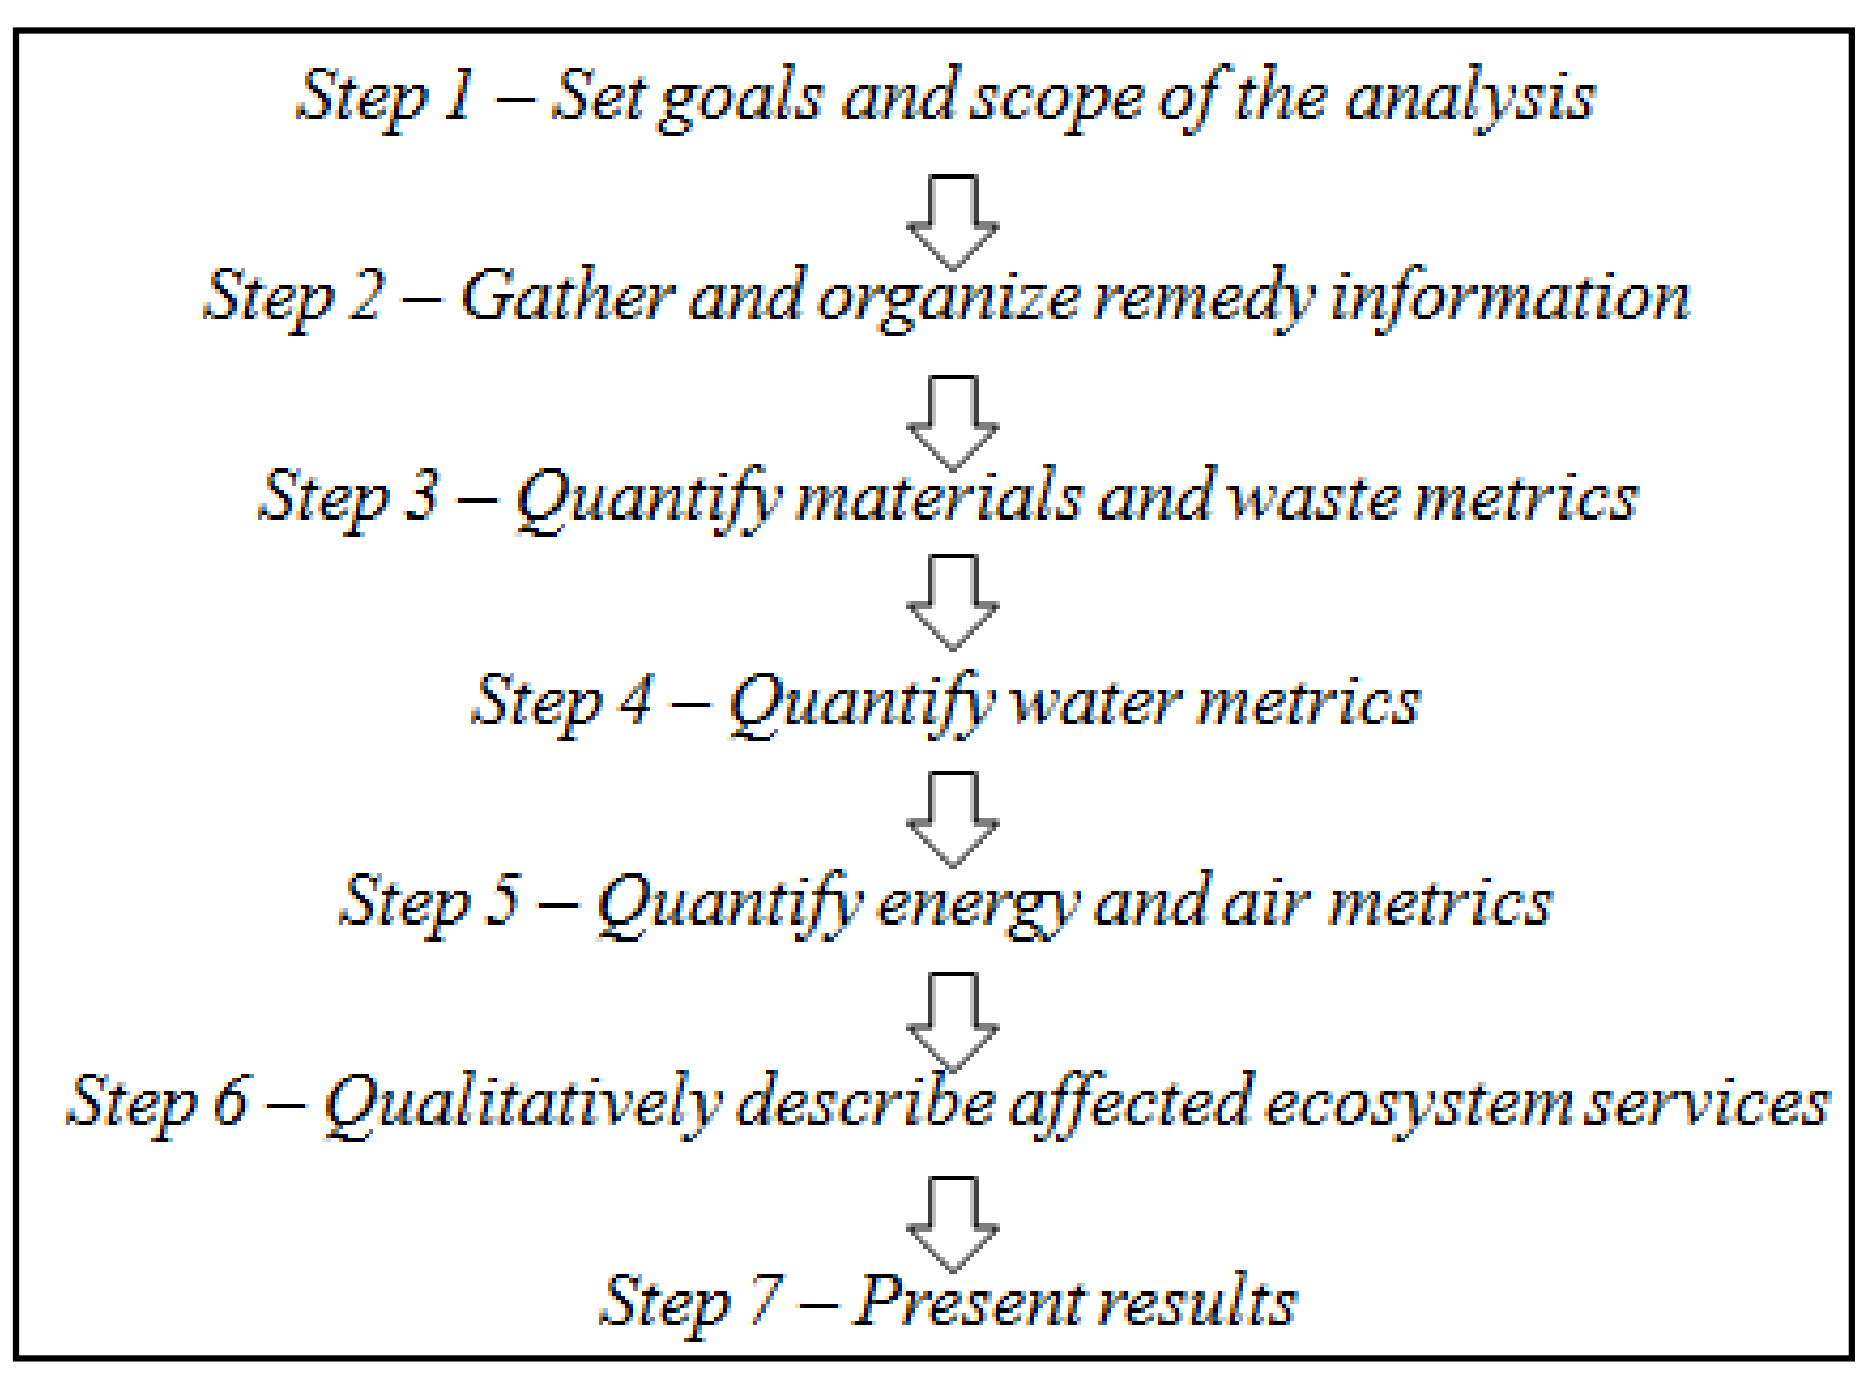
4.5. Footprint Methodology
5. Results and Discussions
6. Conclusions and Future Work
Author Contributions
Funding
Institutional Review Board Statement
Informed Consent Statement
Data Availability Statement
Conflicts of Interest
Nomenclature
| Symbols | Definition |
| kW | Kilo Watt |
| kWh | Kilo Watt Hour |
| HP | Horsepower |
| Btu | British thermal unit |
| gptm | Gallons per ton-mile |
| mpg | Miles per gallon |
| gal | Gallon |
| MMBtu | Metric Million British Themral Unit |
| MWh | Mega Watt Hour |
| lbs | Pound |
References
- Islam, M.; Sahadath, M. Prediction of Potential Offsite TEDE, Excess Cancer Risk, Dominant Exposure Pathways and Activity Concentration for Hypothetical Onsite Soil Contamination At the Proposed Rooppur Nuclear Power Plant. J. Nucl. Eng. Radiat. Sci. 2020. [Google Scholar] [CrossRef]
- Harwell, M.C.; Jackson, C.; Kravitz, M.; Lynch, K.; Tomasula, J.; Neale, A.; Mahoney, M.; Pachon, C.; Scheuermann, K.; Grissom, G.; et al. Ecosystem services consideration in the remediation process for contaminated sites. J. Environ. Manag. 2021, 285, 112102. [Google Scholar] [CrossRef] [PubMed]
- Hu, G.; Liu, H.; Rana, A.; Li, J.; Bikass, S.; Hewage, K.; Sadiq, R. Life cycle assessment of low-temperature thermal desorption-based technologies for drill cuttings treatment. J. Hazard. Mater. 2021, 401, 123865. [Google Scholar] [CrossRef] [PubMed]
- Carriger, J.F.; Parker, R.A. Conceptual Bayesian networks for contaminated site ecological risk assessment and remediation support. J. Environ. Manag. 2021, 278, 111478. [Google Scholar] [CrossRef] [PubMed]
- Brown, J.B.; Conder, J.M.; Arblaster, J.A.; Higgins, C.P. Assessing human health risks from per-and polyfluoroalkyl substance (PFAS)-impacted vegetable consumption: A tiered modeling approach. Environ. Sci. Technol. 2020, 54, 15202–15214. [Google Scholar] [CrossRef] [PubMed]
- Koiwanit, J.; Filimonau, V. Carbon footprint assessment of home-stays in Thailand. Resources. Conserv. Recycl. 2021, 164, 105123. [Google Scholar] [CrossRef]
- Morgan, D.R.; Styles, D.; Lane, E.T. Thirsty work: Assessing the environmental footprint of craft beer. Sustain. Prod. Consum. 2021, 27, 242–253. [Google Scholar] [CrossRef]
- Valencia, G.; Fontalvo, A.; Forero, J.D. Optimization of waste heat recovery in internal combustion engine using a dual-loop organic Rankine cycle: Thermo-economic and environmental footprint analysis. Appl. Therm. Eng. 2021, 182, 116109. [Google Scholar] [CrossRef]
- Bartie, N.J.; Cobos-Becerra, Y.L.; Fröhling, M.; Schlatmann, R.; Reuter, M.A. The resources, exergetic and environmental footprint of the silicon photovoltaic circular economy: Assessment and opportunities. Resources. Conserv. Recycl. 2021, 169, 105516. [Google Scholar] [CrossRef]
- Mayer, M.J.; Szilágyi, A.; Gróf, G. Ecodesign of ground-mounted photovoltaic power plants: Economic and environmental multi-objective optimization. J. Clean. Prod. 2021, 278, 123934. [Google Scholar] [CrossRef]
- Tennison, I.; Roschnik, S.; Ashby, B.; Boyd, R.; Hamilton, I.; Oreszczyn, T.; Owen, A.; Romanello, M.; Ruyssevelt, P.; Sherman, J.D.; et al. Health care’s response to climate change: A carbon footprint assessment of the NHS in England. Lancet Planet. Health 2021, 5, e84–e92. [Google Scholar] [CrossRef]
- Saget, S.; Costa, M.; Santos, C.S.; Vasconcelos, M.W.; Gibbons, J.; Styles, D.; Williams, M. Substitution of beef with pea protein reduces the environmental footprint of meat balls whilst supporting health and climate stabilisation goals. J. Clean. Prod. 2021, 28, 126447. [Google Scholar] [CrossRef]
- Young, R.J.; Howard, R. A Clean, Green Remediation; TechLaw, Inc.: USA; Available online: http://www.alterecho.com/artfiledownload/2/CleanGreenRemdiation.pdf (accessed on 12 December 2012).
- Reddy , K.R.; Adams, J.A. Towards Green and Sustainable Remediation of Contaminated Site. In Proceedings of the 6th International Congress on Environmental Geotechnics, New Delhi, India, 8–12 November 2010; pp. 1222–1227. [Google Scholar]
- Dellens, A.D. Green Remediation and the Use of Renewable Energy Sources for Remediation Projects; Case Western Reserve University; U.S. Environmental Protection Agency (USEPA), August 2007. Available online: https://clu-in.org/download/studentpapers/Green-Remediation-Renewables-A-Dellens.pdf (accessed on 24 May 2021).
- U.S. Environmental Protection Agency. Technology News and Trends. May 2007. Available online: http://www.epa.gov/tio/download/newsltrs/tnandt0507.pdf (accessed on 4 January 2013).
- BP Global Press Release. BP Builds, Operates Largest Solar Power System on East Coast. 22 April 2003. Available online: http://www.bp.com/genericarticle.do?categoryId=2012968&contentId=2001546 (accessed on 6 January 2013).
- Pagano, M. A Low Impact Technology Chemical Oxidation, Bioremediation and Groundwater Reinjection Analysed with SiteWiseTM and SEFA. Relazione tecnico-scientifica in attesa di pubblicazione agli Atti del Convegno Ecomondo 2018 edito da Maggioli Editore. 2018, p. 11. Available online: https://www.ecosurvey.it/wp-content/uploads/2018/11/Ecomondo-2018_Paper_impacts.pdf (accessed on 24 May 2021).
- US Environmental Protection Agency (USEPA). Green Remediation: Incorporating Sustainable Environmental Practices into Remediation of Contaminated Sites; US Environmental Protection Agency, April 2008; EPA 542-R-08-002. Available online: https://www.epa.gov/sites/production/files/2015-04/documents/green-remediation-primer.pdf (accessed on 24 May 2021).
- US Environmental Protection Agency (USEPA). Methodology for Understanding and Reducing a Project’s Environmental Footprint; US Environmental Protection Agency, February 2012; EPA 542-R-12-002. Available online: www.cluin.org/greenremediation/methodology (accessed on 24 May 2021).
- Sustainable Development Policy Institute (SDPI). Mapping of Chemical Contaminated Sites in Pakistan. 2010. Available online: http://www.sdpi.org/research_programme/researchproject-18-12-31.html (accessed on 25 December 2012).
- Meegoda, J.N.; Hu, L. A Review of Centrifugal Testing of Gasoline Contamination and Remediation. Int. J. Environ. Res. Public Health 2011, 8, 3496–3513. [Google Scholar] [CrossRef]
- US Environmental Protection Agency (USEPA). Air Pollution Control Orientation Course. January 2010. Available online: http://www.epa.gov/apti/course422/ap5.html (accessed on 6 January 2013).
- Munawar, H.S.; Khan, S.I.; Qadir, Z.; Kouzani, A.Z.; Mahmud, M.A.P. Insight into the Impact ofCOVID-19 on Australian Transportation Sector: An Economic and Community-Based Perspective. Sustainability 2021, 13, 1276. [Google Scholar] [CrossRef]
- Labianca, C.; De Gisi, S.; Picardi, F.; Todaro, F.; Notarnicola, M. Remediation of a Petroleum Hydrocarbon-Contaminated Site by Soil Vapor Extraction: A Full-Scale Case Study. Appl. Sci. 2020, 10, 4261. [Google Scholar] [CrossRef]
- Farhat, S.K.; Adamson, D.T.; Gavaskar, A.R.; Lee, S.A.; Falta, R.W.; Newell, C.J. Vertical Discretization Impact in Numerical Modeling of Matrix Diffusion in Contaminated Groundwater. Groundw. Monit. Remediat. 2020, 40, 52–64. [Google Scholar] [CrossRef]
- Alternate Energy (AET) Pakistan. Solar Energy Potential in Pakistan. 2012. Available online: http://aetisb.com/?page_id=256 (accessed on 6 January 2013).
- Global Energy Network Institute (GENI). Wind Energy Potential in Pakistan. September 2009. Available online: http://www.geni.org/globalenergy/library/renewable-energy-resources/world/asia/wind-asia/wind-pakistan.shtml (accessed on 6 January 2013).


| Material and Use | Units | Quantity | Conversion Factor to lbs | % Recycled or Reused Content | Quantity (lbs) | |
|---|---|---|---|---|---|---|
| Virgin | Recycled | |||||
| Refined Materials | ||||||
| Well-PV casing and grout | 0 | 0 | ||||
| Wells-Screen | 0 | 0 | ||||
| Piping and Conduit | ft | 3000 | 7.5 | 0% | 22,500 | 0 |
| Building Steel | ft3 | 240,000 | 1 | 55% | 108,000 | 132,000 |
| Concrete Reinforcing Steel | ft2 | 40,000 | 1.3 | 55% | 23,400 | 28,600 |
| Cement Portion of Concrete | ft3 | 20,000 | 22 | 20% | 352,000 | 88,000 |
| Process Equipments | 0 | 0 | ||||
| Process Controls | 0 | 0 | ||||
| 0 | 0 | |||||
| Unrefined Materials | ||||||
| Well-Sand Pack | 0 | 0 | ||||
| Aggregate for Concrete | ft3 | 20,000 | 0.0575 | 0% | 1150 | 0 |
| Waste Disposal (tons) | ||||||
| Hazardous Waste | ||||||
| 2600 tons of Hazardous Waste in the form of Sludge | 2600 | |||||
| Water Usage | ||||||
| Water Resource | Description of Quality of Water Used | Volume Used (1000 gallons) | Uses | Fate of Used Water | ||
| Extracted groundwater #1 | Shallow Aquifer, Marginal Quality | 11,000,000 | Treatment | Creek | ||
| Location: | ||||||
| Aquifer: | ||||||
| Labor, Mobilizations, Mileage, and Fuel | ||||||
| Participant | Crew Size | Number of Days Worked | Hours Worked Per Day | Total Hours Worked | Number of Roundtrips to Site | |
| SGS Pakistan | 20 | 90 | 8 | 14,400 | 100 | |
| Roundtrip Miles to Site | Mode of Transport. | Fuel Type | Total Miles | Fuel Usage Rate | Total Fuel Used (gal) | |
| 7.2 | Bus | Diesel | 720 | 96 | 8 | |
| On-Site Equipment Use, Mobilization, and Fuel Usage | ||||||
| Equipment Type * | HP | Load Factor | Equip. Fuel Type | Units of Fuel Used per Hour | Total Hours Operated | |
| Drilling-medium rig (150 HP) | 150 | 1% | Diesel | 0.05625 | 320 | |
| Gallons of Fuel Used On-Site | Number of Roundtrips to Site | Roundtrip Miles to Site | Total Miles Transported | Transport Fuel Type | Fuel Usage Rate | Total Fuel Used for Transport (gal) |
| 18 | 1 | 7.2 | 7.2 | Diesel | 6 | 1.2 |
| On-Site Electricity Use | ||||||
| Equipment Type | HP | % Full Load | Efficiency (%) | Electrical Rating (kW) | Hours Used | Energy Used (kWh) |
| Six 0.75 hp extraction pump | 4.5 | 80% | 65% | 4.131692308 | 1800 | 7437.046154 |
| Two 1 hp discharge pumps | 2 | 80% | 75% | 1.591466667 | 1800 | 2864.64 |
| On-Site Natural Gas Use | ||||||
| Equipment Type | Power Rating (btu/hr) | Efficiency | Total Hours Used | Btus of Gas Required | Total ccf Used | |
| Building Heat | 200,000 | 80% | 2000 | 500,000,000 | 4854.368932 | |
| Materials Use (including Potable Water) and Transportation | ||||||
| Material Type or Public Water | Unit | Quantity | Tons | Default One-Way Miles | ||
| Cement | dry-lb | 440,000 | 220 | 500 | ||
| Steel | lb | 292,000 | 146 | 500 | ||
| HDPE | lb | 22,500 | 11.25 | 500 | ||
| Concrete | lb | 2,300,000 | 1150 | 25 | ||
| Site-Spec. One-Way Distance (miles) * | Number of One-way Trips to Site | Mode of Transport. | Fuel Type | Fuel Usage Rate (gptm or mpg) | Total Fuel Used (gallons) | |
| 25 | 1 | Truck (mpg) | Diesel | 6 | 4.2 | |
| 25 | 1 | Truck (mpg) | Diesel | 6 | 4.2 | |
| 25 | 1 | Truck (mpg) | Diesel | 6 | 4.2 | |
| 25 | 1 | Truck (mpg) | Diesel | 6 | 4.2 | |
| Waste Transportation and Disposal | ||||||
| Waste Destination | Unit | Quantity | Tons | Default One-Way Miles | ||
| Hazardous waste landfill | tons | 2600 | 2600 | 500 | ||
| Site-Spec. One-Way Distance (miles) | Number of One-way Trips to Site | Mode of Transport. | Fuel Type | Fuel Use Rate (gptm or mpg) | Total Fuel Use (gallons) | |
| 30 | 1 | Truck (mpg) | Diesel | 6 | 5 | |
| Fuel Mix for Grid Electricity | ||||||
| Type | % of Total Used | |||||
| Conventional Energy | ||||||
| Coal | 0% | |||||
| Natural Gas | 27% | |||||
| Oil | 34% | |||||
| Nuclear | 6% | |||||
| Biomass | 0% | |||||
| Geothermal | 0% | |||||
| Hydro | 33% | |||||
| Solar | 0% | |||||
| Wind | 0% | |||||
| Other (enter information below) | 0% | |||||
| Total | 100% | |||||
| Core Element | Metric | Unit of Measure | |
|---|---|---|---|
| Materials and Waste | M&W-1 | Refined materials used on site | tons |
| M&W-2 | Percent of refined materials from recycled or waste material | percent | |
| M&W-3 | Unrefined materials used on site | tons | |
| M&W-4 | percent of unrefined materials from recycled or waste material | pecent | |
| M&W-5 | Onsite hazardous waste generated | tons | |
| M&W-6 | Onsite non-hazardous waste generated | tons | |
| M&W-7 | Percent of total potential onsite waste that is recycled or reused | percent | |
| Water | Onsite water use (by source) | ||
| W-1 | Source: Groundwater, Purpose: Treatment, Fate: Creek | millions of gallons | |
| Energy | E-1 | Total energy use | MMBtu |
| E-2 | Total energy voluntarily derived from renewable resources | ||
| E-2A | - Onsite generation or use and biodiesel use | MMBtu | |
| E-2B | - Voluntary purchase of renewable electricity | MWh | |
| E-2C | - Voluntary purchase of RECs | MWh | |
| Air | A-1 | Onsite Nox, Sox, and PM emissions | lbs |
| A-2 | Onsite HAP emissions | lbs | |
| A-3 | Total Nox, Sox, and PM emissions | lbs | |
| A-4 | Total HAP emissions | lbs | |
| A-5 | Total GHG emissions | tons CO2-e | |
| Land and Ecosystem | Qualitative Description | ||
| Core Element | Metric | Unit of Measure | Scenario 1 | Scenario 2 | Scenario 3 | |
|---|---|---|---|---|---|---|
| Materials and Waste | M&W-1 | Refined materials used on site | tons | 377 | 377 | 377 |
| M&W-2 | Percent of refined materials from recycled or waste material | percent | 33 | 33 | 33 | |
| M&W-3 | Unrefined materials used on site | tons | 1150 | 1150 | 1150 | |
| M&W-4 | percent of unrefined materials from recycled or waste material | pecent | 0 | 0 | 0 | |
| M&W-5 | Onsite hazardous waste generated | tons | 2600 | 2600 | 2600 | |
| M&W-6 | Onsite non-hazardous waste generated | tons | 0 | 0 | 0 | |
| M&W-7 | Percent of total potential onsite waste that is recycled or reused | percent | 0 | 0 | 0 | |
| Water | Onsite water use (by source) | |||||
| W-1 | Source: Groundwater, Purpose: Treatment, Fate: Creek | millions of gallons | 110,000 | 110,000 | 110,000 | |
| Energy | E-1 | Total energy use | MMBtu | 408,551 | 309,966 | 182,275 |
| E-2 | Total energy voluntarily derived from renewable resources | |||||
| E-2A | - Onsite generation or use and biodiesel use | MMBtu | 0 | 22,526 | 56,315 | |
| E-2B | - Voluntary purchase of renewable electricity | MWh | 0 | 3300 | 6600 | |
| E-2C | - Voluntary purchase of RECs | MWh | 0 | 0 | 0 | |
| Air | A-1 | Onsite Nox, Sox, and PM emissions | lbs | 55 | 55 | 55 |
| A-2 | Onsite HAP emissions | lbs | 0 | 0 | 0 | |
| A-3 | Total NOx, SOx, and PM emissions | lbs | 219,726 | 155,511 | 69,891 | |
| A-4 | Total HAP emissions | lbs | 1119 | 801 | 377 | |
| A-5 | Total GHG emissions | tons CO2-e | 41,741,757 | 29,609,307 | 13,432,707 | |
| Land and Ecosystems | Land and Ecosystem will be disturbed in terms of hazardous waste disposal offsite, depending upon the technique to be used in its disposal. | |||||
| CO2 Emissions | Total HAP Emission | Total NOx, SOx, PM Emissions | ||||
|---|---|---|---|---|---|---|
| Scenario | tons | % Reduction | lbs | % Reduction | lbs | % Reduction |
| 1 | 41,741,757 | - | 1119 | - | 219,726 | - |
| 2 | 29,609,307 | 29 | 801 | 28 | 155,511 | 29 |
| 3 | 13,432,707 | 68 | 377 | 66 | 69,891 | 68 |
Publisher’s Note: MDPI stays neutral with regard to jurisdictional claims in published maps and institutional affiliations. |
© 2021 by the authors. Licensee MDPI, Basel, Switzerland. This article is an open access article distributed under the terms and conditions of the Creative Commons Attribution (CC BY) license (https://creativecommons.org/licenses/by/4.0/).
Share and Cite
Khan, M.A.A.; Qadir, Z.; Asad, M.; Kouzani, A.Z.; Parvez Mahmud, M.A. Environmental Footprint Assessment of a Cleanup at Hypothetical Contaminated Site. Appl. Sci. 2021, 11, 4907. https://doi.org/10.3390/app11114907
Khan MAA, Qadir Z, Asad M, Kouzani AZ, Parvez Mahmud MA. Environmental Footprint Assessment of a Cleanup at Hypothetical Contaminated Site. Applied Sciences. 2021; 11(11):4907. https://doi.org/10.3390/app11114907
Chicago/Turabian StyleKhan, Muhammad Azhar Ali, Zakria Qadir, Muhammad Asad, Abbas Z. Kouzani, and M. A. Parvez Mahmud. 2021. "Environmental Footprint Assessment of a Cleanup at Hypothetical Contaminated Site" Applied Sciences 11, no. 11: 4907. https://doi.org/10.3390/app11114907
APA StyleKhan, M. A. A., Qadir, Z., Asad, M., Kouzani, A. Z., & Parvez Mahmud, M. A. (2021). Environmental Footprint Assessment of a Cleanup at Hypothetical Contaminated Site. Applied Sciences, 11(11), 4907. https://doi.org/10.3390/app11114907