Article

Effects of H2S Loading Rate on the Performance of Reactive Absorption with Electrochemical Oxidation

1
Department of Land, Water, and Environmental Research, Korea Institute of Civil Engineering and Building Technology, 283 Goyangdae-Ro, Ilsanseo-Gu, Goyang-Si 10233, Korea
2
Department of Civil and Environmental Engineering, Sejong University, 209, Neungdong-Ro, Gwangjin-Gu, Seoul 05006, Korea
*
Author to whom correspondence should be addressed.
Appl. Sci. 2021, 11(11), 4867; https://doi.org/10.3390/app11114867
Submission received: 19 April 2021 / Revised: 14 May 2021 / Accepted: 21 May 2021 / Published: 25 May 2021
(This article belongs to the Section Environmental Sciences)

Abstract

:
The odor released from environmental facilities is recognized as a major problem in environmental industries. In this study, reactive absorption, using an electrolyzed water solution (electrolyzed water scrubber, EWS), was developed to treat the odorous gases H2S and NH3, which are representative odorous substances. In addition, a numerical model composed of mass transfer coefficients and zero-order kinetic constants was established to predict the performance of EWS. The model was verified through experiments and data fittings. In the experiments, the concentration of H2S varied from 500 to 2000 ppm, while NH3 was fixed at 500 ppm. The results revealed that the H2S removal rate varied depending on the inlet H2S concentration, but no changes were observed for NH3. The numerical model appropriately described the experimental results to further predict the performance of EWS. The model prediction results for the shock loading of H2S indicated that a 100% removal rate can be achieved by increasing the current density to 70 mA cm−2 or higher. Finally, the EWS can be used to reduce the odor, owing to its flexible operation that responds to fluctuating loading rates.

1. Introduction

Odors emitted from environmental facilities, such as livestock farms, sewage treatment plants, and food waste treatment facilities, are unpleasant and prompt complaints from the adjacent residents [1,2,3]. In particular, the generation of highly concentrated odors can cause discomfort, even with a small leak. Therefore, people detest construction of environmental facilities in proximity to their residences and their backyards. In general, odor gases emitted from such facilities include various substances, such as sulfur and nitrogen compounds, acetaldehyde, and organic acids [4]. Conventional technologies, such as adsorption and absorption, cannot suppress the problems generated due to mixed odor gases [5]. To overcome this setback, multistage chemical scrubbing technology is widely used [6]. Chemical scrubbing maximizes the absorption performance by adjusting the pH, using chemicals to absorb the target pollutants or by inducing the oxidation of the absorbed pollutants via the addition of oxidants. However, the use of chemicals, such as HCl, H2SO4, and NaOH, for wet scrubbing can incur significant costs due to waste treatment solutions. Furthermore, determining the appropriate dosage of chemicals is difficult and the storage of chemicals requires huge containers [7].
In this study, a reactive absorption process, which combines water scrubbing and electrochemical oxidation (electrolyzed water scrubber, EWS), was developed to solve the drawbacks of chemical scrubbing. Electrolyzing water generates reactive chlorine species (RCS), such as HOCl, by applying an electrical potential to water containing Cl electrolyte [8]. Electrochemical treatment is widely used in wastewater treatment processes [9]. If electrolyzed water is used as an aqueous solution, the absorption capacity of the aqueous solution can be retained by oxidizing pollutants in the solution. Therefore, EWS supports low costs and easy maintenance, compared to chemical scrubbing. Moreover, electrochemical generation of the RCS can be automated and controlled by adjusting the energy applied [10]. We tried to apply electrochemical oxidation to eliminate air contaminants. H2S and NH3, which are representative odorous substances, were chosen as targets substrates to remove.
In a previous study, it was observed that during the simultaneous introduction of H2S and NH3, RCS first oxidized H2S, followed by NH3 [11]. In addition, NH3 was easily absorbed, even without electrochemical oxidation because it has a higher water solubility than H2S. In other words, for EWS, the performance of the entire reactor mainly depends on the inlet concentration of H2S. A model to describe the experimental results and predict the removal performance of hydrogen sulfide at fixed inlet concentrations of H2S and NH3 was established in this study. The model was validated at various inlet concentrations, and EWS performance was predicted by varying the inlet concentration of H2S, while the concentration of NH3 was fixed. Several experiments under variable inlet conditions were conducted. Then, a numerical model for predicting EWS performance under various H2S inlet concentrations was developed.
Modeling reactive absorption is significantly more complex than physical absorption. This is because both mass transfer and chemical reactions occur simultaneously. Particularly, the characteristics of chemical reaction, including reversibility and the reaction rate, make the modeling of reactive absorption more complex [12]. To obtain an accurate model for reactive absorption, a comprehensive understanding is required concerning heat transfer and hydraulics in addition to mass transfer and chemical reaction rates. Simulation of a huge reactor requires differentiation in several subdivisions [13].
In the conventional approach, the partial differential equation (PDE) is generally used for numerical analysis. Kenig et al. [14] suggested a model to describe reactive absorption processes, using the Maxwell–Stefan equations. The model is comprised of several terms of film transport, reversible chemical reactions, the mass transfer between multicomponents, thermodynamics and hydrodynamics [14]. Ghaemi et al. [15] used a PED model for the reactive absorption of carbon dioxide into ammonia solution based on unsteady-state and non-equilibrium conditions. Various equations, including mass, charge, and ionic balance equations are used in such non-equilibrium models. Non-equilibrium models describe rigorously by solving complex equations [15]. However, users unfamiliar with numerical analyses, such as industrial engineers, have difficulties in using these models [16].
To easily predict and design reactive absorption, equilibrium models, which are comprised of several ordinary differential equations (ODE), are commonly applied. Kerr [16] suggested a method to describe the performance of packed columns with chemical reactions using ODEs. He converted PEDs to ODEs using various equations, such as those related to mass transfer and the chemical reaction rate [16]. In addition, many models for unit processes of carbon capture have been reported recently, such as a model based on mass and energy balance [17], and a model using dimensionless variables and parameters [18].
In this study, a numerical model for EWS, which is composed of a mass transfer coefficient and a zero-order kinetic constant, was developed for ease of use for engineers. In the model, mass transfer represents the rate of transfer from the gas to liquid phase. Various factors affect the rate, such as the superficial gas velocity and pressure. The mass transfer rate can be expressed using the mass transfer coefficient. For electrochemical oxidation, pollutants are oxidized by both direct and indirect oxidation mechanism. The removal rate or the type of oxidant generated are influenced by the current density, electrolyte type, and electrode types [19]. However, EWS performance cannot be evaluated by separating the direct and indirect oxidation effects. The performance can be expressed by the kinetic constant, which represents the oxidation rate of the pollutants.
The aim of this study was to develop a model for predicting EWS performance, using simple ODE consisting of mass transfer coefficients and kinetic constants. A model was developed to predict the performance and derive an appropriate operation plan of EWS. The experiments were performed using a lab-scale experimental setup, and a model was established and validated by estimating the parameters to accurately simulate the experimental results. Additionally, the performance of the EWS was predicted, using this model.

2. Materials and Methods

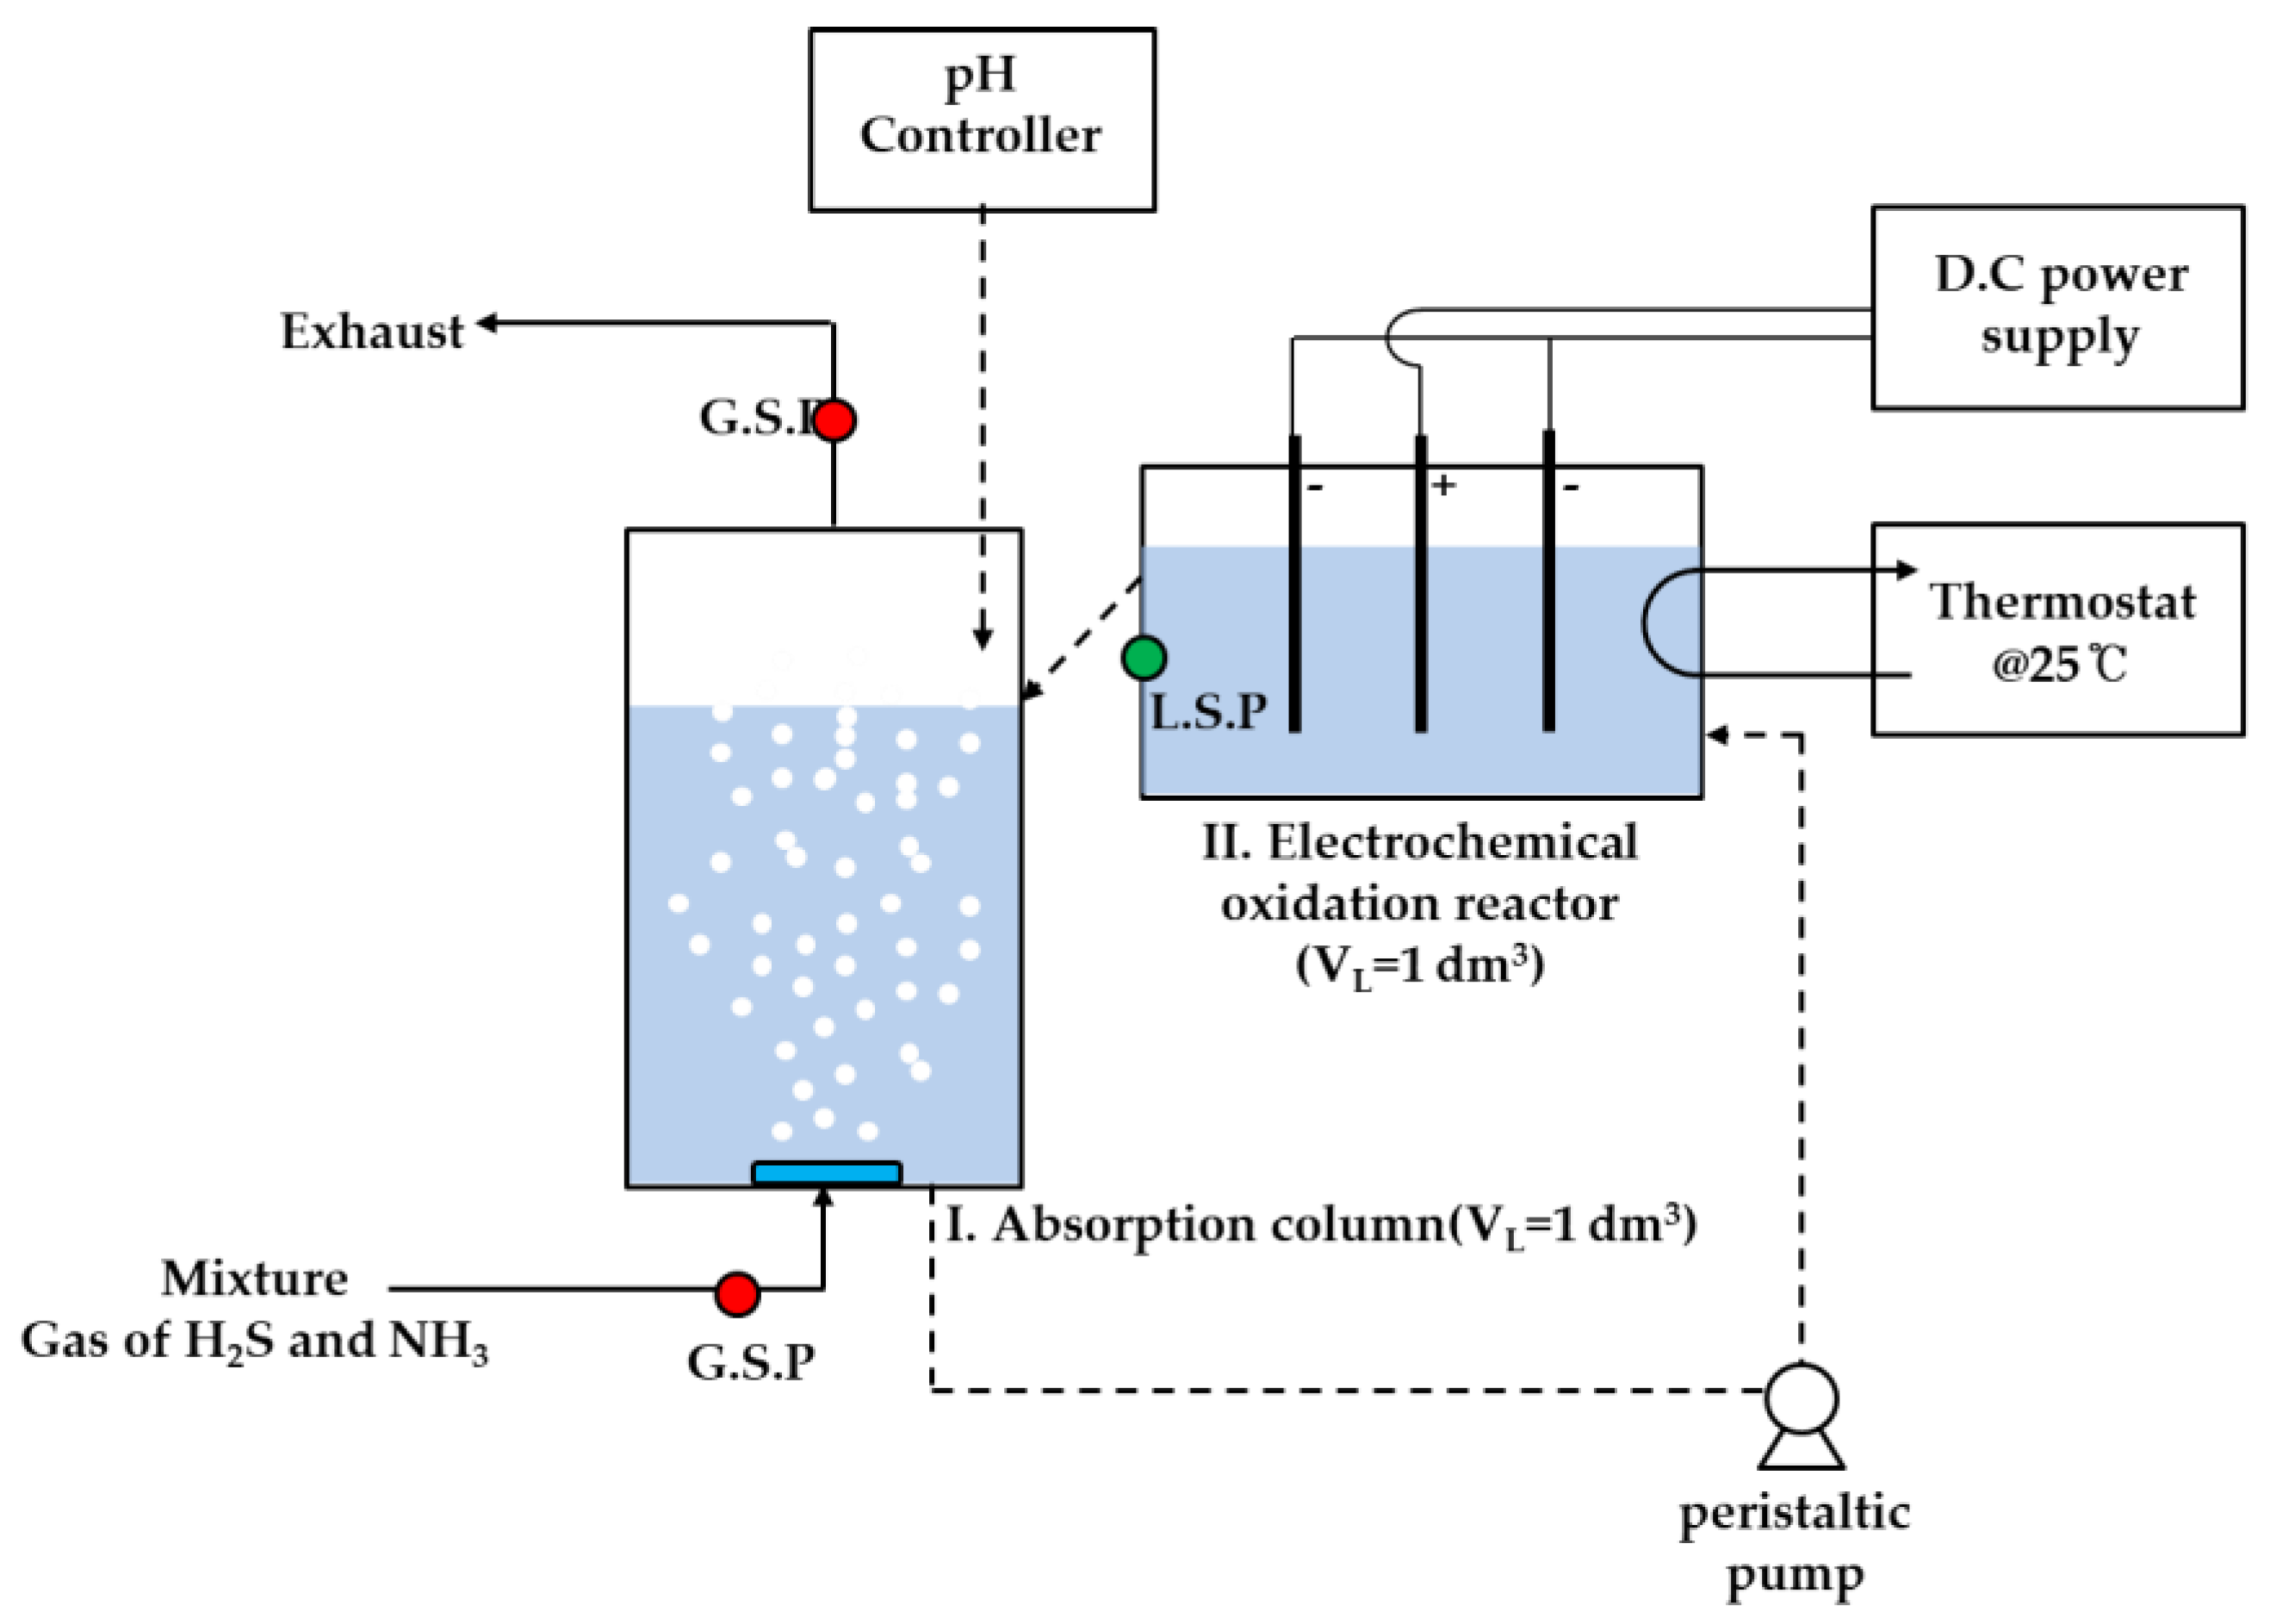
2.1. Experimental Setup

Figure 1 shows a schematic of the experimental setup for the EWS; the cylindrical absorption column had a diameter of 80 mm and a height of 250 mm, corresponding to an effective volume of 1 dm3. The rectangular electrochemical oxidation reactor had a size of 150 (width) × 90 (length) × 155 mm (height), and an effective volume of 1 dm3. An NaCl solution (10 mM) was continuously circulated throughout the reactor at a flow rate of 1 dm3 min−1 (circulation rate: 30 rev. h−1). The solution was introduced from the bottom of the absorption column into the electrochemical oxidation reactor, using a peristaltic pump, and the aqueous solution in the reactor overflowed into the absorption column. The pH of the solution was maintained at 8, which was automatically controlled with a pH controller (SOWA 910, Istek, South Korea) using 0.1 M HCl and NaOH aqueous solutions. During the experiment, the injected solutions for controlling the pH represented less than 10% of the entire volume. A thermostat was installed, and the temperature of the aqueous solution was maintained at 25 °C to prevent temperature variations during the experiment that would affect the chemical reactions.
The model gas was prepared by diluting H2S (5 vol. %) and NH3 (5 vol. %) with nitrogen (99.9 vol. %), which was introduced into the reactor by adjusting the inlet flow rate, using a flow meter. The mixed gas passed through the aqueous solution as bubbles via a sparger installed at the bottom of the absorption column. The disc-shaped bubble sparger (Namkyung Tech, South Korea) was composed of a porous ceramic material with a diameter of 60 mm.

2.2. Analytical Methods

Gaseous samples for the inlet and outlet concentrations were withdrawn from the gas sampling points. The concentration of gaseous H2S was analyzed using a portable analyzer (GFM-140, Gasdata, United Kingdom), with an electrochemical sensor. The analyzer had a 10–2000 ppm measurement range and its detection limit was 10 ppm. Concentrations of less than 10 ppm were measured, using a gas detection tube (GASTEC, Japan). The concentration of gaseous NH3 was quantified, using a portable detector (Gas Alert Micro 5, Honeywell, Charlotte, NC, USA) with an electrochemical sensor. The detector had a 1–1000 ppm measurement range.
Liquid samples were collected from the sampling port installed on the electrochemical oxidation reactor, using a syringe. The total volume of sample collected during the experiment did not exceed 5% of the total aqueous solution. The concentration of aqueous H2S was measured, using an analyzer (H2S analyzer, ECH, Halle, Saxony-Anhalt, Germany), which can analyze concentrations from 0.1 to 10,000 ppm. The concentration of aqueous NH3 was quantified using a dedicated analysis kit (Hach, Loveland, Colorado, USA), applying the indophenol colorimetric method.

3. Model Development

3.1. Model Establishment

Odorous substances were absorbed by the aqueous solution from the gas through mass transfer. The absorbed odorous substances were then oxidized by electrochemical oxidation reactions. In this study, we established a model composed of mass transfer and oxidation terms, which are the main mechanisms of EWS, based on zero-order reactions. The concentration changes in the aqueous and gaseous H2S are calculated as follows:
dC LS dt = K L a S ( C GS , in H S C LS ) k s
dC GS , out dt = Q G V G ( C GS , in C GS , out ) V L V G K L a S ( C GS , in H S C LS )
where CLS is the liquid-phase concentration (mg dm−3), KLaS is the mass transfer coefficient (min–1), CGS,in is the gas inlet concentration (mg dm−3), HS is the Henry’s law constant (dimensionless), CLS is the aqueous concentration (mg dm−3), kS is the zero-order kinetic constant (mg dm−3 min−1), CGS,out is the gas outlet concentration (mg dm−3), QG is the gas flow rate (dm3 min−1), VG is the volume of gas present in the liquid phase as the form of bubbles (dm3), and VL is the volume of the aqueous solution (dm3).
The concentration changes in aqueous and gaseous NH3 are calculated as follows:
dC LN dt = K L a NH 3 ( C GN , in H N C LN ) k N ( 1 C LS K I + C LS )
dC GN , out dt = Q G V G ( C GN , in C GN , out ) V L V G K L a NH 3 ( C GN , in H N C LN )
where the subscript N represents the value of NH3 and KI is the retardation constant (mg dm−3). KI illustrates the phenomenon of H2S oxidation before NH3 when H2S and NH3 coexist in an aqueous solution. Using the numerical model, EWS performance was predicted with respect to the H2S inlet concentration. The values obtained from the experimental results for each reactor was used [6]. Table 1 summarizes the values of the model parameters predicted in this study.

3.2. Numerical Analysis

Based on Equations (1)–(4), numerical analysis was conducted using the fourth-order Runge–Kutta method in MS Excel. The outlet concentration of gaseous H2S and the concentration of aqueous NH3 were calculated based on the aqueous H2S concentration computed, using the mass balance equation for aqueous H2S among the four mass balance equations. This simulated the absorption of gaseous H2S by mass transfer. In addition, the concentration of aqueous NH3 was determined based on the concentration of aqueous H2S because H2S is oxidized prior to NH3 during electrochemical oxidation. Finally, the analysis sequence was determined such that the outlet concentration of gaseous NH3 could be determined using the concentration of aqueous NH3. The repetition time unit for each operation was 0.1 min. The changes in the aqueous and liquid concentrations of H2S and NH3 for 60 min were simulated.
The concentrations of H2S and NH3 varied over time in the real gases emitted from environmental facilities. In this study, however, the experiment was performed at a constant concentration of 1000 ppm. Therefore, the performance of the EWS was predicted using the numerical model when the inlet concentrations of H2S and NH3 increased to 1500 ppm. Particularly, numerical analysis was also conducted for shock loading in which the current density was increased to 50–70 mA cm−2.
The numerical model scenario for shock loading operation was as follows. H2S and NH3 were introduced at 1000 ppm for 2 h. In this instance, a pH of 8, QG of 2 dm3 min−1, and a current density of 40 mA cm−2 were applied. Two hours after the start of the operation, the inlet concentrations of H2S and NH3 were increased to 1500 ppm and maintained for 1 h. The inlet concentrations were then reduced to and maintained at 1000 ppm. The current density was maintained at 40 mA cm−2 before shock loading and varied between 40 and 70 mA cm−2 after shock loading; a numerical analysis was conducted in each case. The values obtained from the experiments were applied for the kinetic constants at current densities of 40 and 50 mA cm−2, whereas kinetic constants at 60 and 70 mA cm−2 were calculated based on the linear relationship between the current density and kinetic constant.

4. Discussion

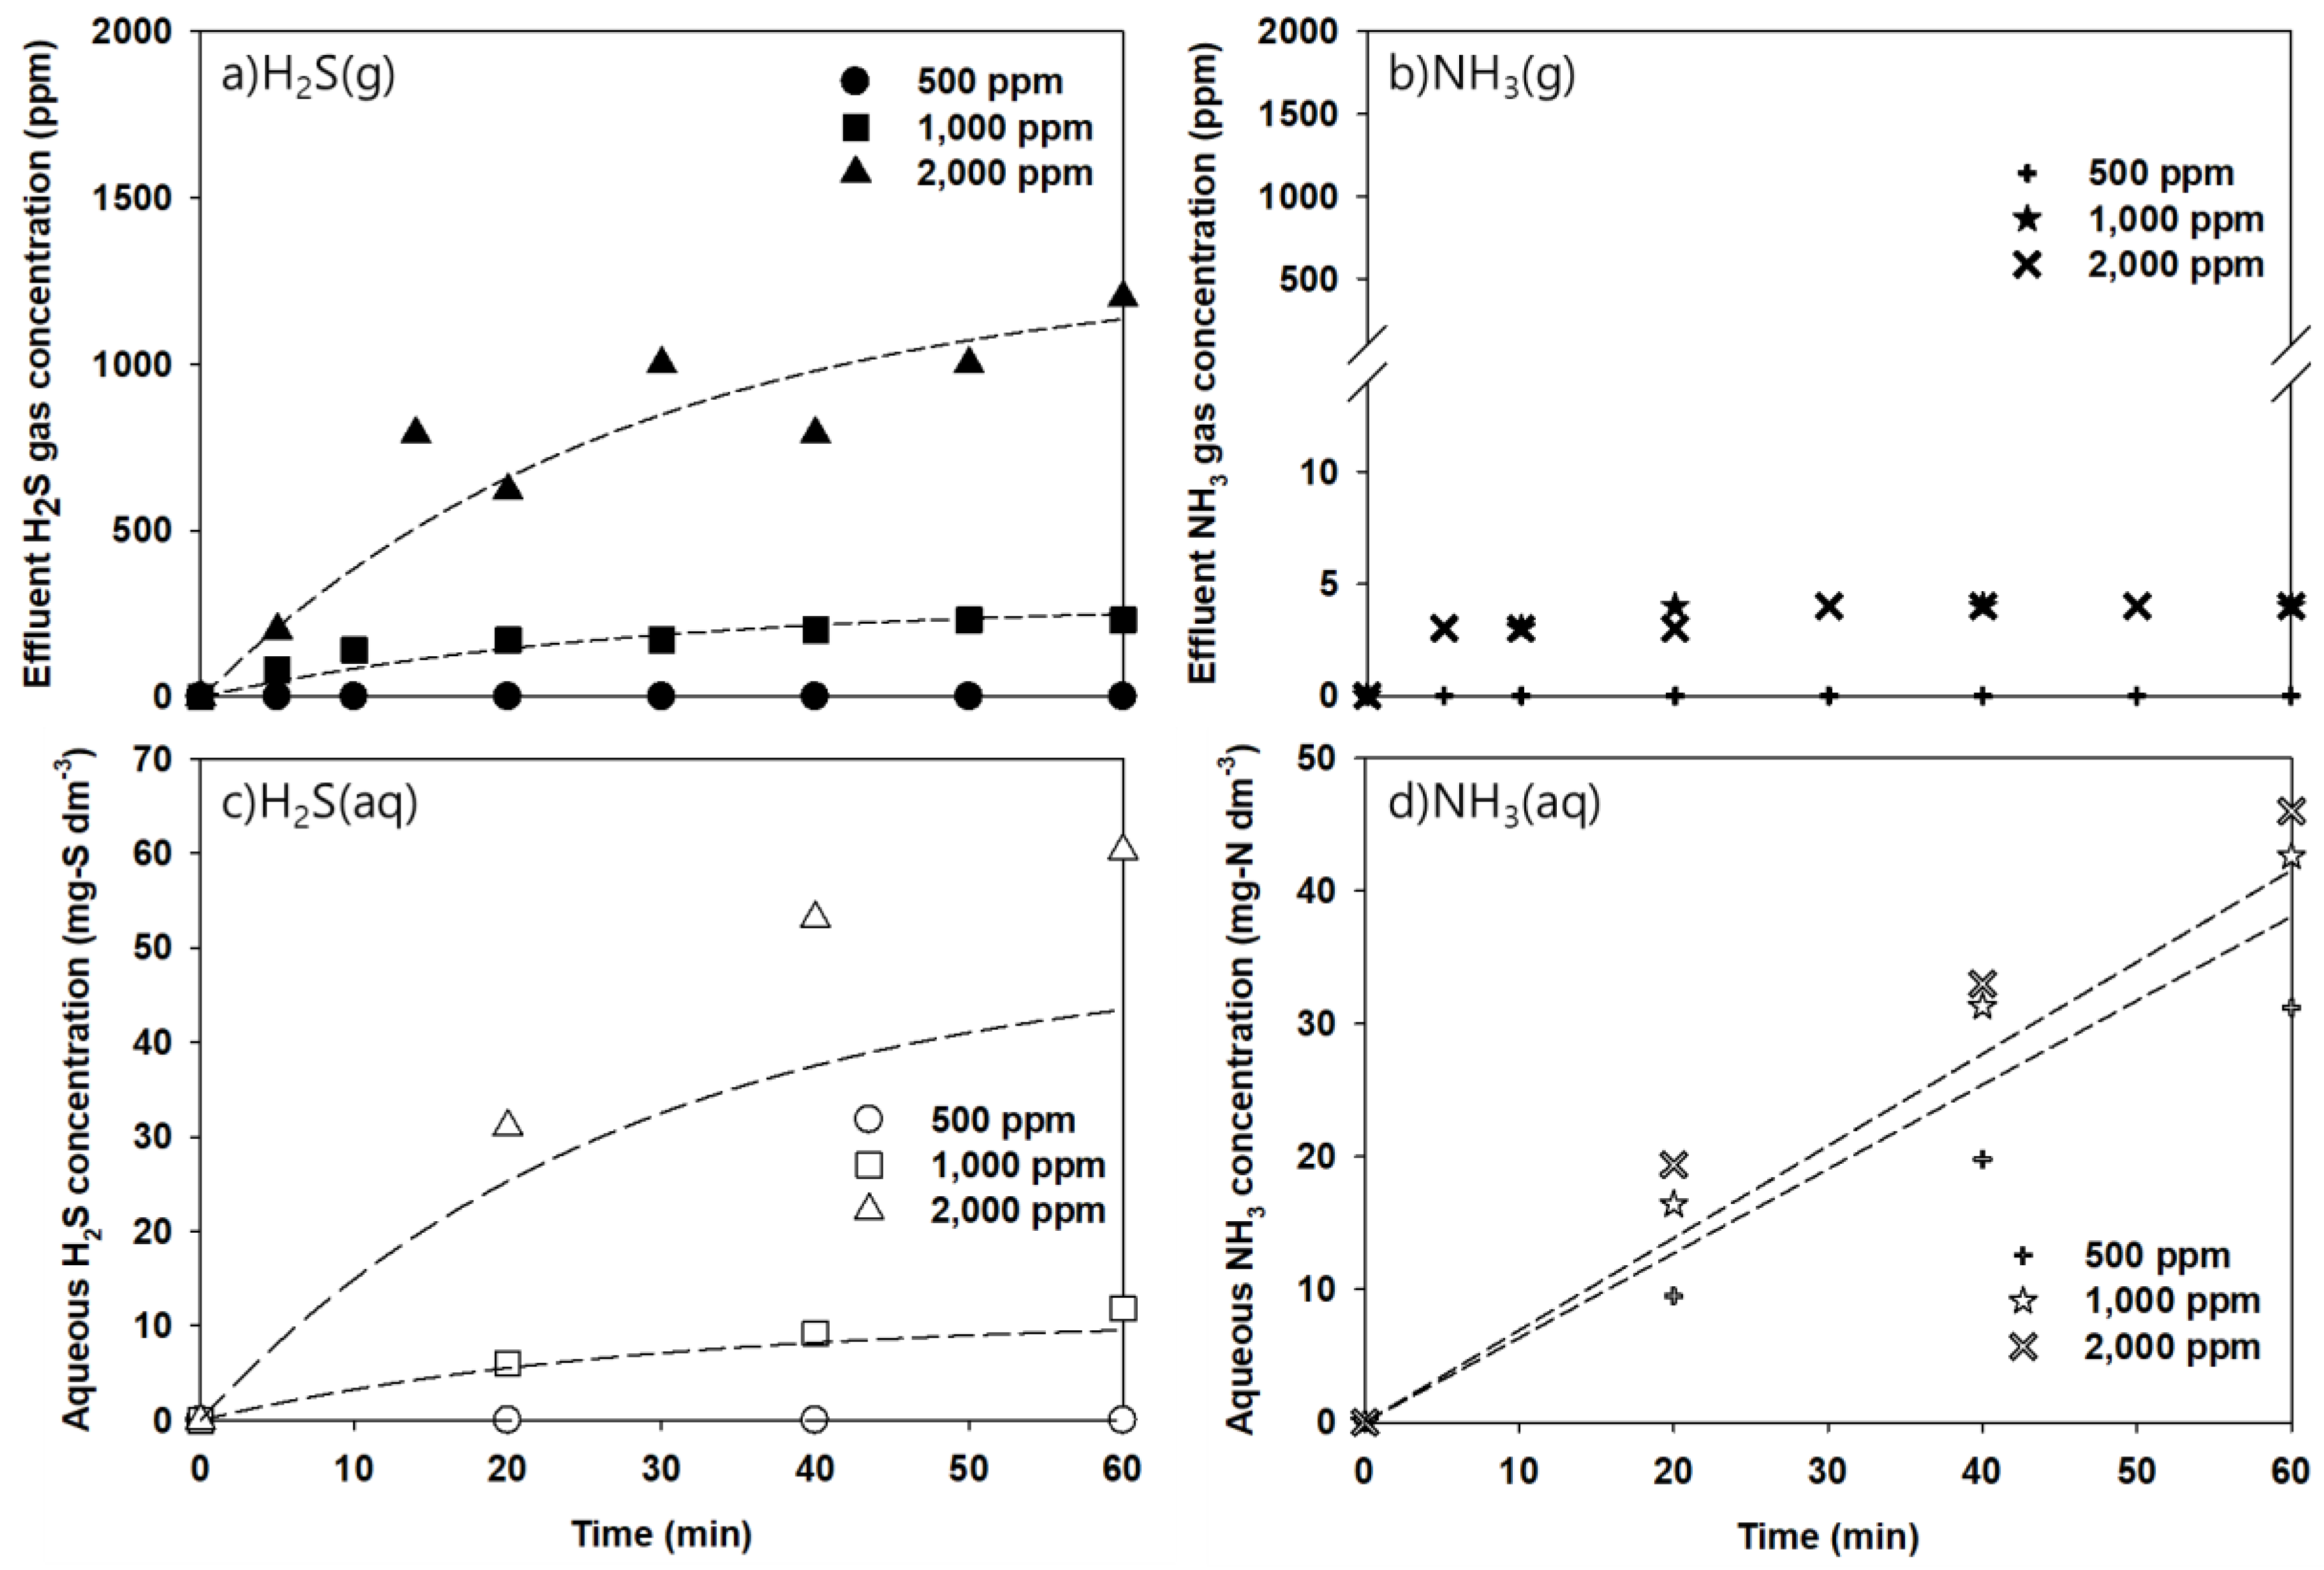
4.1. Model Validation

Figure 2 shows the experimental results obtained by increasing the inlet concentration of H2S from 500 to 2000 ppm, while maintaining the NH3 concentration at 500 ppm. At 500 ppm of H2S, the outlet concentration was 0 ppm because all of the introduced H2S was absorbed and removed in 60 min. However, when the concentration was increased to 1000 ppm, H2S was not completely eliminated, with 200 ppm being detected at the outlet. When 2000 ppm H2S was introduced, the outlet concentration increased to approximately 1000 ppm. At a H2S concentration of 500 ppm, the elimination capacity was approximately 42 g m−3 h−1, resulting in a complete absorption and removal. For a H2S concentration of 1000 ppm, the removal efficiency was 80%, corresponding to an elimination capacity of 42 g m−3 h−1. Similarly, the removal efficiency was 60% at a 2000 ppm inlet concentration, corresponding to a removal rate of 36 g m−3 h−1. Combined, the removal rate of H2S at a current density of 40 mA cm−2 was approximately 40 g m−3 h−1.
The outlet concentration of NH3 was less than 5 ppm, regardless of the inlet H2S concentration. The removal rate of NH3 was higher than that of H2S due to its water solubility. In particular, the removal rate of NH3 remained unaffected by changes in the H2S concentration, indicating that the design factors for the EWS must be derived by focusing on the H2S loading rate.
As shown in Figure 2c, the concentration of aqueous H2S is 0 mg-S dm−3 for 500 ppm introduced, indicating the complete oxidization of H2S. However, the H2S absorbed in the liquid phase was not completely oxidized with increasing the inlet concentration. This indicates that a current density of 40 mA cm−2 was insufficient in oxidizing H2S at a concentration ≥ 1000 ppm. A concentration of aqueous NH3 exhibited similar values as observed for H2S inlet at 1000 and 2000 ppm, while NH3 decreased at a concentration of 500 ppm H2S. In other words, some of the aqueous NH3 was oxidized when the aqueous H2S concentration was 0 mg S/L. However, no aqueous NH3 was removed if aqueous H2S was present in the solution. In the electrochemical treatment of the solution with coexisting H2S and NH3, H2S was dominantly oxidized by the RCS. After complete elimination of H2S, the oxidation of NH3 was initiated by residual RCS. Therefore, the removal of both absorbed H2S and NH3 through oxidation requires a higher current density.
In Figure 2, the dotted lines represent the behavior of the EWS predicted, using the model. Overall, the predicted results effectively simulated the experimental results. However, when the H2S inlet concentration was 2000 ppm, the predicted aqueous H2S concentration varied slightly from the experimental value. The concentration of aqueous hydrogen was approximately 60 mg dm−3 at 60 min after the start of the experiment but attained equilibrium at approximately 40 mg dm−3 in the model simulation. This indicates that an error occurs in the model simulation when the loading rate is high compared to the current density. This may be due to variations in the oxidation rate via direct oxidation between the batch and continuous inflow experiments.
In the numerical model proposed in this study, the oxidation capacity of the electrochemical oxidation device was expressed, using kinetic constants derived from the batch experiments. In the batch experiments, the effect of direct oxidation decreased because the initial concentrations in solution were fixed. The diffusion of pollutants to the electrode surface was limited owing to a reduction in concentration inside the reactor over time. Under the continuous inflow condition, however, the direct oxidation rate increased because diffusion to the electrode surface increased as the liquid phase concentration continuously increased over time. In particular, if the current density was relatively low compared to the loading rate, the direct oxidation rate further increased owing to an increase in the probability of diffusion to the electrode surface without reacting with the RCS. In other words, the direct oxidation rate decreased under diffusion limiting conditions [21]. Therefore, the error between the experimental and model values increased with increase in the loading rate.
Therefore, the results for simulations must be interpreted carefully in cases where the loading rate is high, or the current density is low. In addition, supplementing the model to reduce errors is necessary. Under the conditions of different loading rates, the simulation results for NH3 appropriately described the experimental results. This may be a result of the tendency for stable NH3 removal that is not affected by different experimental conditions, which was also reflected in the model simulation.
The model properly expressed the experimental results, indicating that it can aid in predicting the performance of the EWS in the future. Since each parameter affects the results of the model simulation process differently, examining the sensitivity of each parameter is essential. For the sensitivity analysis of each parameter, the values were varied by ± 20% in the numerical model to predict any changes in the removal efficiency. Figure 3 shows the results of the sensitivity analysis. The solid lines represent the simulation results for the default values without variation, while the dotted lines represent the simulation results for the values varied by ± 20%. Wider gaps between the solid and dotted lines indicate that the specific parameter has a significant influence.
Among the parameters for numerical model, the kinetic constant showed the highest sensitivity. This indicates that the kinetic constant term was greater significance than the mass transfer rate in the EWS. However, the mass transfer rate seemed to affect the performance of EWS rather than the kinetic constant because EWS was operated under diffusion limiting conditions as mentioned above. Hence, certain prediction results revealed a gap with respect to the experimental results. Therefore, the estimation of kinetic constants must be carefully performed.
In another sensitivity analysis, the sensitivity index was calculated to identify the effect of the parameters used for model prediction. Equation (5) calculates the sensitivity index, which represents the degree of influence on the simulation results when each parameter is changed by ± 20%:
Sensitivity   index   ( SI ) = abs ( f ( p ) / f ( p ) p / p )
where f(p) is the H2S removal efficiency and p is the parameter value.
Table 2 summarizes the calculation results. The kinetic constant had the greatest influence on the H2S removal efficiency, followed by the mass transfer coefficient. The sensitivity analysis results showed that the kinetic constant had a significant influence on predictions of the performance for the entire reactor. However, the mass transfer coefficient had a significant influence at the low loading rate operation. Therefore, we suggest that a sufficient current density must be applied to obtain the H2S removal efficiency and properly predict the performance of EWS.
The main parameters that affect the mass balance of gaseous NH3 are the mass transfer coefficient, kinetic constant, and Henry’s law constant of NH3. The mass transfer coefficient of H2S can also be a main parameter since NH3 is oxidized under the influence of the aqueous H2S concentration. However, NH3 was predicted to exhibit a removal efficiency of 99% or higher despite variations in the model parameters. Therefore, sensitivity analysis for model parameters was not possible (data not shown).

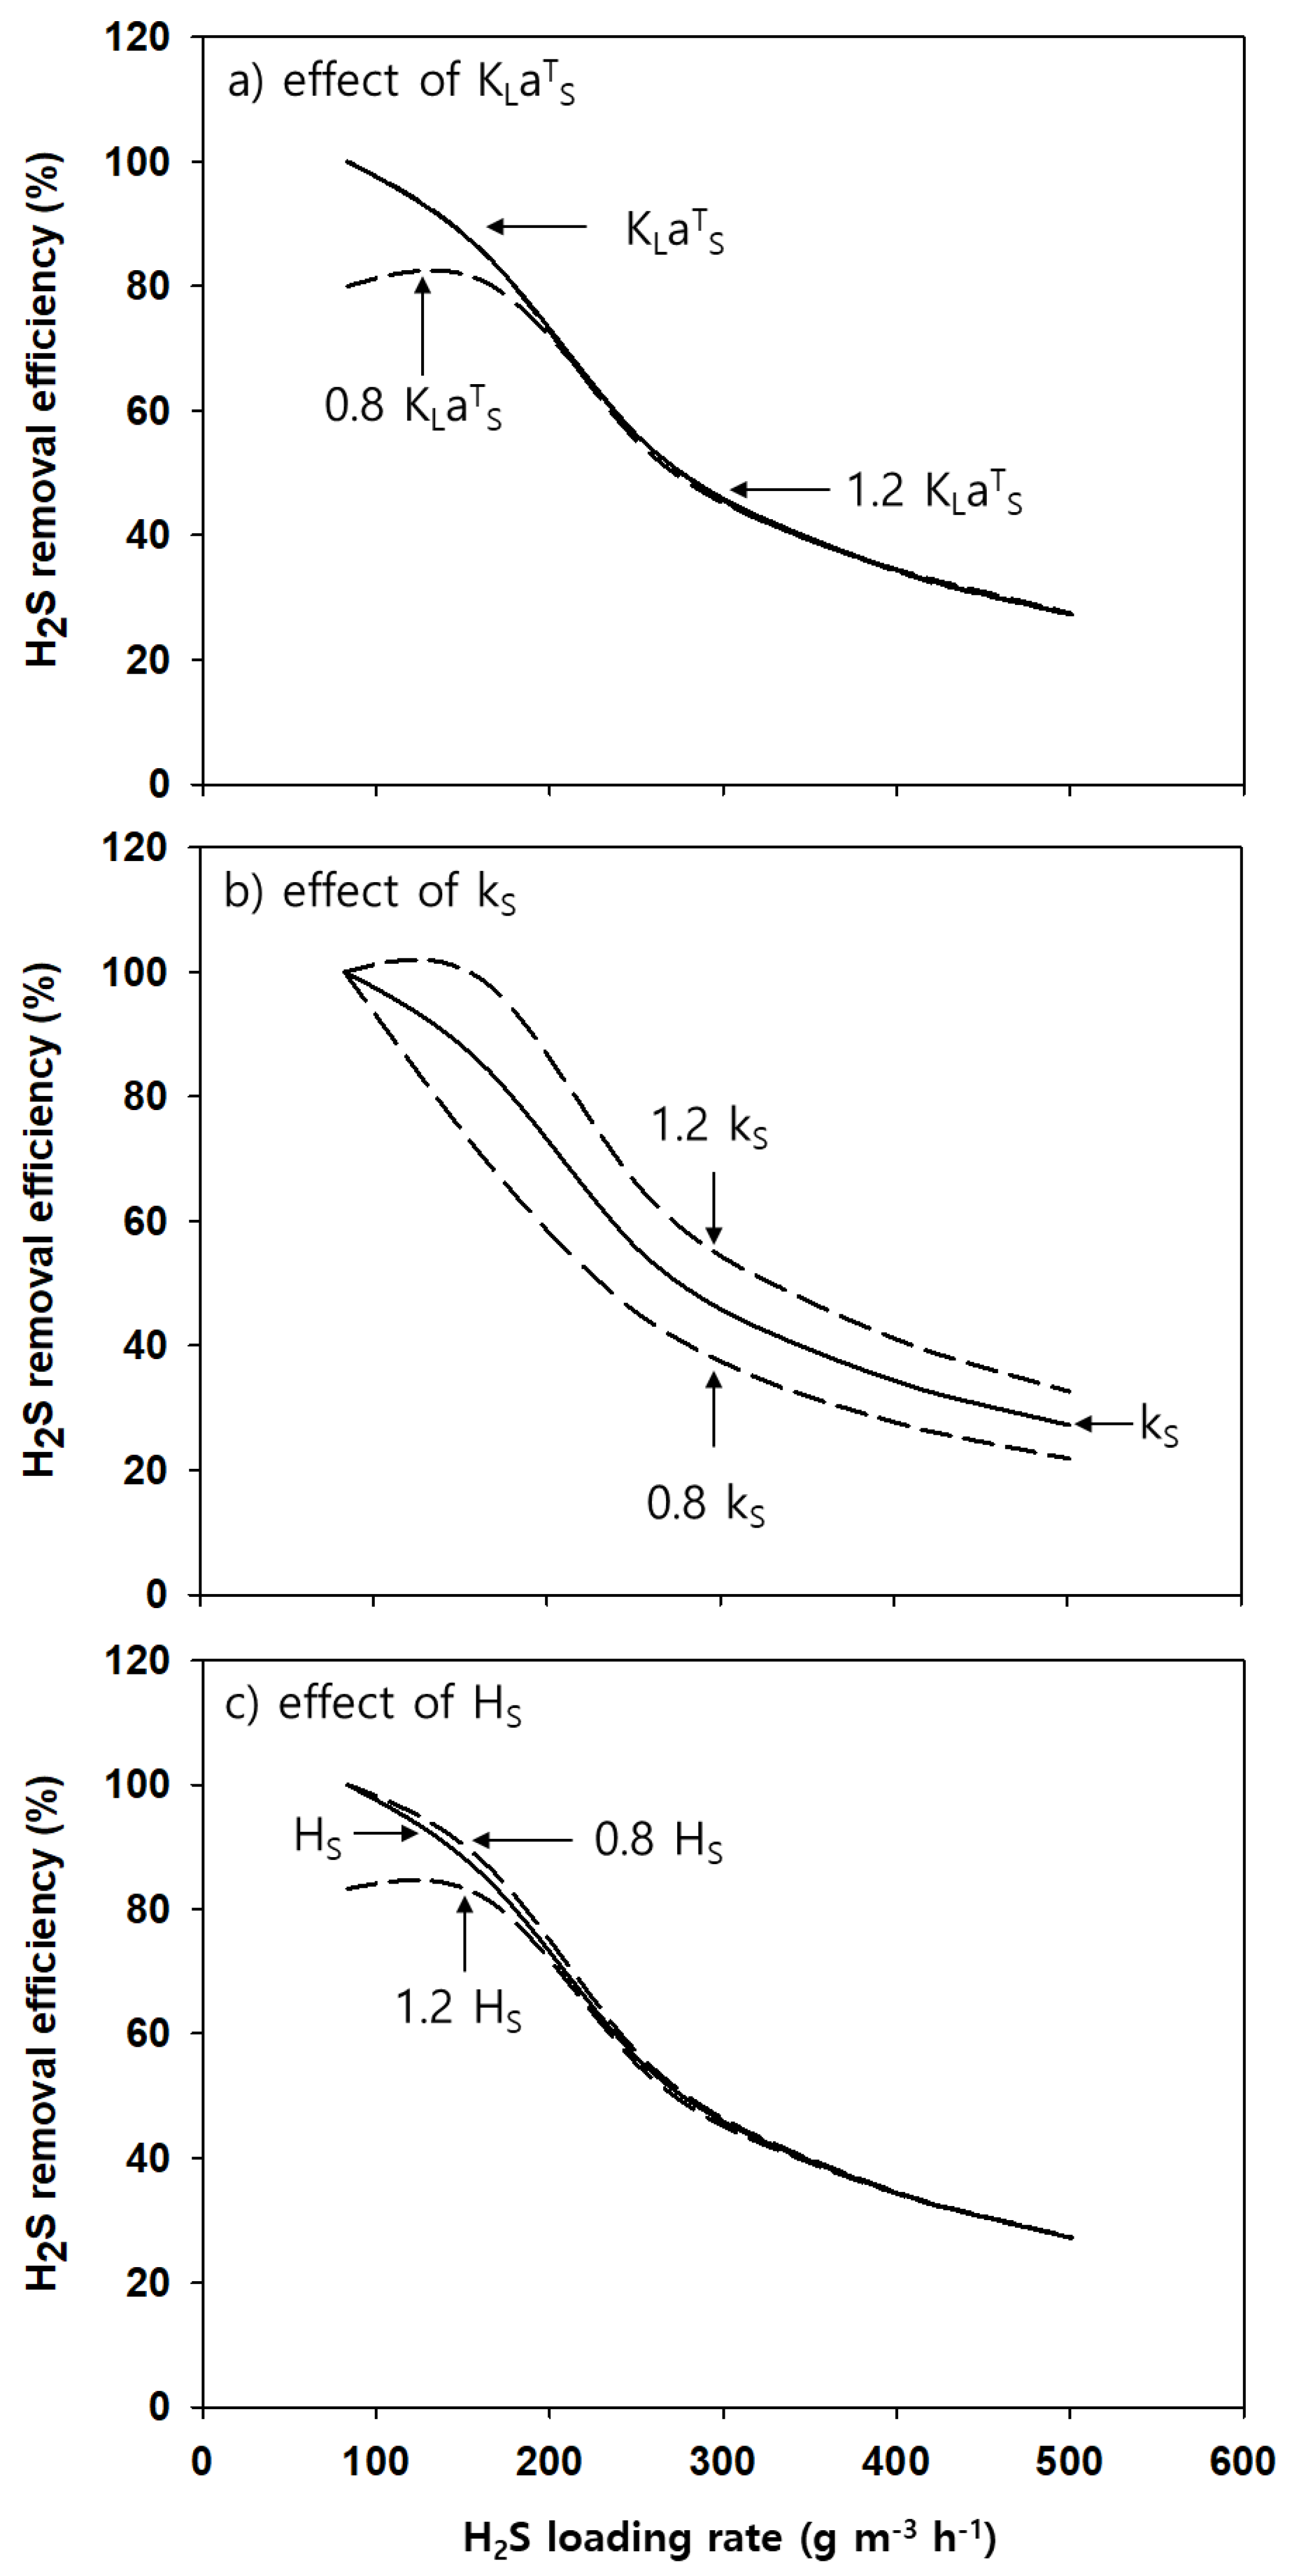
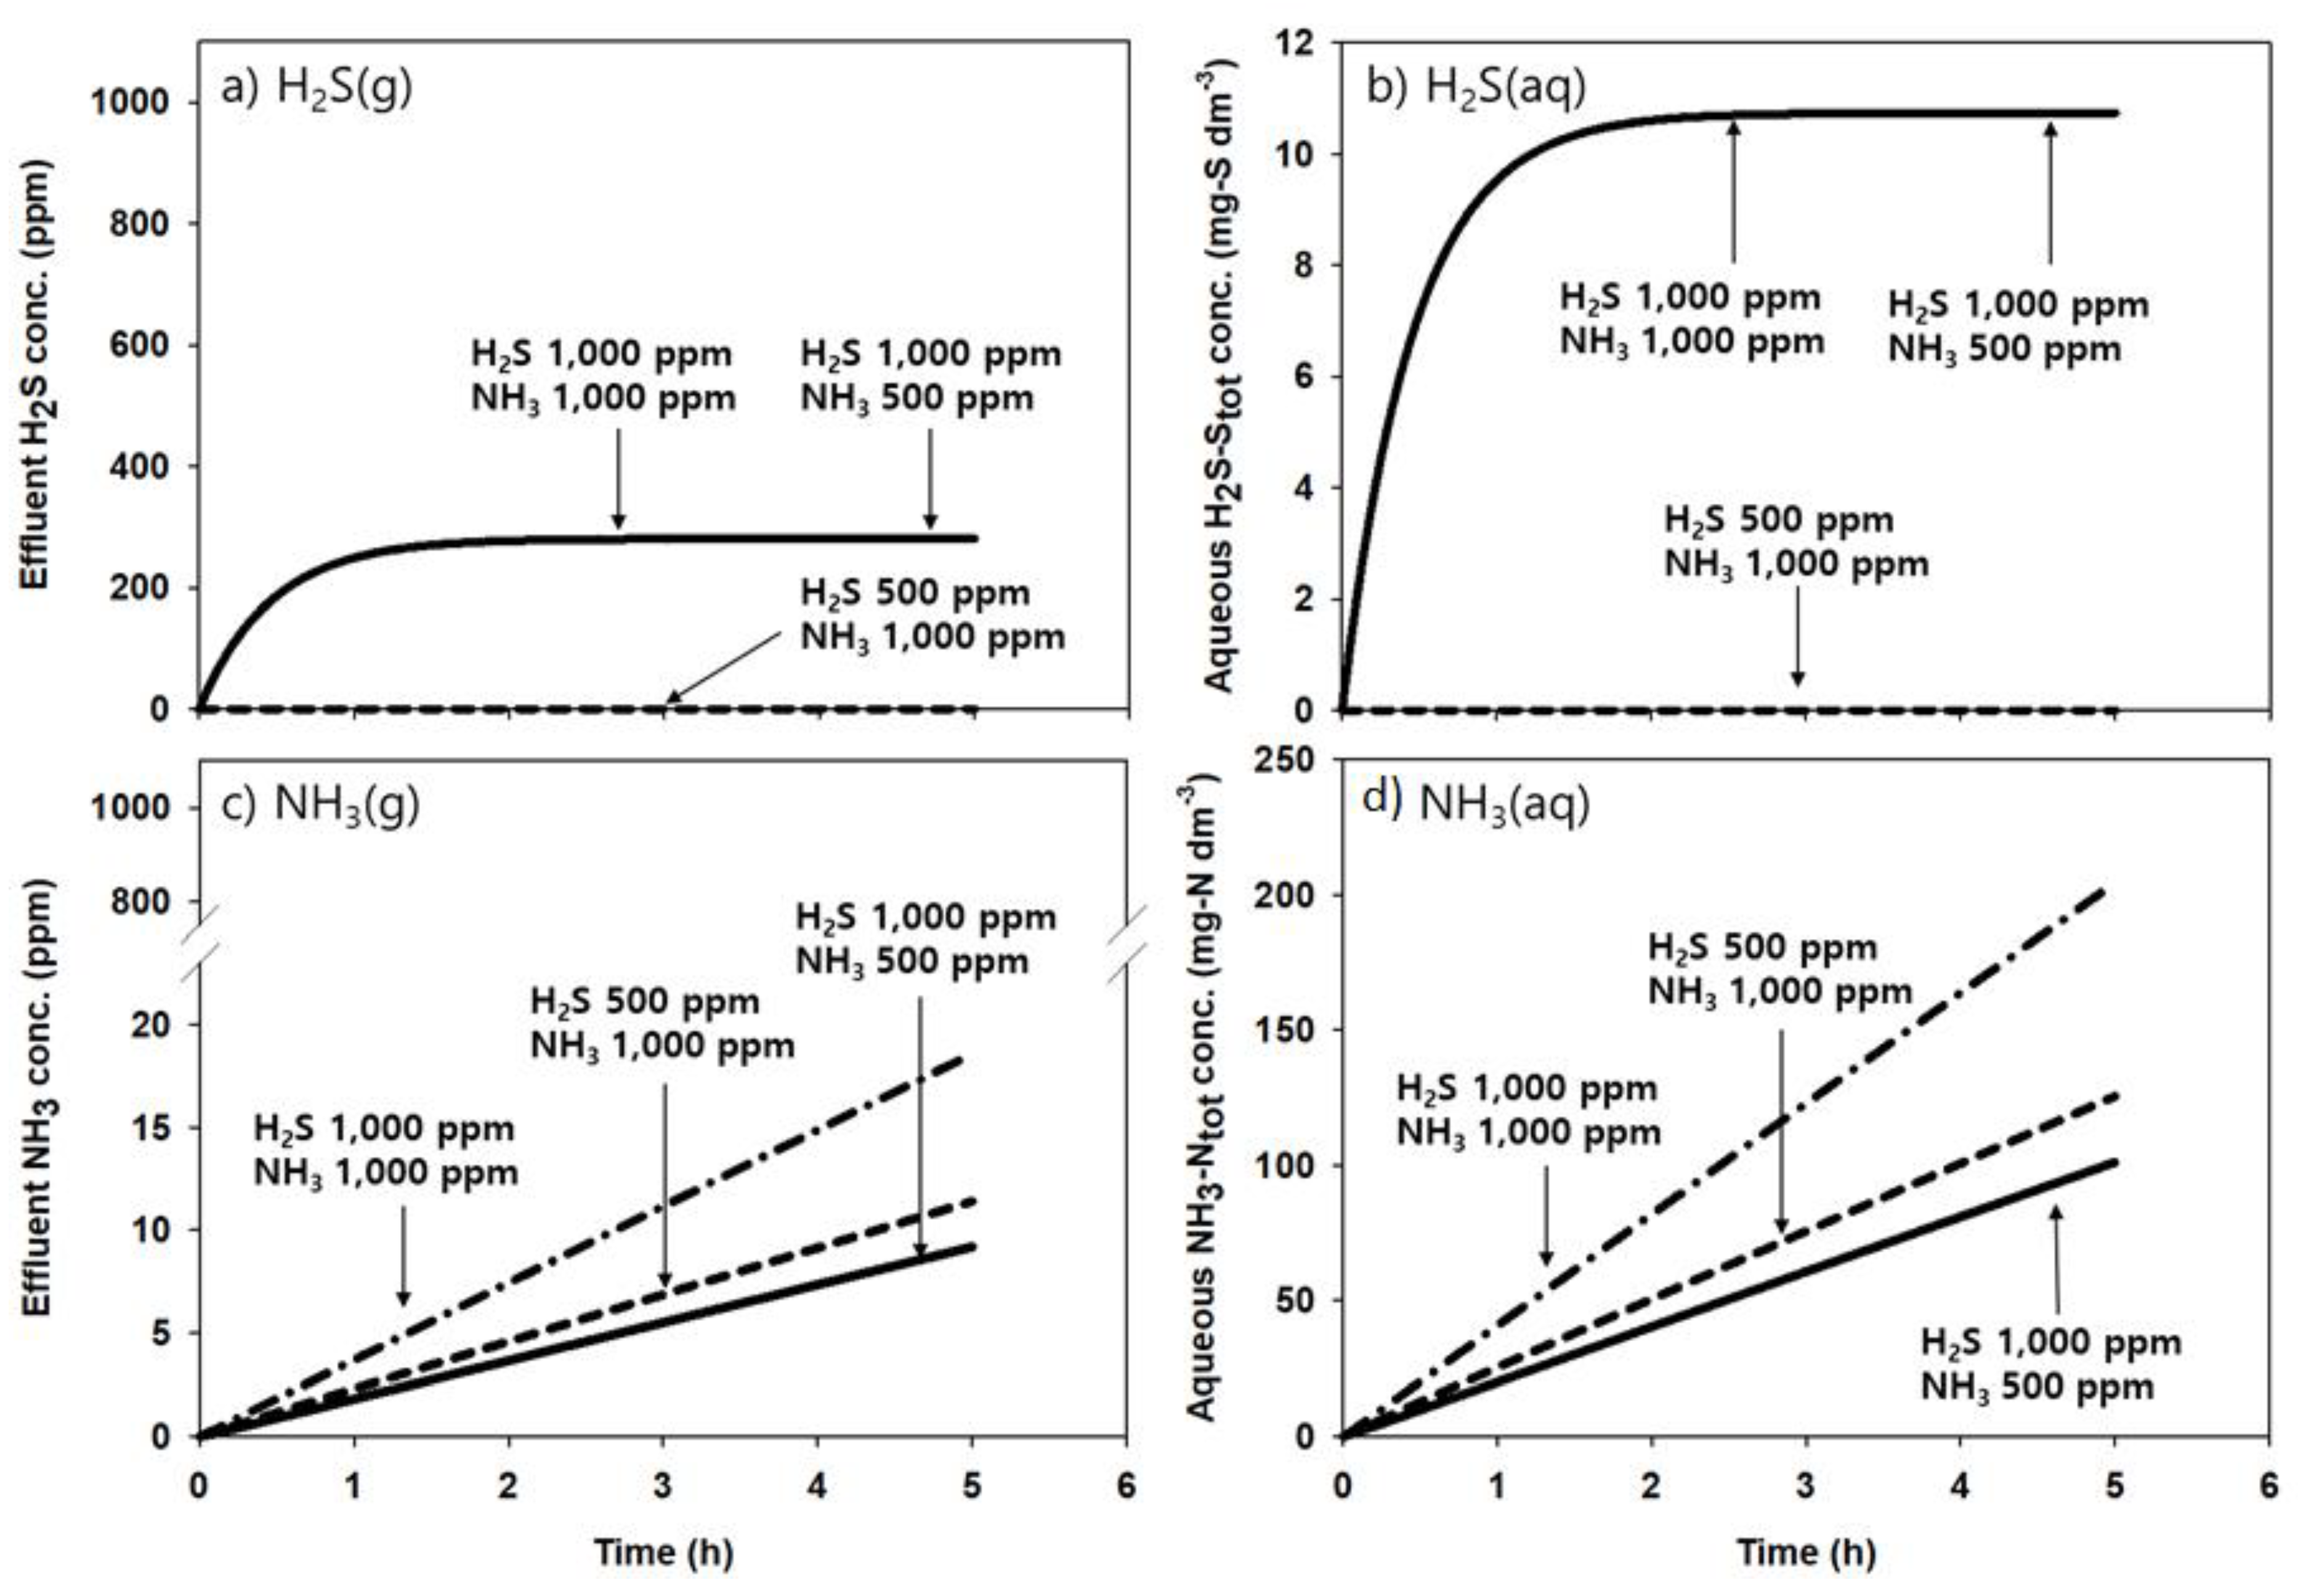
4.2. Performance Prediction

The concentration of odor gases varied with time. Therefore, the removal performance was predicted at different concentrations of H2S and NH3. A numerical analysis was conducted by assuming three cases: (1) H2S and NH3 were introduced at the same concentration of 1000 ppm, (2) there was a concentration of 1000 ppm for H2S and 500 ppm for NH3, (3) and a concentration of 500 ppm for H2S and 1000 ppm for NH3. A pH of 8 and a current density of 40 mA cm−2 were applied.
Figure 4 shows the results of the numerical analysis. The removal efficiency of gaseous H2S was determined regardless of the NH3 concentration because H2S is oxidized prior to NH3. In contrast, the NH3 removal efficiency was determined as a function of the inlet concentrations of both NH3 and H2S. When the inlet concentrations of H2S and NH3 were reduced from 1000 to 500 ppm, there were no significant changes in the NH3 removal performance. This is because NH3 is mainly removed by absorption, whereas H2S is removed by absorption and oxidation.
Consequently, the H2S removal performance can be improved by increasing the current density, regardless of the NH3 concentration. On the contrary, NH3 can be easily removed by absorption. In other words, the H2S removal rate would be improved by applying a higher current density, while the NH3 removal rate would be enhanced by increasing the liquid–gas ratio. Despite applying a high current density, the aqueous concentration of ammonia increased linearly due to difficult oxidation. In the simulation results in which EWS operated under the loading rate of 83.46 g m−3 h for H2S and 41.7 g m−3 h for NH3, the aqueous concentration of ammonia approached saturation after 10 days [11]. If the current density increased to higher than 80 mA cm−2, the period needed to approach saturation was prolonged to approximately one month.
Figure 5 summarizes the results of the numerical analysis conducted when the current density was increased to 50–70 mA cm−2 for shock loading so as to confirm the benefits of the EWS, which can flexibly correspond to an increase in the loading rate by increasing the current density. As the loading rate was increased by 1.5 times, the outlet concentration of H2S sharply increased to approximately 780 ppm of H2S, despite the current density of 40 mA cm−2. The concentration of aqueous H2S was retained at 27 mg-S dm−3. However, as soon as the current density increased to 50 and 60 mA cm−2, the removal efficiency of H2S improved. When 70 mA cm−2 was applied, all the H2S was absorbed and oxidized within 30 min of the shock loading injection.
Although the inlet concentration increased by a factor of 1.5, there were no significant changes in the slopes of the gas-phase outlet concentration and liquid-phase concentration. The removal efficiency remained approximately similar, even when the current density increased to 60 mA cm−2. This is because the aqueous H2S remained at a concentration of approximately 8 mg-S dm−3, even at a current density of 60 mA cm−2. As a result of the initiation of the oxidation reaction, the removal performance changed with the application of a current density of 70 mA cm−2. Consequently, maintaining the removal efficiency during fluctuations in the loading rates for H2S and NH3 by adjusting the current density of the electrochemical oxidation device was possible. In particular, we confirmed the high applicability of EWS since the desired removal efficiency could be easily obtained for H2S.

5. Conclusions

In this study, we examined the changes in the performance with respect to the inlet concentration of H2S through experiments and a numerical model for simultaneously treating both H2S and NH3, using an EWS. In the EWS, the treatment efficiency varied depending on the inlet concentration of H2S. EWS is a suitable technology for the treatment of H2S, as it can correlate with load fluctuations by increasing the current density. The removal of NH3 proceeded in a stable manner owing to its high water solubility. In conclusion, EWS has greater applicability as an odor-treatment technology than a conventional scrubber because it can effectively treat target substances according to their properties and respond to fluctuations in the loading rate by increasing or decreasing the current density. In addition, an appropriate design can be obtained for the EWS using the numerical model developed in this study.

Author Contributions

Writing—original draft preparation, J.K.; writing—review and editing, J.S.; visualization, H.J.; supervision, S.Y.; project administration, S.Y.; funding acquisition, W.K. All authors have read and agreed to the published version of the manuscript.

Funding

This research was funded by the Korea Institute of Civil Engineering and Building Technology (KICT) under grant number 20210154-001.

Institutional Review Board Statement

Not applicable.

Informed Consent Statement

Not applicable.

Data Availability Statement

The data presented in this study are available in the article (tables and figures).

Conflicts of Interest

The authors declare no conflict of interest.

Nomenclature

CLSconcentration of H2S in aqueous phase (mg dm−3)
CGSconcentration of H2S in gaseous phase (mg dm−3)
CLNconcentration of NH3 in aqueous phase (mg dm−3)
CGNconcentration of NH3 in gaseous phase (mg dm−3)
QGgas flow rate (dm3 min−1)
VLreactor volume (dm3)
VGbubble volume (dm3)
KLaSmass transfer coefficient of H2S (min–1)
KLaNmass transfer coefficient of NH3 (min–1)
kSzero-order kinetic constant H2S (mg dm−3 min−1)
kNzero-order kinetic constant of NH3 (mg dm−3 min−1)
KIretardation constant (mg dm−3)
HSHenry’s law constant of H2S (dimensionless)
HNHenry’s law constant of NH3 (dimensionless)

References

  1. Qamaruz-Zaman, N.; Milke, M.W. VFA and ammonia from residential food waste as indicators of odor potential. Waste Manag. 2012, 32, 2426–2430. [Google Scholar] [CrossRef] [PubMed] [Green Version]
  2. Madhavaraj, L.; Lim, H.D.; Kim, K.M.; Kim, D.H.; Han, G.H. Influence of Sargassum horneri Mitigating odorous gas emissions from swine manure storage facilities. Sustainability 2020, 12, 7587. [Google Scholar] [CrossRef]
  3. Van der Heyden, C.; Demeyer, P.; Volcke, E. Mitigating emissions from pig and poultry housing facilities through air scrubbers and biofilters: State-of-the-art and perspectives. Biosyst. Eng. 2015, 134, 74–93. [Google Scholar] [CrossRef]
  4. He, P.; Du, W.; Xu, X.; Zhang, H.; Shao, L.; Lü, F. Effect of biochemical composition on odor emission potential of biowaste during aerobic biodegradation. Sci. Total Environ. 2020, 727, 138285. [Google Scholar] [CrossRef] [PubMed]
  5. Rosenfeld, P.E.; Suffet, I.H. Understanding odorants associated with compost, biomass facilities, and the land application of biosolids. Water Sci. Technol. 2004, 49, 193–199. [Google Scholar] [CrossRef] [PubMed]
  6. Wysocka, I.; Gębicki, J.; Namieśnik, J. Technologies for deodorization of malodorous gases. Environ. Sci. Pollut. Res. 2019, 26, 9409–9434. [Google Scholar] [CrossRef] [PubMed] [Green Version]
  7. Muthuraman, G.; Moon, I.S. A review on an electrochemically assisted-scrubbing process for environmental harmful pollutant’s destruction. J. Ind. Eng. Chem. 2012, 18, 1540–1550. [Google Scholar] [CrossRef]
  8. Oliveira, F.H.; Osugi, M.E.; Paschoal, F.M.; Profeti, D.; Olivi, P.; Zanoni, M.V.B. Electrochemical oxidation of an acid dye by active chlorine generated using Ti/Sn(1− x)IrxO2 electrodes. J. Appl. Electrochem. 2007, 37, 583–592. [Google Scholar] [CrossRef]
  9. Singh, S.; Lo, S.L.; Srivastava, V.C.; Hiwarkar, A.D. Comparative study of electrochemical oxidation for dye degradation: Parametric optimization and mechanism identification. J. Environ. Chem. Eng. 2016, 4, 2911–2921. [Google Scholar] [CrossRef]
  10. Chen, G. Electrochemical technologies in wastewater treatment. Sep. Purif. Techno. 2004, 38, 11–41. [Google Scholar] [CrossRef]
  11. Kang, J.H.; Yoon, Y.; Song, J. Simultaneous removal of hydrogen sulfide and ammonia using a combined system with absorption and electrochemical oxidation. J. Environ. Sci. Heal. A Tox. Hazard. Subst. Environ. Eng. 2019, 54, 1430–1440. [Google Scholar] [CrossRef] [PubMed]
  12. Koronaki, I.P.; Prentza, L.; Papaefthimiou, V. Modeling of CO2 capture via chemical absorption processes− an extensive literature review. Renew. Sustain. Energ. Rev. 2015, 50, 547–566. [Google Scholar] [CrossRef]
  13. Yildirim, Ö.; Kiss, A.A.; Hüser, N.; Leßmann, K.; Kenig, E.Y. Reactive absorption in chemical process industry: A review on current activities. Chem. Eng. J. 2012, 213, 371–391. [Google Scholar] [CrossRef]
  14. Kenig, E.Y.; Wiesner, U.; Gorak, A. Modeling of reactive absorption using the Maxwell−Stefan equations. Ind. Eng. Chem. Res. 1997, 36, 4325–4334. [Google Scholar] [CrossRef]
  15. Ghaemi, A.; Torab-Mostaedi, M.; Maragheh, M.G. Nonequilibrium dynamic modeling of simultaneous reactive absorption of gases. J. Taiwan Inst. Chem. Eng. 2011, 42, 173–179. [Google Scholar] [CrossRef]
  16. Kerr, C.P. A method for predicting the performance of packed columns operating with a reactive scrubbing liquid that control gaseous air pollutants. J. Air Waste Manag. Assoc. 2002, 52, 396–399. [Google Scholar] [CrossRef] [PubMed]
  17. Khan, F.M.; Krishnamoorthi, V.; Mahmud, T. Modelling reactive absorption of CO2 in packed columns for post-combustion carbon capture applications. Chem. Eng. Res. Des. 2011, 89, 1600–1608. [Google Scholar] [CrossRef]
  18. Shaikh, A.A.; Abo-Ghander, N.S.; Binous, H. Modeling and parametric-sensitivity analysis of nonisothermal reactive absorption. Chem. Eng. Commun. 2017, 204, 310–320. [Google Scholar] [CrossRef]
  19. Azizi, M.; Biard, P.F.; Couvert, A.; Ben Amor, M.B. Competitive kinetics study of sulfide oxidation by chlorine using sulfite as reference compound. Chem. Eng. Res. Des. 2015, 94, 141–152. [Google Scholar] [CrossRef] [Green Version]
  20. Benjamin, M.M.; Lawler, D.F. Water Quality Engineering Physical Chemical Treatment Processes; Wiley: Hoboken, NJ, USA, 2014; p. 165. [Google Scholar]
  21. Martínez-Huitle, C.A.; Ferro, S. Electrochemical oxidation of organic pollutants for the wastewater treatment: Direct and indirect processes. Chem. Soc. Rev. 2006, 35, 1324–1340. [Google Scholar] [CrossRef] [PubMed]
Figure 1. Schematic of the experimental setup (G.S.P is gas sampling port; L.S.P is liquid sampling port; full line indicates gas stream; dotted line indicates liquid stream).
Applsci 11 04867 g001
Figure 2. Changes in the concentrations of (a) gaseous H2S, (b) gaseous NH3, (c) aqueous H2S, and (d) aqueous NH3 under different H2S inlet concentrations (dotted lines indicate model prediction results).
Applsci 11 04867 g002
Figure 3. Sensitivity of the main parameters for H2S (H2S loading rate (g m−3 h−1) versus H2S removal rate (%)): effects of (a) mass transfer coefficient, (b) first-order kinetic constant, and (c) Henry’s law constant (full line represents prediction based on original value, dotted line represents 20% variation of parameters).
Applsci 11 04867 g003
Figure 4. Simulated results of EWS at different inflow concentrations of H2S and NH3 for 6 h: (a) effluent H2S concentration (ppm), (b) aqueous H2S concentration in solution (mg-S dm−3), (c) effluent NH3 concentration (ppm), (d) aqueous NH3 concentration in solution (mg-N dm−3) as a function of time.
Applsci 11 04867 g004
Figure 5. Simulated results of the EWS for a shock loading rate of H2S for 6 h: (a) effluent H2S concentration (ppm), (b) aqueous H2S concentration in solution (mg-S dm−3), (c) effluent NH3 concentration (ppm), (d) aqueous NH3 concentration in solution (mg-N dm−3) as a function of time.
Applsci 11 04867 g005
Table 1. Model parameters used in this study.
ParameterSymbolValueUnit
Gas-phase flow rateQG2 1dm3 min−1
Reactor volumeVL2 1dm3
Bubble volumeVG0.08 2dm3
Mass transfer coefficient of H2SKLaS0.4 2min−1
Mass transfer coefficient of NH3KLaN0.0007 2min−1
Zero-order kinetic constant of H2SkS1.0 2mg dm−3 min−1
Zero-order kinetic constant of NH3kN0.3 2mg dm−3 min−1
Retardation constantKI0.001 2mg dm−3
Henry’s law constant of H2SHS0.4 3dimensionless
Henry’s law constant of NH3HN0.00695 3dimensionless
1 Data from experimental setup. 2 Obtained from experiments. 3 Literature values [20].
Table 2. Sensitivity index for H2S removals.
ParameterSensitivity IndexRank
−20%+20%
KLaS0.25.22
kS9.46.11
HS0.72.93
Publisher’s Note: MDPI stays neutral with regard to jurisdictional claims in published maps and institutional affiliations.

