Article

Evolvement Investigation of Secondary Electron Emission for Ultrathin MgO Coatings Prepared by Atomic Layer Deposition

1
State Key Laboratory of Transient Optics and Photonics, Xi’an Institute of Optics and Precision Mechanics, Chinese Academy of Sciences, Xi’an 710119, China
2
University of Chinese Academy of Sciences, Beijing 100049, China
3
Department of Science and Technology of Guangxi Zhuang Autonomous Region, Nanning 530012, China
4
ZhongKe Atomically Precise Manufacturing Technology Co Ltd., Xi’an 710119, China
5
School of Microelectronics, Xi’an Jiaotong University, Xi’an 710049, China
6
School of Information and Communications Engineering, Xi’an Jiaotong University, Xi’an 710049, China
*
Author to whom correspondence should be addressed.
Appl. Sci. 2021, 11(11), 4801; https://doi.org/10.3390/app11114801
Submission received: 20 April 2021 / Revised: 21 May 2021 / Accepted: 22 May 2021 / Published: 24 May 2021
(This article belongs to the Special Issue Advances of Interfacial Optics)

Abstract

:
MgO is a kind of high secondary electron yield (SEY) material with important applications in electron multipliers. MgO coatings can be used as the electron emission layer for multiplier dynode to improve the electron gain significantly. However, the SEY investigation on ultrathin MgO coatings is not complete and needed to be supplemented urgently. In this work, a series of MgO coatings with increasing thickness were prepared by atomic layer deposition. SEY properties and energy spectra were characterized, and the effect of coating thickness on SEY was systematically analyzed. Experimental results show that SEY of MgO/Si samples rises as the coating thickness increases. Merely, SEY almost does not change with the coating thickness when the thickness exceeds 30 nm. Then, a SEY semi-empirical theory was employed to interpret the SEY regularities of MgO coatings by regarding the coating samples as ideal double-layer structures. Theoretical calculation quantitatively explained the SEY variation observed during the experiments, and further quantified the SEY contribution level of top coating and bottom substrate for the 1 nm and 20 nm MgO coatings. The work is of great significance for comprehending the SEY of ultrathin MgO coatings and expanding the applications of nanoscale coatings with high SEY.

1. Introduction

Secondary electron emission (SEE) refers to the physical phenomenon that some electrons escape from a material after the particle bombardment. SEE phenomenon has been utilized in various sophisticated scientific instruments and electronic devices, such as scanning electron microscope (SEM) [1], photomultiplier tube (PMT) [2,3], microchannel plate (MCP) [4,5,6], etc. In addition, SEE can also induce adverse effects in some typical working occasions. For instance, SEE is one of the inducements of multipactor in space of a high-power microwave system [7,8]. In particle accelerators, SEE may lead to an e-cloud effect, which could further influence the energy and direction stabilities of the passing proton beams [9,10]. Therefore, in spacecrafts and accelerators, SEE phenomenon usually needs to be suppressed to lower the risk of detrimental effects [11,12]. SEE characteristics of various materials are of significant distinctions, and for different working occasions, the suitable materials ought to possess a certain SEE level to match the working environments [13,14,15].
SEE is widely applied in the modern electronic industry to accomplish diverse functions for various electron devices. For instance, the coating material possessing a high SEE ability can be used in ultra-fast detectors to improve its time resolution and spatial resolution [16,17]. In addition, the coatings with high secondary electron yield (SEY, also denoted as δ) can also be used for the pattern recognition in particle physics experiments to enhance the performance of time resolution and track separation [18]. Furthermore, for transmission dynodes (tynodes) device, SEE also play a significant role on its multiplying efficiency [19,20]. To be specific, for the electron multiplier devices, such as tynodes, PMT, and MCP, the inner dynodes ought to possess a high SEY level so as to improve the electron gain and lower the noise, which makes considerable sense for various detectors employing multipliers as amplifier unit [21].
For a variety of multipliers, electron multiplication efficiency of the device can be greatly improved by depositing high SEY coatings on the dynode surface. Magnesium oxide (MgO) is an excellent candidate for dynode coating material since it possesses relatively high SEY. As early as in 1973, Henrich et al. acquired the MgO coating of 300 nm thickness via sputtering technology, measurements showed that the SEY peak value (also denoted as δm) of the MgO coating equaled to 8 [22]. Choi et al. studied the SEE behavior of MgO single crystals with different crystal orientations under Ne ion bombardment in 1999, and found that MgO single crystals with crystal orientations <111> had the highest electron emission efficiency under ion bombardment [23]. Although SEY of MgO in various published literatures are different, it is commonly higher than the SEY of many other materials. Based on the related studies, δm of MgO reported in various literatures is relatively broad, ranging from 5 to 12 [19,22,24,25,26]. The high SEY property of MgO enables itself to be applied in many devices. For example, in 1981, Manalio et al. carried out the study of coating MgO film on the inner surface of a channel electron multiplier to improve the electron multiplier efficiency and applied the multiplier in the detector. The study showed that the MgO coating increased the efficiency of the detector by more than 3 times [27]. In 2002, Vink et al. studied the influence of MgO coating on the surface of emission cathode on the opening voltage of plasma display, and the test results showed that the high electron emission efficiency of MgO film reduced the opening voltage of display by more than 50% [28]. In 2004, Ohtsu et al. used MgO to replace the aluminum electrode in the capacitive coupling RF plasma source, which improved the breakdown voltage generated on the electrode and increased the plasma density generated at high RF voltage by tens of times [29]. At present, SEY study on MgO are mostly limited to bulk material or thick film, and related SEY studies for nanoscale ultrathin MgO coatings are seldom reported, which makes the occasions employing ultrathin MgO films, such as the design of MCP functional layer, lack of experimental research and theoretical support. Therefore, further research is needed regarding the SEE characteristics of ultrathin MgO coatings.
In this work, from both experimental and theoretical aspects, we systematically studied the SEE characteristics of the nanoscale MgO coatings (thickness ranges from 1 to 30 nm), and revealed the dependence of SEY on the coating thickness; finally, we obtained the quantified SEY regularities of MgO/Si double-layer structures. In the research, we prepared a series of ultrathin MgO coatings with increasing thickness by employing atomic layer deposition (ALD) technique, and characterized their SEE properties and electron spectra characteristics, as well as concluded the SEY evolution regularities with the variation of the coating thickness. By utilizing the SEE model developed for double-layer structures, we calculated the theoretical SEY values of MgO/Si double-layer structures and gave the quantified influence of coating thickness on SEY theoretically. In addition, for the purpose of quantifying the SEY contribution level of two layers, we broke down the calculated SEY curves, and extracted the SEY proportions contributed by the top layer and bottom layer, respectively, for the 1 nm and 20 nm MgO coating samples. The extracted SEY curves quantitatively interpreted the SEY dependence on the top and bottom layer with the change of the top coating’s thickness. The results obtained via the theoretical calculation kept in well accordance with the experimental phenomena.

2. Preparation and SEY Characterization Methods of MgO Coatings

2.1. Preparation of MgO Coatings by ALD

ALD technique was used to prepare MgO films. Heavy-doped silicon sheets with low resistance were used as the substrates (n-type Si, crystal direction <100>, resistivity less than 0.3 Ω·cm). Chemical reaction diagram of MgO film prepared by ALD is shown in Figure 1. In the preparation experiments, high-purity nitrogen (99.99% purity) was used as carrier gas, and the precursors of ALD reaction contain Mg(C5H5)2 and water vapor. During the experiment, the reaction temperature in the chamber was 200 °C, the gas flow of the carrier gas was 20 sccm, and the pressure of the reaction chamber was maintained at 0.1 Pa. The process of preparing MgO using ALD process can be briefly described as follows: Step 1, introduce gaseous Mg(C5H5)2 for 2 s to react with the -OH surface. Step 2, after the reaction in step 1, the byproduct C5H6 is born and a -Mg(C5H5) surface is acquired, then introduce carrier gas N2 for 10 s to remove the byproduct C5H6. Step 3, inject water vapor into the chamber for 0.02 s to react with the -Mg(C5H5) surface. Step 4, after the reaction, the by-product C5H6 is born again and a -OH surface is obtained, then introduce N2 for 10 s to remove the byproduct C5H6. When the above four steps have been carried out, one ALD cycle is completed and a single layer of MgO is formed. The film with a specific thickness can be prepared by repeating the ALD cycle for a certain time. For our experiment conditions, the increment of film thickness after one ALD cycle is about 0.1 nm, and the experiment results reveal that the more cycles were carried out, the more stable the deposition rate is. In the research of this section, the count of ALD cycle is set as 10, 30, 70, 120, 200 and 300 respectively, the expected thickness values of these films are 1, 3, 7, 12, 20 and 30 nm.

2.2. SEY Measurement of MgO Coatings

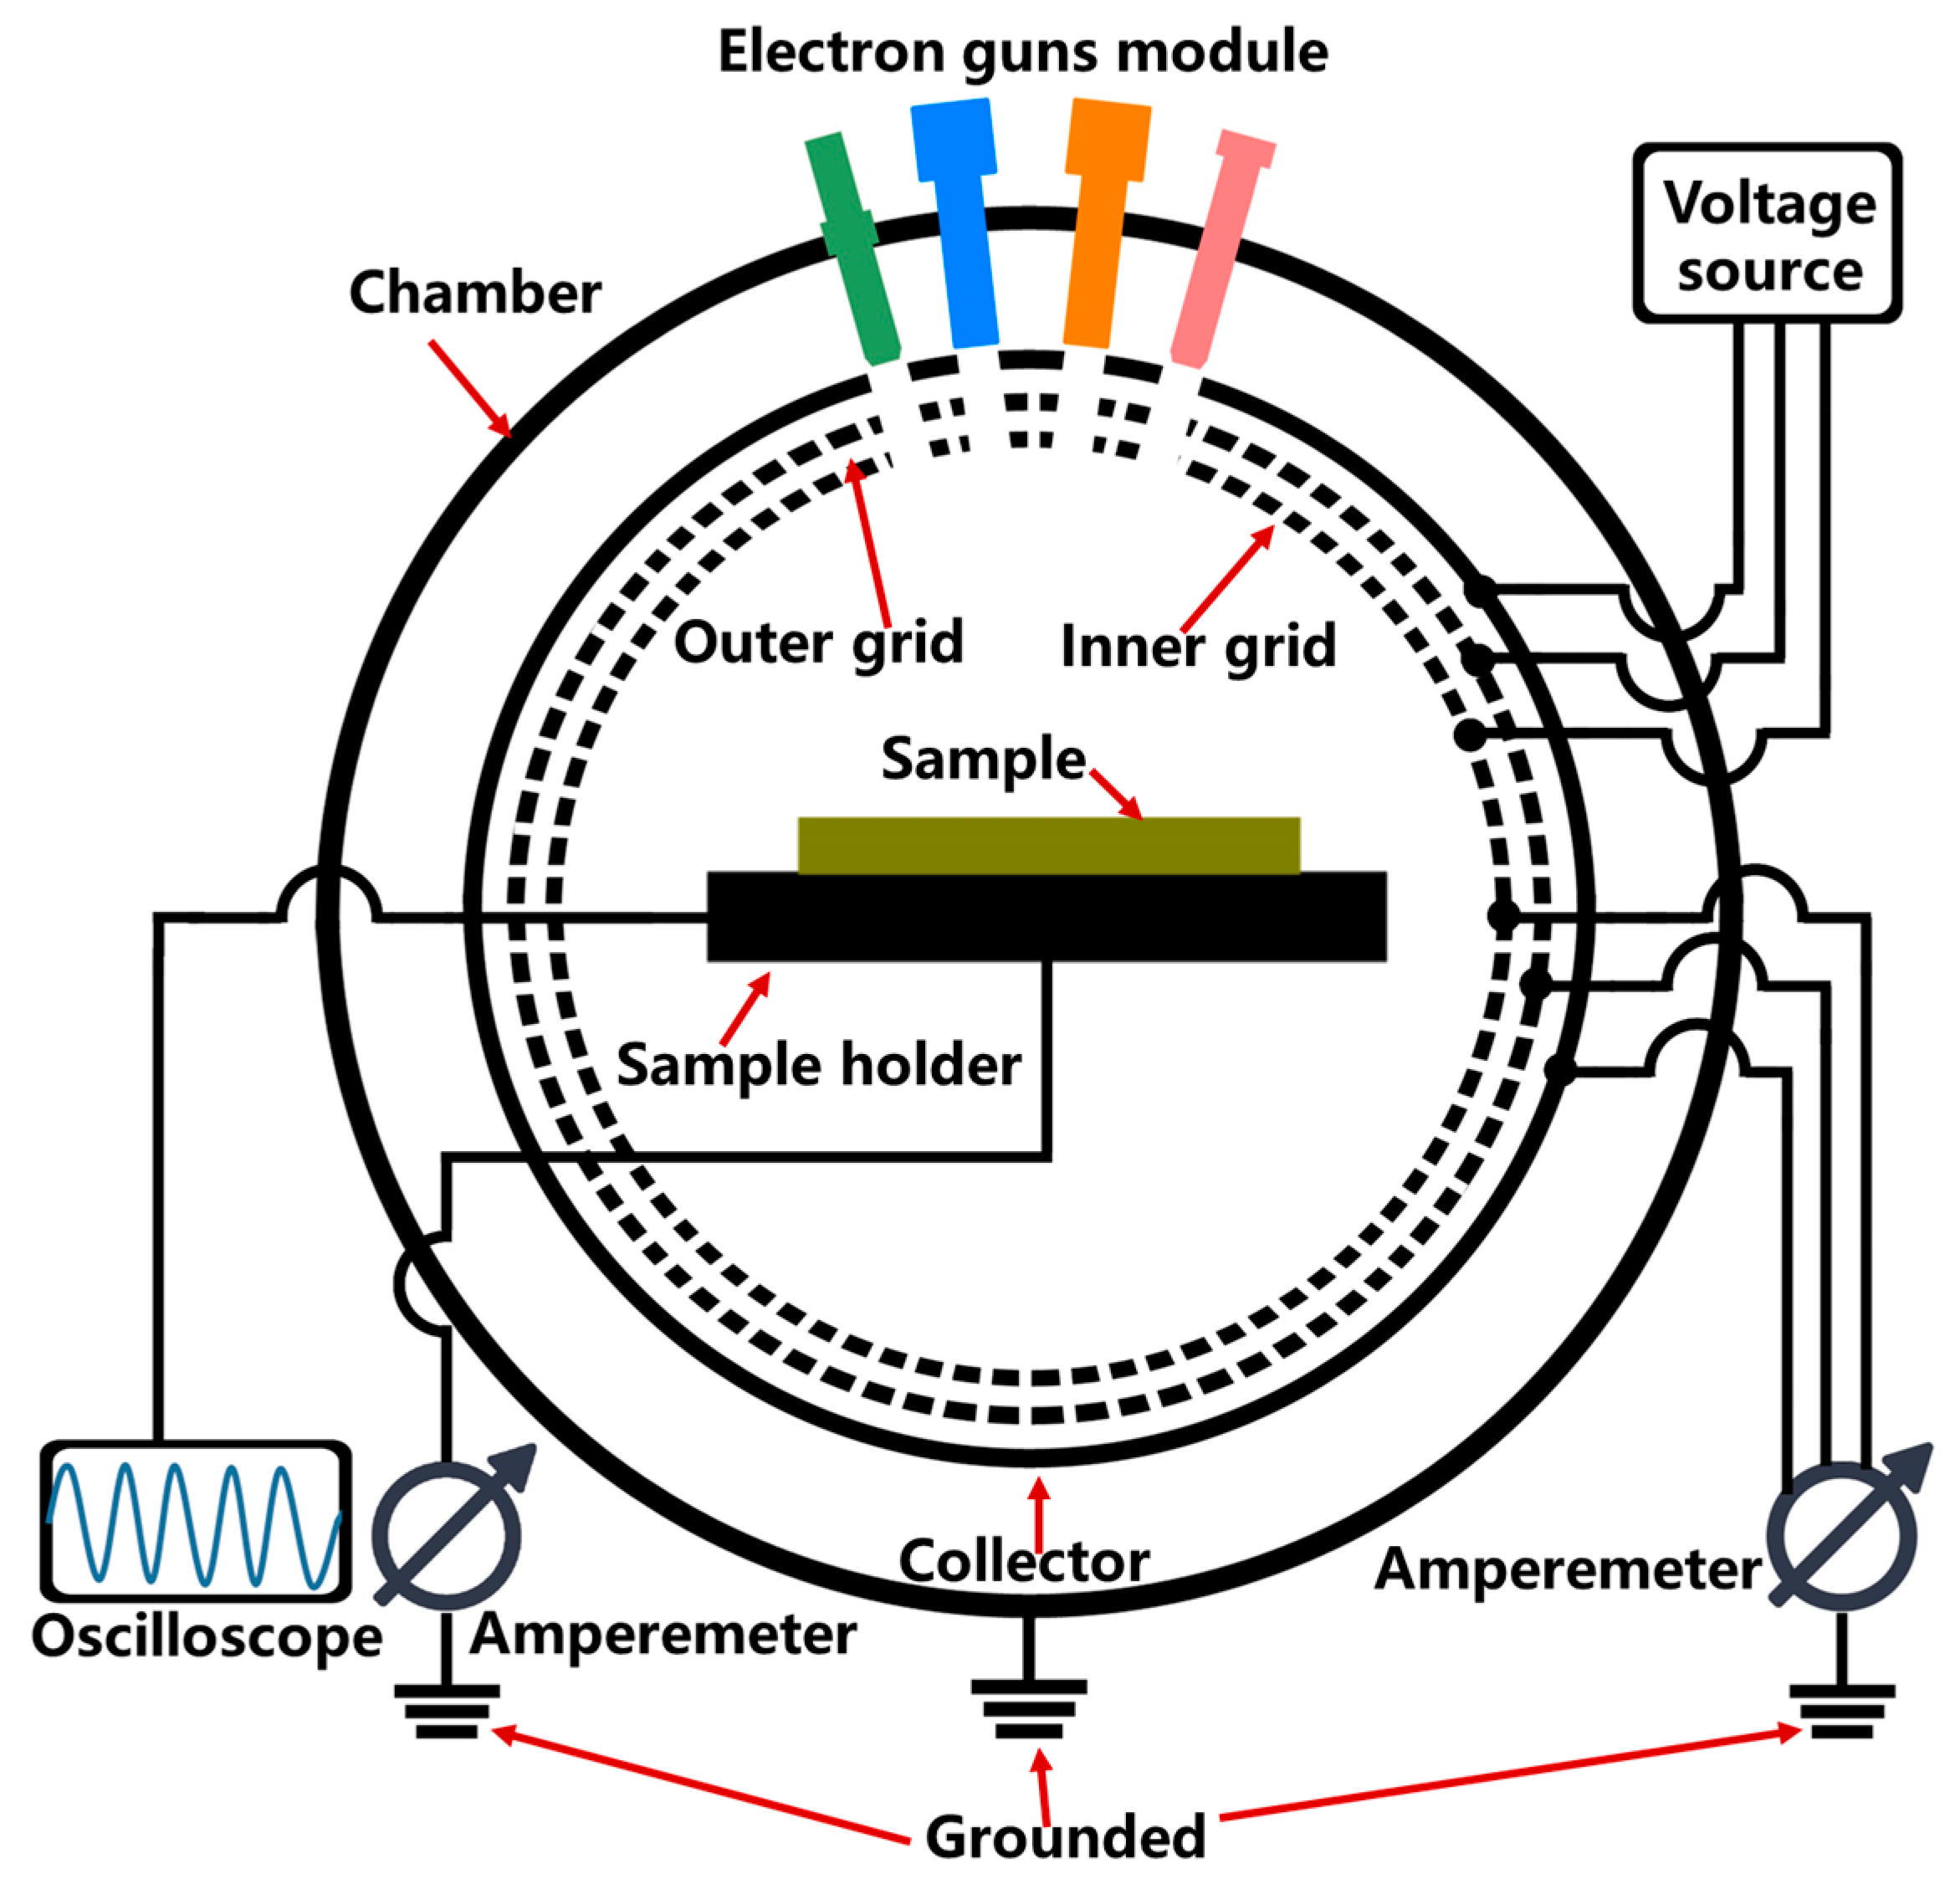
Figure 2 shows the internal structure schematic diagram of the SEE measurement platform employed in this study. As shown in Figure 2, the facility mainly contains six parts, including electron gun components (including test gun and neutralization gun), collectors (including inner grid, outer grid and collector), voltage source (Keithley 6487) and precision current meter (Keithley 6485), signal amplifier unit (ADA4817-1), oscilloscope (Rigol DS7014), as well as ultrahigh vacuum acquirement system. The facility employs a high precision electron gun (Kimball 3101D) to generate the primary electron beam, and the electron beam density is 80 nA. Size of the beam spot varies as the electron beam energy increases; to be specific, the spot diameter is about 900 μm when primary electron energy (denoted as Ep) equals to 80 eV, and is about 80 μm when Ep equals to 1500 eV. In addition, we utilize the signal generator (Rigol DG4102) to produce pulsed signals, rise time and fall time of the single pulse are 500 ns, and the pulse width is 10 μs. Surface charge neutralization for dielectric materials is achieved by the neutral electron gun. To be specific, when the surface is positively charged, we use the low-energy electrons (less than 10 eV energy) to irradiate the surface to eliminate the accumulated positive charges. On the contrary, if the sample surface is negatively charged, we utilize the low-energy ions to irradiate the surface to neutralize the accumulated electrons. To determine whether the surface is neutralized, the external oscilloscope with four channels is connected with the sample holder to monitor the sample potential since the induction charges will be produced at the sample bottom when the sample is positively or negatively charged.
The steps for SEY testing can be briefly described as follows: First, the chamber pressure is pumped below 10−5 Pa to meet the environmental requirements of the test. Second, to measure the current of primary electron beam, the metallic sample holder (not the sample) is irradiated by the electron beam; at the same time, an external high-precision current meter is used to measure the sample current (ISC) and secondary electron current (remember ISEC1). Here, a secondary electron current contains three parts: inner grid current, outer grid current and collector current. Third, the sample is moved onto the sample holder and is irradiated with the same electron beam, and then the secondary electron current (denoted as ISEC2) is measured again. After the above tests, SEY of the sample can be calculated by the following formula:
δ = I SEC 2 I SC + I SEC 1

2.3. Energy Spectrum and Surface Analysis Methods

Secondary electron energy spectrum (SEES) is another important parameter to characterize the SEE properties of the material, which represents the energy distribution state of the ejected electrons. Therefore, to comprehend the SEE phenomenon more deeply, an Auger electron spectrometer (DESA150, STAIB Instruments) was used to measure the SEES of MgO/Si double-layer structures in this experiment, vertical incidence is applied and Ep was set as 1000 eV during the measurement.
To characterize the coating thickness, Gemini SEM 500 manufactured by Zeiss in Germany is employed to observe the section image of the MgO coatings. Furthermore, an atomic force microscope (AFM), Innova AFM manufactured by Bruker in Germany, is utilized to measure the surface roughness.

3. Results and Discussions

3.1. Surface Analysis of MgO/Si Double-Layer Structures

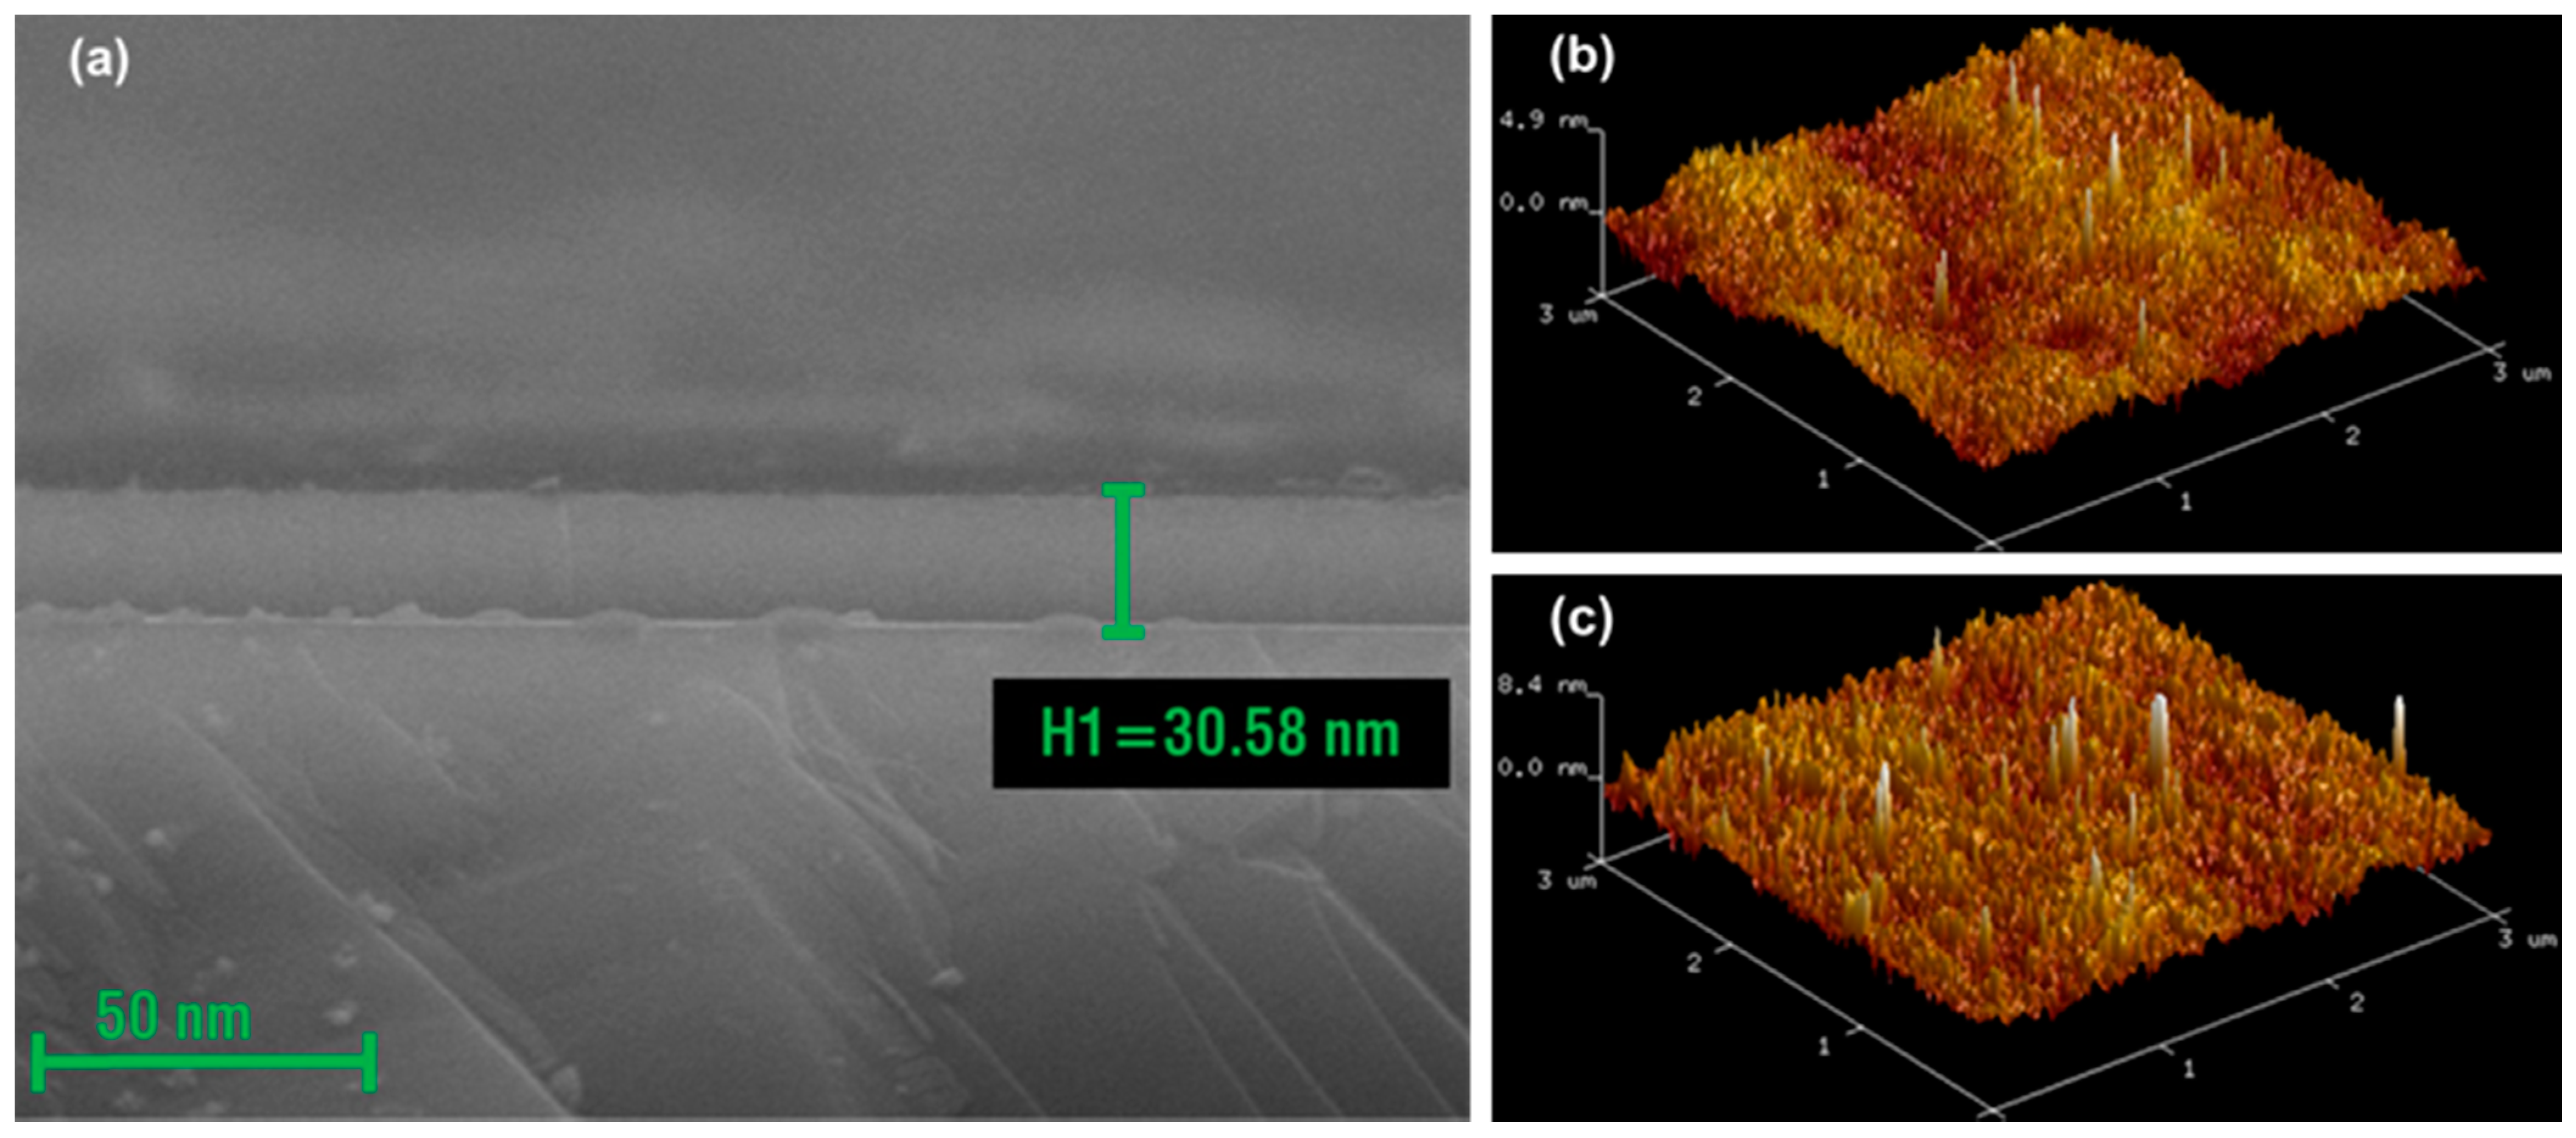
Figure 3 shows the surface analysis results of the MgO coatings, including the section image of 30 nm MgO coating observed by SEM, as well as the surface roughness images of 20 nm and 30 nm MgO coating characterized by AFM. Section image in Figure 3a shows that the real thickness of 30 nm MgO coating is about 30.58 nm, which indicates that there is little distinction between the real and estimated thickness of the coating, and further demonstrates that the ALD process we employed in this work is relatively stable. From the AFM images shown in Figure 3b,c, we know the roughness of the ALD MgO coatings are relatively flat. The measurement results shows that the Root Mean Square Roughness values of all the MgO coating samples are less than 1 nm.

3.2. SEE Characteristics of MgO/Si Double-Layer Structures

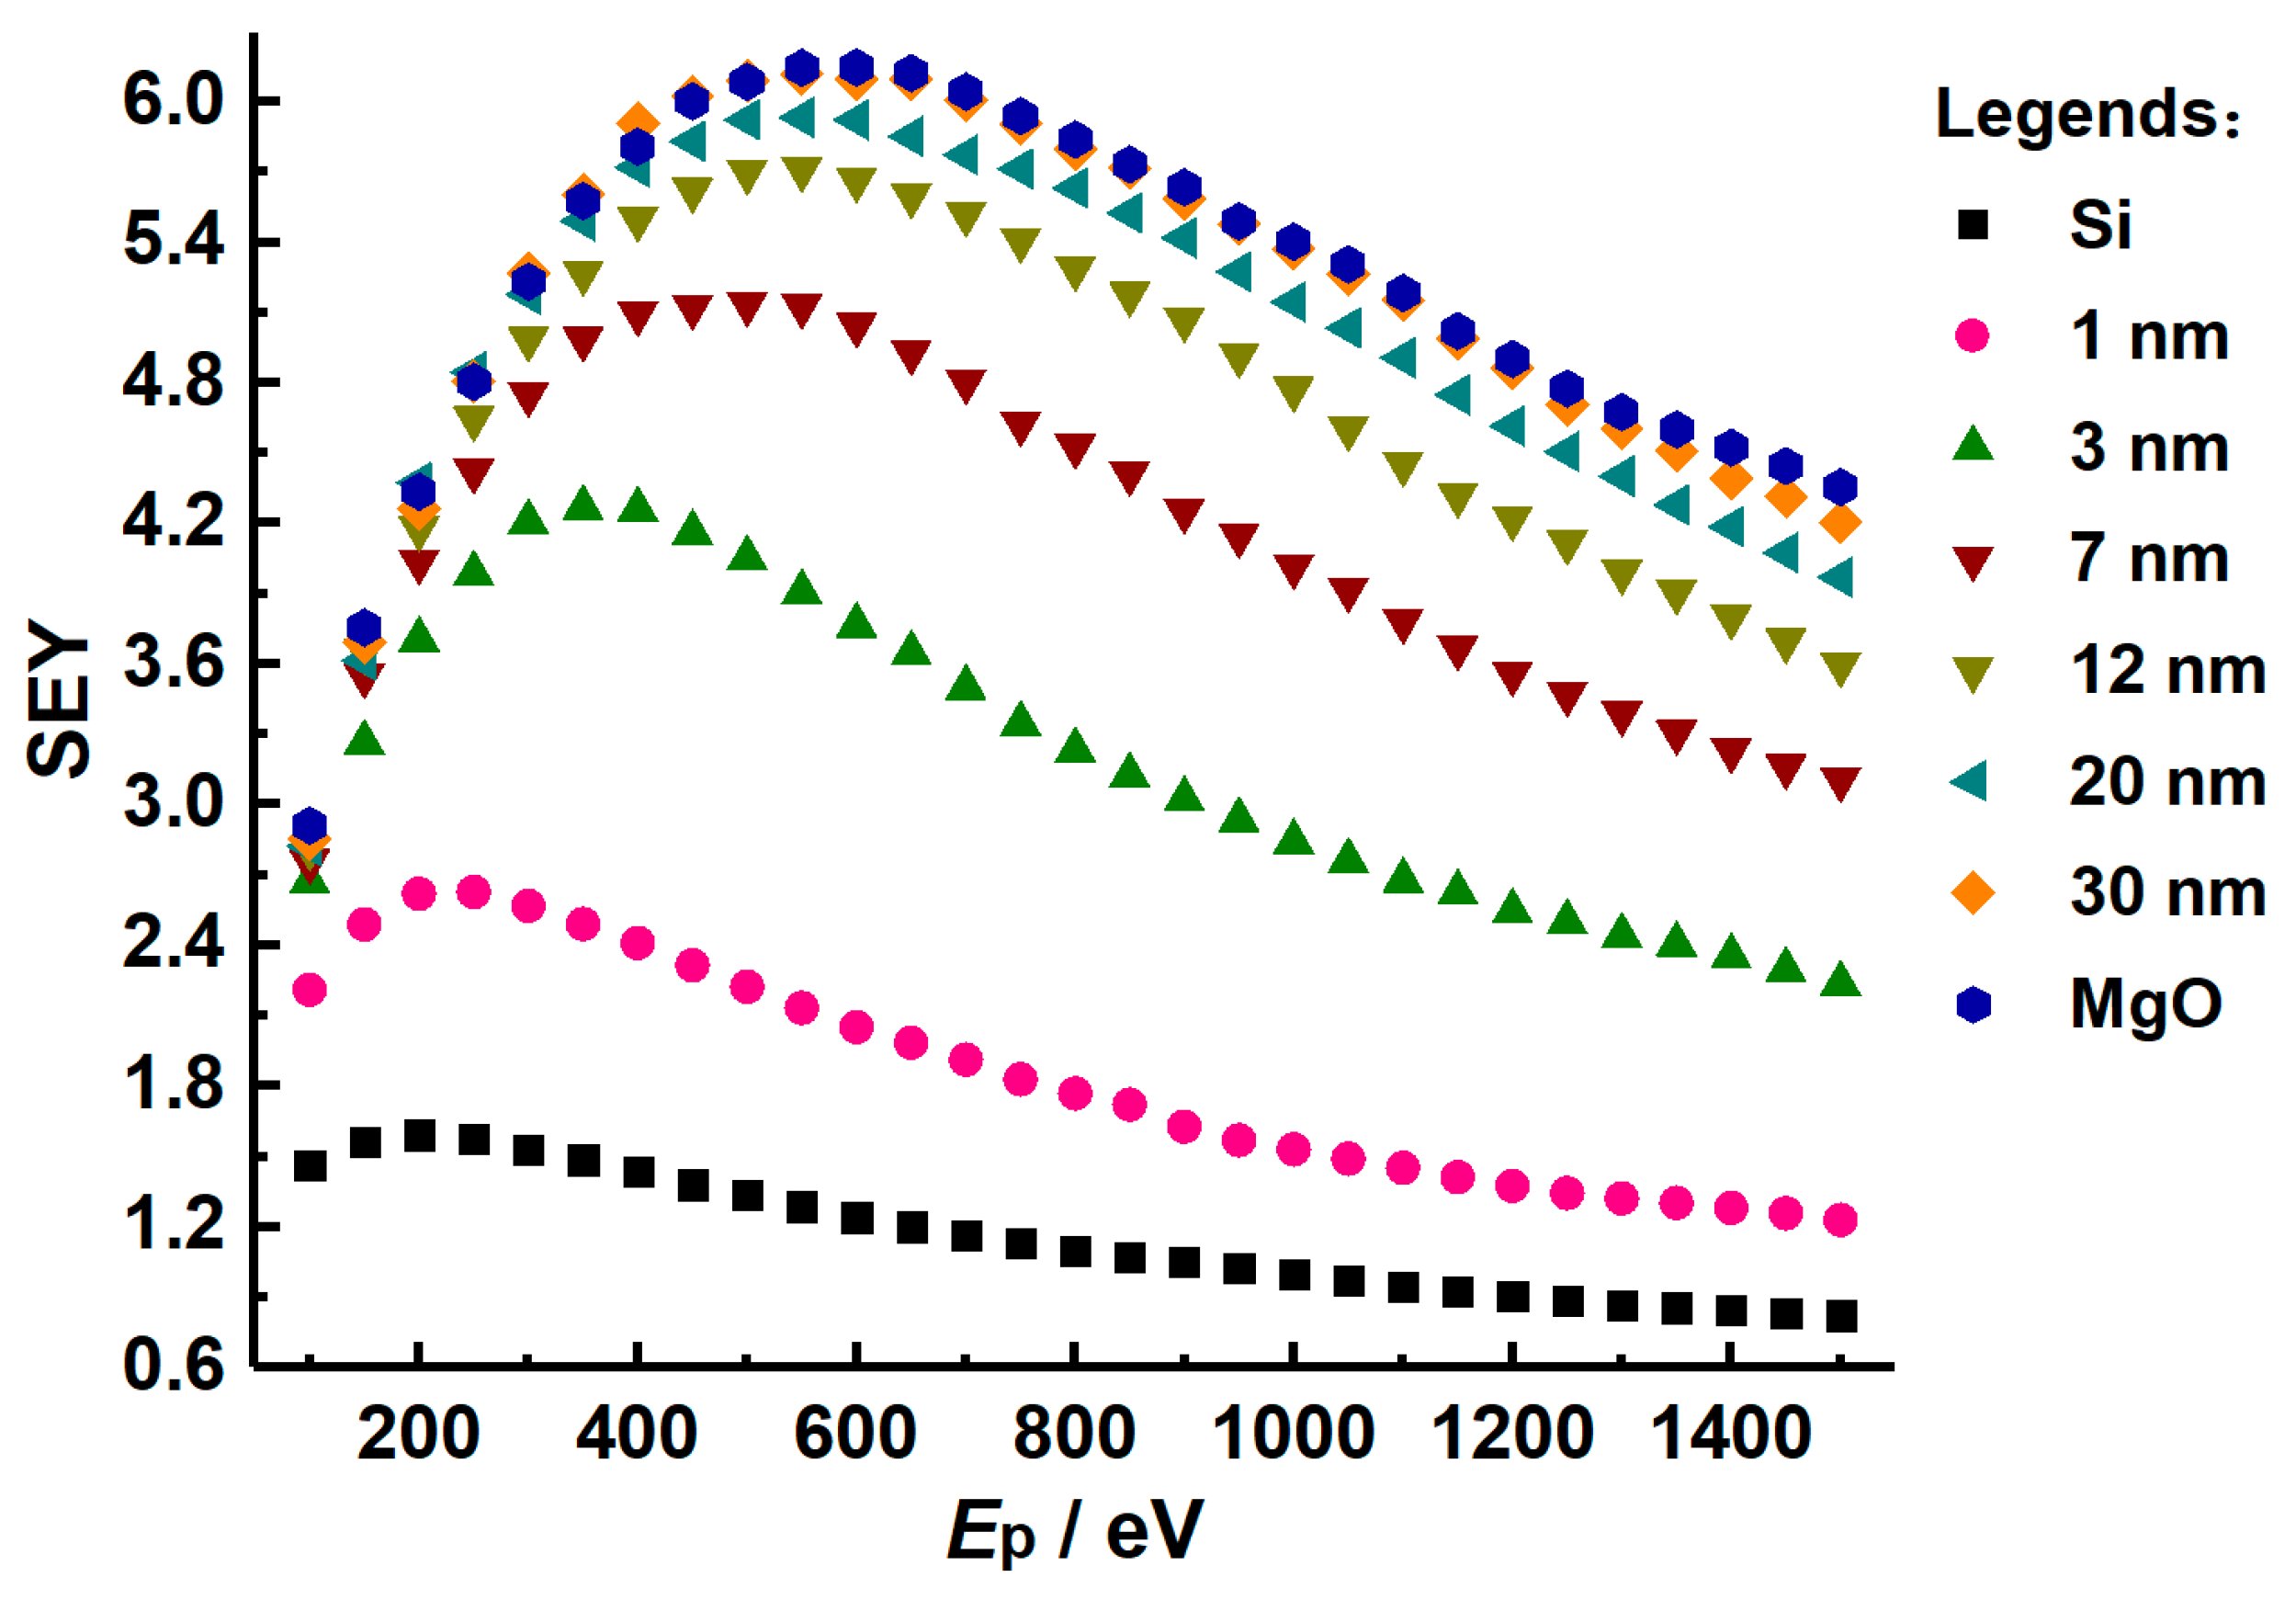
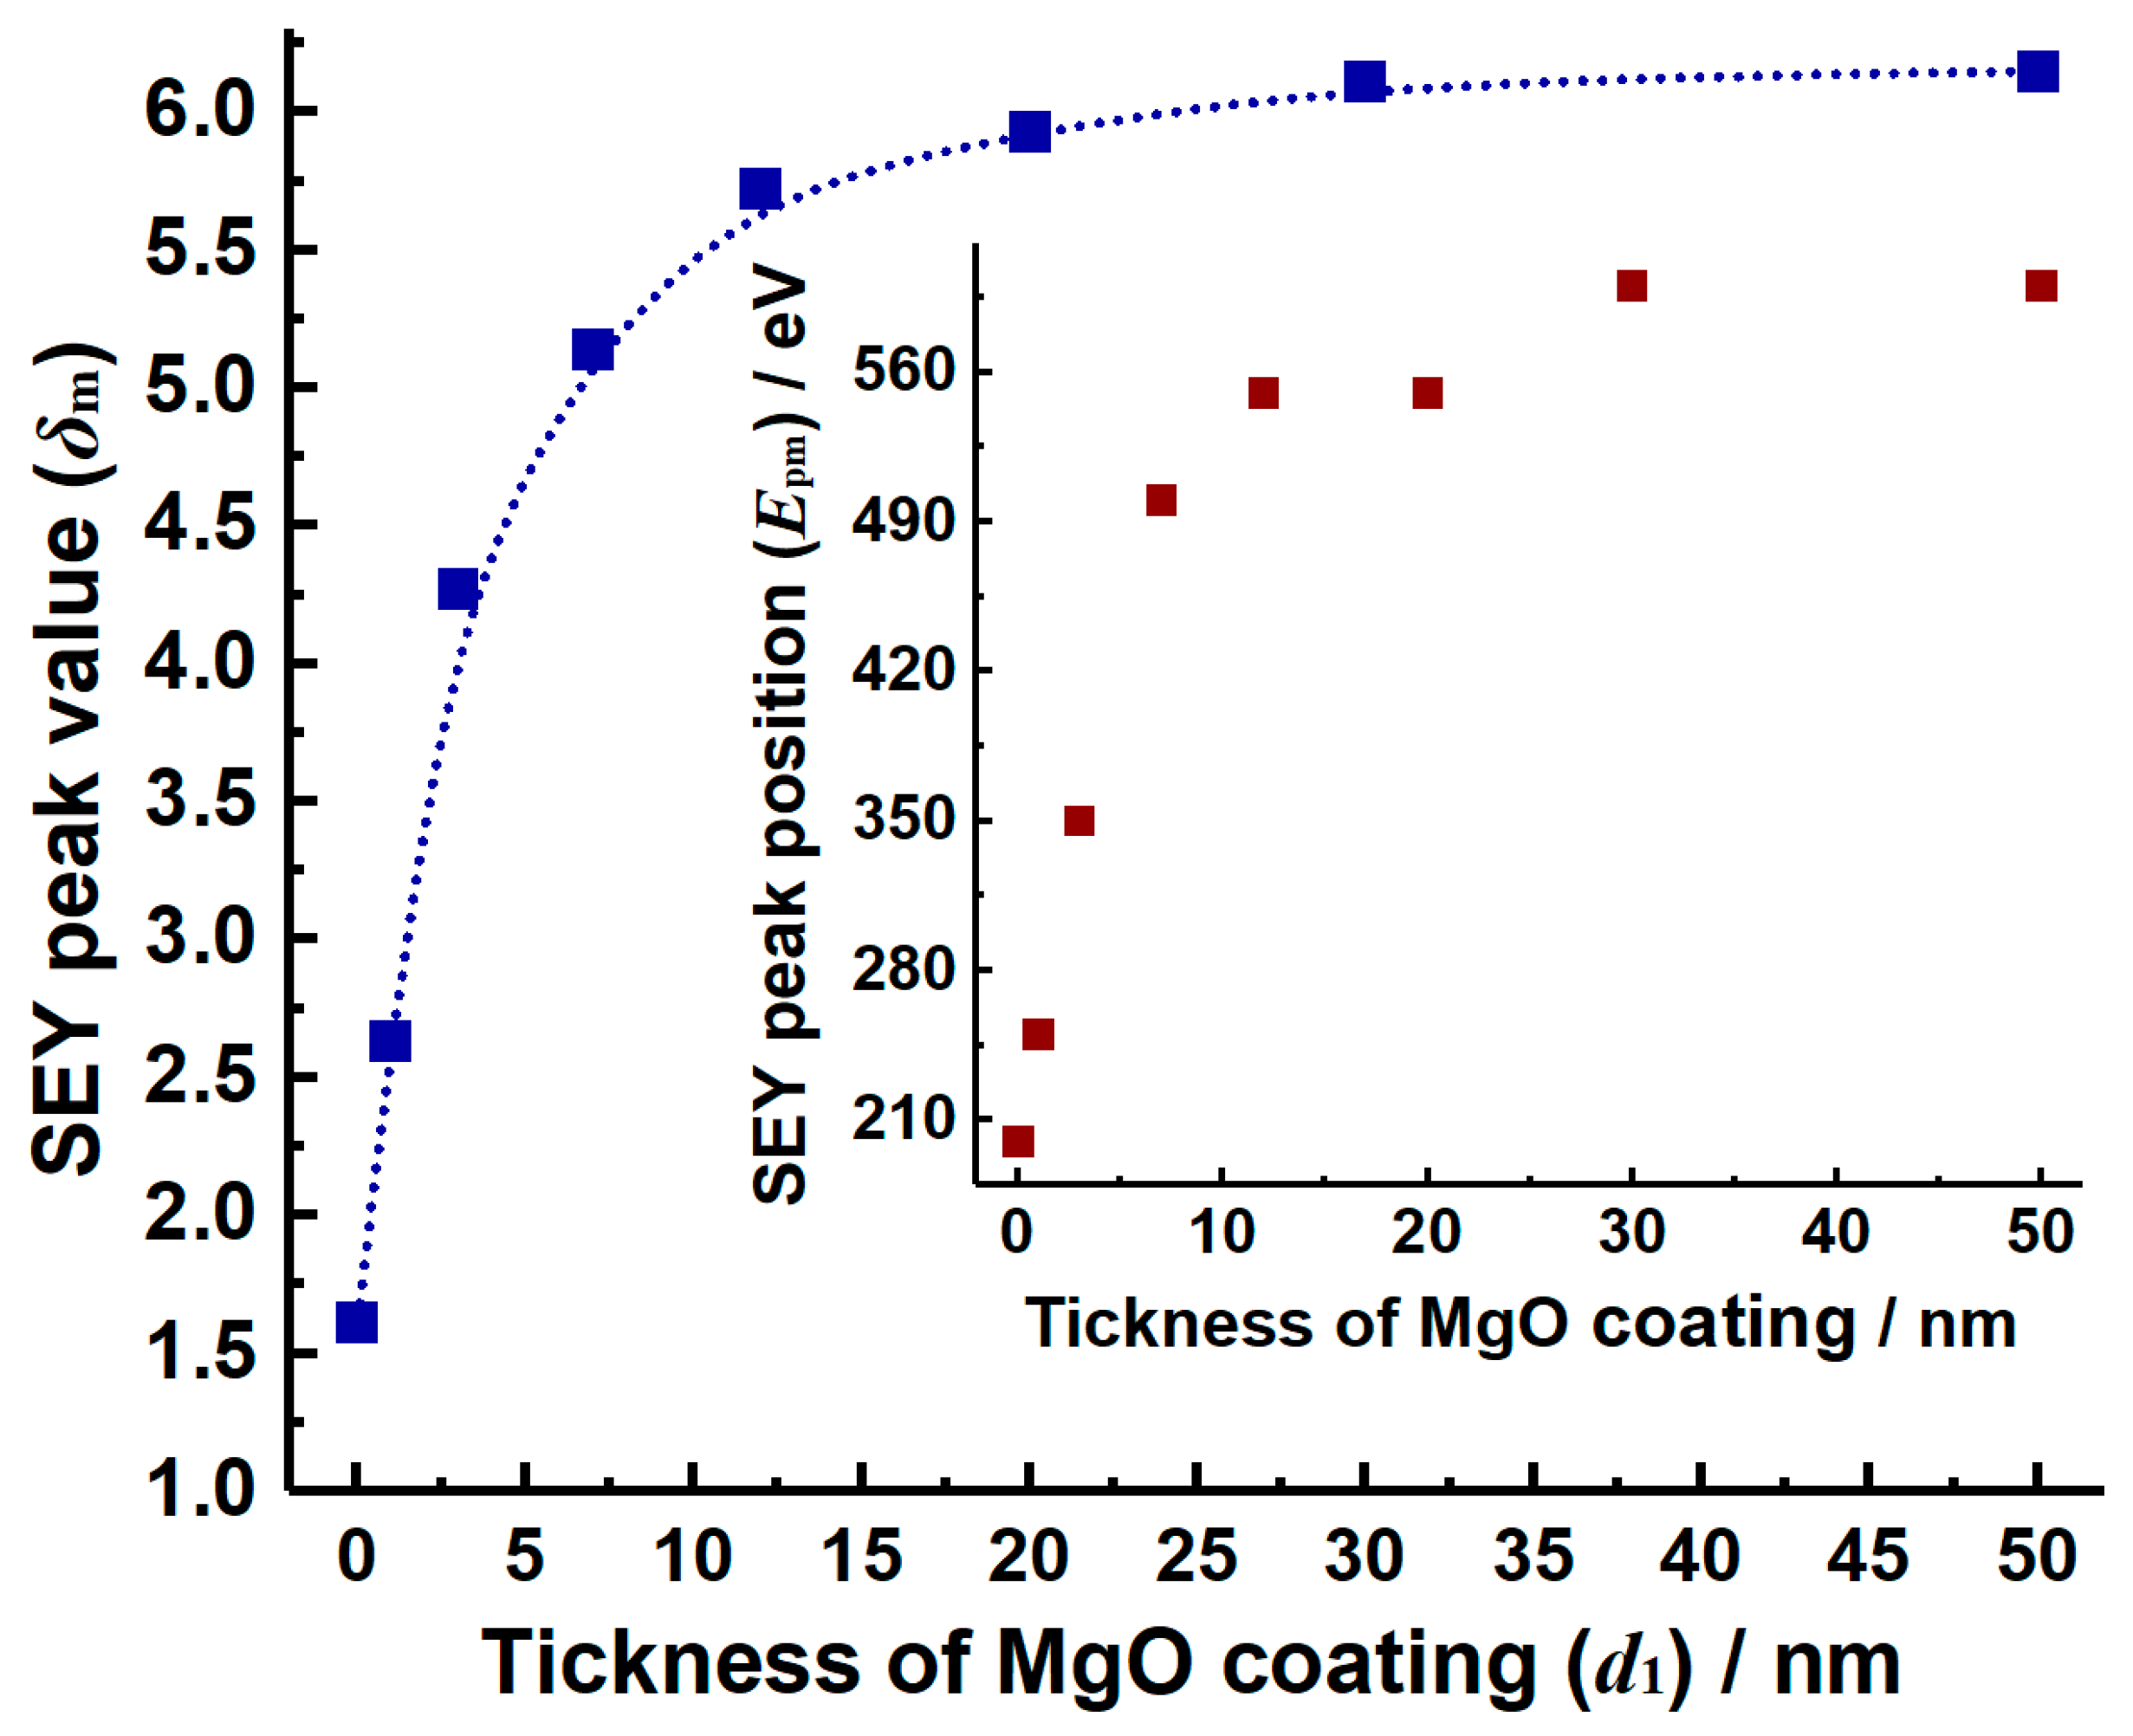
The SEY curves of the sample measured in the experiment are shown in Figure 4. Here, parameter d1 is used to represent the thickness of MgO coatings. Figure 5 shows the relationship between the SEY peak value and the coating thickness, as well as the relationship between primary electron energy corresponding to the SEY peak value and the thickness of MgO coating. Table 1 lists the typical parameters of the SEY curves shown in Figure 4. From Figure 4, it can be observed that SEY of the 1 nm MgO coating sample increases significantly compared with that of the Si substrate, which indicates that coating an ultrathin MgO film on Si will improve the surface SEY greatly. Meanwhile, it also indicates that the most surface of the material has a significant influence on its SEY. In addition, the results in Figure 5 show that the SEY of MgO/Si double-layer structures rises as the thickness of MgO coating increases, and merely, the SEY increment gradually decreases. Additionally, SEY tends to be stable when the coating thickness exceeds 30 nm. For the MgO/Si double-layer structure of 30 nm thickness, its SEY is relatively close to the SEY of pure MgO, especially in the region of Ep less than 1200 eV. When Ep increases from 1200 eV, difference of SEY between 30 nm sample and pure MgO reveals gradually; this phenomenon indicates that the Si substrate layer starts to affect SEY of the double-layer structure at this time, and also indicates that the electron penetration depth in MgO is close to 30 nm when Ep equals to 1200 eV. Meanwhile, the escape depth of inner secondary electrons also plays an important role on SEY, and it should be comprehensively considered when analyzing the SEY distinctions among different MgO coatings.

3.3. Secondary Electron Energy Spectra Characterization

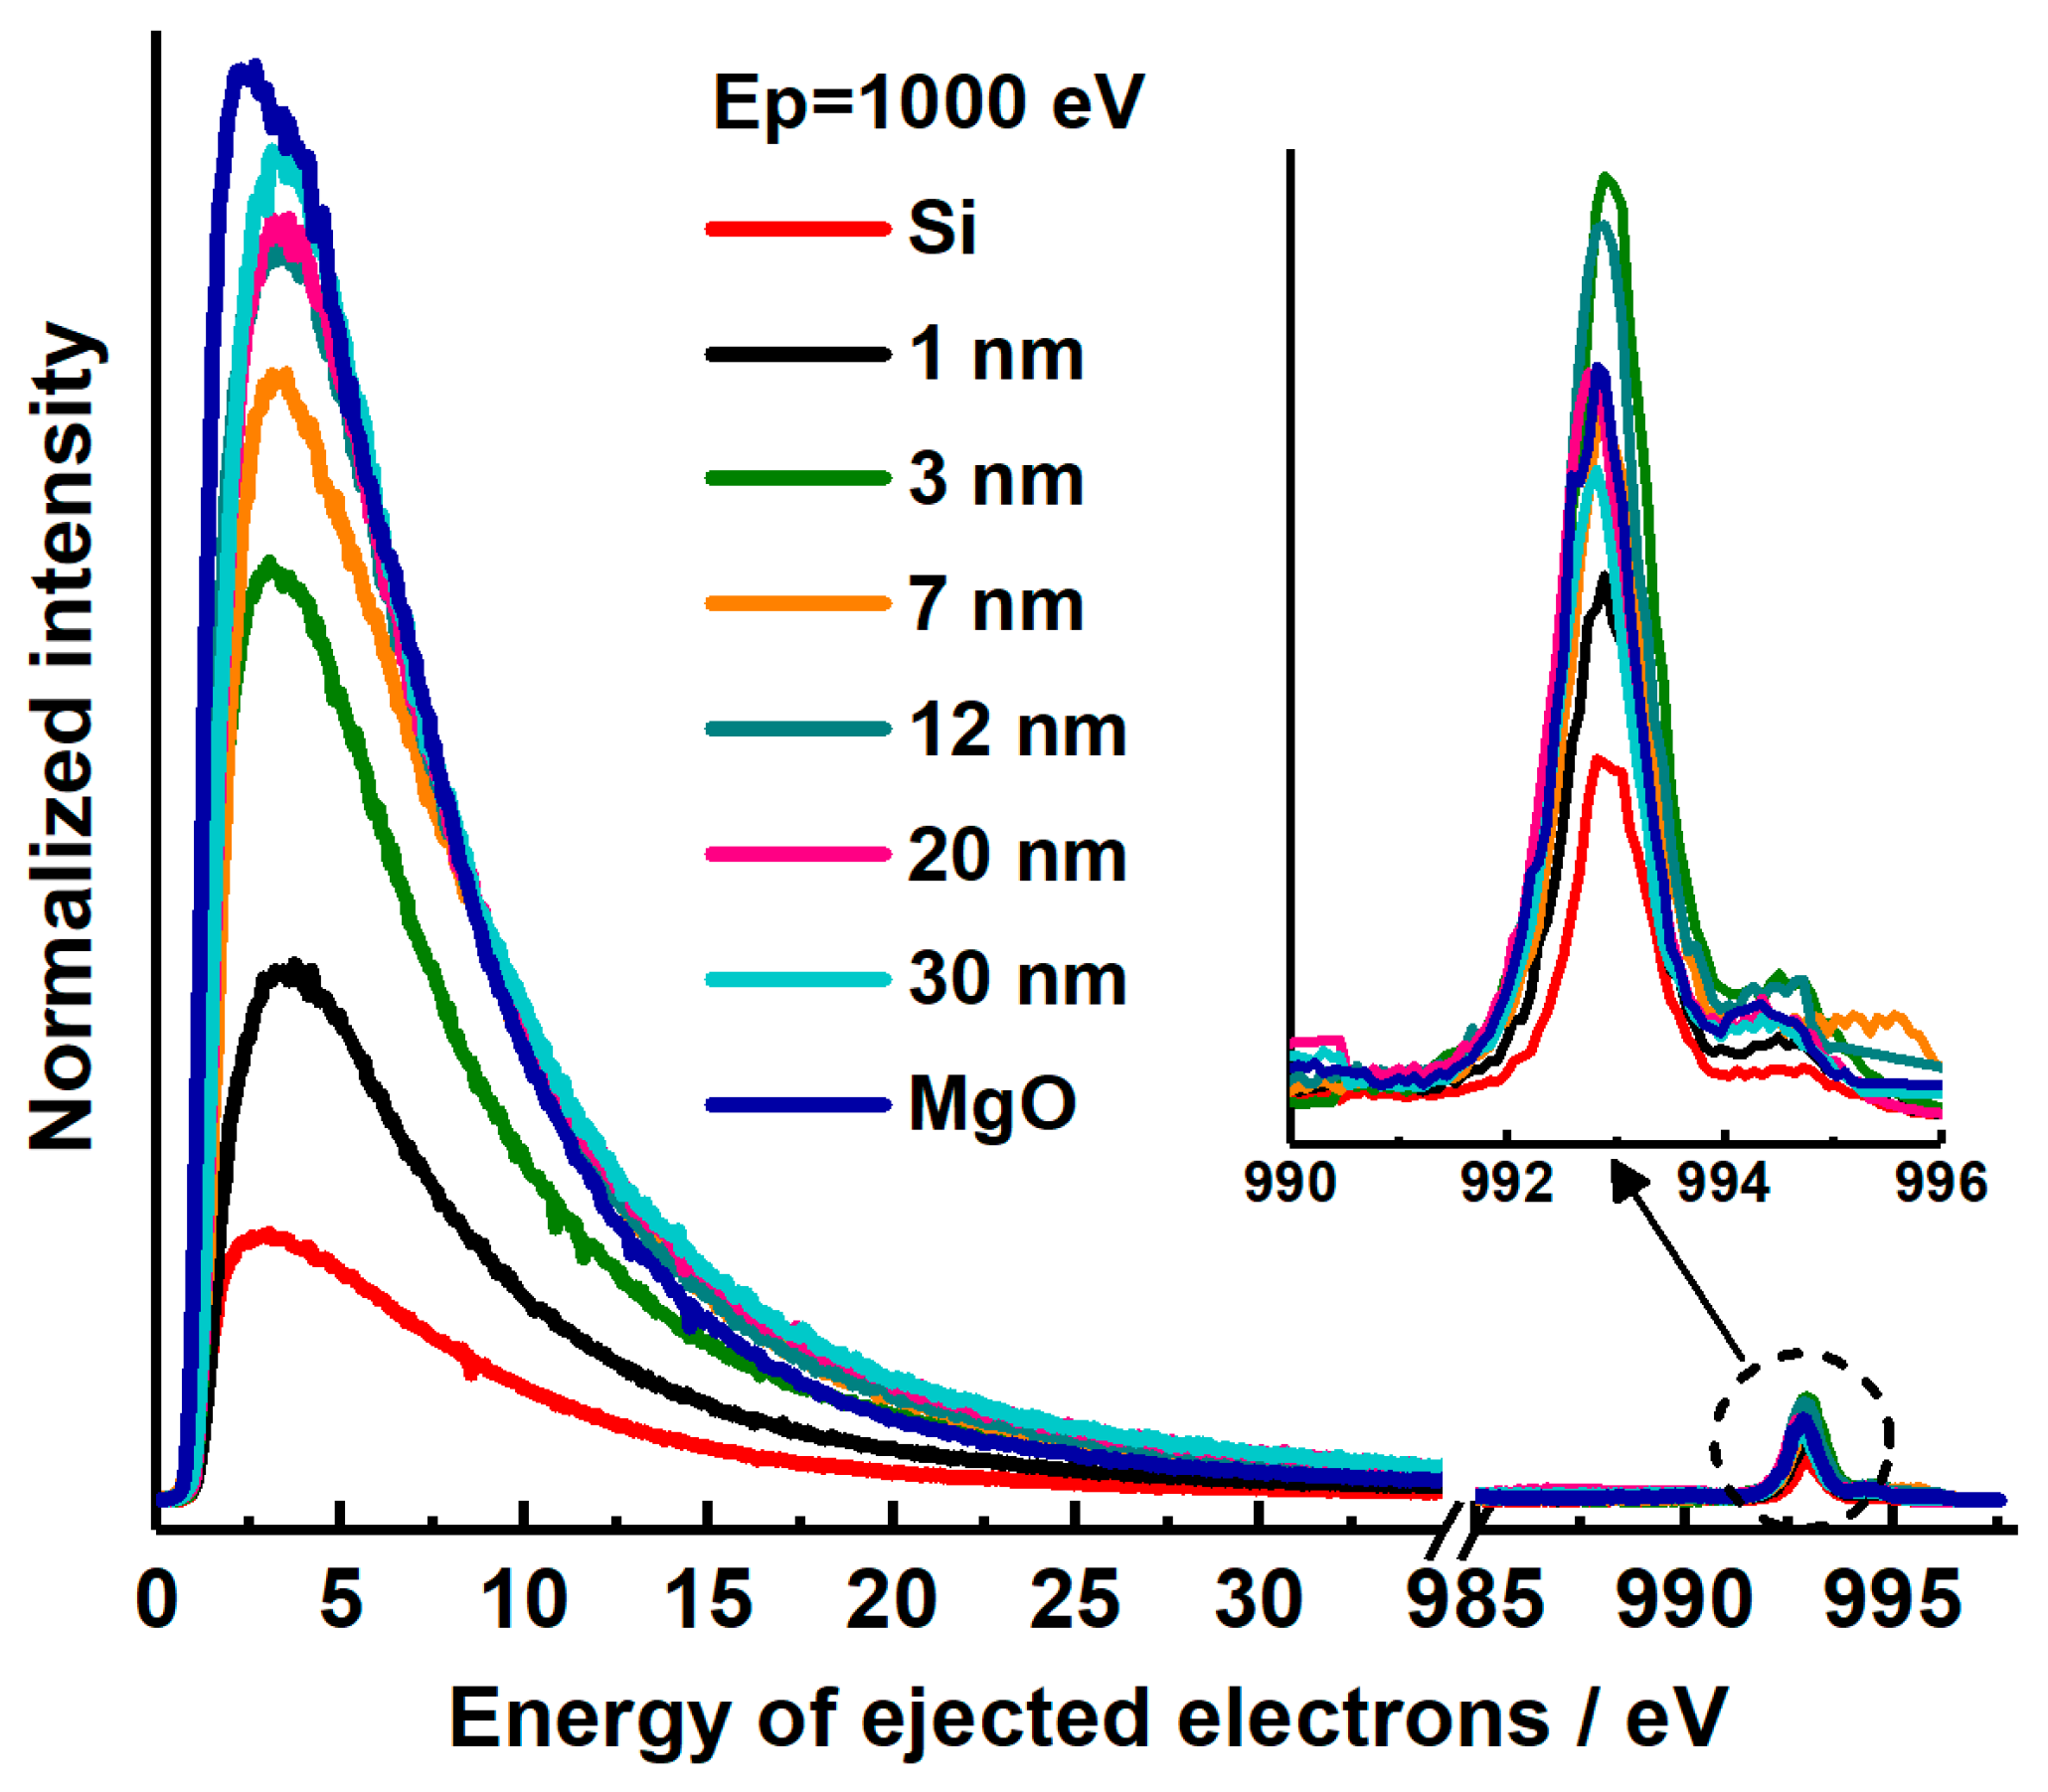
Figure 6 shows all the normalized SEES curves. Here, the normalization process can be briefly illustrated as follows. First, calculate the sum of the data on the vertical axis of original SEES curve to acquire the total number of the ejected electrons since the vertical axis refers to the relative quantity of the ejected electrons. Second, utilize the ejected electron quantity corresponding to each energy being divided by the sum of ejected electrons so as to acquire the ejected electron proportion. Third, multiply the calculated proportion by the corresponding SEY value (Ep equals to 1000 eV) and then obtain the normalized SEES curve. From Figure 6, we see that every SEES curve contains two peaks, in which the left low-energy peak is induced by the true secondary electrons, and the right high-energy peak is induced by the backscattered electrons. By comparing the SEES curves in Figure 6, three conclusions can be drawn. First, the integral area of low-energy range (less than 50 eV) is much larger than that of high-energy range, which indicates that the true secondary electrons account for a large proportion in all the ejected electrons since the integral area of SEES curve directly represents the SEE level. Second, a large integral area for true secondary electrons also reveals that the high SEY property of MgO is benefitted by a great many excited inner secondary electrons after the primary electrons’ penetration; on the contrary, the backscattering process contributes little to the ejected electron yield. Third, Figure 6 shows that the integral area of low-energy peak augments with the increase of MgO coating thickness, indicating that the sample with large thickness of MgO coating has a higher true SEE ability, which is consistent with the SEY curves shown in Figure 4. It should be noted that the initial electron energy set in this part of the energy spectrum test experiment is 1000 eV, and the peak position of the backscattered electron peak obtained is 993 eV, which may be caused by the error of the electron gun itself.

3.4. Theoretical Analyzation of SEE Processes in a Double-Layer Structure

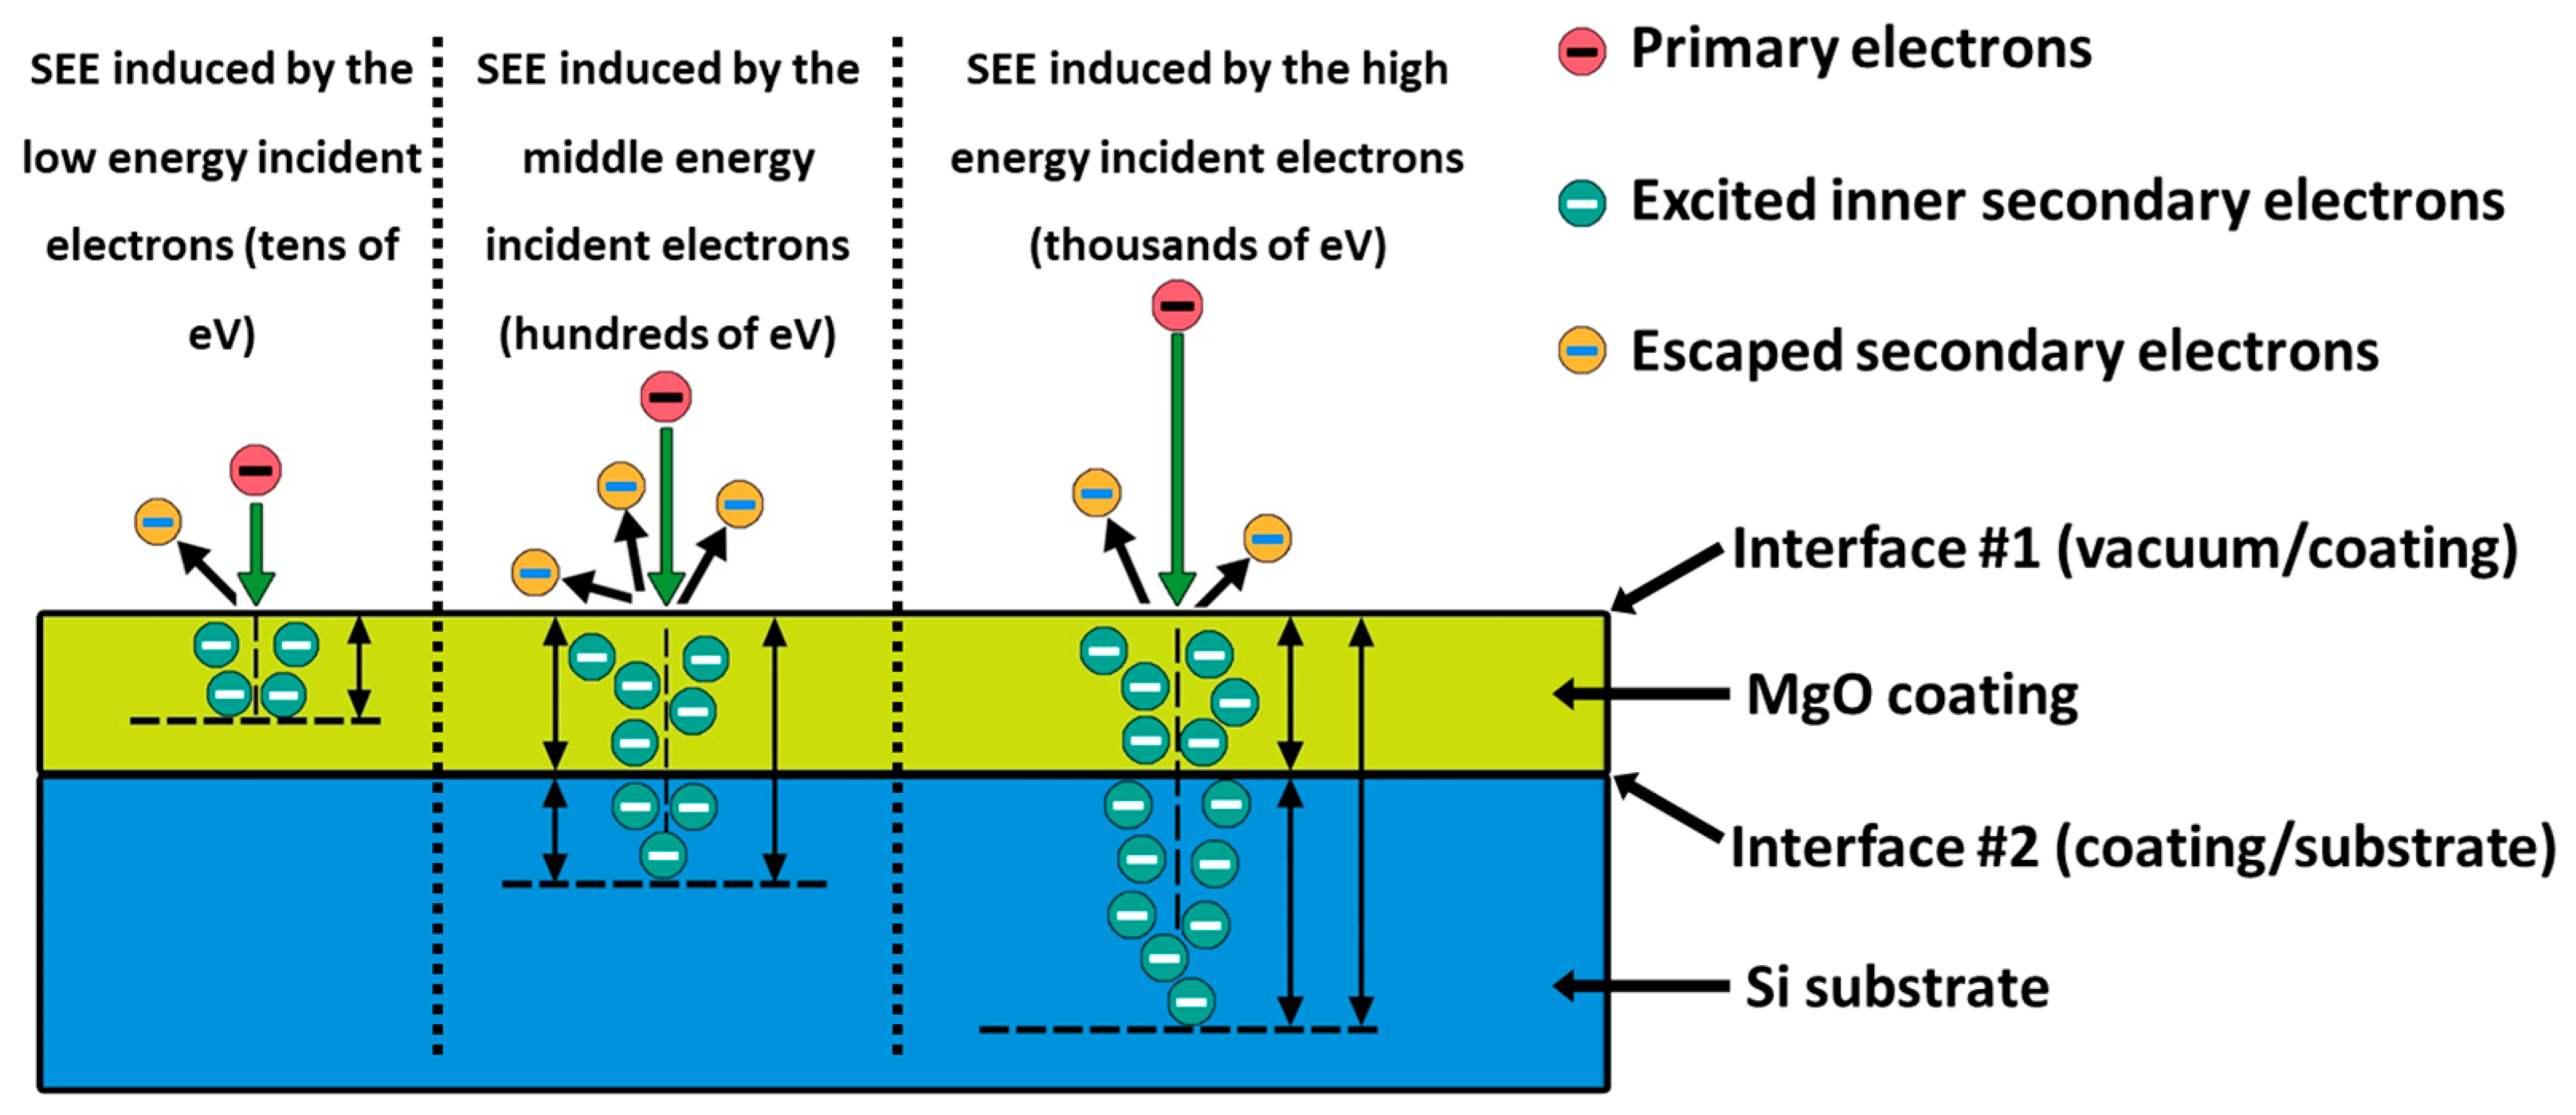
Considering that the MgO coating samples prepared on Si surface by the technique of ALD is very smooth, we can employ an ideal model, as shown in Figure 7, to imitate the MgO/Si double-layer structures. Here, the ideal model refers to the structure with homogeneous density and uniform thickness of coating layer and substrate, as well as the surface being smooth. Figure 7 shows the SEE process in the ideal double-layer structure, including the incident of the primary electrons and the excitation of the inner secondary electrons in the motion path, as well as the escaping process of the inner secondary electrons. For the ideal double-layer structure, the SEE process can be divided into the following two situations. Situation #1, if the energy of the primary electron is too low to penetrate the top coating, only the top layer affects the SEY of the sample, and the bottom substrate has no influence on SEY. Situation #2, if the primary electrons possess enough energy to penetrate through the top layer and enter the bottom substrate, the SEY is determined by the top layer and bottom substrate conjointly. For situation #1, inner secondary electrons are only generated inside the top layer, therefore, they just need to jump over the interface between top layer and vacuum for becoming escaped electrons, namely the interface #1 shown in Figure 7. Therefore, SEY is only dominated by the top layer at this time. For the situation #2, the inner secondary electrons generated inside the substrate need to jump over two interfaces, including interface #1 and #2 shown in Figure 7, as well as travel a long path for becoming escaped electrons. Out of the consideration that a SEY curve contains the electron yield information in different energy ranges, therefore, the situation #1 and #2 ought to be analyzed comprehensively for the primary electrons in various energy ranges. In actuality, the real SEE situation for double-layer structures is much more complicated than that of single-layer pure material. The following paragraphs will discuss the SEE processes of the double-layer structures in detail.
According to the report in literature [30], SEY of an ideal double-layer structure can be expressed by the following piecewise function:
δ t = { C 1 [ 1 exp ( d m 1 / λ 1 ) ] , d m 1 d 1 C 1 [ 1 exp ( d 1 / λ 1 ) ] + C 2 B 1 [ 1 exp ( d 2 / λ 2 ) ] exp ( d 1 / λ 1 ) , d m 1 > d 1
The calculation formula of C1 and C2 is as follows:
C 1 = ( B 1 / E a 1 ) ( A 1 n ) 1 / n λ 1 d m 1 1 / n 1
C 2 = ( B 2 1 / E a 2 ) ( A 2 n ) 1 / n λ 2 d 2 1 / n 1
The parameters in the above Equations (2)–(4) have the following physical meanings: λ1 and λ2 represent the mean free path of the excited inner secondary electrons in the top layer and the bottom layer respectively, and this parameter is negatively correlated with the concentration and mobility of the carrier in the material, which can also be considered to be negatively correlated with the material conductivity. Ea1 and Ea2 refer to the average energy required to excite an inner secondary electron in the top film and the bottom substrate respectively, which is numerically equal to the energy gap of the material. B1 and B2-1 represent the escape probability constant of the excited inner secondary electrons passing through interface #1 and interface #2 in Figure 7 respectively, which is related to the states of the material surface and interface. A1 and A2 are defined as the primary electron absorption constant, which represents the ability of the material to prevent the primary electron movement in its internal, and this parameter is directly positively correlated with the physical density of the material. The parameter n is the power exponent used for SEE semi-empirical model fitting. The value of n given by Young in 1956 was 1.35 [31]. Later, other scholars proposed that the value of n was different due to the shape of SEY curve based on experimental fitting [32]. dm1 and d2 respectively represent the maximum penetration depth of initial electrons in the top layer film and the bottom substrate, which is positively correlated with the energy of initial electrons when they just enter the material, and negatively correlated with the parameter A. The formula of dm1 is as follows:
d m 1 = E p n / A 1 n
The calculation of parameter d2 needs to consider the remaining energy when the primary electron reaches the interface #2. Therefore, according to Equation (5), the calculation formula of d2 can be expressed as follows:
d 2 = ( E p n A 1 n d 1 ) / ( A 2 n )
In addition, according to the energy loss process of the primary electrons, we are able to derive the formula of SEY contributed by the top layer film and the bottom substrate respectively for the primary electrons that can penetrate the film. Here, we utilize δ1 and δ2 to represent the SEY induced by the top layer film and the bottom substrate respectively, δt equals to the sum of δ1 and δ2. The calculation formulas of these two parameters are:
δ 1 = C 1 C 1 exp ( d 1 / λ 1 )
δ 2 = C 2 B 1 [ 1 exp ( d 2 / λ 2 ) ] exp ( d 1 / λ 1 )

3.5. Theoretical Explanation on the SEE Properties of MgO/Si Double-Layer Structures

To make a theoretical analysis of the relationship between SEY and the thickness of the double-layer structures, it is necessary to fit the SEY curves of the top layer and bottom layer respectively. Here, the classic SEE semi-empirical model [33] summarized by Dionne in 1973 is utilized to fit the SEY curves of pure MgO and bare Si. The fitting formula is expressed as:
δ = ( B / E a ) ( A n ) 1 / n λ d m 1 / n 1 [ 1 exp ( x / λ ) ]
The physical meanings of each parameter in Equation (9) are the same as those in Equations (2)–(4). The fitted SEY curves of pure MgO and bare Si by using Equation (9) are shown in Figure 8, and the fitting parameters are shown in Table 2. On the basis of the fitting data in Table 2, SEY of the double-layer structures can be calculated by using Equation (2). Figure 8 shows the fitted SEY curves of MgO/Si double-layer structures by using Equation (2). It can be seen from Figure 8 that the SEY variation regularities of the MgO/Si double-layer structures can be well explained by the SEE semi-empirical theory developed in literature [30].
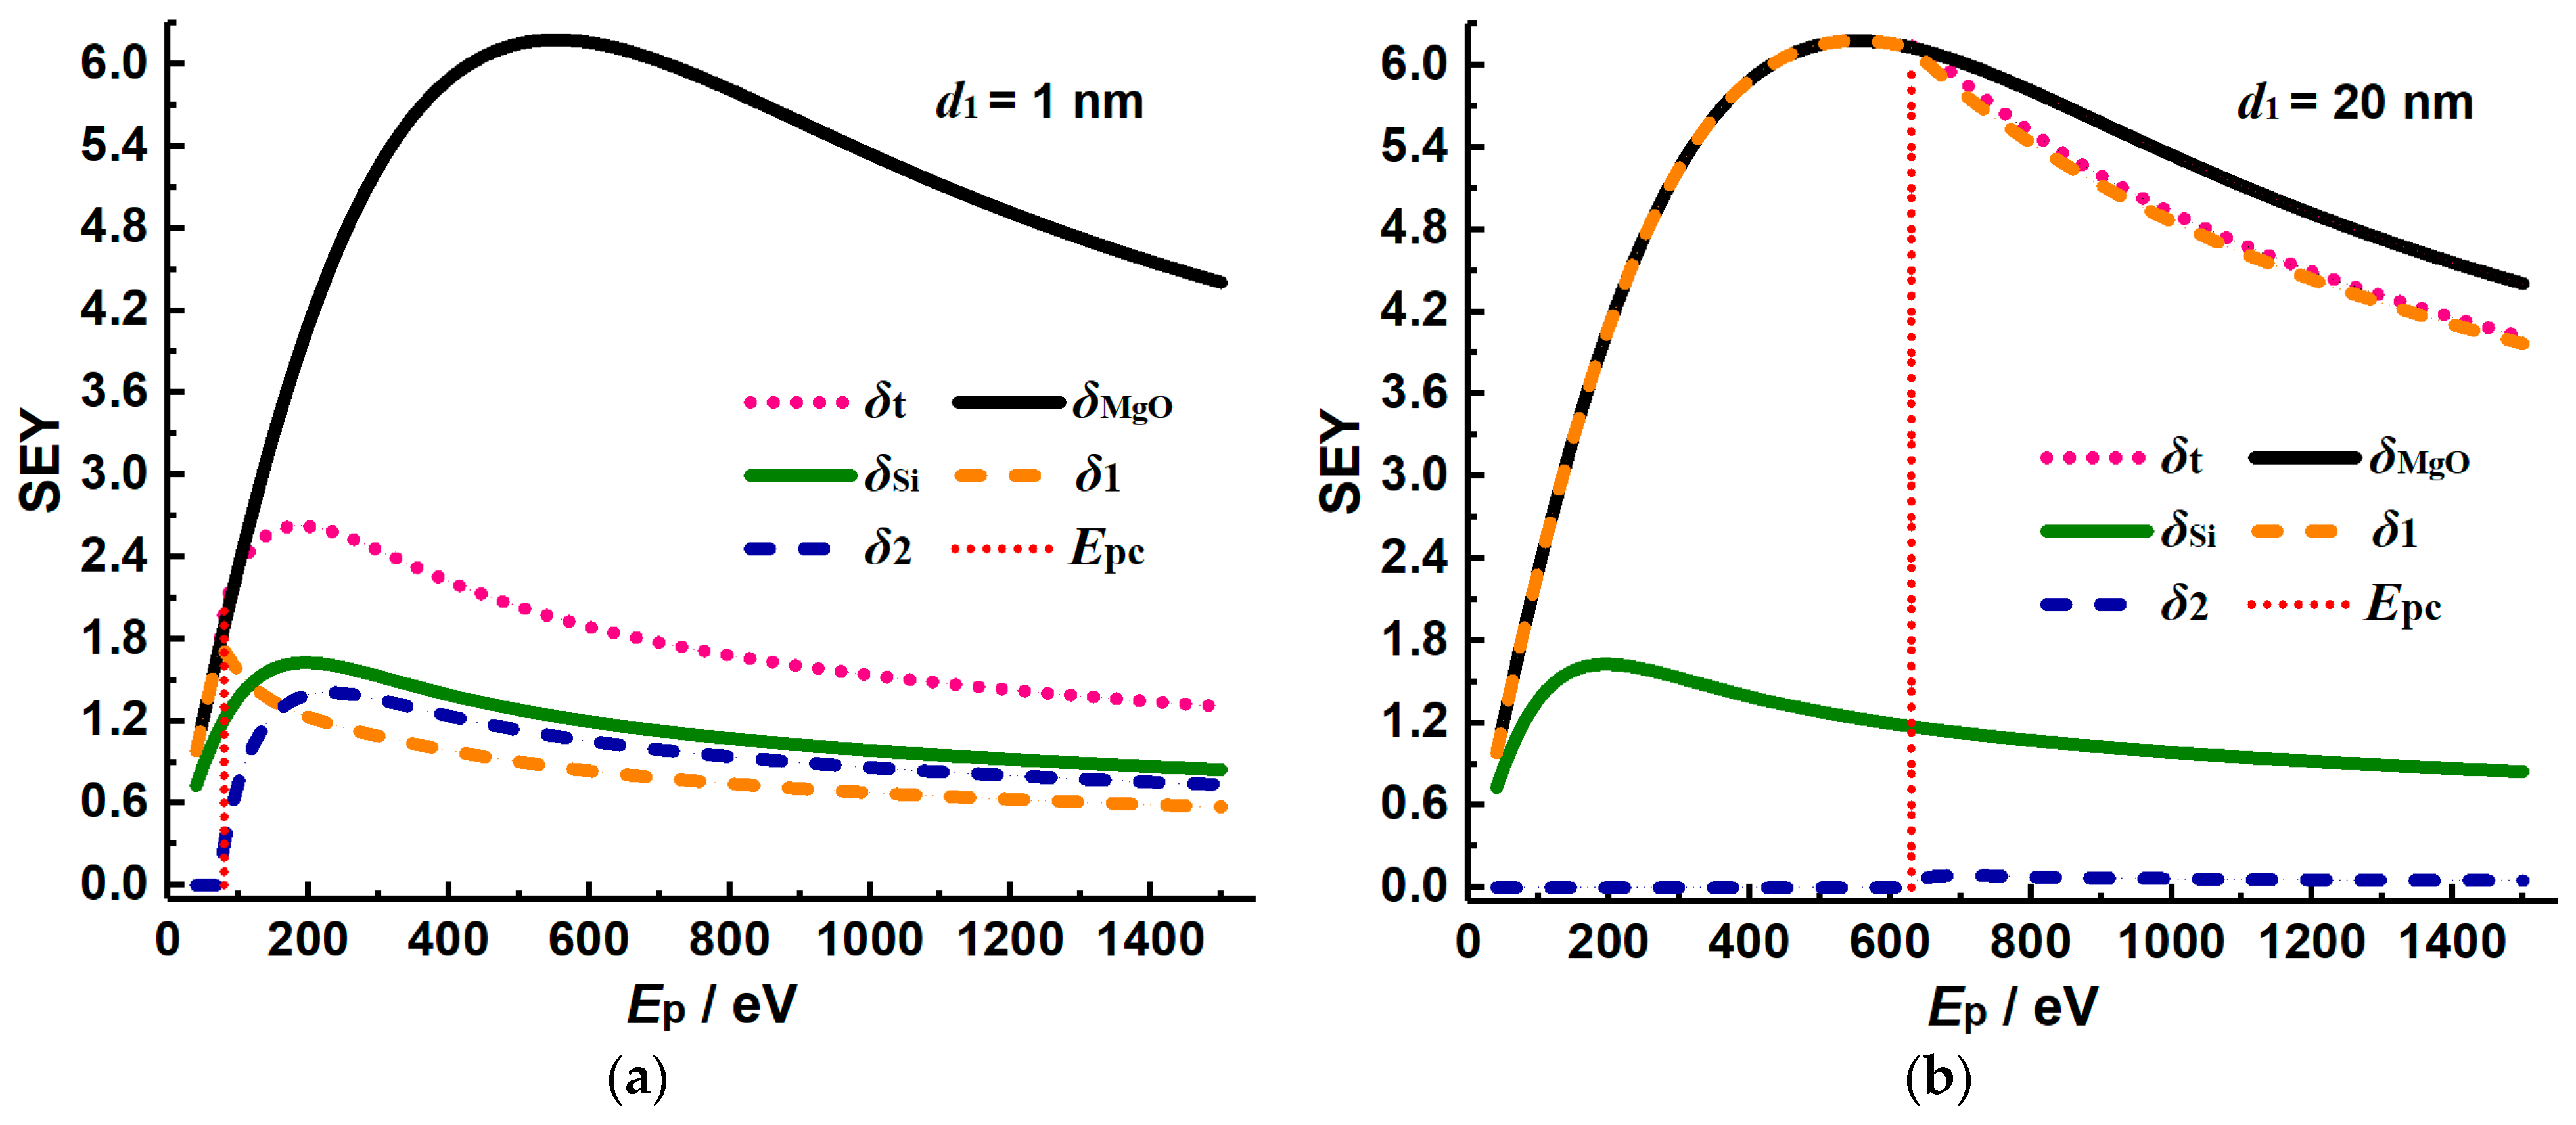
In order to further quantitatively reveal the influence of film thickness on SEE characteristics of double-layer structures, we use Equations (7) and (8) to calculate the SEY contribution of the top layer and the bottom layer respectively, when the thickness of the MgO coating equals to 1 nm and 20 nm, as shown in Figure 9. As can be seen from Figure 9, there is a critical energy point on the Ep-δt curve, denoted as Epc; here, Epc point represents the minimum energy required for the primary electron to just penetrate through the top layer. For the primary electrons whose Ep is less than Epc, their energy will be exhausted in the top layer and they can only excite the inner secondary electrons in the top layer. In this case, δt is only determined by the SEY generated by the top layer, its value equals to δ1. Once Ep rises beyond Epc, δ1 decreases gradually and δ2 begins to increase from 0, indicating that the bottom substrate begins to have an effect on δt at this time.
The SEY decomposition results in Figure 9a show that when the thickness of the film is relatively thin, the influence of substrate on SEY is more obvious, and the proportion of the secondary electrons contributed by the substrate increases gradually with the rise of the primary electron energy Ep. The SEY decomposition results in Figure 9b show that when the top coating is relatively thicker, δt becomes less affected by the substrate due to the little contribution of SEY by the substrate. For example, in Figure 9b, δt equals to 5.90 when Ep is 700 eV, and the SEY contributed by Si substrate is only 0.09 at this time, which accounts for 1.53% of δt, whereas the SEY contributed by the MgO coating is 5.81 under the circumstances, and accounts for 98.47% of δt. The calculation results quantitatively show that when the thickness of the top coating reaches a certain value (usually greater than 10 nm), the contribution of the substrate to the SEY of double-layer structure is very small. In fact, the amount of excited inner secondary electrons inside the substrate is not few when the primary electrons have access to the substrate, but it is difficult for these secondary electrons to emit since it is possible for them to be scattered many times by the free electrons on the motion path and they need to cross two potential barrier interfaces. Based on the above reasons, for the double-layer structures with a relatively thick coating covered, the escaping probability of the excited inner secondary electrons inside the substrate is reduced greatly due to the effect of the interfaces and long motion path, so the SEY contributed by the underlying substrate is greatly reduced.

4. Conclusions

In this study, via the ALD preparation experiments and SEY measurements, we analyzed the SEE characteristics and energy spectra of silicon-based MgO coatings under the condition of increasing coating thickness, and we carried out a detailed theoretical study on the influence of MgO coating thickness on SEY. Four conclusions can be drawn from the experimental and theoretical researches. First, with the thickness rise of the MgO coating samples, coatings’ SEY curves tend to approach the SEY curve of pure MgO; at the same time, the influence of substrate on SEY decreases gradually. Second, the SEES results show that the majority of the emitted electrons are true secondary electrons, and the yield of backscattered electrons just accounts for a little proportion in SEY. Third, the semi-empirical SEE theory developed for double-layer structure is suitable to interpret the SEY regularities of MgO/Si structures with increasing thickness, and the simulation results are well consistent with the experimental phenomena. Fourth, the increase of the top layer’s thickness will make the motion path become longer for the excited inner secondary electrons generated in the substrate, further leading to a result that the SEY contributed by the substrate become fewer. This work deeply studied the SEE characteristics for typical MgO/Si double-layer structures, and theoretically revealed the SEY dependence on thickness of the top coating, as well as the influence of the substrate on SEY. This study makes remarkable sense for the subsequent researches on the applications of nanoscale MgO coatings, and provides considerable guidance for the applications of high SEY materials.

Author Contributions

Conceptualization, X.Z. and J.G.; methodology, X.L., J.G. and W.Z.; software, D.W.; validation, X.Z., X.L. and R.Z.; formal analysis, R.Z.; investigation, J.G.; resources, R.Z.; data curation, X.Z.; writing—original draft preparation, X.Z. and J.G.; writing—review and editing, X.Z. and X.L.; visualization, D.W. All authors have read and agreed to the published version of the manuscript.

Funding

This research was funded by the National Key Research and Development Program of China (grant number 2016YFB030380), and the Scientific Instrument Developing Project of the Chinese Academy of Sciences.

Institutional Review Board Statement

Not applicable.

Informed Consent Statement

Not applicable.

Data Availability Statement

All data included in this study are available upon request by contact with the corresponding author.

Conflicts of Interest

The authors declare no conflict of interest.

References

  1. Seiler, H. Secondary-Electron Emission in the Scanning Electron-Microscope. J. Appl. Phys. 1983, 54, R1–R18. [Google Scholar] [CrossRef]
  2. Sauli, F. The gas electron multiplier (GEM): Operating principles and applications. Nucl. Instrum. Meth. A 2016, 805, 2–24. [Google Scholar] [CrossRef]
  3. Xia, L.S.; Yang, A.M.; Chen, Y.; Zhang, H.; Liu, X.G.; Li, J.; Jiang, X.G.; Zhang, K.Z.; Shi, J.S.; Deng, J.J. Multi-pulsed intense electron beam emission from velvet, carbon fibers, carbon nano-tubes and dispenser cathodes. Chin. Phys. C 2010, 34, 1733–1737. [Google Scholar] [CrossRef]
  4. Johnson, C.B.; Catchpole, C.E.; Matle, C.C. Microchannel Plate Inverter Image Intensifiers. IEEE Trans. Electron. Dev. 1971, 18, 1113–1116. [Google Scholar] [CrossRef]
  5. Leskovar, B. Microchannel Plates. Phys. Today 1977, 30, 42–49. [Google Scholar] [CrossRef] [Green Version]
  6. Wiza, J.L. Microchannel Plate Detectors. Nucl. Instrum. Meth. 1979, 162, 587–601. [Google Scholar] [CrossRef]
  7. Vaughan, J.R.M. Multipactor. IEEE Trans. Electron. Dev. 1988, 35, 1172–1180. [Google Scholar] [CrossRef]
  8. Fil, N.; Belhaj, M.; Hillairet, J.; Puech, J. Multipactor threshold sensitivity to total electron emission yield in small gap waveguide structure and TEEY models accuracy. Phys. Plasmas 2016, 23, 123118. [Google Scholar] [CrossRef]
  9. Guo, Z.Y.; Liu, Y.D.; Qin, Q.; Wang, J.Q.; Xing, J. Studies on Electron Cloud Instability in the BEPC. High. Energy Phys. Nucl. Phys. 2006, 30, 102–104. [Google Scholar] [CrossRef]
  10. Cimino, R.; Demma, T. Electron cloud in accelerators. Int. J. Mod. Phys. A 2014, 29, 1430023. [Google Scholar] [CrossRef]
  11. Ye, M.; He, Y.N.; Wang, R.; Hu, T.C.; Zhang, N.; Yang, J.; Cui, W.Z.; Zhang, Z.B. Suppression of secondary electron emission by micro-trapping structure surface. Acta Phys. Sin. 2014, 63, 147901. [Google Scholar] [CrossRef]
  12. Wang, D.; Ye, M.; Feng, P.; He, Y.N.; Cui, W.Z. An effective reduction on secondary electron emission yield of gold coated surfaces by laser etching. Acta Phys. Sin. 2019, 68, 067901. [Google Scholar] [CrossRef]
  13. Guo, J.J.; Wang, D.; Xu, Y.T.; Zhu, X.P.; Wen, K.L.; Miao, G.H.; Cao, W.W.; Si, J.H.; Lu, M.; Guo, H.T. Secondary electron emission characteristics of Al2O3 coatings prepared by atomic layer deposition. AIP Adv. 2019, 9, 095303. [Google Scholar] [CrossRef]
  14. Zhu, X.P.; Guo, J.J.; Cao, W.W.; Liu, L.T.; Si, J.H. Theoretical and experimental investigation of secondary electron emission characteristics of ALD-ZnO conductive films. J. Appl. Phys. 2020, 128, 065102. [Google Scholar] [CrossRef]
  15. Wang, D.; He, Y.N.; Cui, W.Z. Secondary electron emission characteristics of TiN coatings produced by RF magnetron sputtering. J. Appl. Phys. 2018, 124, 053301. [Google Scholar] [CrossRef]
  16. Cartiglia, N.; Arcidiacono, R.; Baselga, M.; Bellan, R.; Boscardin, M.; Cenna, F.; Dalla Betta, G.F.; Fernndez-Martnez, P.; Ferrero, M.; Flores, D.; et al. Design optimization of ultra-fast silicon detectors. Nucl. Instrum. Meth. A 2015, 796, 141–148. [Google Scholar] [CrossRef]
  17. Fernandez-Martinez, P.; Pellegrini, G.; Balbuena, J.P.; Quirion, D.; Hidalgo, S.; Flores, D.; Lozano, M.; Casse, G. Simulation of new p-type strip detectors with trench to enhance the charge multiplication effect in the n-type electrode. Nucl. Instrum. Meth. A 2011, 658, 98–102. [Google Scholar] [CrossRef]
  18. Mankel, R. Pattern recognition and event reconstruction in particle physics experiments. Rep. Prog. Phys. 2004, 67, 553. [Google Scholar] [CrossRef]
  19. van der Graaf, H.; Akhtar, H.; Budko, N.; Chan, H.W.; Hagen, C.W.; Hansson, C.C.; Nützel, G.; Pinto, S.D.; Prodanović, V.; Raftari, B.; et al. The Tynode: A new vacuum electron multiplier. Nucl. Instrum. Meth. A 2017, 847, 148–161. [Google Scholar] [CrossRef] [Green Version]
  20. Tao, S.X.; Chan, H.W.; van der Graaf, H. Secondary Electron Emission Materials for Transmission Dynodes in Novel Photomultipliers: A Review. Materials 2016, 9, 1017. [Google Scholar] [CrossRef]
  21. Bolton, J.H.; Williams, S.E. Use of a Photomultiplier to Measure Intensities in the Vacuum Ultra-Violet Region. Nature 1952, 169, 325–326. [Google Scholar] [CrossRef]
  22. Henrich, V.E.; Fan, J.C.C. High-efficiency secondary-electron emission from sputtered MgO-Au cermets. Appl. Phys. Lett. 1973, 23, 7–8. [Google Scholar] [CrossRef]
  23. Choi, E.H.; Lim, J.Y.; Kim, Y.G.; Ko, J.J.; Kim, D.I.; Lee, C.W.; Cho, G.S. Secondary electron emission coefficient of a MgO single crystal. J. Appl. Phys. 1999, 86, 6525–6527. [Google Scholar] [CrossRef]
  24. Prodanovic, V.; Chan, H.W.; Mane, A.U.; Elam, J.W.; Minjauw, M.M.; Detavernier, C.; Harry, V.D.G.; Sarro, P.M. Effect of thermal annealing and chemical treatments on secondary electron emission properties of atomic layer deposited MgO. J. Vac. Sci. Technol. A 2018, 36, 06A102. [Google Scholar] [CrossRef] [Green Version]
  25. Lee, J.; Jeong, T.; Yu, S.G.; Jin, S.; Heo, J.; Yi, W.; Jeon, D.; Kim, J.M. Thickness effect on secondary electron emission of MgO layers. Appl. Surf. Sci. 2001, 174, 62–69. [Google Scholar] [CrossRef]
  26. Li, J.; Hu, W.; Hao, L.; Gao, B.; Li, Y. Secondary electron emission enhancement of MgO/Au composite film by adopting a gold buffer layer. Mater. Res. Bull. 2019, 118, 110493. [Google Scholar] [CrossRef]
  27. Manalio, A.A.; Burin, K.; Rothberg, G.M. More efficient channel electron multiplier by coating of the cone with a high secondary electron yield material. Rev. Sci. Instrum. 1981, 52, 1490–1492. [Google Scholar] [CrossRef]
  28. Vink, T.J.; Balkenende, A.R.; Verbeek, R.G.F.A.; van Hal, H.A.M.; de Zwart, S.T. Materials with a high secondary-electron yield for use in plasma displays. Appl. Phys. Lett. 2002, 80, 2216–2218. [Google Scholar] [CrossRef]
  29. Ohtsu, Y.; Fujita, H. Production of high-density capacitively coupled radio-frequency discharge plasma by high-secondary-electron-emission oxide. Appl. Phys. Lett. 2004, 85, 4875–4877. [Google Scholar] [CrossRef]
  30. Wang, D.; He, Y.N.; Guo, J.J.; Cai, Y.H.; Mao, Z.S.; Ye, M. Investigation on secondary electron emission characteristics of double-layer structures. J. Appl. Phys. 2021, 129, 093304. [Google Scholar] [CrossRef]
  31. Young, J.R. Penetration of electrons and ions in aluminum. J. Appl. Phys. 1956, 27, 1–4. [Google Scholar] [CrossRef]
  32. Lane, R.O.; Zaffarano, D.J. Transmission of 0–40 keV electrons by thin films with application to beta-ray spectroscopy. Phys. Rev. 1954, 94, 960–964. [Google Scholar] [CrossRef]
  33. Dionne, G.F. Effects of secondary electron scattering on secondary emission yield curves. J. Appl. Phys. 1973, 44, 5361–5364. [Google Scholar] [CrossRef]
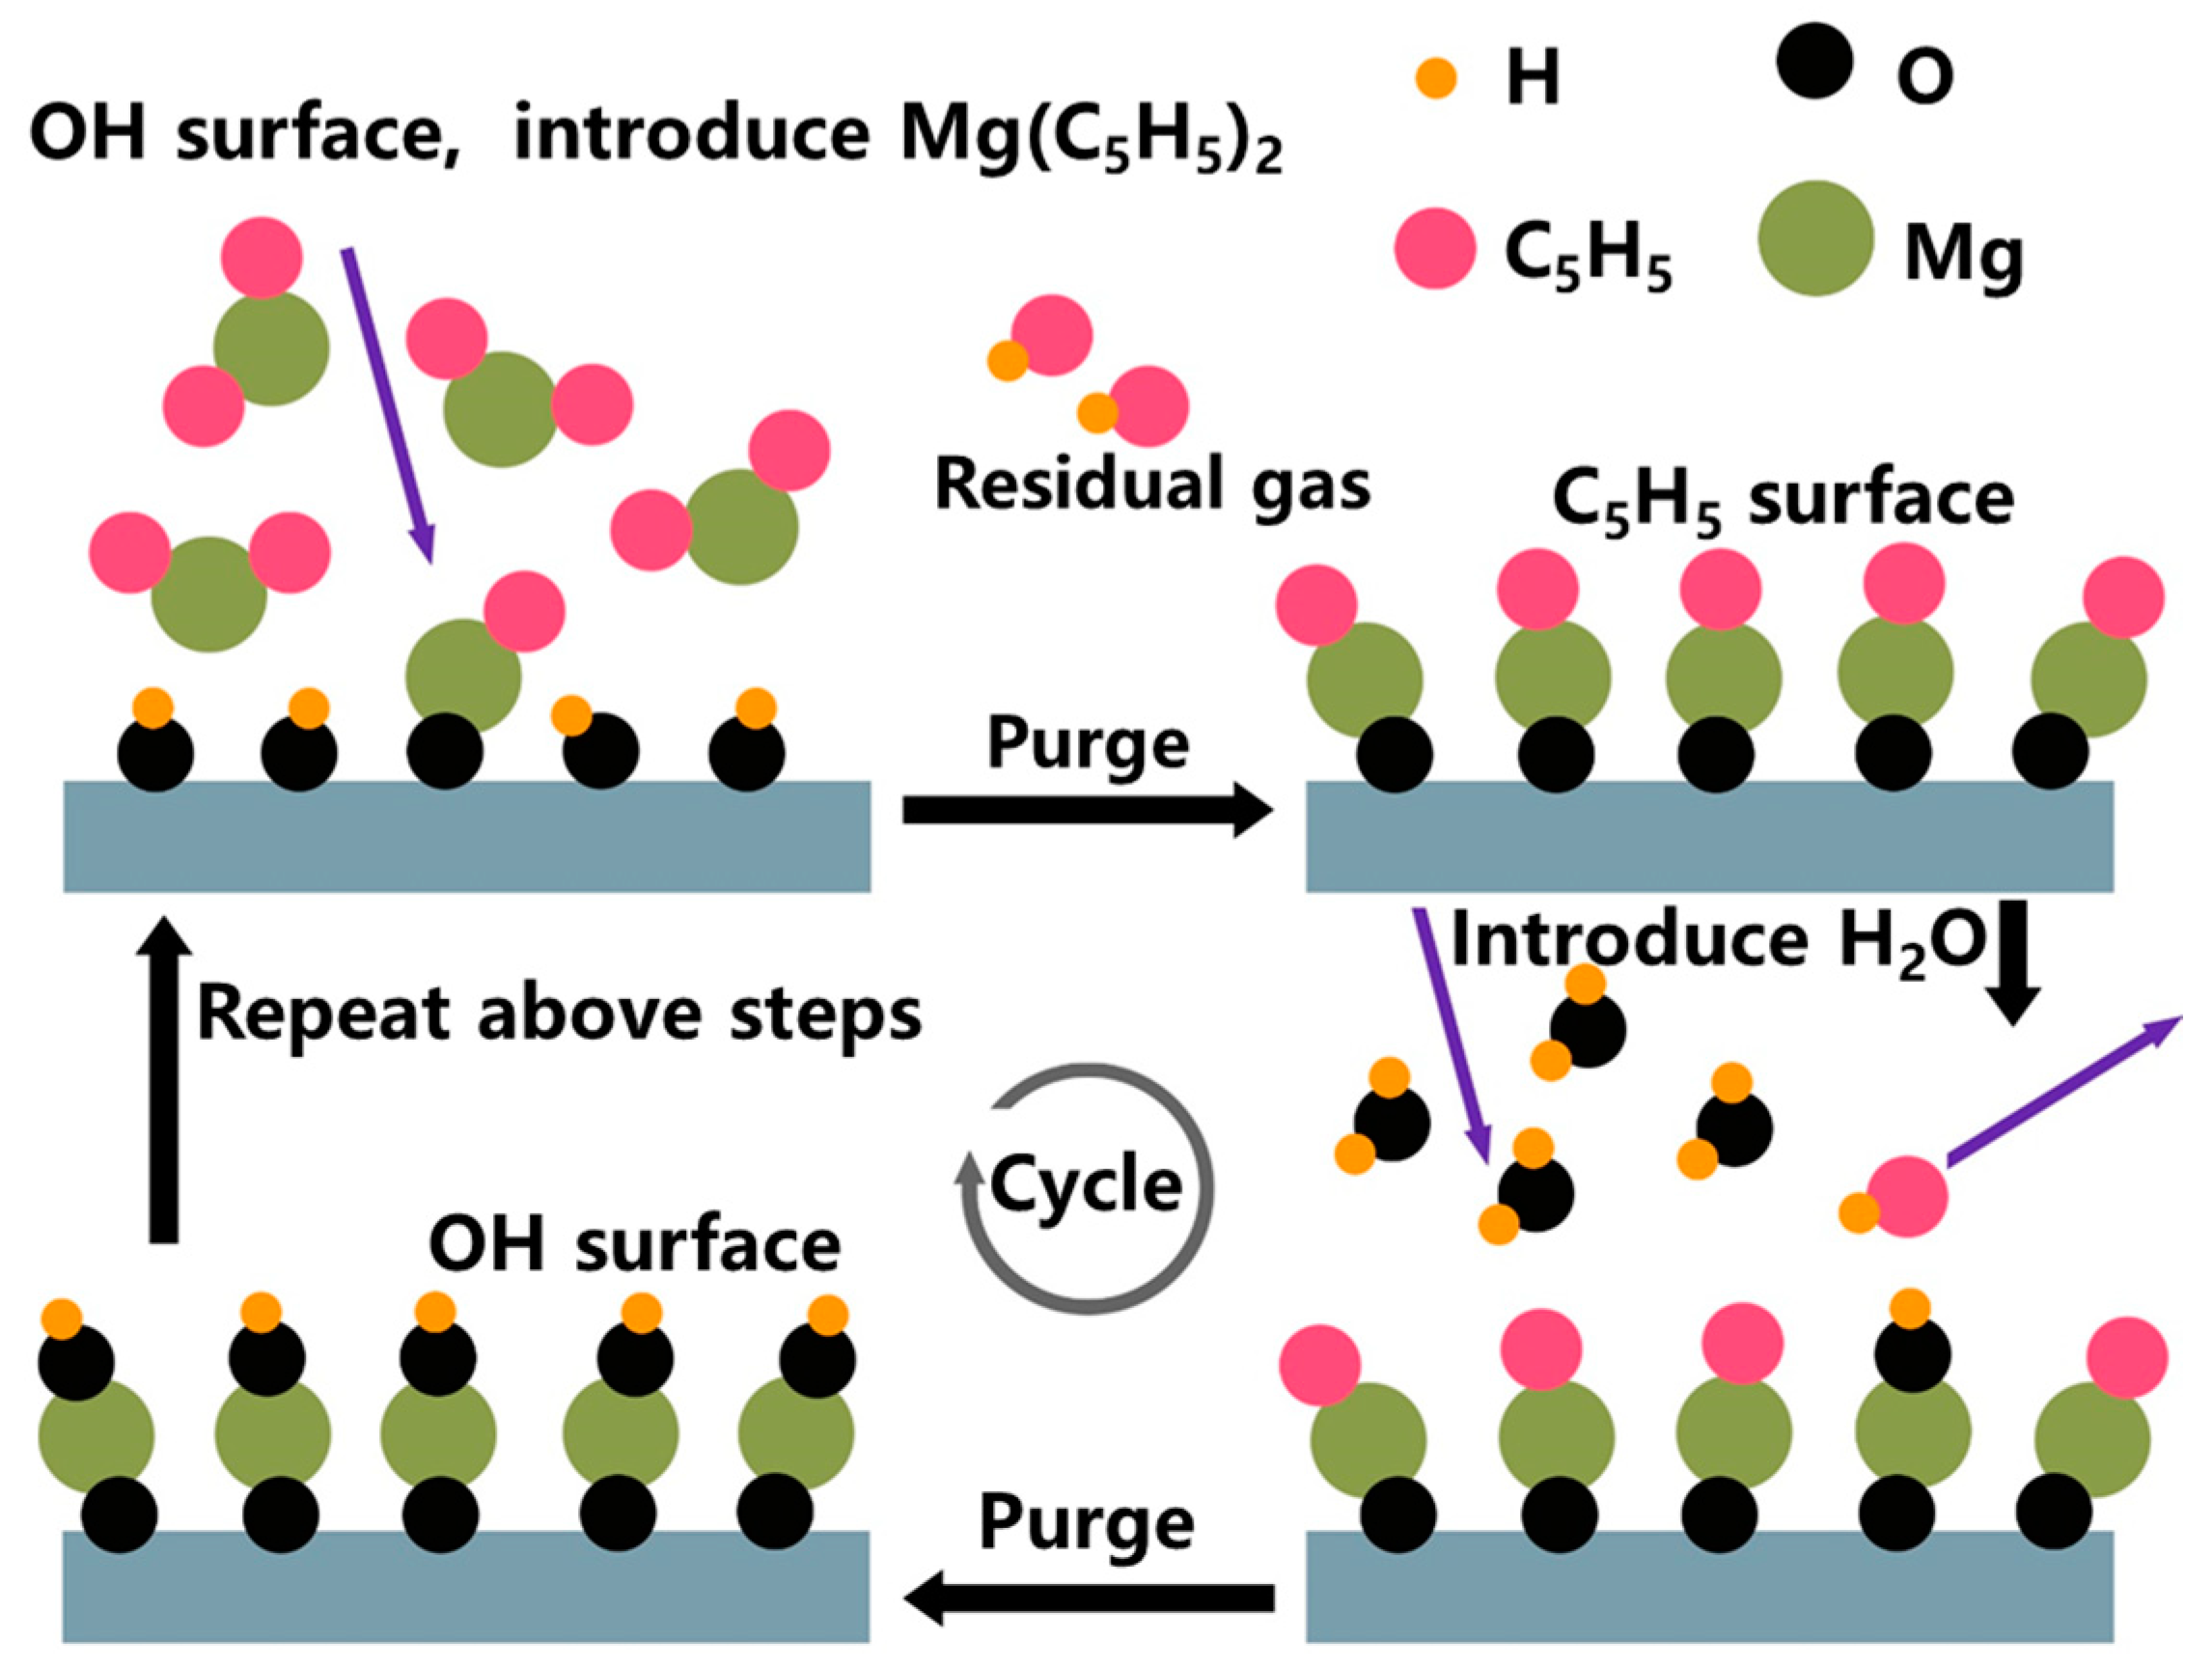
Figure 1. Sketch map of ALD processes for MgO coating preparation.
Applsci 11 04801 g001
Figure 2. Inner structure of the SEY measurement facility.
Applsci 11 04801 g002
Figure 3. (a) Section image of 30 nm MgO coating observed by SEM; (b,c) the surface roughness images of 20 nm and 30 nm MgO coatings characterized by AFM.
Applsci 11 04801 g003
Figure 4. Measured SEY of MgO/Si double-layer samples.
Applsci 11 04801 g004
Figure 5. The influence of coating thickness on SEY peak value δm.
Applsci 11 04801 g005
Figure 6. Secondary electron energy spectrum of MgO/Si double-layer structures.
Applsci 11 04801 g006
Figure 7. Sketch map of SEE physical processes for an ideal double-layer structure.
Applsci 11 04801 g007
Figure 8. Fitted (lines) and measured (symbols) SEY curves of MgO/Si double-layer samples.
Applsci 11 04801 g008
Figure 9. Calculated SEY of MgO/Si double-layer samples for (a) d1 = 1 nm and (b) d1 = 20 nm.
Applsci 11 04801 g009
Table 1. Typical SEY parameters of MgO/Si double-layer samples.
ParameterMgOSi1 nm3 nm7 nm12 nm20 nm30 nm
δm6.151.612.634.275.145.725.936.11
Epm/eV600200250350500550550600
Table 2. Fitting parameters of SEY curves for MgO/Si double-layer samples.
MaterialABλ/nmEa/eV
Si24000.0230.21.12
MgO35000.2251.39.00
Publisher’s Note: MDPI stays neutral with regard to jurisdictional claims in published maps and institutional affiliations.