Article

Experimental Characterization of Flame Structure and Soot Volume Fraction of Premixed Kerosene Jet A-1 and Surrogate Flames

by
Thomas von Langenthal
,
Matthias Martin Sentko
,
Sebastian Schulz
,
Björn Stelzner
*,†,
Dimosthenis Trimis
and
Nikolaos Zarzalis
Engler-Bunte-Institute, Division of Combustion Technology, Karlsruhe Institute of Technology, 76131 Karlsruhe, Germany
*
Author to whom correspondence should be addressed.
These authors contributed equally to this work.
Appl. Sci. 2021, 11(11), 4796; https://doi.org/10.3390/app11114796
Submission received: 2 May 2021 / Revised: 13 May 2021 / Accepted: 17 May 2021 / Published: 24 May 2021

Abstract

:
Modeling the chemical reactions and soot processes in kerosene flames is important to support the design of future generations of low-emission aircraft engines. To develop and validate these models, detailed experimental data from model flames with well-defined boundary conditions are needed. Currently, only few data from experiments with real aircraft engine fuels are available. This paper presents measurements of temperature, species and soot volume fraction profiles in premixed, flat flames using Jet A-1 kerosene and a two-component surrogate blend. Measurements were performed using a combination of TDLAS, GC and laser extinction. The results show that the flame structure in terms of temperature and species profiles of the kerosene and surrogate flames are very similar but differ greatly in the resulting soot volume fractions. Furthermore, the study shows that the available chemical mechanisms can correctly predict the temperature profiles of the flames but show significant differences from the experimentally observed species profiles. The differences in the sooting tendency of the kerosene and the surrogate are further investigated using detailed chemical mechanisms.

1. Introduction

Soot particles from combustion processes can have a severe impact on human health [1,2] and contribute to global warming [3]. The soot emissions from aircraft engines are affected by a wide variety of parameters, including liquid fuel atomization, turbulent mixing, residence times, and many others. To understand the sooting behavior of jet fuels and develop models that can accurately predict soot emissions, soot characteristics are often studied in model flames created under well-defined boundary conditions. Although there are many studies in the literature on the sooting behavior of gaseous fuels in model flames (e.g., for premixed flames [4,5,6]), similar data for liquid fuels are sparse. For kerosene, there are some data of Jet A-1 and its distillation fractions doped into a premixed ethylene flame [7] and for laminar diffusion flames burning Jet A-1 and synthetic kerosene [8,9]. In addition to the soot models, the correct calculation of species and temperatures profiles of such flames is of great importance and the chemical mechanism used to calculate the combustion processes can have a large impact on the results of soot modeling attempts [10].
The scope of this study is to contribute to the available data on flame structure and soot volume fraction in premixed kerosene flames. The flame structure was assessed by determining the main species concentrations and temperature along the axis of a premixed flat flame burning either kerosene Jet A-1 or a n-decane/1,2,4 trimethylbenzene surrogate mixture. Experiments were conducted using a combination of tunable diode laser absorption spectroscopy (TDLAS) and gas chromatography (GC). The soot volume fraction was measured using laser extinction. The combination of these techniques resulted in a comprehensive dataset that can be used in the future to develop detailed reaction mechanisms for kerosene flames including soot precursors and soot formation. The experimental results were compared to numerical simulations using different detailed reaction mechanisms. Finally, the influence of different surrogate blends on the formation of soot precursors was numerically investigated.

2. Experimental Setup

2.1. Premixed Kerosene Flat Flame

A flat flame burner (McKenna burner) was used to produce laminar one-dimensional flames. This burner stabilizes a flame over a tempered porous plate. The plate of the burner is made of sintered bronze particles and has a diameter of 60 mm. Integrated into the plate is a copper tube coil through which thermal oil was passed to temper the plate to a predetermined temperature. Around the burner plate, there is another annular sintering plate through which inert gas (always nitrogen in this work) flows to shield the flame from the ambient air, thus avoiding reactions and hence changes in the soot and temperature field at the edge of the flame. Flames stabilized on this burner are quasi-one-dimensional near the burner plate, so that quantities such as temperature and soot volume fraction depend only on the distance from the burner plate.
In a first step, the liquid fuel (kerosene or surrogate) was vaporized in a carrier gas vaporizer (Bronkhorst CEM). This was necessary because the vaporization temperature of kerosene is up to 300 °C, but thermal decomposition can occur at lower temperatures. For example, initial reactions with the atmospheric oxygen dissolved in the fuel can start at 150 °C [11]. Furthermore, the auto-ignition temperature of kerosene is 220 °C and this temperature should not be exceeded in this premixed system. Mixing with a carrier gas lowered the partial pressure of the kerosene and thus the temperature required for complete evaporation, so that the vaporizer could be operated at 150 °C.
Kerosene was filled in a piston accumulator and the piston was pressurized to about 5 bar using nitrogen. The kerosene was fed through a coriolis mass flow meter (Bronkhorst High-Tec) into the evaporator, where it was mixed with argon and evaporated. From there, the mixture was transported to the burner via heated lines. Near the burner, oxygen was mixed into the stream. Thermal oil with a temperature of 150 °C was pumped through the burner plate. In addition, the burner as well as the supply line of the oil was heated with electric heating cords and the entire structure was insulated in order to minimize heat losses and to ensure a homogeneous temperature distribution across the burner. To monitor the boundary conditions, the temperature of the thermal oil was measured immediately before it entered the burner. The temperature of the incoming kerosene mixture was measured by a thermocouple positioned in the plenum of the burner.
Four different flames were investigated for each fuel. For the first three cases, the cold gas exit velocity (v) was kept constant at v = 6 cm/s and the equivalence ratio ( Φ ) was varied between 2.1 and 2.3. For the fourth case, the equivalence ratio was set to Φ = 2.1 and the cold gas outlet velocity was reduced to v = 5 cm/s. In all cases, the volumetric oxygen to argon ratio was set at 21/79. An overview of all investigated operating points can be found in Table 1. All operating points were investigated using TDLAS and laser extinction but only the last point was investigated in greater detail using the GC system.
The fuel in this study was either a typical jet fuel kerosene (Jet A-1) or a surrogate mixture. Important properties of the kerosene fuel were measured by an external lab and are reported in Table 2. The surrogate mixture comprised of 80 m% n-decane and 20 m% 1,2,4 trimethylbenzene. This surrogate mixture has already been studied by several groups (e.g., [12,13,14,15]).
The symmetry of the flames stabilized with the McKenna burner was determined by recording the scattered light from a 5 W Nd:YVO 4 laser (Coherent Verdi) with a CMOS camera similar to the method described by Migliorini et al. [16]. The results show that all flames presented in this work have a one-dimensional soot distribution up to about 16 mm above the burner plane. In this region, no constriction of the flame was observed, which means that the absorption length was constant 60 mm for all measured HABs. The results demonstrate the flatness of the flame and negligible edge effects near the co-flow.

2.2. TDLAS

Tunable diode laser absorption spectroscopy (TDLAS) is a calibration-free, in-situ and integral measurement technique based on linear absorbance neglecting scattering and described by the Beer-Lambert law. A detailed overview of TDLAS in combustion technology, its fundamentals, different forms (e.g., direct absorption (DA) and wavelength modulation spectroscopy (WMS)) and fields of application, was given by, Goldenstein et al. [17] and Bolshov et al. [18].
In this study, TDLAS in the form of direct absorption was used to determine temperature profiles and the concentration profiles of H 2 O and C 2 H 2 . For temperature and H 2 O concentration, a multiline thermometry approach was used, based on a Boltzmann plot analysis and using the information from five different absorption lines. Two DFB diode lasers (NanoPlus GmbH) with central wavelengths λ c w = 1344.5 nm and λ c w = 1392.3 nm were used for this purpose. The experimental setup, selection of suitable absorption lines, characterization of the diode laser, data analysis and determination of experimental uncertainties for the determination of temperature and water concentration are described in detail in [19].
Wagner et al. [20,21] presented the first TDLAS setup for C 2 H 2 in the near-infrared band around λ c w = 1535 nm using the P17 absorption line of acetylene in flames. It has been shown that this absorption line is suitable for measurements in combustion processes. To determine C 2 H 2 concentration profiles, a third diode laser with central wavelength λ c w = 1535.4 nm was integrated into the optical setup. A butterfly Mounted Distributed Feedback (DFB)-type diode laser (NEL Laser Diodes) with integrated Peltier cooling and a maximum output power of 20 mW was used. As with the two diode lasers used for temperature and H 2 O concentration, the tuning behavior (current and temperature) of the C 2 H 2 diode was studied in a preliminary investigation similar to that of Teichert et al. [22]. A spectrum analyzer (771 Laser Spectrum Analyzer, Bristol Instruments) was used to determine the diode specific maximum wavenumber range and temperature tuning coefficients δ ν ˜ / δ T for a temperature tuning response. The wavelength tuning behavior due to current tuning was determined using a Fabry–Pérot interferometer (SA200-12B, Thorlabs) with a free spectral range of 1.5 GHz. The optical components selected for the temperature and water concentration measurements (fiber optics, collimator and detector) have an operating wavelength range of 1050–1620 nm. For this reason, no additional components had to be installed for the use of the third diode laser. The beam parameters of all three lasers were determined experimentally and are shown in Table 3.
The measured absorption spectrum is a combination of water, which is formed as a combustion product and parasitic water (humidity of the ambient air). Both were considered for the determination of temperature and water concentration. as described in detail in [19]. For the calculation of the experimental uncertainties of temperature and H 2 O concentration, the uncertainties of the used databases (HITRAN [23] and HITEMP [24]) and the fitting and analyzing procedure of the experimentally measured absorption peaks were considered. This results in uncertainties in the TDLAS measurements of about 120 K for temperature, 15% for H 2 O concentration and 10% for C 2 H 2 concentration. The existing analysis script was extended for the evaluation of acetylene concentration. For this, as described by Wagner et al. [20], an effective optical disturbance correction algorithm for the treatment of the transmission and background emission fluctuations was considered. A multiline Levenberg–Marquardt fitting algorithm was included using the temperature and water concentration as input parameters.

2.3. GC

A modified Agilent GC (7890B)/MS (5977B), similar to the one described by Sentko et al. [25], was used in this study. A thermal conductivity detector (TCD) and two flame ionization detectors (FID) were used for quantifying the stable gases (CO, CO 2 , O 2 , H 2 and H 2 O) and hydrocarbons (HC), respectively. Six different columns (Agilent) were integrated into the GC. Two PlotQs with lengths of 1.5 and 3 m and a MS5A (1.5 m) were used for the TCD. For the FIDs, the gas was split after a 30 m HP5 column using a Dean’s switch. One detector was used to analyze short HC (≤C 5 ). Here, an additional 30 m PlotU was used. For analyzing longer HC (>C 5 ), an additional HP5 (30 m) was used at the second FID.
A quartz probe with an orifice diameter of d O = 1 mm was used for sampling. A total of 15 storage loops enabled sampling at different heights above the burner (HAB) of a flame. The probe as well as the sampling system and analyzing routines are described in more detail in [25].
Statistical (each measurement was repeated three times) and systematic uncertainties (calibration and gas standards) were considered to determine the overall uncertainty of the GC measurements. Depending on the sampling position, this resulted in an uncertainty of about 5% for the main species and 20–50% for the higher hydrocarbons.

2.4. Laser Extinction

Soot volume fraction was measured at several HAB with laser extinction [26]. A 633 nm helium-neon gas laser (JDS Uniphase) was used for the experiments. The laser beam was split using a beam splitter. One beam was directed into a reference detector. The other was directed through the flame into the main detector (both Thorlabs PDA100A). The signal from the reference detector was used to monitor and, if necessary, correct the temporal power variations of the laser. Mirrors and apertures were used to minimize background radiation from the flame incident on the detectors. The signals from the detectors were digitized and stored using a 16-bit data acquisition system (Nation Instruments NI USB-6361).
Prior to the actual measurements, a reference measurement without flame had to be performed to determine the original light intensity without absorption ( I 0 ). In addition, the background signal caused by the flame was determined. For the measurements, at least 30 s of data were recorded for each measurement point and then averaged. Soot volume fractions were calculated assuming a refractive index of 1.75 + 0.58i [27].

3. Results

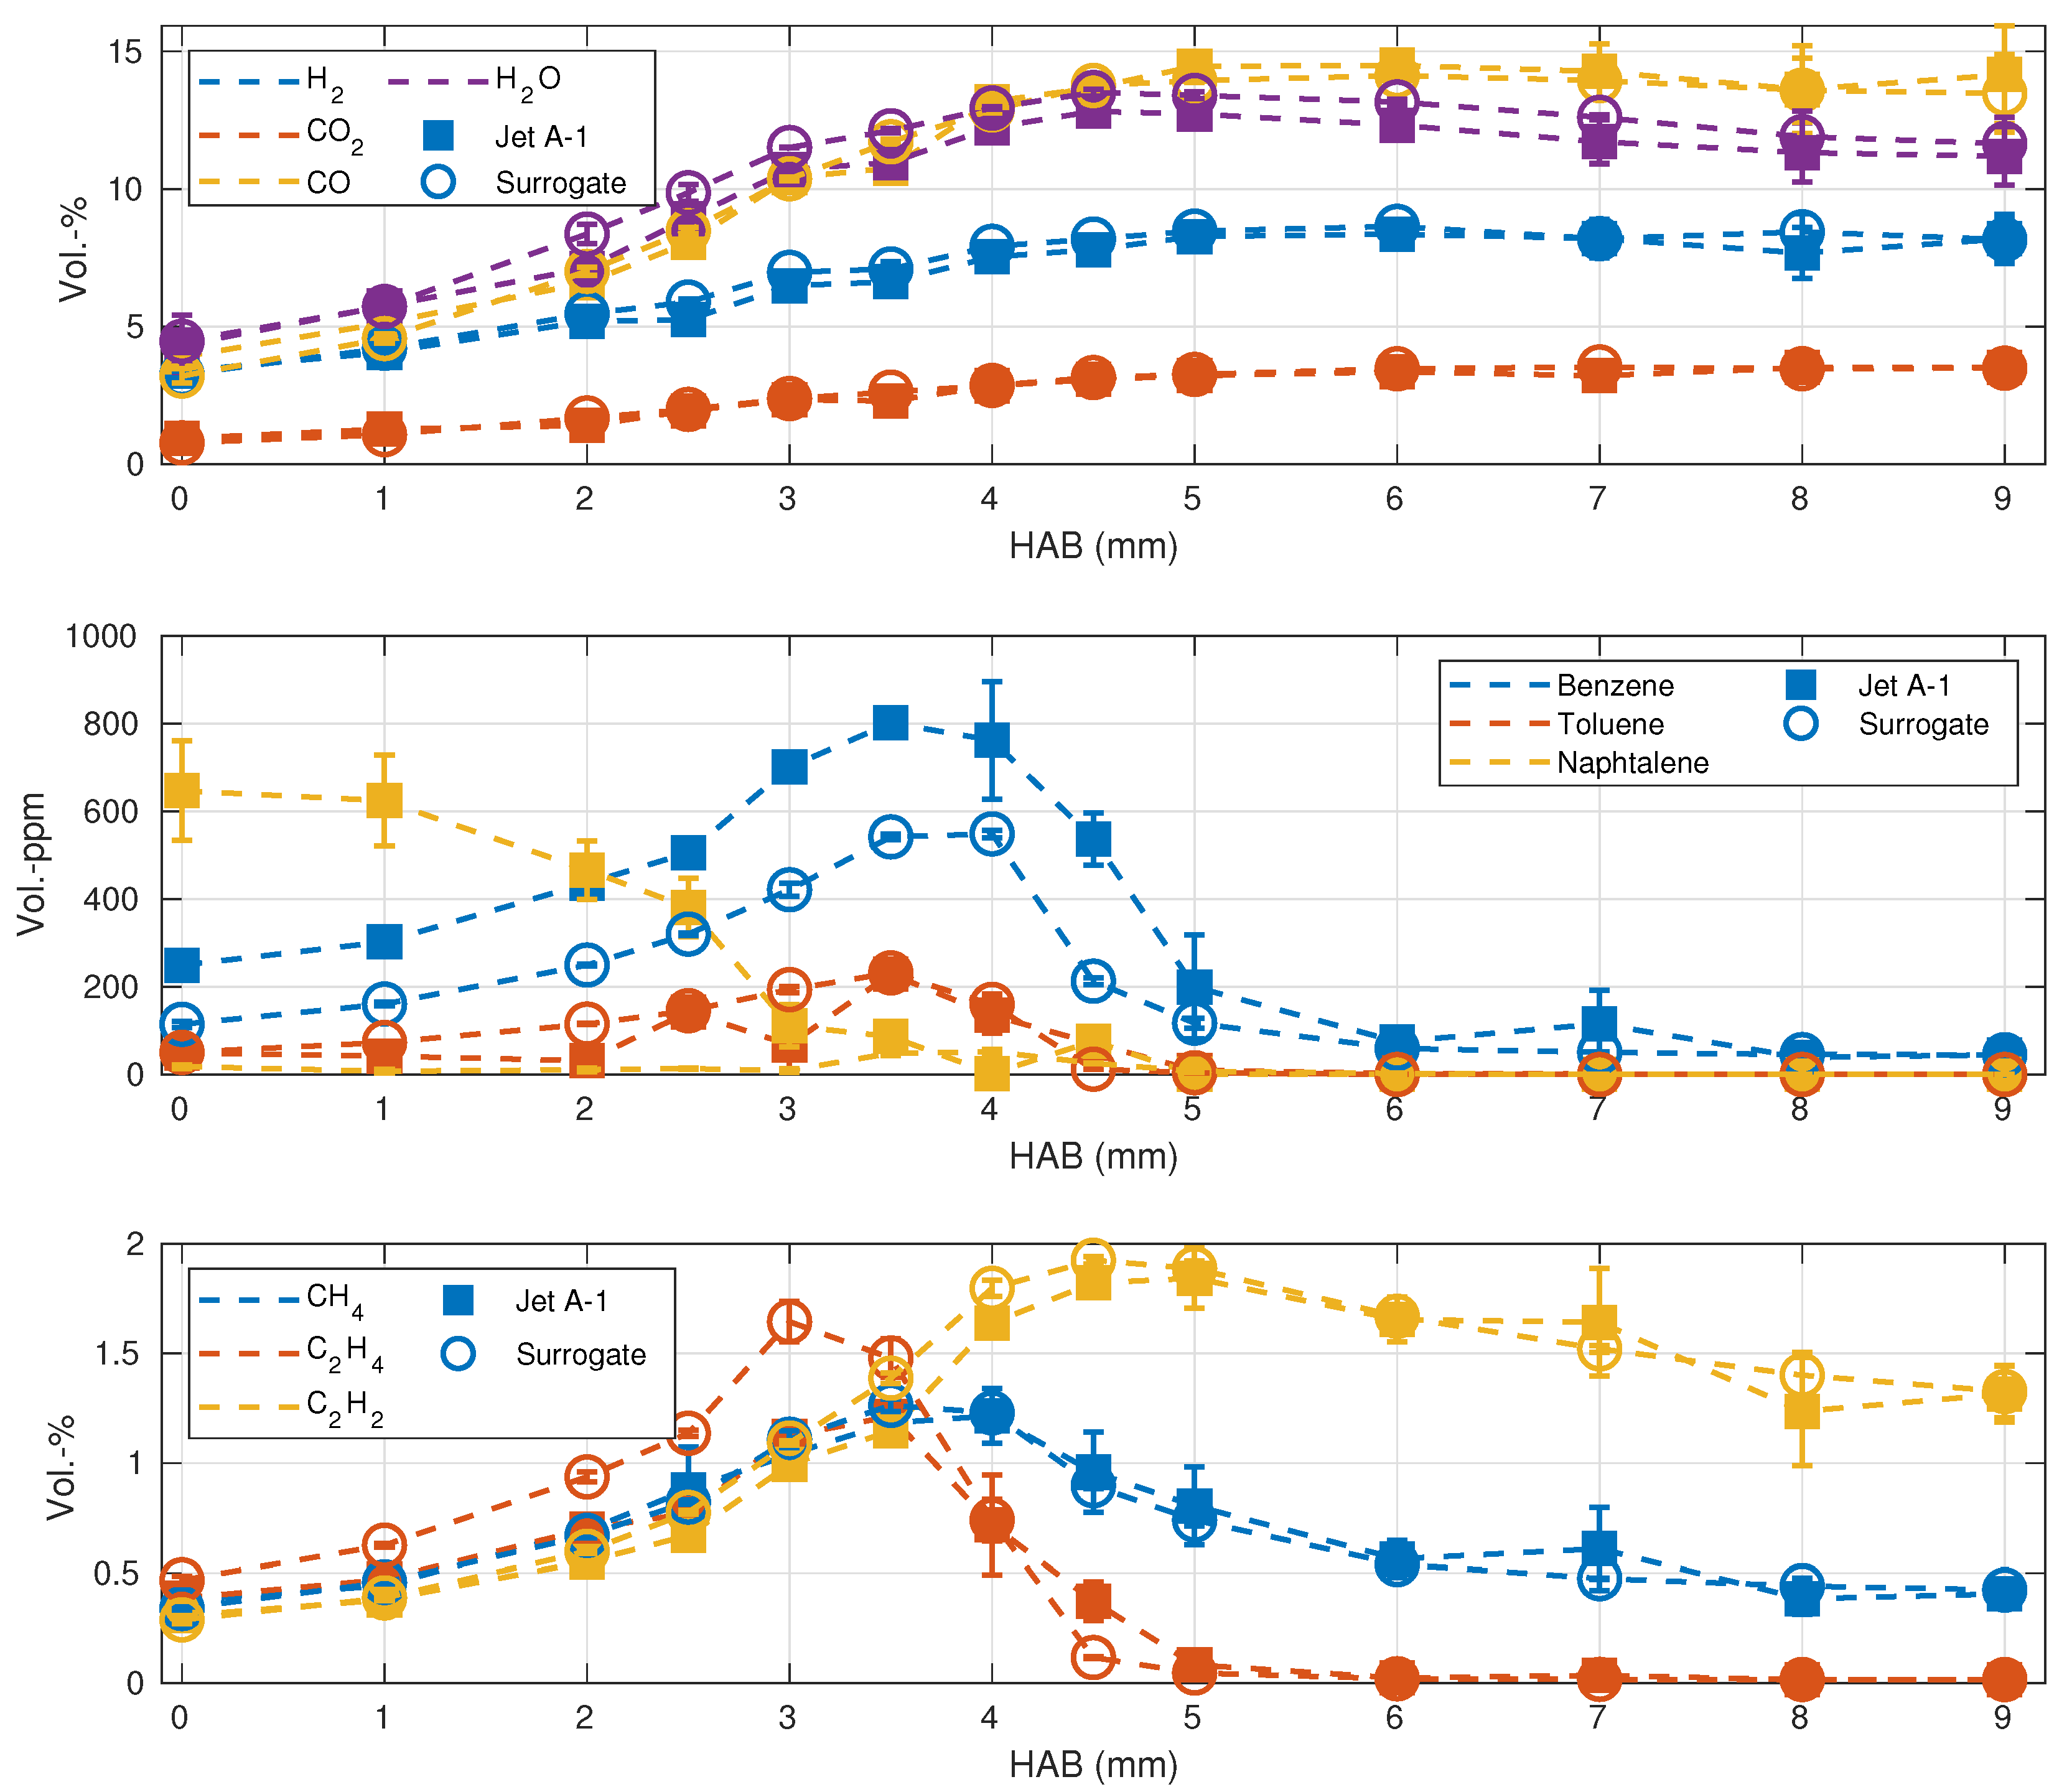
3.1. Flame Structure

Temperature profiles of the Jet A-1 and surrogate flames for three different equivalence ratios are shown in Figure 1. The temperature maximum is reached between 3.5 and 4 mm HAB and shows values between 1650 and 1750 K. After the maximum, the measured temperatures decrease slightly due to heat losses by radiation and mixing with the sheath flow. The measured temperature profiles are very similar for all flames studied, with a slight dependency on the equivalence ratio. No significant differences are found between the Jet A-1 and the surrogate. The same is observed for the profiles of the water concentration (Figure 2), which also show very similar courses for kerosene and surrogate. The maximum water concentrations are found at about 3–4.5 mm above the burner and are 12–15 vol.-%. The maximum acetylene concentrations (Figure 3) are further upstream a HAB about 4–4.5 mm and reach 1.5–1.8 vol.-%. It can be concluded that no significant differences in the flame structure and the first soot precursor are found between the Jet A-1 and surrogate flames.
In contrast to the previous findings, the measurements of the soot volume fractions show a different trend. Figure 4 shows the profiles of the soot volume fraction. Soot is detectable from 2 mm HAB and a clear dependency on the equivalence ratio is evident, with significantly higher volume fractions for the fuel-richer blends. In addition, there are also significant differences between the Jet A-1 and the surrogate. The maximum soot concentrations in the surrogate flames can be about twice as high as the concentrations found in the kerosene flames. For all investigated flames, the volume fraction increases steadily for increasing HAB.
For Φ = 2.1 and an inlet velocity of 5 cm/s, the concentration profiles of some main species and higher hydrocarbons were measured by GC in the kerosene and surrogate flames. The results are shown in Figure 5. The first part of the graph shows the profiles for hydrogen, carbon dioxide, carbon monoxide and water. As expected for fuel-rich flames, the concentrations of hydrogen and carbon monoxide are high with a maximum of just under 15 vol.-% CO. The Jet A-1 and surrogate profiles are again very similar. This was also to be expected due to the similar C/H ratio and chain length of both fuels.
In the second part of Figure 5, the concentration profiles of the soot precursors benzene, toluene and naphthalene are plotted. The profiles of toluene concentrations in the Jet A-1 and surrogate flames are again very similar. More pronounced differences are seen for the other two species. In the kerosene flames, over 600 ppm naphthalene can already be measured directly at the burner inlet. This is in accordance with the composition of the kerosene used in this work. The kerosene composition analysis results shown in Table 2 give a naphthalene content in the fuel of 1.5 vol.-%, which in the mixture studied here at Φ = 2.1 means about 500 ppm in the mixture. The naphthalene concentrations of the surrogate flames are an order of magnitude smaller. The trend of the benzene concentrations is similar for both fuels, the maximum being between 3.5 and 4 mm in each case and is rapidly consumed thereafter. However, the concentrations are consistently higher in the kerosene flames and the differences are over 200 ppm at the maximum.
The lowest part of Figure 5 shows the concentrations of methane, ethylene and acetylene. The concentrations of all three species increase constantly up to a height of 3.5 mm. From this height, concentrations of methane and ethylene drop and both species are fully consumed at a height of 5 mm. At this height, the acetylene concentration also reaches its maximum, and then drops slightly. There is a notable difference in the ethylene concentrations between the Jet A-1 and surrogate flames. Before the transition point at 3.5 mm, the concentration of ethylene is significant higher in the surrogate flames.
The complete set of experimental results can be found in the Supplementary Materials.

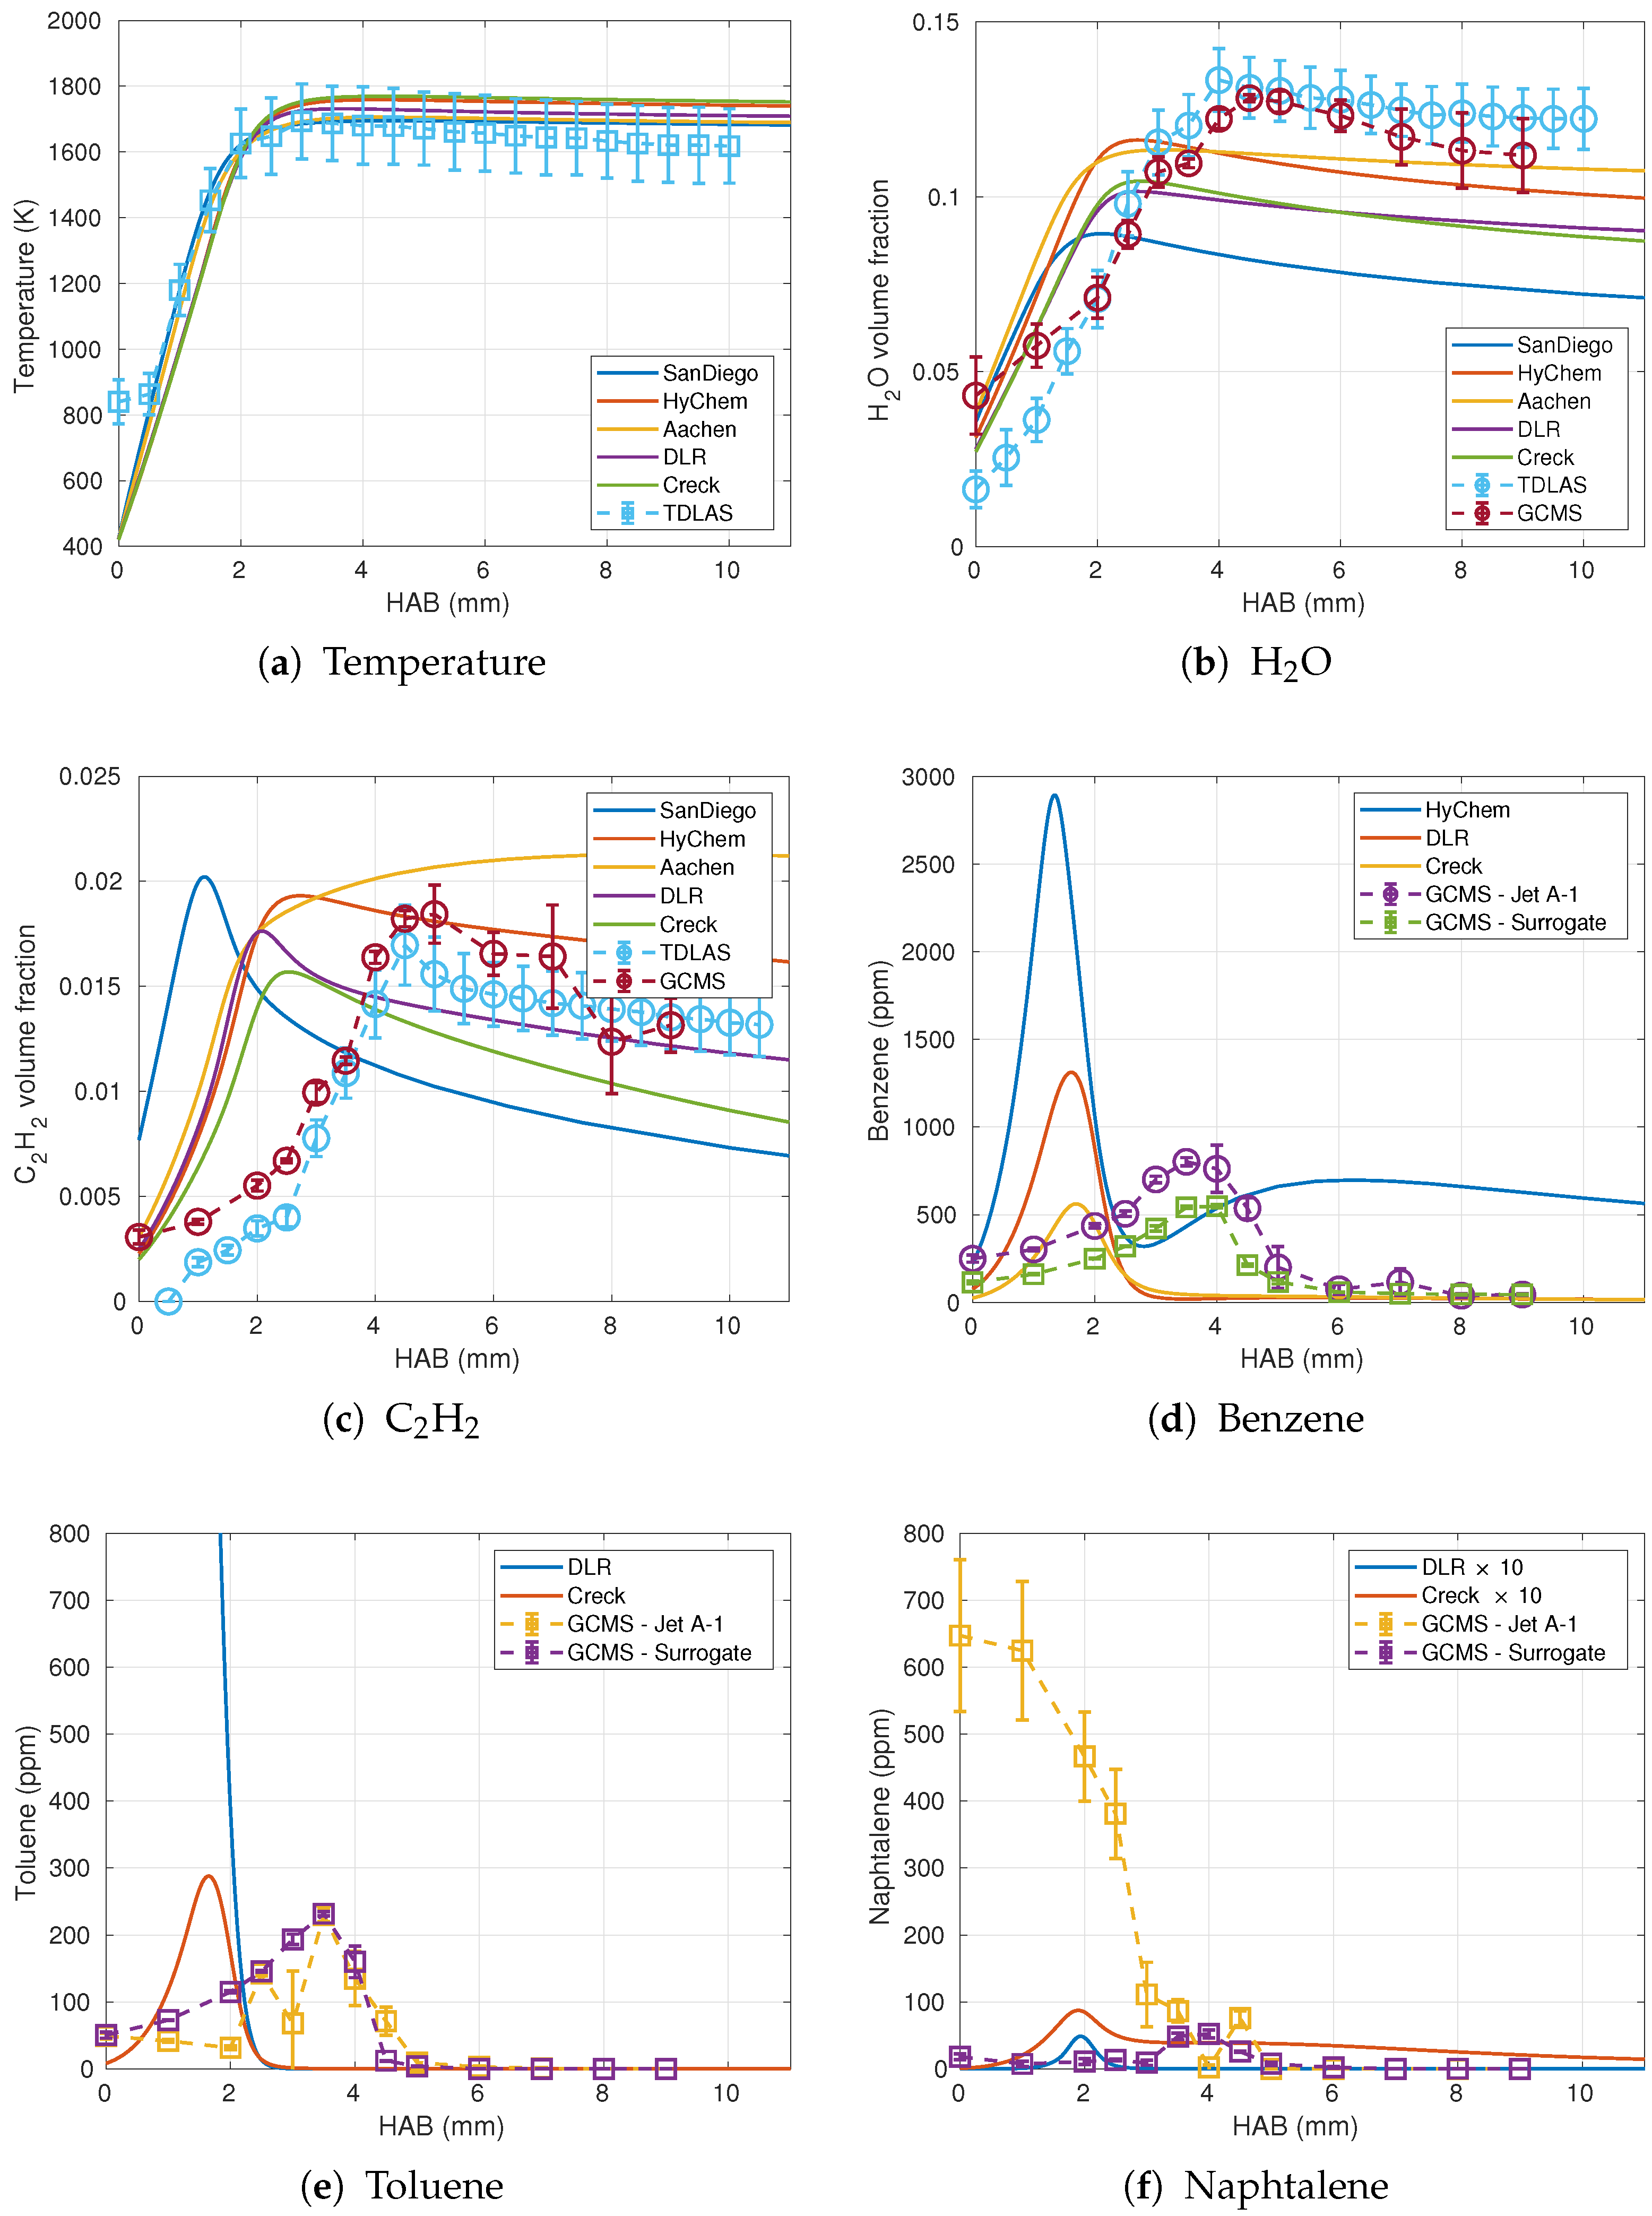
3.2. Comparison with Numerical Calculations

To better understand the high similarity of measured temperatures and species concentrations and the simultaneously observed large differences in the measured soot concentrations in the kerosene and surrogate flames, and, for further insight into the processes in the flames, numerical calculations were performed using Cantera 2.4.0 [28]. The following reaction mechanisms were considered for this purpose:
  • A reaction mechanism developed by Honnet et al. [12] for the trimethylbenzene and n-decane surrogate. By analogy with the name of the surrogate, this mechanism is referred to hereafter as the Aachen mechanism (120 species, 841 reactions).
  • The mechanism developed by the University of California San Diego for JP10 [29]. It is hereafter referred to as the San Diego mechanism (61 species, 298 reactions).
  • The mechanism developed by Wang et al. [30] and Xu et al. [31]: the “HyChem” (Hybrid Chemistry) mechanism for JP-8 (119 species, 841 reaction).
  • A mechanism developed by Kathrotia et al. [32] for kerosene surrogate mixtures of N-decane, cyclohexane, isooctane and toluene. Since this mechanism does not include all species necessary for the surrogate, a mixture of 42.67 vol.-% N-decane, 33.02 vol.-% isooctane and 24.31 vol.-% toluene was calculated based on Dooley et al. [33]. It is abbreviated here as DLR mechanism (189 species, 1327 reactions).
  • The “Creck” High temperature mechanism for C1–C16 hydrocarbons described by Ranzi et al. [34,35,36]. Calculations were performed using the surrogate mixture of trimethylbenzene and n-decane (368 species, 14,462 reactions).
The calculations were performed with the “BurnerFlame” class for burner-stabilized, flat flames. After initial calculations showed that all mechanisms were able to predict the measured temperatures well, it was decided not to impose a temperature profile on the calculations. Calculations with a fixed temperature profile also showed no significant differences in the species profiles.
The comparison between numerical and experimental data for the Jet A-1 flame is shown in Figure 6 for one operating point. The calculated temperature profiles are all very similar and also agree with the measured temperatures (Figure 6a). The experimentally observed slight cooling of the flame after the temperature maximum is not seen in the calculated results. This can be attributed to the heat losses due to radiation, which were not taken into account in the numerical calculations.
Figure 6b shows the comparison of the water concentrations. The calculated concentrations are very similar at the beginning, significant differences appear from a height of 2 mm. All mechanisms underestimate the water concentrations and predict the rise earlier than observed experimentally. Therefore, the numerical predictions show higher hydrogen concentrations in comparison to the experiments (not shown here).
The comparison between calculated and measured acetylene concentrations are shown in Figure 6c. Here, clear differences between the mechanisms are observed. For example, the San Diego mechanism shows the maximum concentration as early as 1 mm with concentrations dropping comparatively rapidly thereafter. The other mechanisms agree with each other up to a height of about 2 mm, but thereafter differ markedly in the concentrations calculated. The rise in acetylene concentration in the flame is predicted by the four mechanisms more than 2 mm earlier than observed experimentally. The measured concentrations after the flame front are between the calculated values of the HyChem and DLR mechanisms. It should be noted that the shift between the experiments and the numerical results was experimentally confirmed using two different measurement techniques (TDLAS and GC) for the water and acetylene concentrations.However, a systematic shift in the experimental results is possible.
Figure 6d shows the comparison of the measured benzene concentrations with the numerical results. Since the Aachen and San Diego mechanisms do not include these species, they are omitted from the plot. The HyChem mechanism predicts the highest maximum concentration, followed by DLR and Creck. There is approximately a factor of six between HyChem and Creck. The location of the maximum concentration is about 1.5 mm for all mechanisms and, as with the species profiles considered previously, is about 2 mm ahead of the experimentally observed values. The peak concentration of the Creck mechanism agrees very well with that of the surrogate.
Figure 6e shows the comparison for the toluene concentrations. Only the DLR and Creck mechanisms include these species. Since the DLR mechanism was calculated with a surrogate mixture consisting partly of toluene, it shows very high concentrations at the beginning and a meaningful comparison with the measured data is not possible. The maximum concentration of the Creck mechanism fits well with the concentrations measured experimentally for the Surrogate. The location of the calculated maximum is again about 2 mm further upstream of the experimental values.
Finally, the comparison with the naphthalene concentrations is shown in Figure 6f. Both the Creck and DLR mechanisms underestimate the concentrations by about an order of magnitude, and, compared to the surrogate, the calculated maximum is again further upstream of that observed experimentally. As expected, the high concentrations at the burner exit in the Jet A-1 flames could not be predicted because they appear due to the composition of the kerosene.

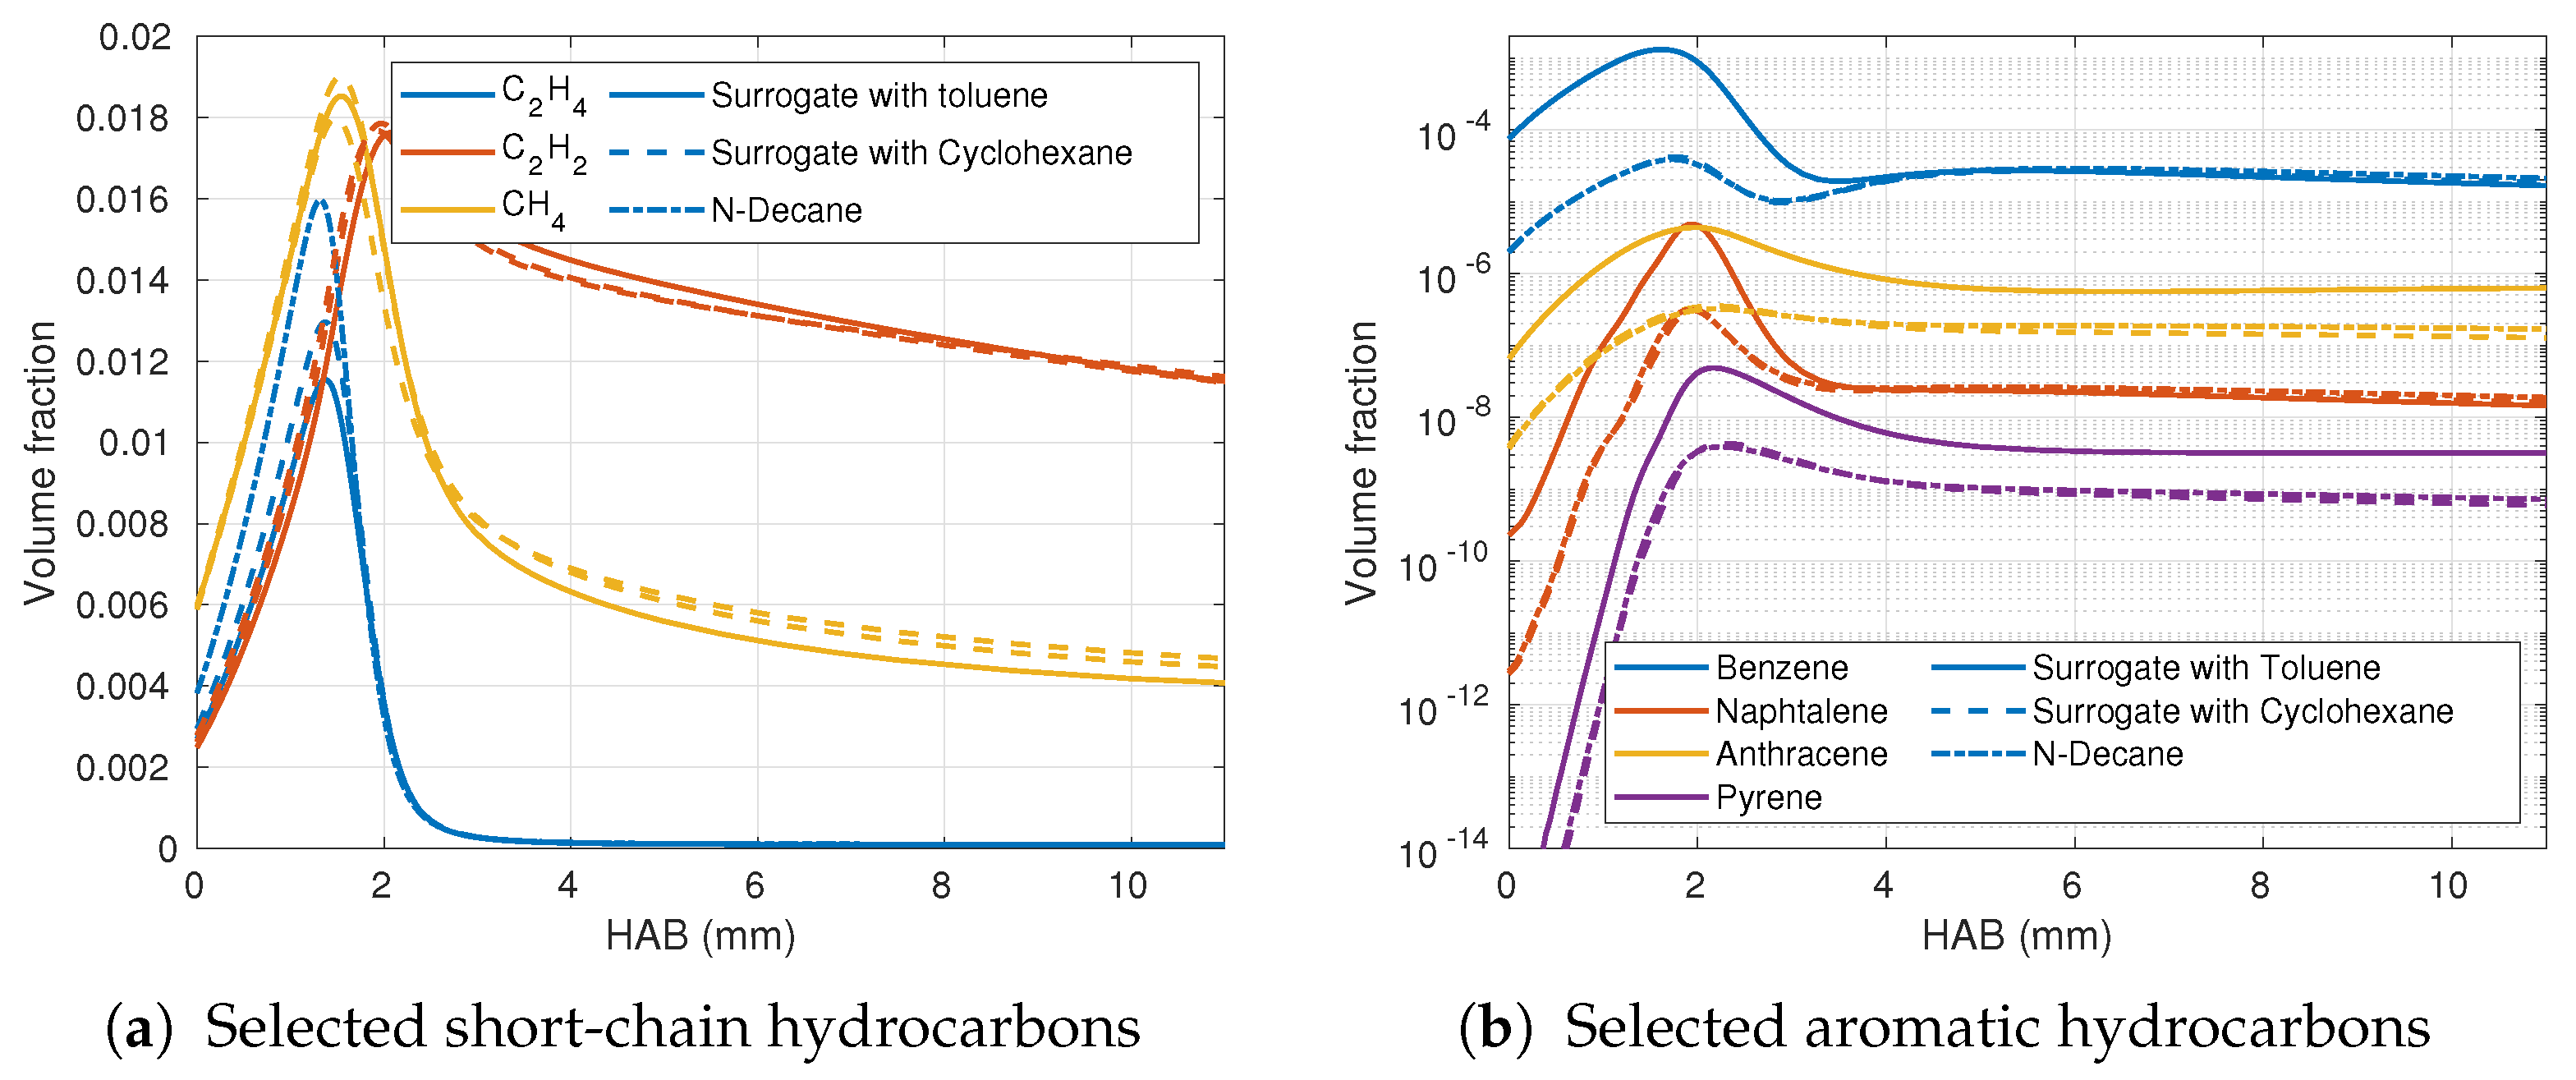
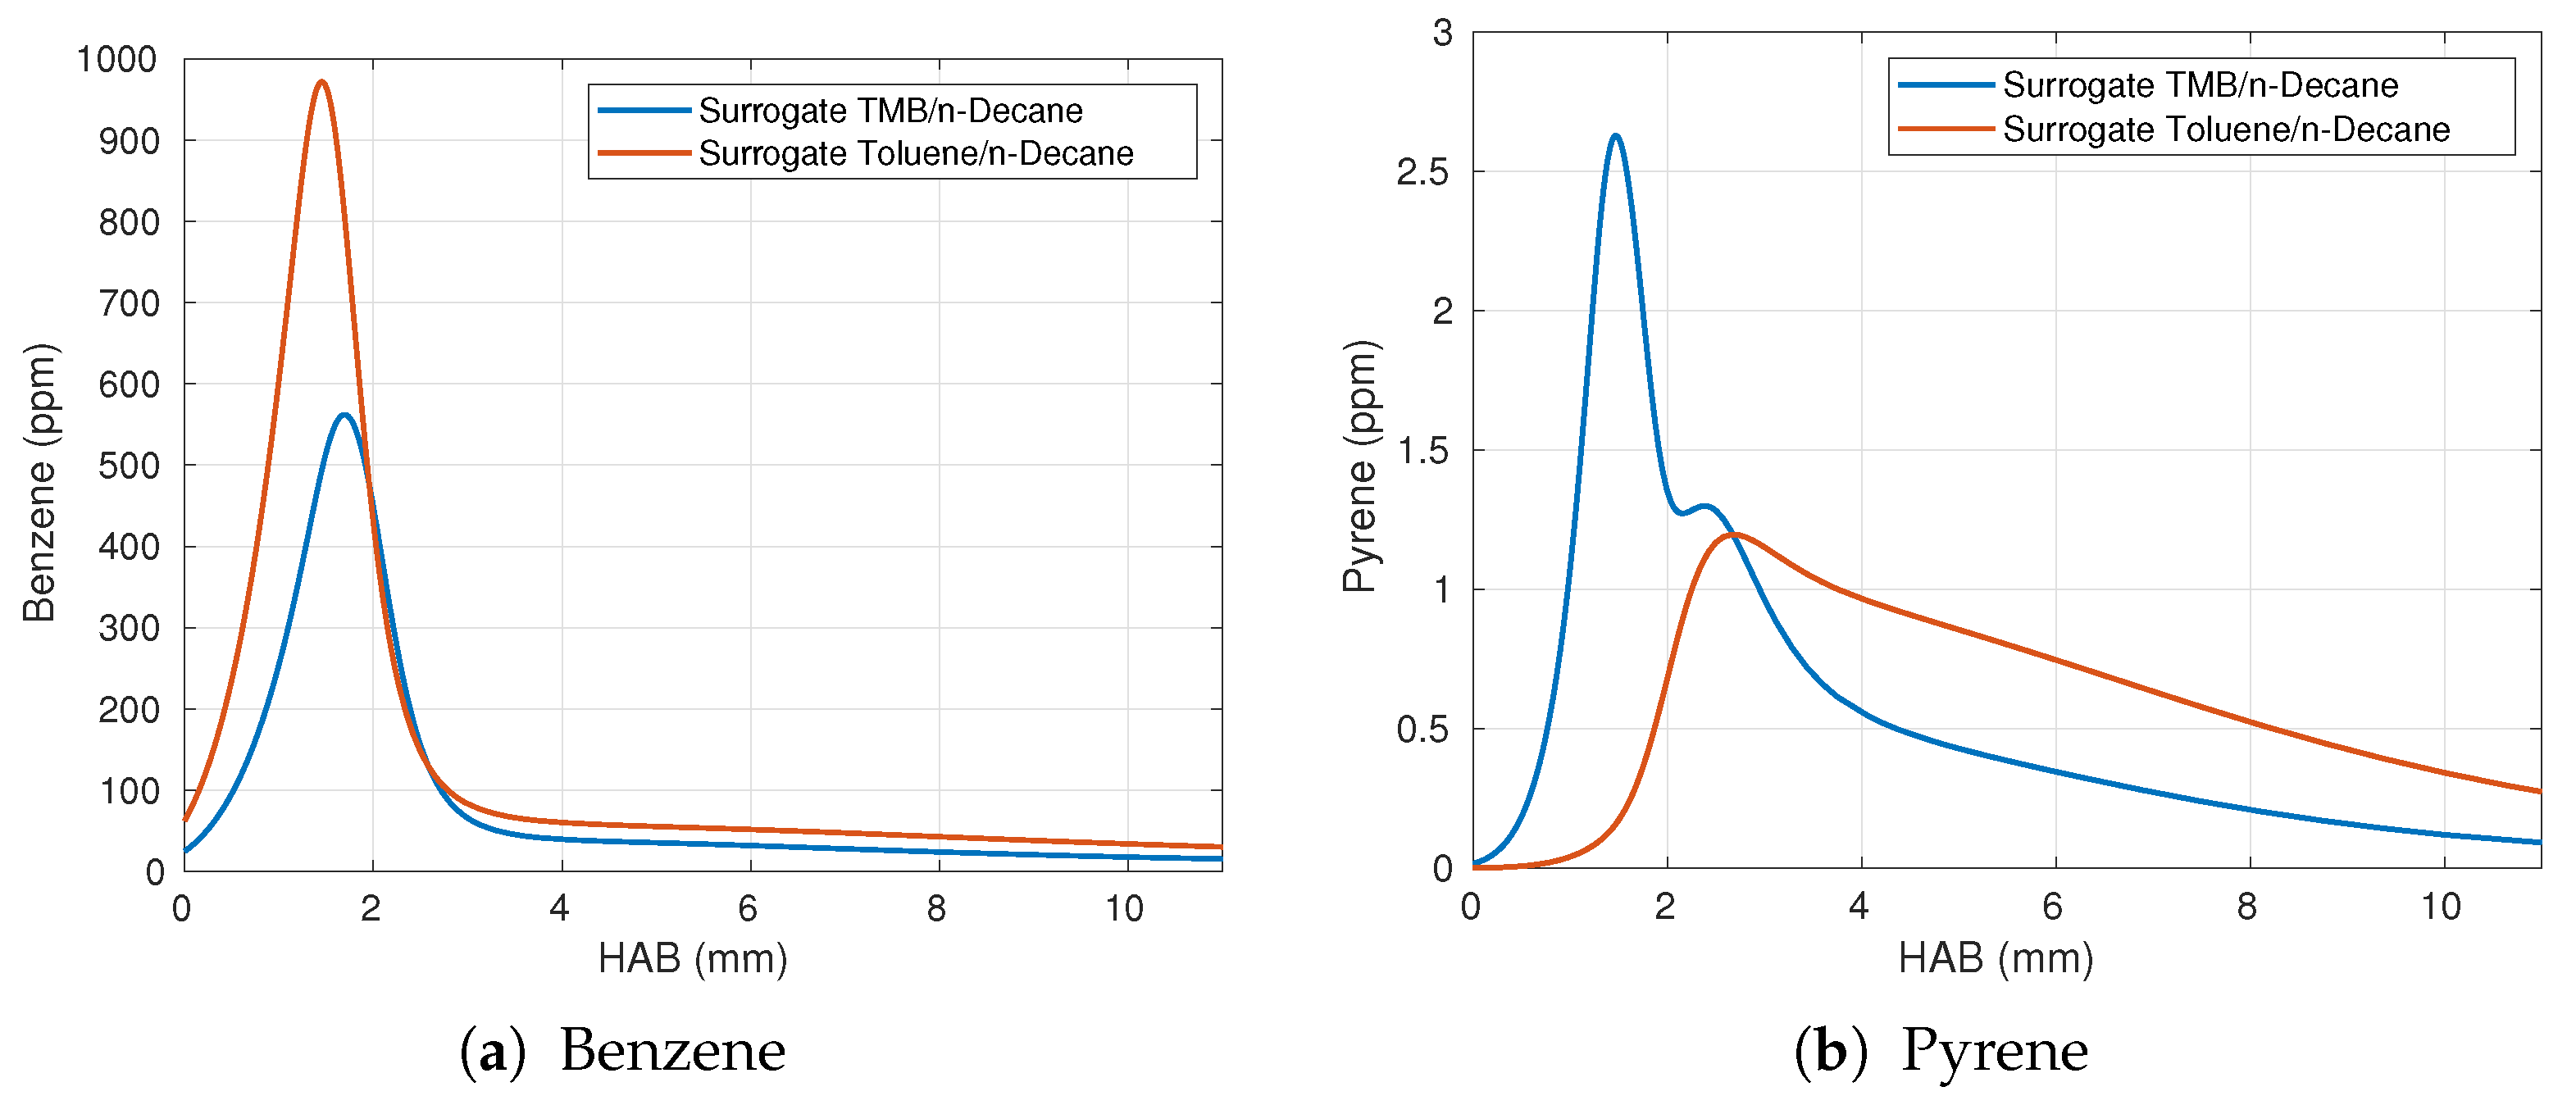
3.3. Numerical Variation of the Fuel Composition

The measured higher soot concentration in the surrogate flames compared to the Jet A-1 flames is at odds with the lower benzene concentration there. To try to explain this behavior, another fuel variation was considered using the DLR and the Creck mechanism for numerical calculations. To understand the influence of the surrogate composition on the formation of soot precursors and thus on soot formation, calculations were carried out with different fuel compositions using the DLR mechanism. The mechanisms were chosen in each case depending on the available species.
For this purpose, five different surrogates containing (tri)methylbenzene, cycloalkane or alkane were considered. In addition to the previously used mixture (42.67 vol.-% N-decane, 33.02 vol.-% isooctane and 24.31 vol.-% toluene), the toluene was replaced by cyclohexane in the second mixture. The third mixture consist out of pure N-decane. In a second study, trimethylbenzene/n-decane and toluene/n-decane mixtures were investigated to gain insight into direct formation of different aromatics.
The results in Figure 7 were calculated with the DLR mechanism and Figure 7a shows the concentration profiles for the short-chained methane, ethylene and acetylene. The profiles of methane and acetylene are almost identical for all fuel compositions and the profiles of ethylene are similar, with differences in the concentrations before and at the maximum. This observation fits the experimental data, which also show very similar profiles for kerosene and the surrogate, except for ethylene.
Figure 7b shows the comparison (now plotted logarithmically) for the 1–4 ring aromatic compounds benzene, naphthalene, anthracene and pyrene. PAH are known for their role in soot formation and pyrene is often considered a direct soot precursor in numerical models. The comparison now shows clear differences between the mixture with toluene to the other mixtures. For all PAH considered, the concentrations of the surrogate with toluene are 1–2 orders of magnitude higher than those of the other two blends. This would also lead to higher soot concentrations in these blends. This indicates that different sooting behavior of the three fuels is not due to the formation of short-chained soot precursors, but to the different decomposition of the fuel directly to PAHs.
In the second study, the Creck mechanism was used for the calculations and the results are shown in Figure 8. Figure 8a shows the calculated benzene concentrations where the mixture with toluene has a maximum benzene concentration almost twice that of the mixture with trimethylbenzene. In Figure 8b, the comparison of pyrene concentrations is plotted. Here, it is reversed and the mixture with trimethylbenzene has significantly higher maximum pyrene concentrations. Given the known role of pyrene in soot formation, it can be assumed that this flame would also show higher soot concentrations. One explanation for the higher pyrene concentrations in the flames with the trimethylbenzene mixture may be the known behavior of trimethylbenzene leading to rapid formation of polycyclic aromatic hydrocarbons by a number of different mechanisms [37]. It is also known that the formation of PAH is very sensitive to fuel composition and a variety of different reaction pathways can occur [38]. It is therefore difficult to infer the soot properties of the fuel and the amount of soot in the flame from individual measured aromatic concentrations.

4. Conclusions

In this study, detailed experimental investigations of kerosene and surrogate flames were performed using different measuring techniques. The temperature, main species and short-chain HCs, PAHs and soot volume fraction were resolved for kerosene Jet A-1 and a two component surrogate at different operating conditions.
The results show that the kerosene and surrogate flames do not differ significantly in the main flame structure in terms of temperature and main species profiles. However, they differ significantly in terms of soot volume fraction. These differences are due to the complex chemistry of the PAH formation. Numerical modeling showed that the variations in fuel composition has little impact on the species profiles of shorter hydrocarbons and larger differences are expected in the range of PAH.
It remains to be noted that none of the chemical mechanisms used here can correctly predict the species important for soot formation (e.g., acetylene and benzene). It is well known that the mechanism used has a large impact on the soot modeling results [10]. Therefore, the prediction accuracy of soot emission from real aircraft engines would benefit from improved chemical reaction mechanisms for kerosene.

Supplementary Materials

The following are available online at https://www.mdpi.com/article/10.3390/app11114796/s1, Table S1: Experimental results of kerosene flames, Table S2: Experimental results of surrogate flames.

Author Contributions

Conceptualization, T.v.L., M.M.S., S.S., B.S., D.T. and N.Z.; methodology, T.v.L., S.S. and M.M.S.; data curation, T.v.L., S.S. and M.M.S.; writing—original draft preparation, T.v.L., M.M.S., S.S. and B.S.; writing—review and editing, T.v.L., M.M.S., S.S. and B.S.; visualization, T.v.L.; and supervision, B.S., D.T. and N.Z. All authors have read and agreed to the published version of the manuscript.

Funding

The present research work contributes to the MTET program, Resource and Energy Efficiency, Anthropogenic Carbon Cycle (38.05.01) of Helmholtz Association.

Data Availability Statement

Experimental Data presented in this study is available as Supplementary Materials.

Conflicts of Interest

The authors declare no conflict of interest.

Abbreviations

The following abbreviations are used in this manuscript:
AHaromatic hydrocarbon
BAHBicyclic aromatic hydrocarbon
GC/MSGas chromatography–mass spectrometry
HABHeight above the burner
MAHMonocyclic aromatic hydrocarbon
PAHPolycyclic aromatic hydrocarbon
TDLASTunable Diode Laser Absorption Spectroscopy

References

  1. Finlayson-Pitts, B.J.; Pitts, J.N. Tropospheric air pollution: Ozone, airborne toxics, polycyclic aromatic hydrocarbons, and particles. Science 1997, 276, 1045–1052. [Google Scholar] [CrossRef] [Green Version]
  2. World Health Organization. Ambient Air Pollution: A Global Assessment of Exposure and Burden of Disease; World Health Organization: Geneva, Switzerland, 2016. [Google Scholar]
  3. Bond, T.C.; Bergstrom, R.W. Light Absorption by Carbonaceous Particles: An Investigative Review. Aerosol Sci. Technol. 2006, 40, 27–67. [Google Scholar] [CrossRef]
  4. Iuliis, S.D.; Maffi, S.; Cignoli, F.; Zizak, G. Three-angle scattering/extinction versus TEM measurements on soot in premixed ethylene/air flame. Appl. Phys. B 2010, 102, 891–903. [Google Scholar] [CrossRef]
  5. Lin, H.; Gu, C.; Camacho, J.; Lin, B.; Shao, C.; Li, R.; Gu, H.; Guan, B.; Wang, H.; Huang, Z. Mobility size distributions of soot in premixed propene flames. Combust. Flame 2016, 172, 365–373. [Google Scholar] [CrossRef]
  6. Filippo, A.D.; Sgro, L.; Lanzuolo, G.; D’Alessio, A. Probe measurements and numerical model predictions of evolving size distributions in premixed flames. Combust. Flame 2009, 156, 1744–1754. [Google Scholar] [CrossRef]
  7. Saggese, C.; Singh, A.V.; Xue, X.; Chu, C.; Kholghy, M.R.; Zhang, T.; Camacho, J.; Giaccai, J.; Miller, J.H.; Thomson, M.J.; et al. The distillation curve and sooting propensity of a typical jet fuel. Fuel 2019, 235, 350–362. [Google Scholar] [CrossRef]
  8. Saffaripour, M.; Zabeti, P.; Kholghy, M.; Thomson, M.J. An Experimental Comparison of the Sooting Behavior of Synthetic Jet Fuels. Energy Fuels 2011, 25, 5584–5593. [Google Scholar] [CrossRef]
  9. Saffaripour, M.; Veshkini, A.; Kholghy, M.; Thomson, M.J. Experimental investigation and detailed modeling of soot aggregate formation and size distribution in laminar coflow diffusion flames of Jet A-1, a synthetic kerosene, and n-decane. Combust. Flame 2014, 161, 848–863. [Google Scholar] [CrossRef]
  10. Chong, S.T.; Raman, V.; Mueller, M.E.; Selvaraj, P.; Im, H.G. Effect of soot model, moment method, and chemical kinetics on soot formation in a model aircraft combustor. Proc. Combust. Inst. 2019, 37, 1065–1074. [Google Scholar] [CrossRef] [Green Version]
  11. Rachner, M. Die Stoffeigenschaften von Kerosin Jet A-1. DLR-Mitteilungen 98-01. 1998. Available online: https://elib.dlr.de/3185/ (accessed on 2 May 2021).
  12. Honnet, S.; Seshadri, K.; Niemann, U.; Peters, N. A surrogate fuel for kerosene. Proc. Combust. Inst. 2009, 32, 485–492. [Google Scholar] [CrossRef]
  13. Mairinger, G.; Frassoldati, A.; Cuoci, A.; Pelucchi, M.; Pucher, E.; Seshadri, K. Experimental and computational investigation of autoignition of jet fuels and surrogates in nonpremixed flows at elevated pressures. Proc. Combust. Inst. 2019, 37, 1605–1614. [Google Scholar] [CrossRef]
  14. Gehmlich, R.K.; Kuo, A.; Seshadri, K. Experimental investigations of the influence of pressure on critical extinction conditions of laminar nonpremixed flames burning condensed hydrocarbon fuels, jet fuels, and surrogates. Proc. Combust. Inst. 2015, 35, 937–943. [Google Scholar] [CrossRef]
  15. Vukadinovic, V.; Habisreuther, P.; Zarzalis, N. Influence of pressure and temperature on laminar burning velocity and Markstein number of kerosene Jet A-1: Experimental and numerical study. Fuel 2013, 111, 401–410. [Google Scholar] [CrossRef]
  16. Migliorini, F.; Deiuliis, S.; Cignoli, F.; Zizak, G. How “flat” is the rich premixed flame produced by your McKenna burner? Combust. Flame 2008, 153, 384–393. [Google Scholar] [CrossRef]
  17. Goldenstein, C.S.; Spearrin, R.M.; Jeffries, J.B.; Hanson, R.K. Infrared laser-absorption sensing for combustion gases. Prog. Energy Combust. Sci. 2017, 60, 132–176. [Google Scholar] [CrossRef] [Green Version]
  18. Bolshov, M.A.; Kuritsyn, Y.A.; Romanovskii, Y. Tunable diode laser spectroscopy as a technique for combustion diagnostics. Spectrochim. Acta Part B At. Spectrosc. 2015, 106, 45–66. [Google Scholar] [CrossRef]
  19. Sentko, M.M.; Schulz, S.; Stelzner, B.; Anderlohr, C.; Vicari, M.; Trimis, D. Determination of temperature and water-concentration in fuel-rich oxy-fuel methane flames applying TDLAS. Combust. Flame 2020, 214, 336–345. [Google Scholar] [CrossRef]
  20. Wagner, S.; Fisher, B.T.; Fleming, J.W.; Ebert, V. TDLAS-based in situ measurement of absolute acetylene concentrations in laminar 2D diffusion flames. Proc. Combust. Inst. 2009, 32, 839–846. [Google Scholar] [CrossRef]
  21. Wagner, S.; Klein, M.; Kathrotia, T.; Riedel, U.; Kissel, T.; Dreizler, A.; Ebert, V. In situ TDLAS measurement of absolute acetylene concentration profiles in a non-premixed laminar counter-flow flame. Appl. Phys. B 2012, 107, 585–589. [Google Scholar] [CrossRef] [Green Version]
  22. Teichert, H.; Fernholz, T.; Ebert, V. Simultaneous in situ measurement of CO, H2O, and gas temperatures in a full-sized coal-fired power plant by near-infrared diode lasers. Appl. Opt. 2003, 42, 2043. [Google Scholar] [CrossRef] [Green Version]
  23. Gordon, I.E.; Rothman, L.S.; Hill, C.; Kochanov, R.V.; Tan, Y.; Bernath, P.F.; Birk, M.; Boudon, V.; Campargue, A.; Chance, K.V.; et al. The HITRAN2016 molecular spectroscopic database. J. Quant. Spectrosc. Radiat. Transf. 2017, 203, 3–69. [Google Scholar] [CrossRef]
  24. Rothman, L.S.; Gordon, I.E.; Barber, R.J.; Dothe, H.; Gamache, R.R.; Goldman, A.; Perevalov, V.I.; Tashkun, S.A.; Tennyson, J. HITEMP, the high-temperature molecular spectroscopic database. J. Quant. Spectrosc. Radiat. Transf. 2010, 111, 2139–2150. [Google Scholar] [CrossRef]
  25. Sentko, M.; Schulz, S.; Stelzner, B.; Anderlohr, C.; Vicari, M.; Trimis, D. Experimental investigation of the pressure influence on flame structure of fuel-rich oxy-fuel methane flames for synthesis gas production. Fuel 2021, 286, 119377. [Google Scholar] [CrossRef]
  26. Sante, R.D. Laser extinction technique for measurements of carbon particles concentration during combustion. Opt. Lasers Eng. 2013, 51, 783–789. [Google Scholar] [CrossRef]
  27. Chang, H.c.; Charalampopoulos, T.T. Determination of the wavelength dependence of refractive indices of flame soot. Proc. R. Soc. Lond. Ser. A Math. Phys. Sci. 1990, 430, 577–591. [Google Scholar] [CrossRef]
  28. Goodwin, D.G.; Speth, R.L.; Moffat, H.K.; Weber, B.W. Cantera: An Object-oriented Software Toolkit for Chemical Kinetics, Thermodynamics, and Transport Processes. Version 2.4.0. 2018. Available online: https://zenodo.org/record/1174508 (accessed on 19 March 2020). [CrossRef]
  29. Chemical-Kinetic Mechanisms for Combustion Applications. San Diego Mechanism Web Page, Mechanical and Aerospace Engineering (Combustion Research), University of California at San Diego. Available online: http://combustion.ucsd.edu (accessed on 24 March 2020).
  30. Wang, H.; Xu, R.; Wang, K.; Bowman, C.T.; Hanson, R.K.; Davidson, D.F.; Brezinsky, K.; Egolfopoulos, F.N. A physics-based approach to modeling real-fuel combustion chemistry—I. Evidence from experiments, and thermodynamic, chemical kinetic and statistical considerations. Combust. Flame 2018, 193, 502–519. [Google Scholar] [CrossRef]
  31. Xu, R.; Wang, K.; Banerjee, S.; Shao, J.; Parise, T.; Zhu, Y.; Wang, S.; Movaghar, A.; Lee, D.J.; Zhao, R.; et al. A physics-based approach to modeling real-fuel combustion chemistry – II. Reaction kinetic models of jet and rocket fuels. Combust. Flame 2018, 193, 520–537. [Google Scholar] [CrossRef]
  32. Kathrotia, T.; Richter, S.; Naumann, C.; Slavinskaya, N.; Methling, T.; Braun-Unkhoff, M.; Riedel, U. Reaction Model Development for Synthetic Jet Fuels: Surrogate Fuels As a Flexible Tool to Predict Their Performance. In Proceedings of the ASME Turbo Expo 2018, Oslo, Norway, 11–15 June 2018. [Google Scholar] [CrossRef]
  33. Dooley, S.; Won, S.H.; Chaos, M.; Heyne, J.; Ju, Y.; Dryer, F.L.; Kumar, K.; Sung, C.J.; Wang, H.; Oehlschlaeger, M.A.; et al. A jet fuel surrogate formulated by real fuel properties. Combust. Flame 2010, 157, 2333–2339. [Google Scholar] [CrossRef]
  34. Ranzi, E.; Frassoldati, A.; Grana, R.; Cuoci, A.; Faravelli, T.; Kelley, A.P.; Law, C.K. Hierarchical and comparative kinetic modeling of laminar flame speeds of hydrocarbon and oxygenated fuels. Prog. Energy Combust. Sci. 2012, 38, 468–501. [Google Scholar] [CrossRef]
  35. Ranzi, E.; Frassoldati, A.; Stagni, A.; Pelucchi, M.; Cuoci, A.; Faravelli, T. Reduced Kinetic Schemes of Complex Reaction Systems: Fossil and Biomass-Derived Transportation Fuels. Int. J. Chem. Kinet. 2014, 46, 512–542. [Google Scholar] [CrossRef]
  36. Ranzi, E.; Cavallotti, C.; Cuoci, A.; Frassoldati, A.; Pelucchi, M.; Faravelli, T. New reaction classes in the kinetic modeling of low temperature oxidation of n-alkanes. Combust. Flame 2015, 162, 1679–1691. [Google Scholar] [CrossRef]
  37. Mitra, T.; Chu, C.; Naseri, A.; Thomson, M.J. Polycyclic aromatic hydrocarbon formation in a flame of the alkylated aromatic trimethylbenzene compared to those of the alkane dodecane. Combust. Flame 2021, 223, 495–510. [Google Scholar] [CrossRef]
  38. Wang, H. Formation of nascent soot and other condensed-phase materials in flames. Proc. Combust. Inst. 2011, 33, 41–67. [Google Scholar] [CrossRef]
Figure 1. Temperature profiles measured with TDLAS at 6 cm/s inlet velocity for kerosene Jet A-1 and the surrogate.
Applsci 11 04796 g001
Figure 2. Profiles of water concentration measured with TDLAS at 6 cm/s inlet velocity.
Applsci 11 04796 g002
Figure 3. Profiles of acetylene concentration measured with TDLAS at 6 cm/s inlet velocity.
Applsci 11 04796 g003
Figure 4. Soot volume fraction profiles measured with laser extinction at 6 cm/s inlet velocity.
Applsci 11 04796 g004
Figure 5. Species concentration profiles measured by GC/MS at Φ = 2.1 and 5 cm/s inlet velocity.
Applsci 11 04796 g005
Figure 6. Comparison between measured data of Jet A-1 flame at Φ = 2.1 and v = 5 cm/s and numerical calculations.
Applsci 11 04796 g006
Figure 7. Comparison of numerically calculated species profiles for different mixture compositions.
Applsci 11 04796 g007
Figure 8. Comparison of numerically calculated species profiles for different mixture compositions—surrogate with trimethylbenzene (TMB) as well as surrogate with toluene.
Applsci 11 04796 g008
Table 1. Overview of the investigated operating points.
Φ C/Ov (cm/s)Jet A-1 (g/h)O 2 (slpm)Ar (slpm)
2.10.7676.291.455.47
2.20.73679.811.455.46
2.30.77683.321.455.45
2.10.7564.931.214.56
Table 2. Properties of the used kerosene.
ParameterMethodResult
Olefin contentASTM D 1319<4 vol.-%
Aromatic content 16.5 vol.-%
Density (15 °C)ASTM D 4052800.8 kg/m 3
Sulfur ContentASTM D 5453 (IP 336)600 mg/kg
Naphthalene ContentASTM D 18401.5 vol.-%
Lower heating valueASTM D 240 mod.43.24 MJ/kg
Carbon contentASTM D 529185.0 m.-%
Hydrogen content 13.1 m.-%
MAHASTM D 637919.8 m.-%
BAH 2.1 m.-%
Total AH 21.9 m.-%
Table 3. Beam parameters of the TDLAS laser beams. λ L a s e r is the laser wavelength, d 90 is the 90% beam diameter before the lens, d m i n is the beam waist at the burner center, d 30 mm is the beam diameter at the burner edge and l R a y l e i g h is the characteristic Rayleigh length.
λ Laser (nm)d 90 (m)d min (m)d 30 mm (m)l Rayleigh (mm)
1345101316835716
1392120714039812
1535141215341112
Publisher’s Note: MDPI stays neutral with regard to jurisdictional claims in published maps and institutional affiliations.

