Article

A Heterogeneous Learning Framework for Over-the-Top Consumer Analysis Reflecting the Actual Market Environment

1
Department of Artificial Intelligence Software, Kyungil University, Gyungbuk 38428, Korea
2
Department of Software Engineering, Cyber University of Korea, Seoul 03051, Korea
*
Author to whom correspondence should be addressed.
Appl. Sci. 2021, 11(11), 4783; https://doi.org/10.3390/app11114783
Submission received: 20 April 2021 / Revised: 20 May 2021 / Accepted: 21 May 2021 / Published: 23 May 2021
(This article belongs to the Special Issue Applied Machine Learning Ⅱ)

Abstract

:
The over-the-top (OTT) market for media consumption over wired and wireless Internet is growing. It is, therefore, crucial that service providers and carriers participating in the OTT market analyze consumer traffic for pricing, service delivery, infrastructure investments, etc. The OTT market has many consumer groups, but the proportion of users is not consistent in each. Furthermore, as multimedia consumption has increased owing to the COVID-19 epidemic, the OTT market has changed rapidly. If this is not reflected, the analysis will not be accurate. Therefore, we propose a framework that can classify consumers well based on actual OTT market environment conditions. First, by applying our proposed conditional probability-based method to basic machine learning techniques, such as support vector machine, k-nearest neighbor, and decision tree, we can improve the classification performance, even for an imbalanced OTT consumer distribution. Then, it is possible to analyze the changing consumer trends by dynamically retraining the incoming OTT consumer data. Conventional methods result in low classification accuracy in low-number classes, but our method shows an improvement of 5.3–19.2% based on recall. Moreover, conventional methods have shown large fluctuations in performance as the OTT market environment has changed, but our framework consistently maintains high performance.

1. Introduction

Digital media consumption worldwide is exploding alongside wired and wireless Internet access speeds and bandwidth since the COVID-19 pandemic started. Consumers now have access to media content they want, anytime and anywhere, at cheap prices. YouTube, Netflix, Hulu, Amazon Prime, and Roku are now threatening the existence of traditional media markets [1]. These new over-the-top (OTT) services are defined as “video contents provided through paths based on the internet or internet protocol (IP)” [2]. OTT services are spreading rapidly because consumers can select personalized content and platforms based on their own schedules. The global OTT market is expected to reach USD 1039.03B by 2027 with an average annual growth rate of 29.4% from 2020 to 2027 [3]. In the US (the largest OTT market), there were 182-million OTT subscribers as of 2019 [4], and YouTube (the most popular digital broadcasting platform), was watched by 84.2% of the US digital video viewers; Netflix was watched by 67.6% [5]. As the OTT market has grown, various global service providers and telecommunication carriers have competed intensely.
As some indoor and outdoor activities were restricted owing to COVID-19, demand for video streaming skyrocketed as movie theaters shut down. Subscription video on demand, the most typical OTT method, is a monthly subscription model that allows users to view all platform content for a gateway fee. Subscriptions have increased by approximately 10% since COVID-19 started [6]. Similar phenomena have led to a significant increase in consumer traffic consumption. As the OTT market grows rapidly, an analysis methodology specialized for the OTT market is required. Focusing on the OTT market, we intend to propose a market analysis methodology that will be required by players participating in the OTT market.

1.1. Motivation and Objective

Due to the growth of the OTT market, the revenue generated by the consumer growth is positive from the standpoint of OTT service providers, but content delivery network (CDN) service costs also have grown [7]. To generate profits, OTT companies must analyze and capitalize network usage. Network operators are also struggling because of the growth in OTT traffic. A problem occurs in terms of profitability if the service fees are not commensurate to the provided services [8]. In particular, because it is important for an OTT company to ensure quality of service (QoS), it is essential to manage the network effectively [9]. In the case of live streaming, which now accounts for a considerable portion of OTT, QoS expectations have placed a large burden on telecommunication carriers [10]. To address these challenges, carriers offer a variety of service contracts. Normally, if allocated bandwidth is exceeded, a service degradation is often applied [11]. This allows telecommunication carriers to better manage large and complex network resources. However, throttling often causes complaints from customers with changing needs. Therefore, both providers and consumers have a learning curve. As such, companies participating in the OTT market need to be able to more accurately classify the OTT service patterns of consumers to maintain contracts and create profits.
Many studies have been conducted to analyze the traffic of traditional networks. In particular, there have been many studies recently that have applied artificial intelligence and machine learning (ML) based methods for analyzing common Internet traffic. However, these methods generally target general-purpose traffic, and very few studies have analyzed OTT service traffic [12,13]. While these studies are significant in that they dealt with ML methods specialized for OTT traffic classification, they neglected real-world problems that were common to the OTT market. OTT consumers range from heavy users who watch tremendous amounts of OTT content, to light users who rarely watch, and the proportions are not the same [12,14]. If ML is applied without considering these imbalances, the classification accuracy drops for the smaller user group [15]. OTT usage patterns change rapidly over time, such as during the COVID-19 pandemic. Because new OTT services are continually offered, and telecommunication carriers offer various subscription-fee schemes, consumer usage patterns also change. Conventional studies on OTT traffic have not considered the dataset changes caused by these phenomena. They generally perform ML and classification for the data once, which does not reflect continuous changes. Hence, classification accuracy declines over time. Our research objective is to propose a method to analyze OTT consumers well, based on actual market environment conditions.

1.2. Contribution

In this study, we propose an OTT user classification method that responds to real-world problems. OTT users can be divided into several groups according to their data usage, and the number of members for each group is not consistent. While existing studies show good performance in classifying groups composed of similar numbers, their classification accuracy for classes with small numbers reduces with the imbalanced data environments encountered in real-world situations. We thus propose a framework to solve this problem as this is an issue that is readily discoverable in the OTT market but has not yet been considered as a research topic. First, when classifying a class with small numbers using ML, we tried to increase the classification accuracy by setting the weight for the error occurring in the class higher than the error occurring in a class with a large number of members. As the weights were set high, and the ML classifier was set to avoid errors with high weights, we were able to improve the classification accuracy of classes with a small number. To set the weight of the error, the probability of indicating the class to which a sample belongs was calculated based on the costs of misclassification errors, and, by setting the cost high, the weight for a specific error could be set high. In addition, in order to respond to changes in consumer trends, we constructed a module that can periodically update the training data. Unlike existing studies that do not take changes in trends into account, our framework periodically updates training data, which allows us to respond to frequent trend changes with regard to OTT users. According to experimental results, it can be seen that, even though consumer trends change, our framework shows a constant performance; however, the performance of existing methods degrades severely. As such, our study suggests ways to solve the practical problems encountered in the OTT market. In other words, it has great significance as the OTT user analysis framework reported here can be utilized to realistically analyze OTT users.
The remainder of this paper is organized as follows. Section 2 discusses the importance of analyzing OTT-related trends and usage patterns. Furthermore, we examine the limitations of conventional studies. Section 3 introduces the OTT user analysis framework proposed in this study, and Section 4 examines the experimental results. Finally, Section 5 presents conclusions and a brief description of future studies.

2. Literature Review

2.1. OTT Services

Recent statistics show that OTT consumers are moving away from traditional television (TV)-based content viewing. In the US market, the proportion of those who have subscribed to a streaming video service at least once (68%) has already surpassed the ratio of paid TV subscribers (65%). Furthermore, the average number of streaming subscriptions has increased by 33% since the beginning of the COVID-19 outbreak [16]. As of December 2020, US consumers spent an average of USD 47 per month, a significant increase from the USD 38 reported in April of the same year [17].
An increasing number of companies are entering the OTT market, intensifying competition. In the second quarter of 2020, Netflix had the highest streaming proportion in the US market, accounting for 34%. This was followed by the traditional OTT powerhouses of YouTube, Hulu, and Amazon Prime, with 20, 11, and 8%, respectively. Disney Plus then launched, quickly garnering 4% [18] after acquiring the 21st Century Fox library [19]. Because existing OTT companies already dominate the market to some extent, TV broadcasting companies, telecommunication carriers, and cable operators are now releasing their own apps or investing in other platforms. After acquiring Warner Media, AT&T launched an OTT service leveraging their new HBO content [20].
The rapidly changing market is looming as both a threat and an opportunity for OTT operators. Notably, it is expected that many subscriptions will not be renewed after COVID-19 restrictions are lifted. Thus, OTT operators must find ways to retain customers. For this, the Boston Consulting Group has advised OTT operators to analyze user patterns and to classify them into groups for customized strategies [6]. Pricing plans comprise an important customer lure. The biggest reason that customers cancel subscriptions is the expense, and this accounts for 36% of all cancellations [16].
Telecommunication carriers, cable operators, and Internet-protocol TV (IPTV) operators are struggling under the competitive OTT environment [21,22]. For example, the IPTV market overlaps and encroaches many OTT services. Bundled service strategies are sometimes required to prevent IPTV subscriptions from being canceled for OTT viewing [23]. In South Korea, KT, the operator with the highest IPTV market share, is partnering with Netflix to create synergies. Netflix is using this opportunity to enter the South Korean market. Additionally, KT will receive network fees by providing Internet bandwidth to Netflix. Furthermore, an increase in the number of KT customers is expected when Netflix is provided as a bundled service [24]. Mobile network providers are also required to make infrastructure investments to maintain the quality of live streaming. With the spread of 5G, an increasing number of users are enjoying OTT services wirelessly. However, failure to provide a stable QoS will result in customer churn. In fact, about 30% of consumers are willing to for pay premium prices if the mobile networks, especially 5G, can deliver better video quality and reduce buffering [25]. As more consumers use real-time services, network operators face difficulties because of infrastructure investments [10,26]. Network operators must build a sound service-quality degradation strategy that minimizes network resource consumption, while also satisfying consumer demand and QoS. As such, it is crucial for all providers to establish appropriate pricing schemes for the OTT environment.
Various studies have been conducted on pricing systems related to content providers, network operators, and service users based on net neutrality. These include a study based on QoS [9], a study based on the quality of experience [27], a study using shadow prices [28], and a study based on CDNs [29] or software defined networks [30] (see Section 2.1 of our previous study [13] for a brief description of these constructs). Although there are differences in these detailed methods, most studies have proposed pricing schemes based on network use per user per month. Hence, it is a top priority for OTT and network providers to identify the traffic usage patterns of OTT users to determine the most efficient pricing scheme. It is thus important to effectively classify and group OTT users. Then, they can implement suitable pricing strategies. Clearly classifying OTT users is the first step. In this study, we propose a ML-based framework specialized for OTT user traffic analyses in a real-world environment.

2.2. Review of Classification Using ML

Machine and deep learning methods are widely used for user traffic analyses, owing to advancements in artificial intelligence technology. Many relevant techniques have been studied, including decision tree, a traditional ML method [31,32], support vector machine (SVM) [33,34,35], k-nearest neighbor (KNN) [36,37], hidden Markov model [38,39], and k-means [40,41]. There have been recent studies on traffic analyses using deep learning, which has strengths in terms of accuracy [42,43,44]. Although there are some differences in the techniques and forms of the applications, they all tend to capture and analyze traffic based on features. Analysis targets range from captured packets to open datasets, but little consideration has been given to OTT data.
Rojas et al. proposed a method of classifying users based on OTT usage data [11,12,45]. They used various ML methods to analyze OTT traffic and classified consumers into three consumption categories: high, medium, and low. Their study is highly significant in that it was the first to attempt to classify OTT users. Their dataset contained real-world data that were equally weighted based on the three consumption classes. However, their validation was performed in an environment different from a real one, and equal weighting was problematic, as we discuss herein. Our previous study was significant in that a deep learning method was applied alongside traditional ML methods [13]. In particular, we proposed a framework to overcome the temporal disadvantages of applying a deep learning method alone. Nevertheless, our study had a limitation in that a dataset detached from the real-world environment was used. In this study, we propose a method that overcomes these limitations.

2.3. Problem Statement

2.3.1. Class-Imbalance Problem

There are diverse demographics of consumers that consume OTT services. Gen-Z’s (born between 1997 and 2006) and Millennials’ (born between 1983 and 1996) lives have included breakthrough technologies and cultural changes that now include OTT services. Statistics show that the Millennials and Gen-Zs use 17 and 14 subscription services each, respectively, whereas Baby-Boomers subscribe to eight on average [16]. A similar phenomenon was observed in network usage statistics. Seventy percent of Gen-Zs subscribe to Netflix; however, as age increases, the subscription rate decreases, with only 39% of Baby-Boomers subscribing to it [46]. When consumers are grouped by country, the characteristics differ among groups again. Consumers in populous India spend more than 45B h using video streaming services, more than double that of US consumers. The country having the highest video content per capita is South Korea, where almost 2000 h are spent per person [47].
As such, OTT market consumers can be divided into various groups, and the number of group members varies widely. According to Walelgne et al. [14], who analyzed the data traffic of mobile users (including OTT), heavy users who comprise only 2–4% of the total consume the most data. They collected mobile traffic from Finland, Germany, the UK, Japan, and Brazil and classified users using a clustering method. In Finland, which had the largest number of research samples, the proportions of heavy, regular, and light users were 3.5, 41.9, and 54.6%, respectively, and the data used for uploads and downloads by each group comprised 328.7, 64.3, and 9.4 MB, respectively. Heavy users, comprising only about 3% of the total, used more data than approximately 97% of the other users. A similar phenomenon was found in other countries, although the proportions were different [14]. Furthermore, similar trends were found in a study that grouped users by analyzing actual OTT traffic. According to Rojas et al., the high, medium, and low consumption groups consisted of 84, 50, and 582 persons, respectively [12].
Similar to the case of OTT user groups, very small or very large numbers of samples for particular classes are often observed in real-world environments [48]. Hence, analysis results will likely be biased toward the most populous classes [49]. With ML, this problem is called the “class-imbalance problem” and is viewed as one of ten major problems to overcome [50]. As reviewed above, very few studies have analyzed OTT traffic, and some did not consider the class-imbalance problem at all, which is easily seen in the OTT demographics. If this problem is not considered, performance deterioration problems will occur with real-world grouping and pricing strategy computations. Therefore, we propose a method to overcome such problems for ML methods, as applied to an actual OTT environment.
In areas other than OTT, the class-imbalance problem is often encountered when classification is performed. For example, many studies on the detection of Twitter spam have overlooked this problem. However, other studies applied methods of artificially re-sampling the data to solve this problem [51,52]. Nevertheless, if re-sampling is performed based on a small amount of data, there will be the problem that the minor classes have the characteristics of only a small amount of collected data. To overcome this, cost-based methods have been applied in the binary classification field [15,53]. These adjust the cost of misclassifications to reduce them for the smaller classes. While employing a cost-based approach in this study, we leverage a method that can be applied to a dataset comprising many classes in accordance with the characteristics of OTT users.

2.3.2. Rapid Changes in the OTT Market

The OTT market has been active for less than a decade, and many companies are competing to lead the market. As mentioned, the landscape of the OTT market is expected to change continuously in the future as media providers, telecommunication operators, and OTT companies compete for market share. According to a survey, many consumers intend to cancel one out of five newly acquired subscription services, and one out of ten previously acquired services after post-pandemic normalization [6]. This is because the time spent on entertainment will likely be reduced when consumers return to their normal routines [16].
Most ML-based classification methods perform learning based on previously collected data. Therefore, it is known that the classification accuracy increases with more learned data. When analyzing OTT consumers, this can be problematic if the training is performed using only previously collected data. Because the OTT market is rapidly changing, it will not be possible to respond to new changes, and the accuracy of the analysis will decrease. Most existing studies performed training based on initially collected data with no plans to continuously update the training datasets. This study, however, proposes a framework for ML and analysis that reflects the evolving patterns of consumers.

3. Research Design

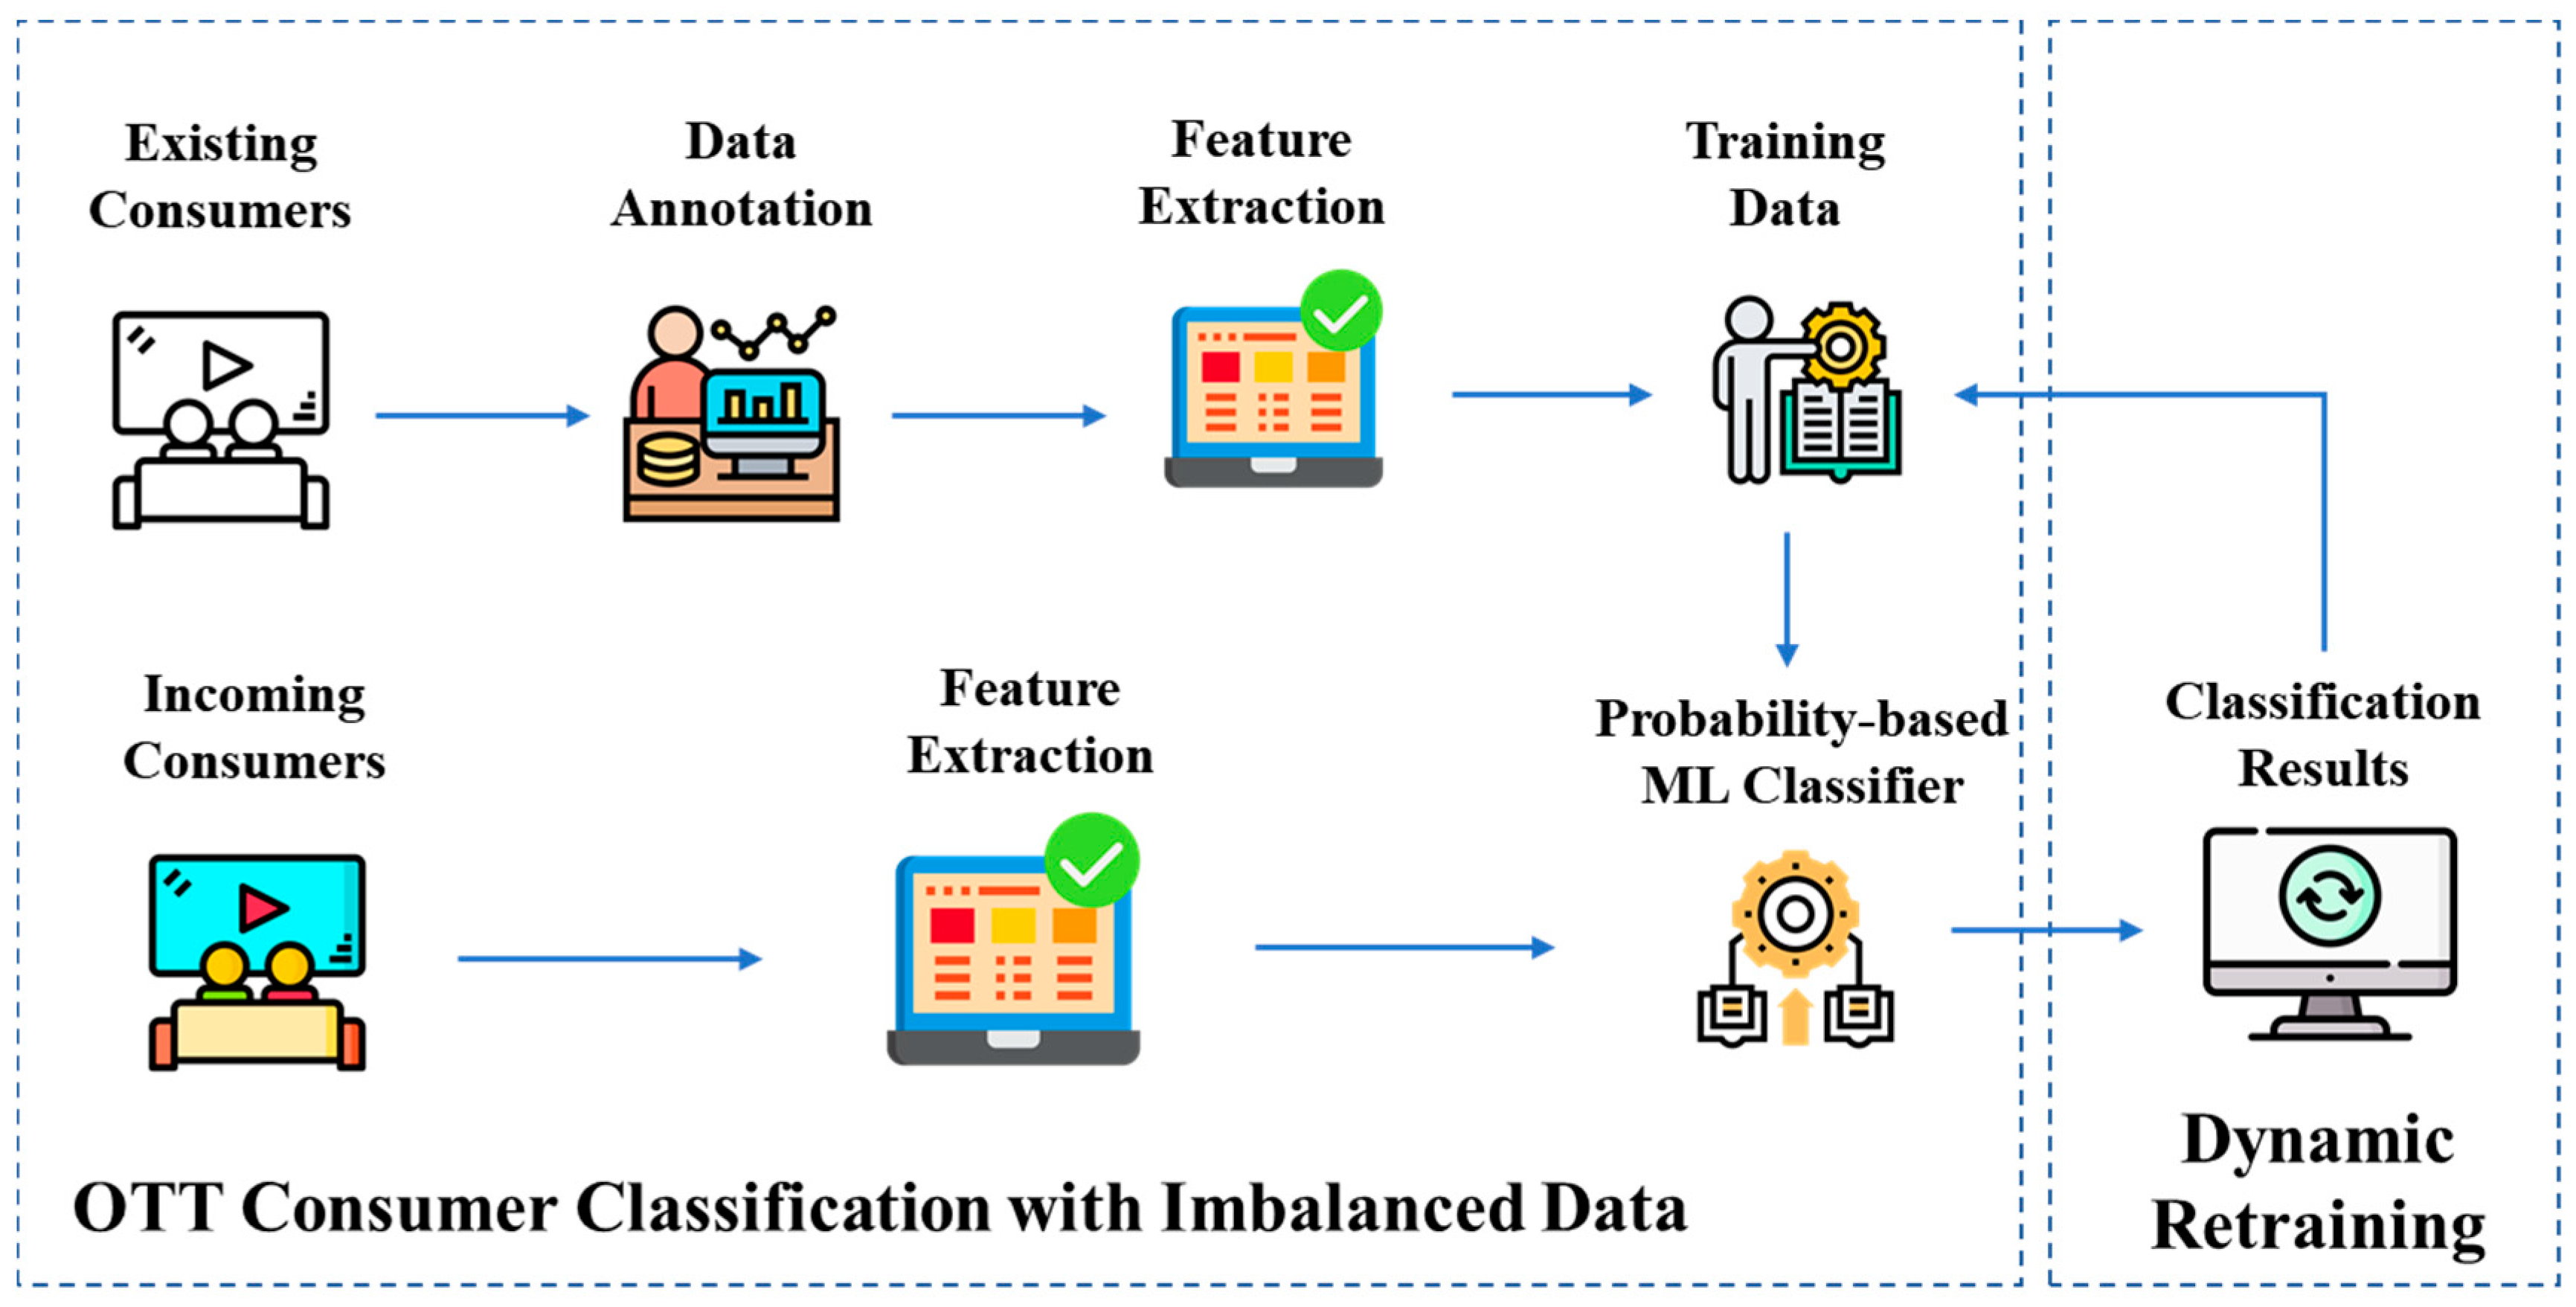
3.1. Model Design: An Overview

We propose a ML-based framework that facilitates the effective classification of OTT users in a real market environment. First, OTT consumer classification is performed to increase the classification accuracy related to the class-imbalance situation. Then, we propose a module that updates the training data at predetermined intervals to reflect the continuously changing trends. Figure 1 illustrates the modules of the proposed framework. The details of each are discussed in the following sections.

3.2. OTT Consumer Classification with Imbalanced Data

The first step in our proposed framework is to analyze the traffic of OTT users by using ML to classify them into groups. For consumer classification, data annotation with the help of experts is first needed after collecting the data usage patterns of existing OTT users. In this method, OTT consumer traffic is classified into three types. Consumers with high OTT usage are classified as “high consumption”, those with a low usage are classified as “low consumption”, and those with average usage are classified as “medium consumption”. As discussed, data consumption differs significantly among the three types. According to Rojas et al., low consumption users account for 81.3% of the total, while high and medium consumption users account for only a small portion of the total [12].
After collecting OTT user traffic and performing annotation, feature extraction is performed. Features refer to individual and measurable properties of data for ML. The more significant features that are extracted, the higher is the accuracy of the classification. In this study, the public dataset released by Rojas et al. was used; thus, our feature sets are also based on their study [12]. As our study’s objective is to classify consumers by analyzing patterns of OTT users, it is important to know how much data users have consumed for each OTT application. Therefore, by utilizing the amount of time and data used by consumers for each OTT application as the main features, consumers can be classified based on their usage patterns. A detailed description of the datasets and features used in this study is provided in Section 4.1.
After extracting features based on collected consumer data, they are used as training data. Afterward, when incoming consumers’ information that needs to be analyzed comes in, features are first extracted. Subsequently, through ML that uses the training data built earlier, the group to which the incoming consumer belongs to is determined. In this process we face the problem of deteriorating classification accuracy due to the class imbalance, as discussed above. In order to improve performance, even in such a situation, we propose a method to calculate the probability of which class each data sample belongs to based on the cost. To better classify the classes, we use different costs for misclassification errors so that mistakes are eventually minimized [15,54]. In particular, the OTT consumer dataset consists of three classes and we propose the appropriate formulation and cost matrix. Table 1 shows the asymmetric cost matrix for OTT consumer classes.
Misclassification refers to the incorrect classification of users. If a user who belongs to the actual high class is classified as medium or low, the costs that occur in this case are C ( h , m ) and C ( h , l ) , respectively. In the case of OTT consumers, because the number of users belonging to the actual high or medium classes is extremely small compared with those in the actual low class, the classification accuracy for the two classes is inevitably low. Because our goal is to improve classification accuracy for classes having small sample sizes, we need to reduce the number of misclassifications of users who actually belong to the high or medium class. We do this with C ( h , m ) and C ( h , l ) , which are applied to misclassifications of high consumption users, and C ( m ,   h ) and C ( m , l ) , which are applied to misclassifications of medium consumption users. They should be set higher than C ( l , h ) and C ( l ,   m ) , the costs occurring due to misclassifying low consumption users. If the costs are set high, misclassifications will be reduced. On the other hand, if the classification is properly performed, the costs are C ( h , h ) , C ( m , m ) , and C ( l , l ) for each respective class. Because there is no risk to the classification system in the case of proper classification, the three above costs should all be set to zero.
Upon completion of cost-setting, classification is performed to determine the class to which samples belong. When a sample is given, the probability of indicating the class to which it belongs is calculated. Supposing that E is the entire dataset. Then, E i is a resample of E with n examples. The probability that an example, x , belongs to a class, j , is as follows [54]:
P ( j | x ) = 1 i 1 i P ( j | x ,   M i ) ,
where i ranges from 1 to m , and m is the number of newly produced resamples. Then, M i is a model created by applying a classification learning algorithm to E i . Here, the risk occurring when x is classified as a class s can be defined as follows [15]:
R ( s | x ) = j P ( j | x ) C ( s ,   j ) .
We must minimize the risk of sample assignment. Therefore, class s , which satisfies Equation (3), becomes the class to which x is assigned:
argmin s R ( s | x ) .
For OTT user classification, because there are three classes, the variables, s and j , indicate the degrees of freedom for high, medium, and low classes.
Various ML algorithms can be used to generate a model, M i , which is used for probability calculation when performing consumer classifications. In this study, we use common ML methods, including decision tree, SVM, and KNN, because we need to determine whether the performance can increase in an imbalanced data environment when our framework is applied. This allows us to check whether data encountered in real-world situations can be accurately classified, regardless of which ML algorithm is used. The ML algorithms used in this study are presented in Section 4.2.

3.3. Dynamic Retraining Module

Another problem encountered when analyzing OTT users in real-world situations is the that where the data characteristics change continuously. Studies on conventional ML-based classifications tend to continuously utilize data that were initially collected after annotation. The critical disadvantage of this method is that newly changed characteristics are not reflected. To overcome this, Chen et al. proposed a method for updating training data at fixed intervals [55]. Based on their studies, we propose a method suitable for OTT user analysis.
To classify OTT users, data are collected first, then they are labeled by an expert. If the collected dataset is T i n i t , the classification algorithm, L , is used to perform training using T i n i t . The classifier, C i n i t , is composed as follows:
C i n i t = L ( T i n i t ) .
Our proposed framework also uses C i n i t , which is based on labeled data that have already been collected. However, although most studies continue to use only C i n i t , we update the training data continuously. If the pre-set time interval, τ , elapses, the classification result of the data that were already collected is obtained. If an additionally collected dataset of high consumption users is H t , that of medium consumption users is M t , and that of low consumption users is L t . Here, t is a time unit that increases by one whenever the pre-set time interval, τ , elapses. The newly added dataset, T n e w , can be summarized as Equation (5), and the classifier C n e w that reflects it is Equation (6):
T n e w = t ( H t     M t L t ) ,
C n e w = L ( T i n i t     T n e w ) .
Periodically, at a given time interval, the training dataset will incorporate the newly changed characteristics of each user group. C n e w , is updated based on retraining to facilitate accurate classification while accounting for changes. This enables flexible responses and updated learning.

4. Results and Discussion

Section 4.1 describes the dataset and evaluation metrics used in this study. Section 4.2 verifies the performance improvement in an environment with a given imbalanced dataset when our framework is applied. Section 4.3 verifies how well it can respond to the trend changes if the training dataset is updated periodically.

4.1. Dataset Description and Evaluation Metrics

To validate the method proposed in this study, we used a dataset released by Rojas et al., who captured data directly for 10 days from the Universidaa del Caucau Unicauca network in 2019. The dataset comprises a total of 113 features and samples from 1249 users classified into three classes: high, medium, and low consumption.
OTT data are well-represented, and analyses were performed for a total of 56 applications, including typical OTT services (e.g., Netflix, YouTube, Twitch, and Spotify). The traffic flow was analyzed for each, and features were extracted, as shown in Table 2 [12].
The number of samples in each dataset class differed from those in real situations. There were 406 high-consumption samples, 333 medium-consumption samples, and 510 low-consumption samples, which were readjusted to balance the classes. We used an analytical approach that shows good performance, even if training is performed to reflect real-world data. We used the SMOTE method to adjust the above-described open dataset according to the proportions of an actual situation [56]. We set the number of samples for each class to 5610 for low, 566 for medium, and 812 for high.
Recall, precision, and F-measure were considered as evaluation metrics and were calculated based on true positive (TP), false positive (FP), and false negative (FN) results. In this study, data composed of three classes were classified, and we will first look at the concepts of TP, FP, and FN using examples of a high-consumption group. TP refers to the rate at which the sample belonging to the actual high class is predicted to be high. FP and FN are values indicating an error, FP indicates that a sample that actually belongs to low or medium class is incorrectly classified as high class, and FN indicates that a sample that belongs to high is incorrectly classified as low or medium class. TP, FP, and FN of medium and low classes can also be obtained in the same manner. Recall is equivalent to TP, a numerical value that indicates correct classifications. Precision is the probability of the data belonging to that class. F-measure shows the accuracy by finding the harmonic mean of the precision and recall; see Equation (7):
R e c a l l = T P T P + F N   ,       P r e c i s i o n = T P T P + F P   ,       F M e a s u r e = 2 · R e c a l l   ·   P r e c i s i o n R e c a l l + P r e c i s i o n .

4.2. Performance Comparison with Imbalanced Dataset

To compare the performance between the proposed framework and existing studies, J48-decision tree, KNN, rule-based PART, and SVM algorithms were used for comparison. As previously discussed, there are few existing studies classifying OTT consumers, and these studies derive insights by applying popular ML or deep learning algorithms targeting OTT consumers [11,12,13,45]. Therefore, in this study, we compared the performance of our proposed framework with the widely used ML techniques for performance comparison with the existing research methodologies. See Section 3.1.1 of our previous study [13] for a brief description of comparison algorithms. These were implemented using scikit-learn [57] and Weka [58]. In the case of J48, the seed was fixed to 1, and the confidence factor was set to 0.25. In the case of KNN, k was set to five; and a polynomial kernel was used for the SVM. In the case of PART, the number of folds used for pruning was set to five.
To check how much the performance declines when using an imbalanced dataset, we first compared the performance using the original and the refined dataset with a similar number of samples. Table 3 shows the performance differences. Apart from these, the accuracy increases significantly for the low consumption user group, because its proportion is large, which results in biased training toward that group. In contrast, the medium and high consumption groups showed performance drops in the unbalanced dataset compared with the refined one. In particular, the recall, which indicates whether the data belong to the pertinent group, decreases significantly in the unbalanced dataset. A drop of approximately 3–4% was observed even when the J48 algorithm was used, which resulted in the lowest drop, and a 6–10% drop was observed when the KNN and PART algorithms were used. In the case of SVM, a drop of almost 30% was observed in the high consumption group. As such, if the imbalanced dataset that reflects a real-world situation is classified using a conventional method, the classification accuracy declines for classes having small proportions. This can be a big problem for companies that need to analyze consumers and develop customized strategies.
We proposed a framework to improve the classification accuracy for imbalanced datasets encountered in real-world environments. In this section, we verify the accuracy improvement when our framework is applied. In the next section, we validate the performance improvement when retraining is implemented. We used J48, KNN, PART, and SVM algorithms, which were selected for comparison, to generate the M i of Equation (1). Their environment settings are the same as those used previously. Our framework requires an additional cost-setting, and the cost was set as follows. The cost of misclassifying the low-consumption group was set to one in all algorithms. The cost of misclassifying the medium consumption group was set to 10 for J48 and SVM algorithms, 20 for the KNN, and 15 for the PART. The cost of misclassifying the high consumption group was set to 10 for J48 and PART, and 20 for the KNN and SVM. Table 4 shows the performance of the proposed framework. All four algorithms showed a slight performance drop in the low consumption group but maintain a 96–99% level in terms of recall, because there were many samples. On the other hand, in the case of the medium and high consumption groups, the performance was low when the imbalanced dataset was used as is. However, it increased significantly when our framework was used. Most algorithms showed a recall of the mid-to-high 90% range, and in particular, the high consumption group of the SVM algorithm showed that the recall, which dropped to 66.4%, increased up to 85.6%. In Figure 2, which compares the recall between the cases of using the refined and imbalanced datasets and the case of using our framework, it is confirmed that our framework shows good performance, even in real-world situations. This means that, although the existing algorithms alone cannot properly classify the propensity of OTT consumers encountered in the real world, our proposed algorithm facilitates proper classification of data reflecting real-world situations.

4.3. Performance Comparison with the Dynamic Retraining Module

In the previous section, learning and classification were conducted under the assumption that all data were collected in advance. This assumption is easily observed in most ML-based classification studies. However, this is far from reality. Therefore, we provide a module that accommodates new retention by including the results of the previous cycle in the training data at every fixed cycle. In this section, we verify the performance of the proposed module. We divided the imbalanced dataset used in the previous section into 10 sub-datasets to reflect the changes in the OTT market environment. If each sub-dataset is assumed to contain data collected for a single day, the dataset is divided into 10 sub-datasets from days 1 to 10. Because the dataset is based on data collected over 10 days, this is a reasonable assumption. First, to check whether the conventional methods properly respond to the changes in the OTT market environment, we used the data collected on day 1 as the training data and those collected on days 2–10 as the test data to measure performance. To evaluate the performance, we measured after retraining using the data classification results of up to the previous day daily. Figure 3 shows the change in recall on each day for each group, and Figure 4 shows the change in F-measure for each day for each group.
First, recall was compared for each group, as shown in Figure 3. In the case of our proposed method, stable recall values were maintained without significant changes, even when time elapsed. However, in the case of conventional methods, the deviation was very large between different days. Even in the low consumption group with many samples, the performance was significantly different between our proposed method and that of conventional methods, and in the case of medium and high consumption groups, the recall dropped below 50% on severe days when only the conventional methods were used. This means that more than half of the consumers belonging to those groups were not correctly classified, which may have a critically adverse effect on the reliability of the analysis results. Similar trends were observed from the comparison of the F-measure for each group, as shown in Figure 4. Although our method shows a stable overall performance, the conventional methods show large deviations between different days. This means that if the conventional methods are used alone, changes in OTT trends cannot be reflected, resulting in a decreased classification accuracy. In contrast, our framework facilitates a proper response to trend changes over time.

5. Conclusions

In this study, we proposed an ML-based framework for OTT user analysis, which is an important factor for various companies in the OTT market. Specifically, we used a probability based on cost while utilizing an ML-based consumer classification method to obtain good performance even with an imbalance between user groups, which is seen in the actual OTT market environment as well. Our method showed a higher performance compared with conventional ones, even for an imbalanced dataset. Furthermore, our framework continually updated the training dataset in response to the ever-changing OTT market environment. For conventional methods, it is difficult to respond to trend changes, because the classification is performed based on pre-learned data. However, ours performs better despite the trend changes.
This study is significant in that it provides a direction to solve the problem that is easily encountered by various companies participating in the OTT market. Conventional ML-based classification studies are often conducted based on refined datasets, not datasets that can be encountered in the real world. In such cases, the accuracy may be high, but when they are used in real-world environments, the accuracy may drop, making them difficult to use for practical applications. Furthermore, extant studies often performed ML and analysis based on previously collected data without considering the constantly changing propensity of consumer behavior. However, our study can help companies analyze consumers in this environment, because our method provides stable performance in actual changing situations.
In the future, a specific methodology will be required for cost-setting when cost-based classification is performed. In this study, we conducted experiments by setting the costs higher when a larger number of errors occurred. In the future, we must consider how to systemize this and automatically select the appropriate costs. Furthermore, additional analyses are required based on a variety of OTT user data. To the best of our knowledge, the dataset used in this study is the latest open dataset specific to OTT service users. In the future, if additional open datasets are available, validation and improvements should be studied based on those sets.

Author Contributions

Conceptualization, J.C. and Y.K.; methodology, J.C. and Y.K.; software, J.C.; validation, J.C. and Y.K.; formal analysis, J.C.; investigation, J.C. and Y.K.; resources, J.C.; data curation, J.C.; writing—original draft preparation, J.C.; writing—review and editing, Y.K.; visualization, J.C.; supervision, J.C. and Y.K.; project administration, J.C.; funding acquisition, Y.K. Both authors have read and agreed to the published version of the manuscript.

Funding

This work was supported by the National Research Foundation of Korea (NRF) grant funded by the Korea government (MSIT) (No. 2020R1G1A1099559).

Institutional Review Board Statement

Not applicable.

Informed Consent Statement

Not applicable.

Data Availability Statement

Not applicable.

Conflicts of Interest

The authors declare no conflict of interest.

References

  1. Joshi, H. Digital Media: Rise of on-Demand Content; Gurgaon, Deloitte Publishing: Gurgaon, India, 2015. [Google Scholar]
  2. Federal Communications Commission. Annual Assessment of the Status of Competition in the Market for the Delivery of Video Programming. MB Docket No. 14-16. FCC 15-41. 2015. Available online: https://www.federalregister.gov/documents/2015/07/24/2015-18215/annual-assessment-of-the-status-of-competition-in-the-market-for-the-delivery-of-video-programming (accessed on 23 May 2021).
  3. Rake, R.; Gaikwad, V.; Over-the-top (OTT) Market Outlook—2027. Allied Market Research. 2020. Available online: https://www.alliedmarketresearch.com/over-the-top-services-market (accessed on 19 April 2021).
  4. von Abrams, K. The Global Media Intelligence Report. eMarketer. 2018. Available online: https://www.emarketer.com/content/global-media-intelligence-2018, (accessed on 19 April 2021).
  5. Benes, R. US Digital Video. eMarketer. 2019. Available online: https://www.emarketer.com/content/us-digital-video-2019, (accessed on 19 April 2021).
  6. Rose, J.; Zuckerman, N.; Sheerin, A.; Mank, T.; Schmitz, L.-K.L.; Cadicamo, A. Can Subscription Video Providers Hold on to Their New Customers? Boston Consulting Group. 2020. Available online: https://www.bcg.com/publications/2020/can-subscription-video-providers-hold-on-to-their-new-customers (accessed on 19 April 2021).
  7. Research and Markets. United States Over the Top (OTT) Market —Growth, Trends, Forecasts (2020–2025). 2020. Available online: https://www.researchandmarkets.com/r/e46wk0 (accessed on 19 April 2021).
  8. Sujata, J.; Sohag, S.; Tanu, D.; Chintan, D.; Shubham, P.; Sumit, G. Impact of Over the Top (OTT) Services on Telecom Service Providers. Indian J. Sci. Techn. 2015, 8, 145–160. [Google Scholar] [CrossRef]
  9. Dai, W.; Baek, J.W.; Jordan, S. Neutrality between a vertically integrated cable provider and an over-the-top video provider. J. Commun. Netw. 2016, 18, 962–974. [Google Scholar] [CrossRef]
  10. Hu, M.; Zhang, M.; Wang, Y. Why do audiences choose to keep watching on live video streaming platforms? An explanation of dual identification framework. Comput. Human Behav. 2017, 75, 594–606. [Google Scholar] [CrossRef]
  11. Rojas, J.S.; Rendon, A.; Corrales, J.C. Consumption Behavior Analysis of Over the Top Services: Incremental Learning or Traditional Methods? IEEE Access 2019, 7, 136581–136591. [Google Scholar] [CrossRef]
  12. Rojas, J.S.; Pekar, A.; Rendon, A.; Corrales, J.C. Smart User Consumption Profiling: Incremental Learning-Based OTT Service Degradation. IEEE Access 2020, 8, 207426–207442. [Google Scholar] [CrossRef]
  13. Choi, J.; Kim, Y. Time-Aware Learning Framework for Over-The-Top Consumer Classification Based on Machine- and Deep-Learning Capabilities. Appl. Sci. 2020, 10, 8476. [Google Scholar] [CrossRef]
  14. Walelgne, E.A.; Asrese, A.S.; Manner, J.; Bajpai, V.; Ott, J. Clustering and predicting the data usage patterns of geographically diverse mobile users. Comput. Netw. 2021, 187. [Google Scholar] [CrossRef]
  15. Zhao, C.; Xin, Y.; Li, X.; Yang, Y.; Chen, Y. A Heterogeneous Ensemble Learning Framework for Spam Detection in Social Networks with Imbalanced Data. Appl. Sci. 2020, 10, 936. [Google Scholar] [CrossRef] [Green Version]
  16. Westcott, K.; Loucks, J.; Downs, K.; Arkenberg, C.; Jarvis, D. Digital Media Trends Survey, 14th Edition. Deloitte. 2020. Available online: https://www2.deloitte.com/us/en/insights/industry/technology/digital-media-trends-consumption-habits-survey/summary.html/#endnote-1 (accessed on 19 April 2021).
  17. J.D. Power. New Streaming Services Cut into Netflix’s Market Share, While “The Mandalorian” Drives Disney+ Viewership. 2021. Available online: https://discover.jdpa.com/hubfs/Files/Industry%20Campaigns/TMT/New%20Streaming%20Services%20Cut%20into%20Netflixs%20Market%20Share%20While%20The%20Mandalor._.pdf (accessed on 19 April 2021).
  18. Nielsen. The Nielsen Total Audience Report: August 2020. Available online: https://www.nielsen.com/us/en/insights/report/2020/the-nielsen-total-audience-report-august-2020/ (accessed on 19 April 2021).
  19. Webb, K. Disney Plus can’t Compete with Netflix when it Comes to Original Content, but its Affordable Price and Iconic Franchises Make it a Great Value for Families. Business Insider. 2020. Available online: https://www.businessinsider.com/disney-plus-review (accessed on 19 April 2021).
  20. Spangler, T.; Littleton, C. HBO Max and HBO Have 36.3 Million Subscribers, Up 5% From End of 2019, AT&T Says. VARIETY. 2020. Available online: https://variety.com/2020/digital/news/hbo-max-subscribers-subscribers-q2-att-1234714316/ (accessed on 19 April 2021).
  21. Kim, J.; Kim, S.; Nam, C. Competitive dynamics in the Korean video platform market: Traditional pay TV platforms vs. OTT platforms. Telemat. Informat. 2016, 33, 711–721. [Google Scholar] [CrossRef]
  22. Park, E.-A. Business strategies of Korean TV players in the age of over-the-top(OTT) video service. Int. J. Commun. 2018, 12, 4646–4667. [Google Scholar]
  23. Kim, J.; Nam, C.; Ryu, M.H. IPTV vs. emerging video services: Dilemma of telcos to upgrade the broadband. Telecom. Pol. 2019, 44. [Google Scholar] [CrossRef]
  24. Kim, Y.C. Netflix May Pay for KT’s Network. The Korea Times. 2020. Available online: http://www.koreatimes.co.kr/www/tech/2020/07/133_293720.html (accessed on 19 April 2021).
  25. PWC. The Promise of 5G. 2018. Available online: https://www.pwc.com/us/en/advisory-services/publications/consumer-intelligence-series/promise-5g.pdf (accessed on 19 April 2021).
  26. Johnson, M.R.; Woodcock, J. “And Today’s Top Donator is”: How Live Streamers on Twitch.tv Monetize and Gamify Their Broadcasts. Soc. Med. Soc. 2019, 5. [Google Scholar] [CrossRef] [Green Version]
  27. Floris, A.; Ahmad, A.; Atzori, L. QoE-aware OTT-ISP Collaboration in Service Management: Architecture and Approaches. ACM Trans. Multimedia Comput. Commun. Appl. 2018, 1, 1–23. [Google Scholar] [CrossRef]
  28. Nevo, A.; Turner, J.L.; Williams, J.W. User-Based Pricing and Demand for Residential Broadband; NBER Working Paper 21321; National Bureau of Economic Research: Cambridge, MA, USA, 2015. [Google Scholar] [CrossRef]
  29. Oliveira, T.; Fiorese, A.; Sargento, S. Forecasting Over-the-Top Bandwidth Consumption Applied to Network Operators. In Proceedings of the 2018 IEEE Symposium on Computers and Communications (ISCC), Natal, Brazil, 25–28 June 2018; IEEE: Piscataway, NJ, USA, 2018; pp. 859–864. [Google Scholar] [CrossRef]
  30. Naudts, B.; Flores, M.; Mijumbi, R.; Verbrugge, S.; Serrat, J.; Colle, D. A dynamic pricing algorithm for a network of virtual resources. Int. J. Netw. Mgmt. 2017, 27, e1960. [Google Scholar] [CrossRef] [Green Version]
  31. Branch, P.; But, J. Rapid and generalized identification of packetized voice traffic flows. In Proceedings of the 37th Annual IEEE Conference on Local Computer Networks, Clearwater Beach, FL, USA, 22–25 October 2012; IEEE: Piscataway, NJ, USA, 2012; pp. 85–92. [Google Scholar] [CrossRef]
  32. Bujlow, T.; Riaz, T.; Pedersen, J.M. A method for classification of network traffic based on C5.0 Machine Learning Algorithm. In Proceedings of the 2012 International Conference on Computing, Networking and Communications (ICNC), Maui, HI, USA, 30 January–2 February 2012; IEEE: Piscataway, NJ, USA, 2012; pp. 237–241. [Google Scholar] [CrossRef] [Green Version]
  33. Yuan, R.; Li, Z.; Guan, X.; Xu, L. An SVM-based machine learning method for accurate internet traffic classification. Inf. Sys. Front. 2010, 12, 149–156. [Google Scholar] [CrossRef]
  34. Shi, H.; Li, H.; Zhang, D.; Cheng, C.; Wu, W. Efficient and robust feature extraction and selection for traffic classification. Comput. Netw. 2017, 119, 1–16. [Google Scholar] [CrossRef]
  35. Wang, P.; Lin, S.C.; Luo, M. A framework for QoS-aware traffic classification using semi-supervised machine learning in SDNs. In Proceedings of the 2016 IEEE International Conference on Services Computing (SCC), San Francisco, CA, USA, 27 June–2 July 2016; IEEE: Piscataway, NJ, USA, 2016; pp. 760–765. [Google Scholar] [CrossRef]
  36. Dong, Y.-n.; Zhao, J.-j.; Jin, J. Novel feature selection and classification of Internet video traffic based on a hierarchical scheme. Comput. Netw. 2017, 119, 102–111. [Google Scholar] [CrossRef]
  37. Bar-Yanai, R.; Langberg, M.; Peleg, D.; Roditty, L. Realtime classification for encrypted traffic. In Proceedings of the International Symposium on Experimental Algorithms, Ischia Island, Italy, 20–22 May 2010; Festa, P., Ed.; Springer: Berlin, Germany; pp. 373–385. [Google Scholar] [CrossRef]
  38. Ertam, F.; Avcı, E. A new approach for internet traffic classification: GA-WK-ELM. Measurement 2017, 95, 135–142. [Google Scholar] [CrossRef]
  39. Davis, J.J.; Foo, E. Automated feature engineering for HTTP tunnel detection. Comput. Secur. 2016, 59, 166–185. [Google Scholar] [CrossRef] [Green Version]
  40. Zhang, J.; Xiang, Y.; Zhou, W.; Wang, Y. Unsupervised traffic classification using flow statistical properties and IP packet payload. J. Comput. Sys. Sci. 2013, 79, 573–585. [Google Scholar] [CrossRef]
  41. Du, Y.; Zhang, R. Design of a method for encrypted P2P traffic identification using K-means algorithm. Telecom. Sys. 2013, 53, 163–168. [Google Scholar] [CrossRef]
  42. Lotfollahi, M.; Siavoshani, M.J.; Zade, R.S.H.; Saberian, M. Deep packet: A novel approach for encrypted traffic classification using deep learning. Soft Comput. 2020, 24, 1999–2012. [Google Scholar] [CrossRef] [Green Version]
  43. Aceto, G.; Ciuonzo, D.; Montieri, A.; Pescapé, A. Mobile encrypted traffic classification using deep learning. In Proceedings of the 2018 Network Traffic Measurement and Analysis Conference (TMA), Vienna, Austria, 26–29 June 2018; IEEE: Piscataway, NJ, USA, 2018; pp. 1–8. [Google Scholar] [CrossRef]
  44. Aceto, G.; Ciuonzo, D.; Montieri, A.; Pescapè, A. MIMETIC: Mobile encrypted traffic classification using multimodal deep learning. Comput. Netw. 2019, 165, 106944. [Google Scholar] [CrossRef]
  45. Rojas, J.S.; Gallón, Á.R.; Corrales, J.C. Personalized Service Degradation Policies on OTT Applications Based on the Consumption Behavior of Users. In Proceedings of the Computational Science and Its Applications, Melbourne, Australia, 2–5 July 2018; Springer: Cham, Switzerland, 2018; pp. 543–557. [Google Scholar] [CrossRef]
  46. Stoll, J. Netflix Subscriptions in the U.S. 2020, by Generation. Statista. 2021. Available online: https://www.statista.com/statistics/720723/netflix-members-usa-by-age-group/#statisticContainer (accessed on 19 April 2021).
  47. AppAnnie. The State of Mobile 2020 Report. 2019. Available online: https://www.appannie.com/en/go/state-of-mobile-2020/ (accessed on 19 April 2021).
  48. Li, C.; Liu, S. A comparative study of the class imbalance problem in Twitter spam detection. Concurr. Comput. 2018, 30, e4281. [Google Scholar] [CrossRef]
  49. Liu, S.; Wang, Y.; Zhang, J.; Chen, C.; Xiang, Y. Addressing the class imbalance problem in twitter spam detection using ensemble learning. Comput. Sec. 2017, 69, 35–49. [Google Scholar] [CrossRef]
  50. Yang, Q.; Wu, X. 10 challenging problems in data mining research. Int. J. Inf. Technol. Decis. Mak. 2006, 5, 597–604. [Google Scholar] [CrossRef] [Green Version]
  51. Inuwa-Dutse, I.; Liptrott, M.; Korkontzelos, I. Detection of spam-posting accounts on Twitter. Neurocomputing 2018, 315, 496–511. [Google Scholar] [CrossRef]
  52. Kudugunta, S.; Ferrara, E. Deep neural networks for bot detection. Inform. Sci. 2018, 467, 312–322. [Google Scholar] [CrossRef] [Green Version]
  53. Sze-To, A.; Wong, A.K. A weight-selection strategy on training deep neural networks for imbalanced classification. In Proceedings of the International Conference Image Analysis and Recognition, Montreal, QC, Canada, 5–7 July 2017; Karray, F., Campilho, A., Cheriet, F., Eds.; Springer: Cham, Switzerland, 2017; pp. 3–10. [Google Scholar] [CrossRef]
  54. Domingos, P. Metacost: A general method for making classifiers cost-sensitive. In Proceedings of the 5th ACM SIGKDD International Conference on Knowledge Discovery and Data Mining, San Diego, CA, USA, 15–18 August 1999; pp. 155–164. [Google Scholar]
  55. Chen, C.; Zhang, J.; Xiang, Y.; Zhou, W. Asymmetric self-learning for tackling twitter spam drift. In Proceedings of the 2015 IEEE Conference on Computer Communications Workshops (INFOCOM WKSHPS), Hong Kong, China, 26 April–1 May 2015; IEEE: Piscataway, NJ, USA, 2015; pp. 208–213. [Google Scholar] [CrossRef]
  56. Chawla, N.V.; Bowyer, K.W.; Hall, L.O.; Kegelmeyer, W.P. SMOTE: Synthetic minority over-sampling technique. J. AI Res. 2002, 16, 321–357. [Google Scholar] [CrossRef]
  57. Pedregosa, F.; Varoquaux, G.; Gramfort, A.; Michel, V.; Thirion, B.; Grisel, O.; Blondel, M.; Prettenhofer, P.; Weiss, R.; Dubourg, V.; et al. Scikit-learn: Machine learning in Python. J. Mach. Learn. Res. 2011, 12, 2825–2830. [Google Scholar]
  58. Eibe, F.; Hall, M.A.; Witten, I.H.; Kaufmann, M. The WEKA workbench. Online appendix. In Data Mining: Practical Machine Learning Tools and Techniques, 4th ed.; Morgan Kaufmann: Burlington, VT, USA, 2016. [Google Scholar]
Figure 1. Modules of the proposed framework.
Applsci 11 04783 g001
Figure 2. Comparison of recall between different user groups: (a) low consumption users; (b) medium consumption users; (c) high consumption users.
Applsci 11 04783 g002
Figure 3. Change of recall on each for each user group: (a) low consumption users; (b) medium consumption users; (c) high consumption users.
Applsci 11 04783 g003
Figure 4. Change of F-measure on each day for each user group: (a) low consumption users; (b) medium consumption users; (c) high consumption users.
Applsci 11 04783 g004
Table 1. Asymmetric misclassification cost matrix.
Actual HighActual MediumActual Low
Predicted High C ( h ,   h ) C ( m ,   h ) C ( l ,   h )
Predicted Medium C ( h , m ) C ( m , m ) C ( l , m )
Predicted Low C ( h , l ) C ( m , l ) C ( l , l )
Table 2. Feature description.
Feature NameFeature Description
src_ip_numericDecimal representation of the IP address of the user
ApplicationName_time_occupationTime spent by the user for each OTT service
Application-Name.Flow.Bytes.Per.SecByte size used per second by the user for each OTT service
Table 3. Performance comparison between refined data and imbalanced data by ML algorithms.
ML AlgorithmsClassRefined DatasetImbalanced Dataset
RecallPrecisionF-MeasureRecallPrecisionF-Measure
J48Low0.9410.9500.9460.9920.9840.988
Medium0.9550.9330.9440.9170.9170.917
High0.9480.9550.9520.9150.9660.940
KNNLow0.9510.9330.9420.9990.9670.983
Medium0.9580.9670.9620.8520.9920.916
High0.9460.9620.9540.8630.9970.925
PARTLow0.9250.8720.8980.9910.9610.976
Medium0.8860.9050.8950.8250.9450.881
High0.9010.9580.9290.8390.9580.894
SVMLow0.9610.9650.9630.9990.9400.968
Medium0.9730.9610.9670.8430.9880.909
High0.9750.9800.9780.6640.9940.796
Table 4. Performance comparison between conventional methods and our framework in an imbalanced data environment.
ML AlgorithmsClassImbalanced DatasetOur Framework
RecallPrecisionF-MeasureRecallPrecisionF-Measure
J48Low0.9920.9840.9880.9670.9950.981
Medium0.9170.9170.9170.9720.8200.889
High0.9150.9660.9400.9680.9100.938
KNNLow0.9990.9670.9830.9970.9890.993
Medium0.8520.9920.9160.9590.9770.968
High0.8630.9970.9250.9540.9970.975
PARTLow0.9910.9610.9760.9750.9770.976
Medium0.8250.9450.8810.8890.8570.873
High0.8390.9580.8940.9030.9110.907
SVMLow0.9990.9400.9680.9960.9810.988
Medium0.8430.9880.9090.8980.9060.902
High0.6640.9940.7960.8560.9460.899
Publisher’s Note: MDPI stays neutral with regard to jurisdictional claims in published maps and institutional affiliations.

