
Evaluation of Deep Learning-Based Automatic Floor Plan Analysis Technology: An AHP-Based Assessment


Abstract
:1. Introduction
2. Background Study
2.1. Automatic Floor Plan Analysis
2.2. Technology Assessment with AHP
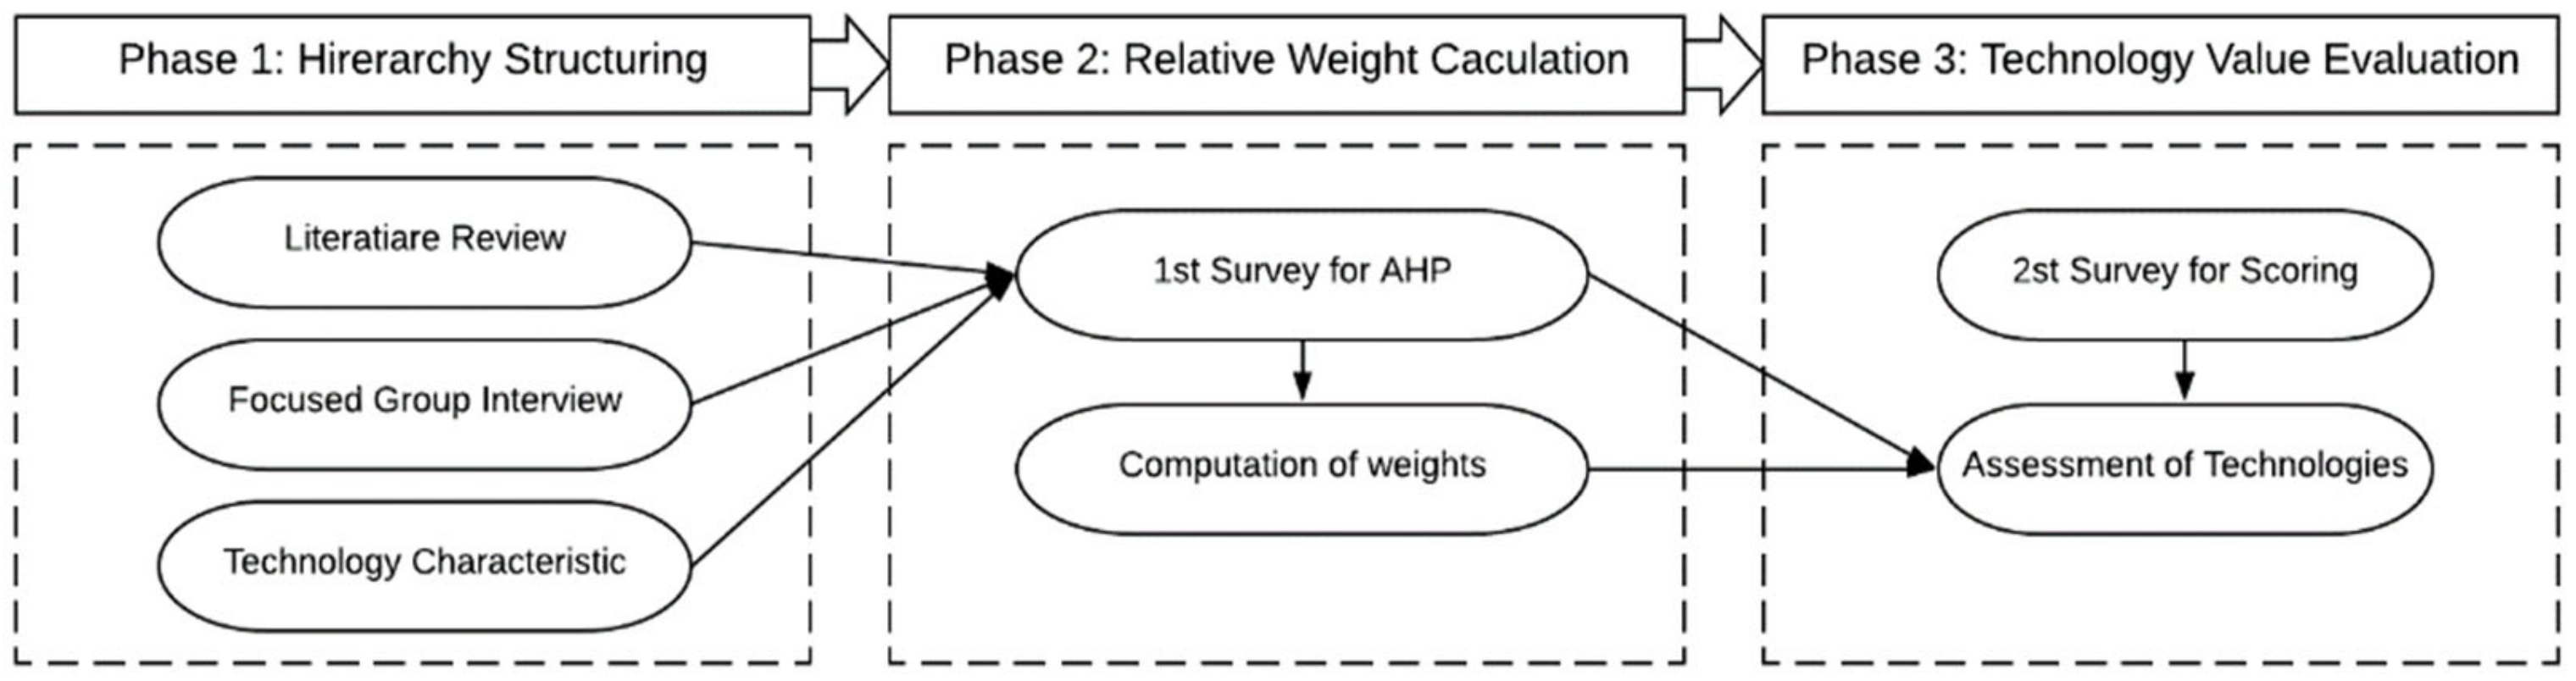
3. Research Framework
3.1. Hierarchy Structuring
3.2. Relative Weight Calculation
3.3. Technology Value Evaluation
4. Results
4.1. Process of the AHP
4.2. Relative Weight of Floor Plan Analysis Technology
4.3. Application of Relative Weights for the Evaluation of Technology Value
5. Discussion and Conclusions
Author Contributions
Funding
Conflicts of Interest
References
- Xu, D.; Jin, P.; Zhang, X.; Du, J.; Yue, L. Extracting indoor spatial objects from CAD models: A database approach. In Database Systems for Advanced Applications, Proceedings of the International Conference on Database Systems for Advanced Applications, Hanoi, Vietnam, 20–23 April 2015; Springer: Cham, Switzerland, 2015; pp. 273–279. [Google Scholar]
- Jamali, A.; Rahman, A.A.; Boguslawski, P. A hybrid 3D indoor space model. In Proceedings of the International Archives of the Photogrammetry, Remote Sensing and Spatial Information Sciences, Volume XLII-2/W1, Istanbul, Turkey, 16–17 October 2016; Volume 42, pp. 75–80. [Google Scholar]
- Jang, H.; Yu, K.; Yang, J.H. Indoor reconstruction from floorplan images with a deep learning approach. ISPRS Int. J. Geo-Inf. 2020, 9, 65. [Google Scholar] [CrossRef] [Green Version]
- Gimenez, L.; Hippolyte, J.L.; Robert, S.; Suard, F.; Zreik, K. Review: Reconstruction of 3D building information models from 2D scanned plans. J. Build. Eng. 2015, 2, 24–35. [Google Scholar] [CrossRef]
- Kim, S.; Park, S.; Kim, H.; Yu, K. Deep Floor Plan Analysis for Complicated Drawings Based on Style Transfer. J. Comput. Civ. Eng. 2021, 35, 04020066. [Google Scholar] [CrossRef]
- Bosché, F. Automated recognition of 3D CAD model objects in laser scans and calculation of as-built dimensions for dimensional compliance control in construction. Adv. Eng. Inform. 2010, 24, 107–118. [Google Scholar] [CrossRef]
- Macé, S.; Valveny, E.; Locteau, H.; Tabbone, S. A system to detect rooms in architectural floor plan images. In Proceedings of the Eighth IAPR International Workshop on Document Analysis Systems, Boston, MA, USA, 9–11 June 2010; pp. 167–174. [Google Scholar] [CrossRef]
- Ahmed, S.; Liwicki, M.; Weber, M.; Dengel, A. Improved automatic analysis of architectural floor plans. In Proceedings of the 2011 International Conference on Document Analysis and Recognition, Beijing, China, 18–21 September 2011; pp. 864–869. [Google Scholar] [CrossRef]
- Dodge, S.; Xu, J.; Stenger, B. Parsing floor plan images. In Proceedings of the 2017 Fifteenth IAPR International Conference on Machine Vision Applications (MVA), Nagoya, Japan, 8–12 May 2017; pp. 358–361. [Google Scholar] [CrossRef]
- Liu, C.; Wu, J.; Kohli, P.; Furukawa, Y. Raster-to-Vector: Revisiting Floorplan Transformation. In Proceedings of the IEEE International Conference on Computer Vision (ICCV), Venice, Italy, 22–29 October 2017; pp. 2214–2222. [Google Scholar] [CrossRef]
- Open EAIS. Available online: https://open.eais.go.kr/main/main.do (accessed on 1 April 2021).
- Lizarralde, R.; Ganzarain, J.; Zubizarreta, M. Assessment and selection of technologies for the sustainable development of an r&d center. Sustainability 2020, 12, 10087. [Google Scholar] [CrossRef]
- Fiore, P.; Sicignano, E.; Donnarumma, G. An ahp-based methodology for the evaluation and choice of integrated interventions on historic buildings. Sustainability 2020, 12, 5795. [Google Scholar] [CrossRef]
- Saaty, T.L. A scaling method for priorities in hierarchical structures. J. Math. Psychol. 1977, 15, 234–281. [Google Scholar] [CrossRef]
- Vaidya, O.S.; Kumar, S. Analytic hierarchy process: An overview of applications. Eur. J. Oper. Res. 2006, 169, 1–29. [Google Scholar] [CrossRef]
- Kurttila, M.; Pesonen, M.; Kangas, J.; Kajanus, M. Utilizing the analytic hierarchy process (AHP) in SWOT analysis—A hybrid method and its application to a forest-certification case. For. Policy Econ. 2000, 1, 41–52. [Google Scholar] [CrossRef]
- Gerdsri, N.; Kocaoglu, D.F. Applying the Analytic Hierarchy Process (AHP) to build a strategic framework for technology roadmapping. Math. Comput. Model. 2007, 46, 1071–1080. [Google Scholar] [CrossRef]
- Shen, Y.-C.; Chang, S.-H.; Lin, G.T.R.; Yu, H.-C. A hybrid selection model for emerging technology. Technol. Forecast. Soc. Chang. 2010, 77, 151–166. [Google Scholar] [CrossRef]
- Cho, J.; Lee, J. Development of a new technology product evaluation model for assessing commercialization opportunities using Delphi method and fuzzy AHP approach. Expert Syst. Appl. 2013, 40, 5314–5330. [Google Scholar] [CrossRef]
- Ordoobadi, S.M. Application of AHP and Taguchi loss functions in evaluation of advanced manufacturing technologies. Int. J. Adv. Manuf. Technol. 2013, 67, 2593–2605. [Google Scholar] [CrossRef]
- Kleindorfer, P.R.; Partovi, F.Y. Integrating manufacturing strategy and technology choice. Eur. J. Oper. Res. 1990, 47, 214–224. [Google Scholar] [CrossRef]
- Bayazit, O. Use of AHP in decision-making for flexible manufacturing systems. J. Manuf. Technol. Manag. 2005, 16, 808–819. [Google Scholar] [CrossRef] [Green Version]
- Erdogan, S.A.; Šaparauskas, J.; Turskis, Z. Decision making in construction management: AHP and expert choice approach. Procedia Eng. 2017, 172, 270–276. [Google Scholar] [CrossRef]
- Prascevic, N.; Prascevic, Z. Application of fuzzy AHP for ranking and selection of alternatives in construction project management. J. Civ. Eng. Manag. 2017, 23, 1123–1135. [Google Scholar] [CrossRef] [Green Version]
- Işik, Z.; Aladağ, H. A fuzzy AHP model to assess sustainable performance of the construction industry from urban regeneration perspective. J. Civ. Eng. Manag. 2017, 23, 499–509. [Google Scholar] [CrossRef]
- Skibniewski, M.J.; Chao, L. Evaluation of Advanced Construction Technology with AHP Method. J. Constr. Eng. Manag. 1992, 118, 577–593. [Google Scholar] [CrossRef]
- Darko, A.; Chan, A.P.C.; Ameyaw, E.E.; Owusu, E.K.; Pärn, E.; Edwards, D.J. Review of application of analytic hierarchy process (AHP) in construction. Int. J. Constr. Manag. 2019, 19, 436–452. [Google Scholar] [CrossRef]
- KISTEP. Available online: https://www.kistep.re.kr/en/ (accessed on 1 April 2021).
- Barney, J. Firm Resources and Sustained Competitive Advantage. J. Manag. 1991, 17, 99–120. [Google Scholar] [CrossRef]
- Korea Institute of Science and Technology Evaluation and Planning. Technology Valuation Program for R&D Result Diffusion; KISTEP: Chungcheongbuk-do, Korea, 2005. [Google Scholar]
- Ishizaka, A.; Labib, A. Review of the main developments in the analytic hierarchy process. Expert Syst. Appl. 2011, 38, 14336–14345. [Google Scholar] [CrossRef] [Green Version]
- Saaty, T.L.; Vargas, L.G. The Logic of Priorities: Applications of Business, Energy, Health and Transportation; Springer Science & Business Media: Dordrecht, The Netherlands, 2013; ISBN 940173383X. [Google Scholar]
- Saaty, T.L.; Kearns, K.P. Analytical Planning: The Organization of System; Elsevier: Oxford, England, 2014; Volume 7, ISBN 1483153967. [Google Scholar]


| Manual | Automatic | |
|---|---|---|
| Strengths |
|
|
| Weaknesses |
|
|
| Aspect | Criteria | Factor |
|---|---|---|
| Technology superiority | Completeness * | Technical development phase, completeness of technology, commercialization potential |
| Distinctiveness * | Novelty, originality, efficiency | |
| Applicability | Time to commercialize, scalability, scale of commercialization investment | |
| Transferability | Ease of technology transfer, cost of technology transfer, regulation of technology transfer | |
| Technology exclusivity | Legal rights | Legal rights, defense of rights, scope of rights. |
| Substitutivity * | Possibility of existence of similar technologies, possibility of new technologies to emerge | |
| Ease of technology protection | Difficulty of imitation, technology protection costs | |
| Supply and demand * | Demand from customers, supply from providers | |
| Technology constraints | Market constraints | Restrictions in the sales market, restrictions on buyers of products, restrictions on producers and sellers |
| Technical constraints | Requirement for purchasing raw materials, requirement for facility purchasing, technology improvement constraints, conformity with other technologies | |
| Social constraints | Environmental pollution possibility, social regulation, legal regulation | |
| Competitive constraints | Competitors’ responses, key success factors |
| Criteria | Factors | Definition |
|---|---|---|
| Completeness | Technical development phase | Whether the degree of completion of technology development is high |
| Completeness of technology | Whether it can be applied without complementary technology or supporting instructions | |
| Commercialization potential | Whether it is easy to commercialize the technology | |
| Distinctiveness | Novelty | Whether there are many differences from the existing technology or whether they are brand-new |
| Originality | Whether the knowledge in the technology is innovative | |
| Efficiency | Whether the developed technology is more efficient than the existing technology | |
| Substitutivity | Possibility of existence of similar technologies | Degree of unlikelihood of similar technologies existing |
| Possibility of new technologies to emerge | Degree of unlikelihood of new and replaceable technologies emerging | |
| Supply and Demand | Demand from customers | Whether there are many consumers who need the technology |
| Supply from providers | Whether there are little suppliers who have and develop the technology |
| Scale Value | Meaning |
|---|---|
| 1 | Two elements are equally important |
| 3 | One element is a little more important than the others |
| 5 | One element is distinctly more important than the others |
| 7 | One element is very more important than the others |
| 9 | One element is absolutely more important than the others |
| 2,4,6,8 | Intermediate values between two adjacent judgments |
| Category | Frequency | Rate | |
|---|---|---|---|
| Affiliation | Government and public agency | 10 | 16.39% |
| University and research institute | 37 | 60.66% | |
| Private company | 14 | 22.95% | |
| Career period | Less than 5 years | 19 | 31.15% |
| 5–10 years | 20 | 32.79% | |
| 10–20 years | 12 | 19.67% | |
| More than 20 years | 10 | 16.39% | |
| Education | Bachelor’s degree | 10 | 16.39% |
| Master’s degree | 27 | 44.26% | |
| Doctoral degree | 24 | 39.34% | |
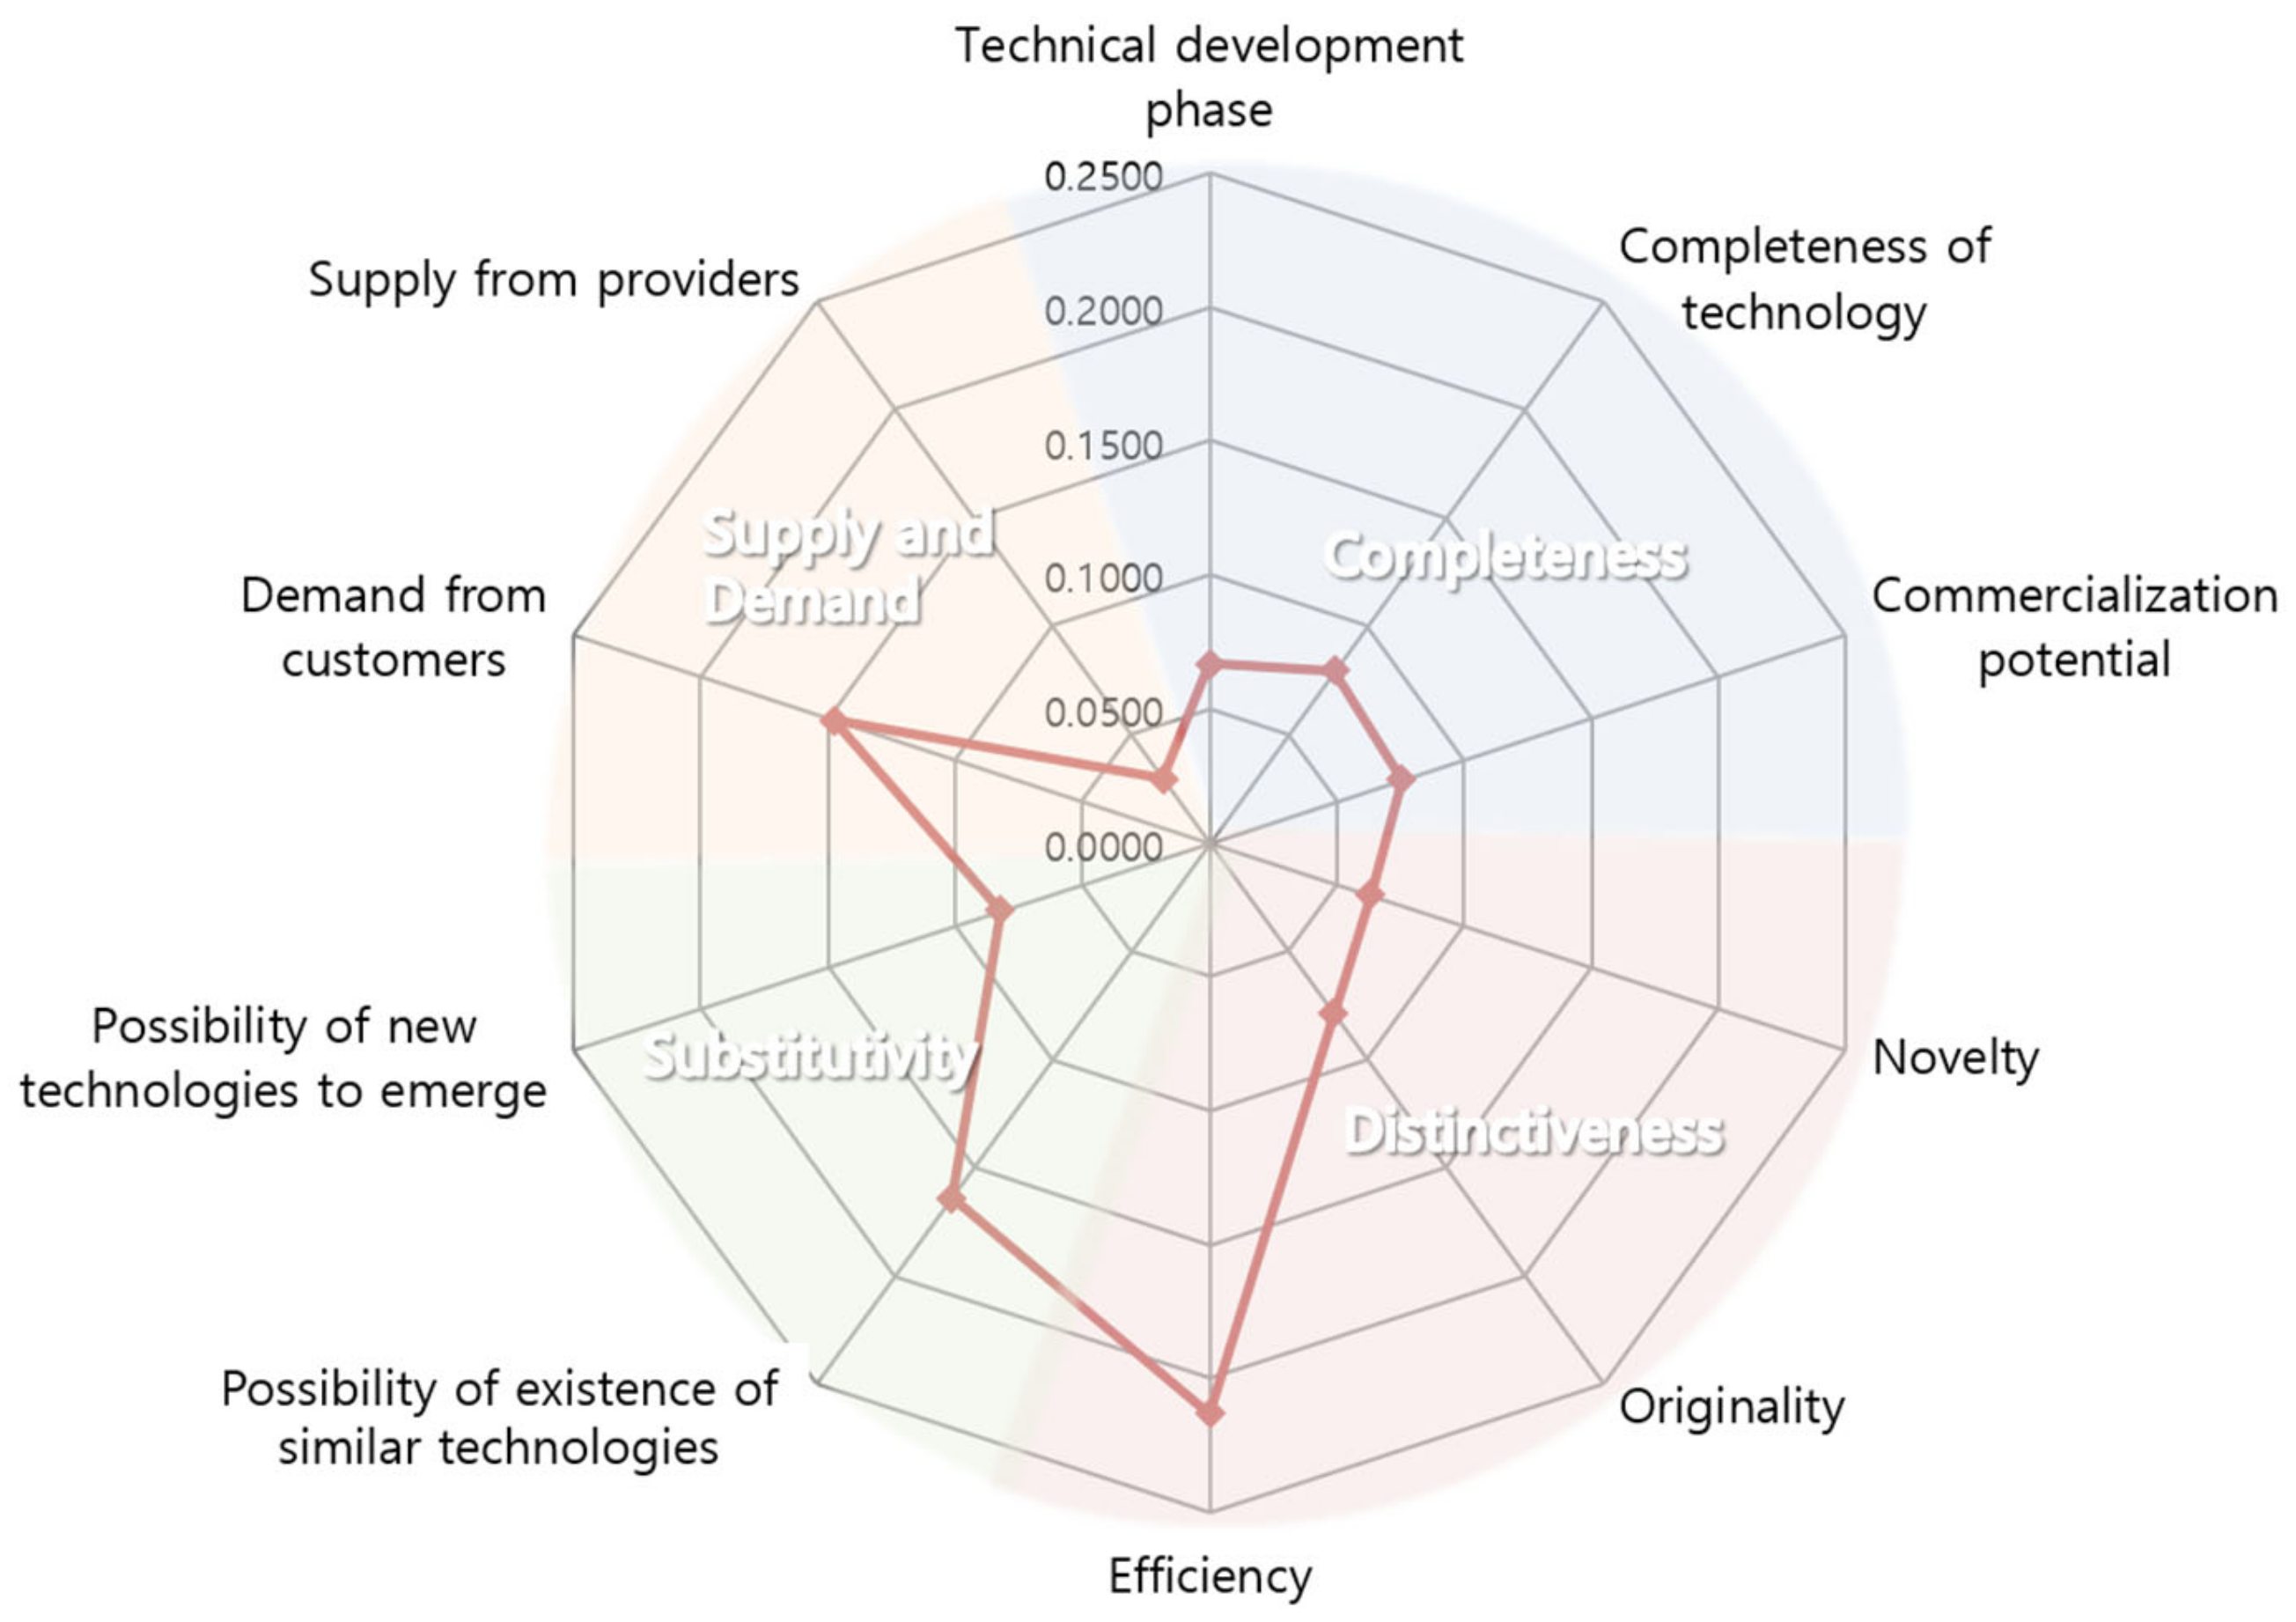
| Criteria | Importance (Rank) | Factors | Relative Importance (Rank) | Final Importance (Rank) |
|---|---|---|---|---|
| Completeness | 0.2216 (3) | Technical development phase | 0.3013 (3) | 0.0668 (8) |
| Completeness of technology | 0.3577 (1) | 0.0793 (5) | ||
| Commercialization potential | 0.3410 (2) | 0.0756 (7) | ||
| Distinctiveness | 0.3549 (1) | Novelty | 0.1777 (3) | 0.0631 (9) |
| Originality | 0.2222 (2) | 0.0789 (6) | ||
| Efficiency | 0.6001 (1) | 0.2130 (1) | ||
| Substitutivity | 0.2461 (2) | Possibility of existence of similar technologies | 0.6659 (1) | 0.1639 (2) |
| Possibility of new technologies to emerge | 0.3341 (2) | 0.0822 (4) | ||
| Supply and demand | 0.1774 (4) | Demand from customers | 0.8334 (1) | 0.1478 (3) |
| Supply from providers | 0.1666 (2) | 0.0296 (10) |
| Criteria | Factor | Manual | Automatic | Difference | Absolute Difference (Ranking) |
|---|---|---|---|---|---|
| Completeness | Technical development phase | 3.54 | 3.13 | -0.41 | 0.41 (8) |
| Completeness of technology | 3.37 | 3.15 | -0.22 | 0.22 (9) | |
| Commercialization potential | 2.94 | 4.11 | 1.17 | 1.17 (4) | |
| Distinctiveness | Novelty | 2.22 | 3.98 | 1.76 | 1.76 (1) |
| Originality | 2.35 | 3.70 | 1.35 | 1.35 (3) | |
| Efficiency | 2.50 | 4.02 | 1.52 | 1.52 (2) | |
| Substitutivity | Possibility of existence of similar technologies | 3.06 | 3.76 | 0.70 | 0.70 (5) |
| Possibility of new technologies to emerge | 3.35 | 3.56 | 0.20 | 0.20 (10) | |
| Supply and demand | Demand from customers | 3.22 | 3.93 | 0.70 | 0.70 (5) |
| Supply from providers | 2.65 | 3.17 | 0.52 | 0.52 (7) |
| Criteria | Factor | Manual | Automatic | ||||||
|---|---|---|---|---|---|---|---|---|---|
| Point | Weight | Final Value | Ratio | Point | Weight | Final Value | Ratio | ||
| Completeness (22) | Technical development phase (7) | 3.54 | 0.708 | 4.96 | 71% | 3.13 | 0.626 | 4.38 | 63% |
| Completeness of technology (8) | 3.37 | 0.674 | 5.39 | 67% | 3.15 | 0.63 | 5.04 | 63% | |
| Commercialization potential (8) | 2.94 | 0.588 | 4.70 | 59% | 4.11 | 0.822 | 6.58 | 82% | |
| 65% | 70% | ||||||||
| Distinctiveness (35) | Novelty (6) | 2.22 | 0.444 | 2.66 | 44% | 3.98 | 0.796 | 4.78 | 80% |
| Originality (8) | 2.35 | 0.47 | 3.76 | 47% | 3.70 | 0.74 | 5.92 | 74% | |
| Efficiency (21) | 2.50 | 0.5 | 10.50 | 50% | 4.02 | 0.804 | 16.88 | 80% | |
| 48% | 79% | ||||||||
| Substitutivity (25) | Possibility of existence of similar technologies (16) | 3.06 | 0.612 | 9.79 | 61% | 3.76 | 0.752 | 12.03 | 75% |
| Possibility of new technologies to emerge (8) | 3.35 | 0.67 | 5.36 | 67% | 3.56 | 0.712 | 5.70 | 71% | |
| 63% | 74% | ||||||||
| Supply and demand (18) | Demand from customers (15) | 3.22 | 0.644 | 9.66 | 64% | 3.93 | 0.786 | 11.79 | 79% |
| Supply from providers (3) | 2.65 | 0.53 | 1.59 | 53% | 3.17 | 0.634 | 1.90 | 63% | |
| 63% | 76% | ||||||||
| Total | 58.38 | 75.00 | |||||||
Publisher’s Note: MDPI stays neutral with regard to jurisdictional claims in published maps and institutional affiliations. |
© 2021 by the author. Licensee MDPI, Basel, Switzerland. This article is an open access article distributed under the terms and conditions of the Creative Commons Attribution (CC BY) license (https://creativecommons.org/licenses/by/4.0/).
Share and Cite
Kim, H. Evaluation of Deep Learning-Based Automatic Floor Plan Analysis Technology: An AHP-Based Assessment. Appl. Sci. 2021, 11, 4727. https://doi.org/10.3390/app11114727
Kim H. Evaluation of Deep Learning-Based Automatic Floor Plan Analysis Technology: An AHP-Based Assessment. Applied Sciences. 2021; 11(11):4727. https://doi.org/10.3390/app11114727
Chicago/Turabian StyleKim, Hyunjung. 2021. "Evaluation of Deep Learning-Based Automatic Floor Plan Analysis Technology: An AHP-Based Assessment" Applied Sciences 11, no. 11: 4727. https://doi.org/10.3390/app11114727
APA StyleKim, H. (2021). Evaluation of Deep Learning-Based Automatic Floor Plan Analysis Technology: An AHP-Based Assessment. Applied Sciences, 11(11), 4727. https://doi.org/10.3390/app11114727