Article

Towards Energy Efficiency in Data Centers: An Industrial Experience Based on Reuse and Layout Changes

by
Romulos da S. Machado
*,†,
Fabiano dos S. Pires
*,†,
Giovanni R. Caldeira
*,†,
Felipe T. Giuntini
*,†,
Flávia de S. Santos
*,† and
Paulo R. Fonseca
*,†
SIDIA R&D Institute, Manaus 69055-035, Brazil
*
Authors to whom correspondence should be addressed.
These authors contributed equally to this work.
Appl. Sci. 2021, 11(11), 4719; https://doi.org/10.3390/app11114719
Submission received: 6 April 2021 / Revised: 10 May 2021 / Accepted: 11 May 2021 / Published: 21 May 2021
(This article belongs to the Section Applied Industrial Technologies)

Abstract

:
Data centers are widely recognized for demanding many energy resources. The greater the computational demand, the greater the use of resources operating together. Consequently, the greater the heat, the greater the need for cooling power, and the greater the energy consumption. In this context, this article aims to report an industrial experience of achieving energy efficiency in a data center through a new layout proposal, reuse of previously existing resources, and air conditioning. We used the primary resource to adopt a cold corridor confinement, the increase of the raised floor’s height, and a better direction of the cold airflow for the aspiration at the servers’ entrance. We reused the three legacy refrigeration machines from the old data center, and no new ones were purchased. In addition to 346 existing devices, 80 new pieces of equipment were added (between servers and network assets) as a load to be cooled. Even with the increase in the amount of equipment, the implementations contributed to energy efficiency compared to the old data center, still reducing approximately 41% of the temperature and, consequently, energy-saving.

Graphical Abstract

1. Introduction

The evolution of computational resources has allowed the emergence of a set of applications in the most diverse platforms, such as web, desktop, mobile, and application contexts, such as finance management [1,2], privacy and safety [3], health [4,5], education [6], smart cities [7,8], smart homes [9], and smart things [10].
Things that could not be processed on a personal computer 20 years ago can currently be processed by a micro-chip available in a smartwatch or an appliance. Given the large set of applications, data sources, and online services, the demand for data processing and storage resources has been increasing, and there is a lack of large data centers. According to the forecast demonstrated in [11], between the years 2019 and 2025, there will be an annual increase of 2% in the global data center market, indicating (i) the increase in the construction of new data centers in super scale; (ii) growth in the acquisition of flash technology for critical applications; (iii) the adoption of alternative forms of energy; (iv) the use of 200 and 400 Gb switch ports, and (v) the increase in the use of hyper-convergent and convergent infrastructure. In [11], the authors point out that more than 100 data centers have been implemented with an energy capacity of more than 15 MW in recent years. According to the study, one of the reasons for the increase is related to the fact that telecommunications providers are investing in optimizing broadband in several locations. Another indication is that government agencies drive initiatives to develop smart cities and the digital economy’s growth.
The growing increase in data produced by applications has taken us to a level where knowledge management and massive data volume are no longer non-functional software and hardware architecture requirements. It started and was treated as a functional and essential requirement. This is particularly noteworthy with the emergence of sophisticated paradigms and innovative approaches to data organization, control, and processing, such as the publish–subscribe [12,13] and fog-computing [14] and the Apache Hadoop frameworks [15,16,17], Spark [18,19,20], Kafka [21,22], Perforce and Git [23]. Likewise, several works and architectures seek to optimize the use of computational resources and mitigate energy consumption in data centers, either by conducting changes in the local physical structure or via software-level optimizations.
As it is widely known for the state-of-the-art and industry practice, in an organization, the data center is the sector responsible for storing, processing, scaling, and managing data traffic from all sectors and applications [24,25,26]. Among the equipment involved, there is equipment that acts directly and indirectly in the processing and storage of data, such as, e.g., servers, switches, routers, and mass storage devices. It involves managing critical, confidential, and essential information for the business, ranging from sensitive customer data to the institution’s strategic planning data. Since it is directly aligned with the organization’s profitable business, the requirement for providing a service with high reliability, security, responsiveness, and real-time support is increased. Keeping each piece of equipment and components intact is essential. An untreated failure in an institution’s data center can range from a pause in receiving e-mails to a complicated and risky process of recovering corrupted data. In short, this must involve mechanisms and strategies for self-organization, replication, and redundancy, processes recognized for guaranteeing the requirements demanded, and increasing computational and energy consumption.
Likewise, the need for high availability of services and the continuous use of equipment 24 h a day, 7 days a week, also caused increases in heat generated during data processing and provision of all these services involved. Consequently, this generated the need to use specific and uninterrupted air conditioning systems, which, due to their operation, increased electricity costs even more. As stated by Yuling et al. [27], the energy cost of a data center is responsible for approximately 50% of its total operating cost. According to Song et al. [28] and Liu et al. [29], cooling systems tend to be responsible for the slice of about 40% of all energy consumed by data centers, being only behind the numbers of electrical consumption needed to power the servers, network assets, and other equipment directly linked to the operation of the systems and services. The improvement projects that bring a cost reduction of air conditioning consumption in the data center are critical success factors to better energy efficiency in environments like this, significantly if these improvements also extend equipment life without direct electrical power from the data center. It is a consensus in the literature and practice of data centers that the most impact factor in energy consumption is maintaining the temperature at adequate levels [30,31,32]. The strong dependence on temperature and energy consumption in semiconductors was demonstrated by Vanish [33] in 1967. With this, several researchers in computer science have sought to optimize the cooling in different types of hardware and technologies, e.g., processors and motherboards [34,35,36,37,38,39,40].
However, to the best of our knowledge, the studies on data center environments have provided efforts in solutions that deal with the modernization of servers, policies of optimization, or insertion of intelligent central control software. In contrast to previous studies, this article aims to investigate the following questions:
  • Is it possible to achieve better energy efficiency in data centers just by changing the equipment’s layout and taking advantage of legacy resources?
  • How to maintain the sustainable consumption of physical and energy resources in the data center despite the growing demand for processing and storage?
  • What know-how has been learned in the face of the challenges of implementing a data center in the context of tropical climate?
In order to meet the research questions above, the following methodologies were explored to achieve energy efficiency and decrease the temperature of servers and consequently all environments: (i) cold air corridor confinement technique; (ii) adjusting the position of the data centers; and (iii) downflow air insufflation (cold air circulates under the raised floor) aided by grilles with high airflow directional control. The results demonstrate a significant reduction of 46% of the temperature inside the data center, reducing from 25 to 14 °C on average, only using legacy CRACs (Computer Room Air Conditioning) and maintaining good cooling performance, with a high index of cooling. Availability and uninterrupted security, including 36 new pieces of network equipment (routers and switches), 44 new servers, and 346 previously existing ones.
Paper Outline: This work is organized as follows: Section 2 discusses the related works; Section 3 presents the data center improvements implemented; Section 4 shows and discusses the results, and finally Section 5 presents the conclusions.

2. Related Works

This section discusses the research works that implement improvements to save energy in a data center context.
Heller et al. [41], after comparing strategies to find subsets of minimum power, built a software manager named ElasticTree, a system to dynamically adapt the energy consumption of a network of the data center, which consists of three logic modules: optimizer, routing, and power control. Initially, a table test is conducted on a data traffic test basis built with Open Flow switches [42]. Subsequently, they conducted accurate tests by monitoring traffic on electronic sites. In both tests, the authors assessed the trade-offs between energy efficiency, performance, and robustness. The results demonstrated energy savings of up to 50%.
Han et al. [43] propose SAVE, a Software Defined Networks (SDN)-based solution for incorporating a Virtual Data Center (VDC) with assisted energy efficiency. The proposed solution is based on the scheme that finds ideal VDC component mappings and ideal routing paths in various data center environments to reduce energy consumption, which was 18.75%.
Song et al. [28] investigated whether airflow management and the data center location selection can affect energy consumption. In the study, the author presents a rack layout with a vertical cooling airflow. They explore two cooling systems, a computer room air conditioning cooling system and an air saver. Based on these two cooling systems, four cities were selected from data center locations worldwide. Furthermore, they implement energy efficiency metrics to cool the data center, such as energy efficiency, performance coefficient, and chiller hours. The results show that refrigeration efficiency and operating costs vary significantly with different climatic conditions, energy prices, and refrigeration technologies. The authors conclude that climatic conditions are the main factor affecting the air saver, and the maximum energy saving indicated in the study was 35%.
In [44], Ma et al. investigated the problem of incorporating virtual data centers aware of energy use. They propose a model of energy consumption, including the virtual machine node models and the virtual switch node, to measure energy consumption when incorporating a virtual data center quantitatively. In addition, using this model, they implement a heuristic algorithm and another based on particle swarm optimization. The second algorithm proved to be the best solution for the incorporation of the virtual data center. The results of the experiment show an energy saving of 11% up to 28%.
Sun et al. [45] explored deep reinforcement learning coupled with SDN to improve the energy efficiency of data center networks and ensure flow completion time. The proposed solution dynamically collects the traffic distribution of the switches to train the model. The trained model can quickly analyze complicated traffic characteristics using neural networks, produce an adaptive action to schedule flows, and deliberately configure margins for different links. After the action, the flows are consolidated into some active links and switches to save energy. The refine margin setting for active links avoids the violation of the flow completion time. According to the authors, the simulation results demonstrate energy savings of up to 12.2 % compared to the existing approaches in the experiment’s data center, such as the ElasticTree proposed by Heller et al. [41]. As the authors do not present the actual values, which compromises the comparison with other works in the literature, it is impossible to obtain a realistic estimate of the energy savings gain. Furthermore, the data center and the applications are different.
Saadi et al. [46] have proposed a model optimized for energy efficiency to reduce energy consumption and complete more tasks with greater efficiency in virtual machines in an environment of a cloud. The authors take advantage of the performance/power ratio to define upper limits for overload detection. The results point to an average energy saving of up to 21% compared to two previous approaches pointed out in the study, without compromising the applications’ requirements.
MirhoseiniNejad et al. [47] report in their study that considering the thermal effects of server workloads in conjunction with the control parameters of the cooling unit saves more energy than optimizing each one separately. For this, a low complexity holistic data center model is used that provides control decisions with refined control variables based on the thermal interactions between IT and the refrigeration unit entities. The methodology resulting in savings of 11% combining cooling and workload management.
Kaffes et al. [48] propose the PACT model to reduce energy consumption in data centers with high demands, which combines the use of two mechanisms, Turbo Control and CPU Jailing. In experiments with Google data centers, the authors showed an average of 9% energy savings regardless of workload. In addition, there was a 4% improvement in performance.
Table 1 presents the summary of related works, emphasizing the approach used and the energy-saving rate. Different from the previously mentioned works, this work aimed to report the experience of optimizing energy efficiency in a data center through the reuse of legacy equipment and the alteration of the layout.

3. Proposed Solution to Improve Cooling Efficiency

With the expansion of research and development activities, the research institution decided on a building change to meet all demands. Thus, in 2018, we started the physical construction of a new data center within the new physical location. The goal was for the data center to be adequate with the company’s operational growth of 50% and achieve the lowest possible maintenance cost. Thus, there was a need to implement measures to ensure better energy efficiency, reduced energy consumption, and less impact on the environment.
As described by Li et al. [27], there were approximately eight million data centers around the world, which consumed 416.2 terawatt-hours of electricity, equivalent to 2% of the total electricity consumed worldwide. This piece of information was one of the main reasons for making improvements in the cooling system.
Besides considering the reduction of refrigeration costs, it was necessary to consider the expected usage increase and the necessity to support as many pieces of equipment as needed for an extended period. In this way, the new refrigeration system should support complete temperature control regardless of the number of servers, without risks of auto-shutdown and equipment failures (due to high temperatures/zero downtime), that is, without causing costly impacts to the research institution.

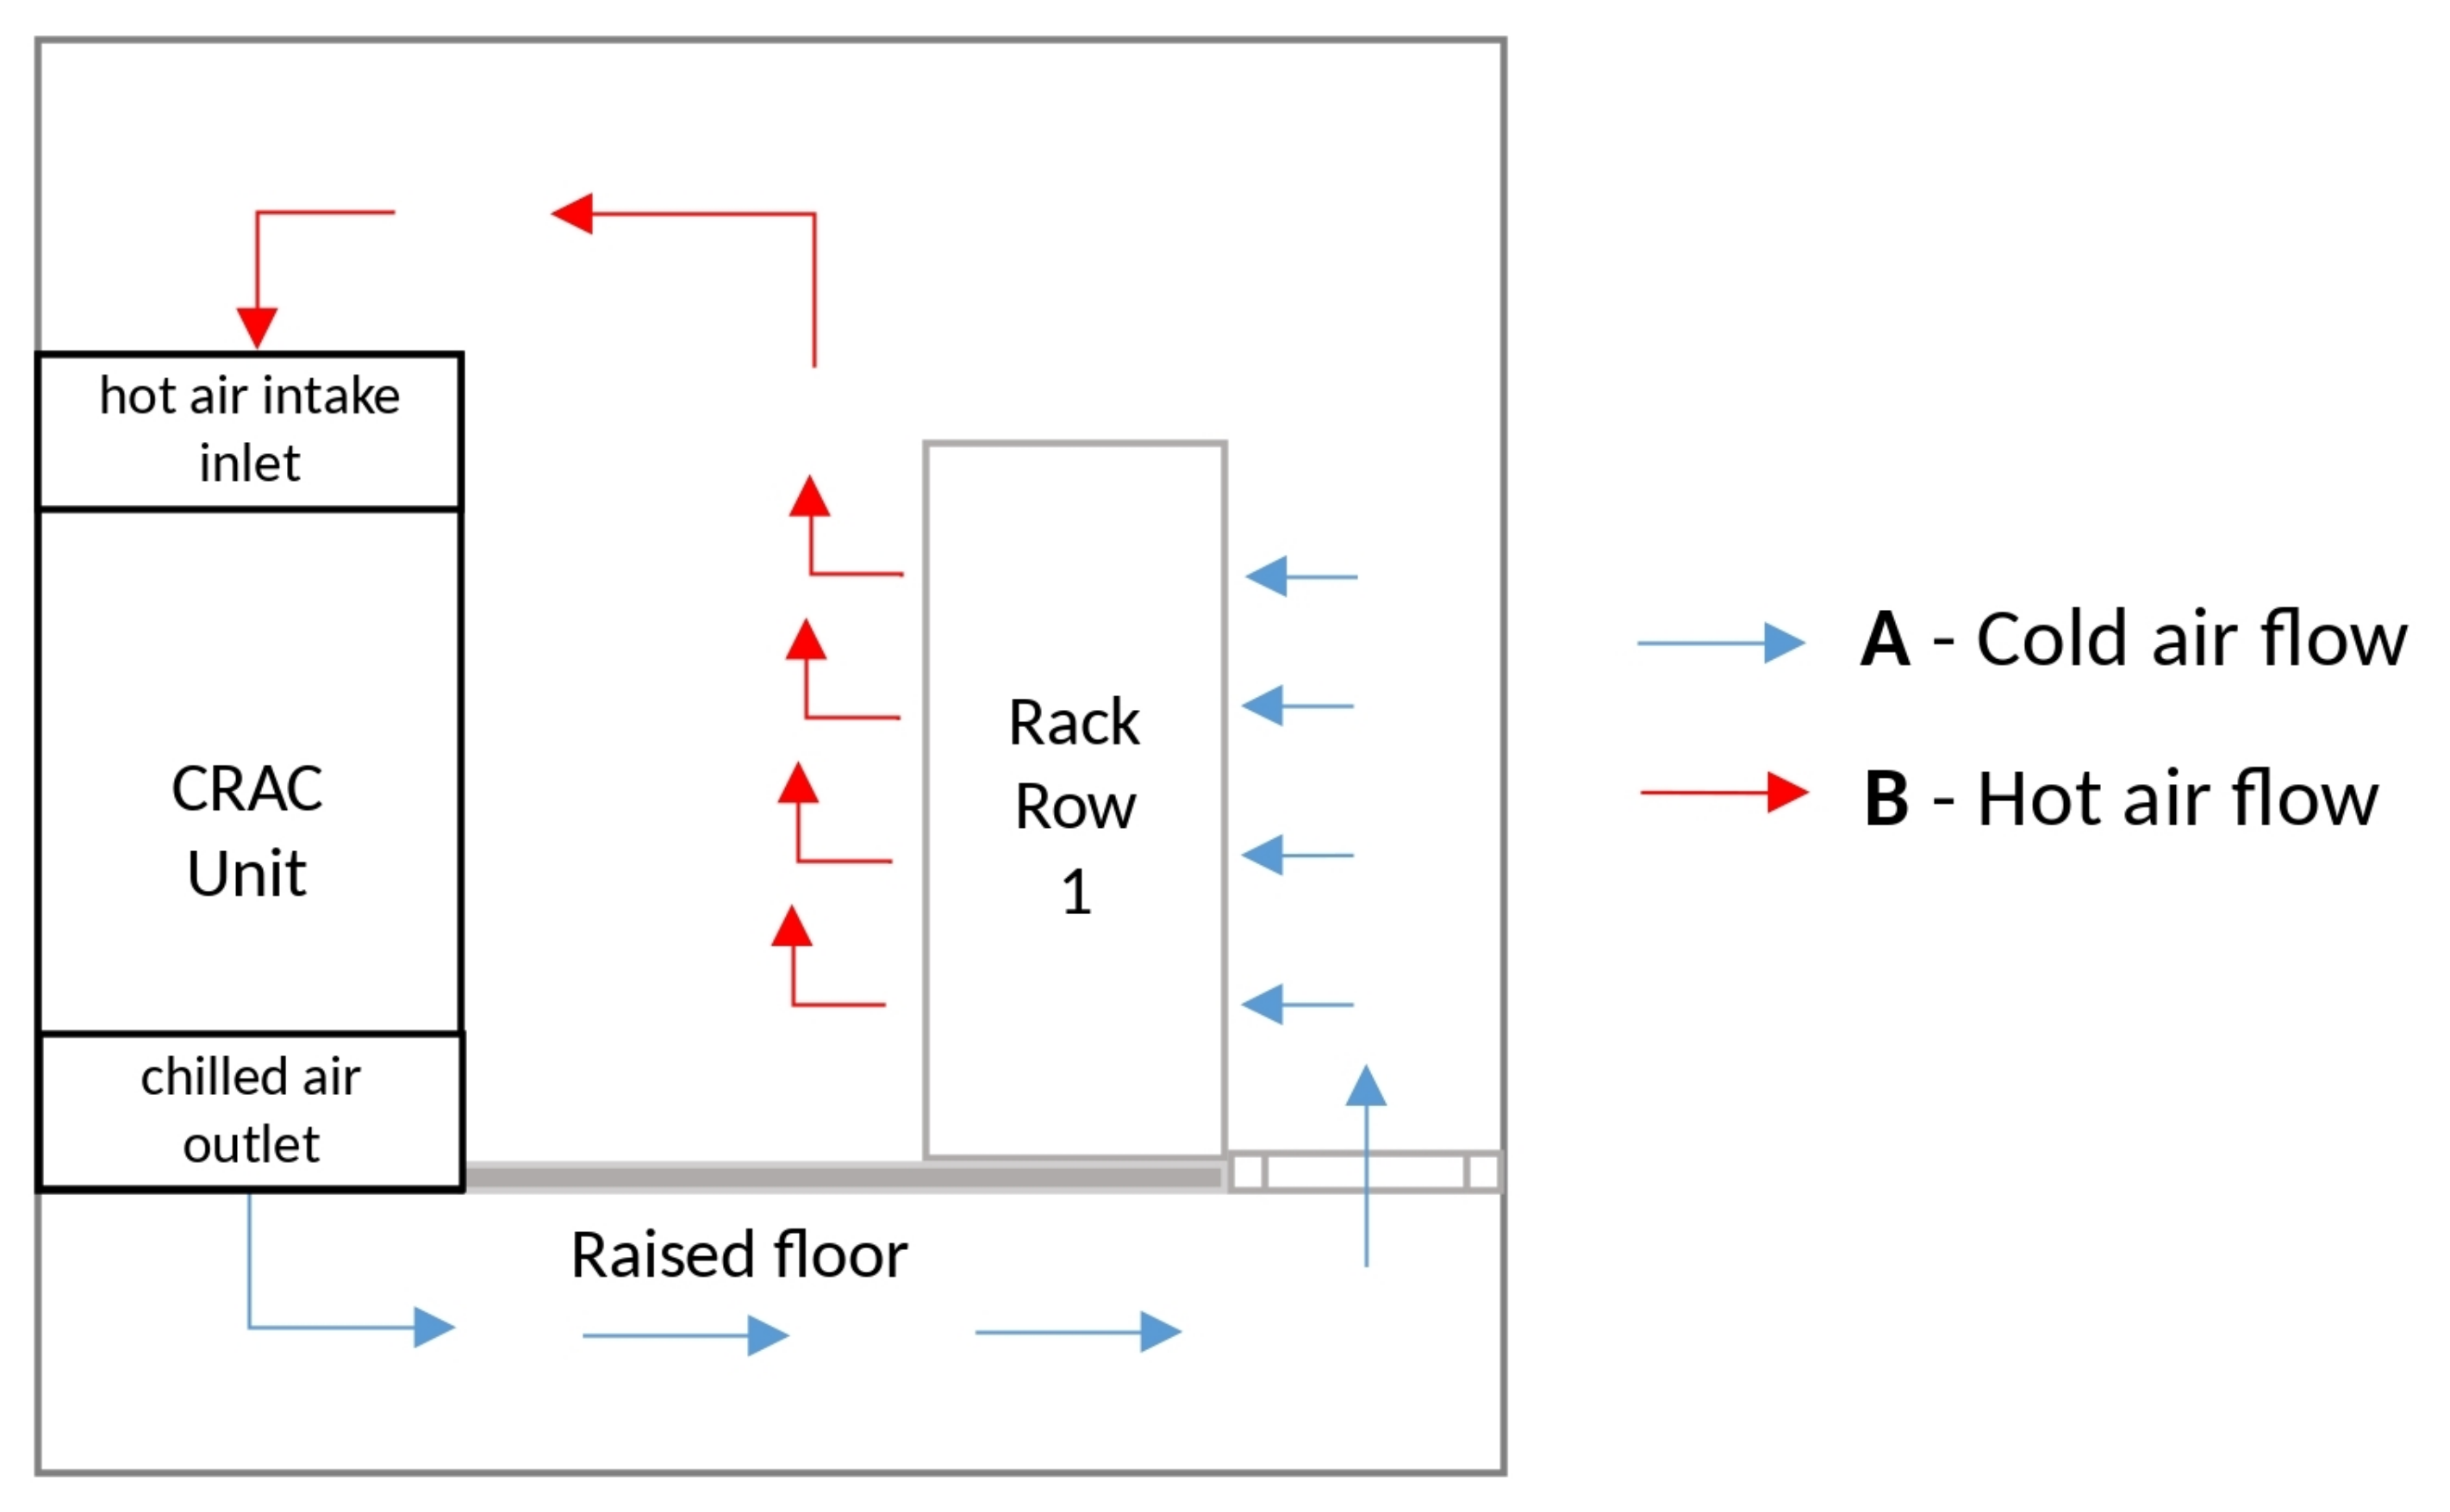
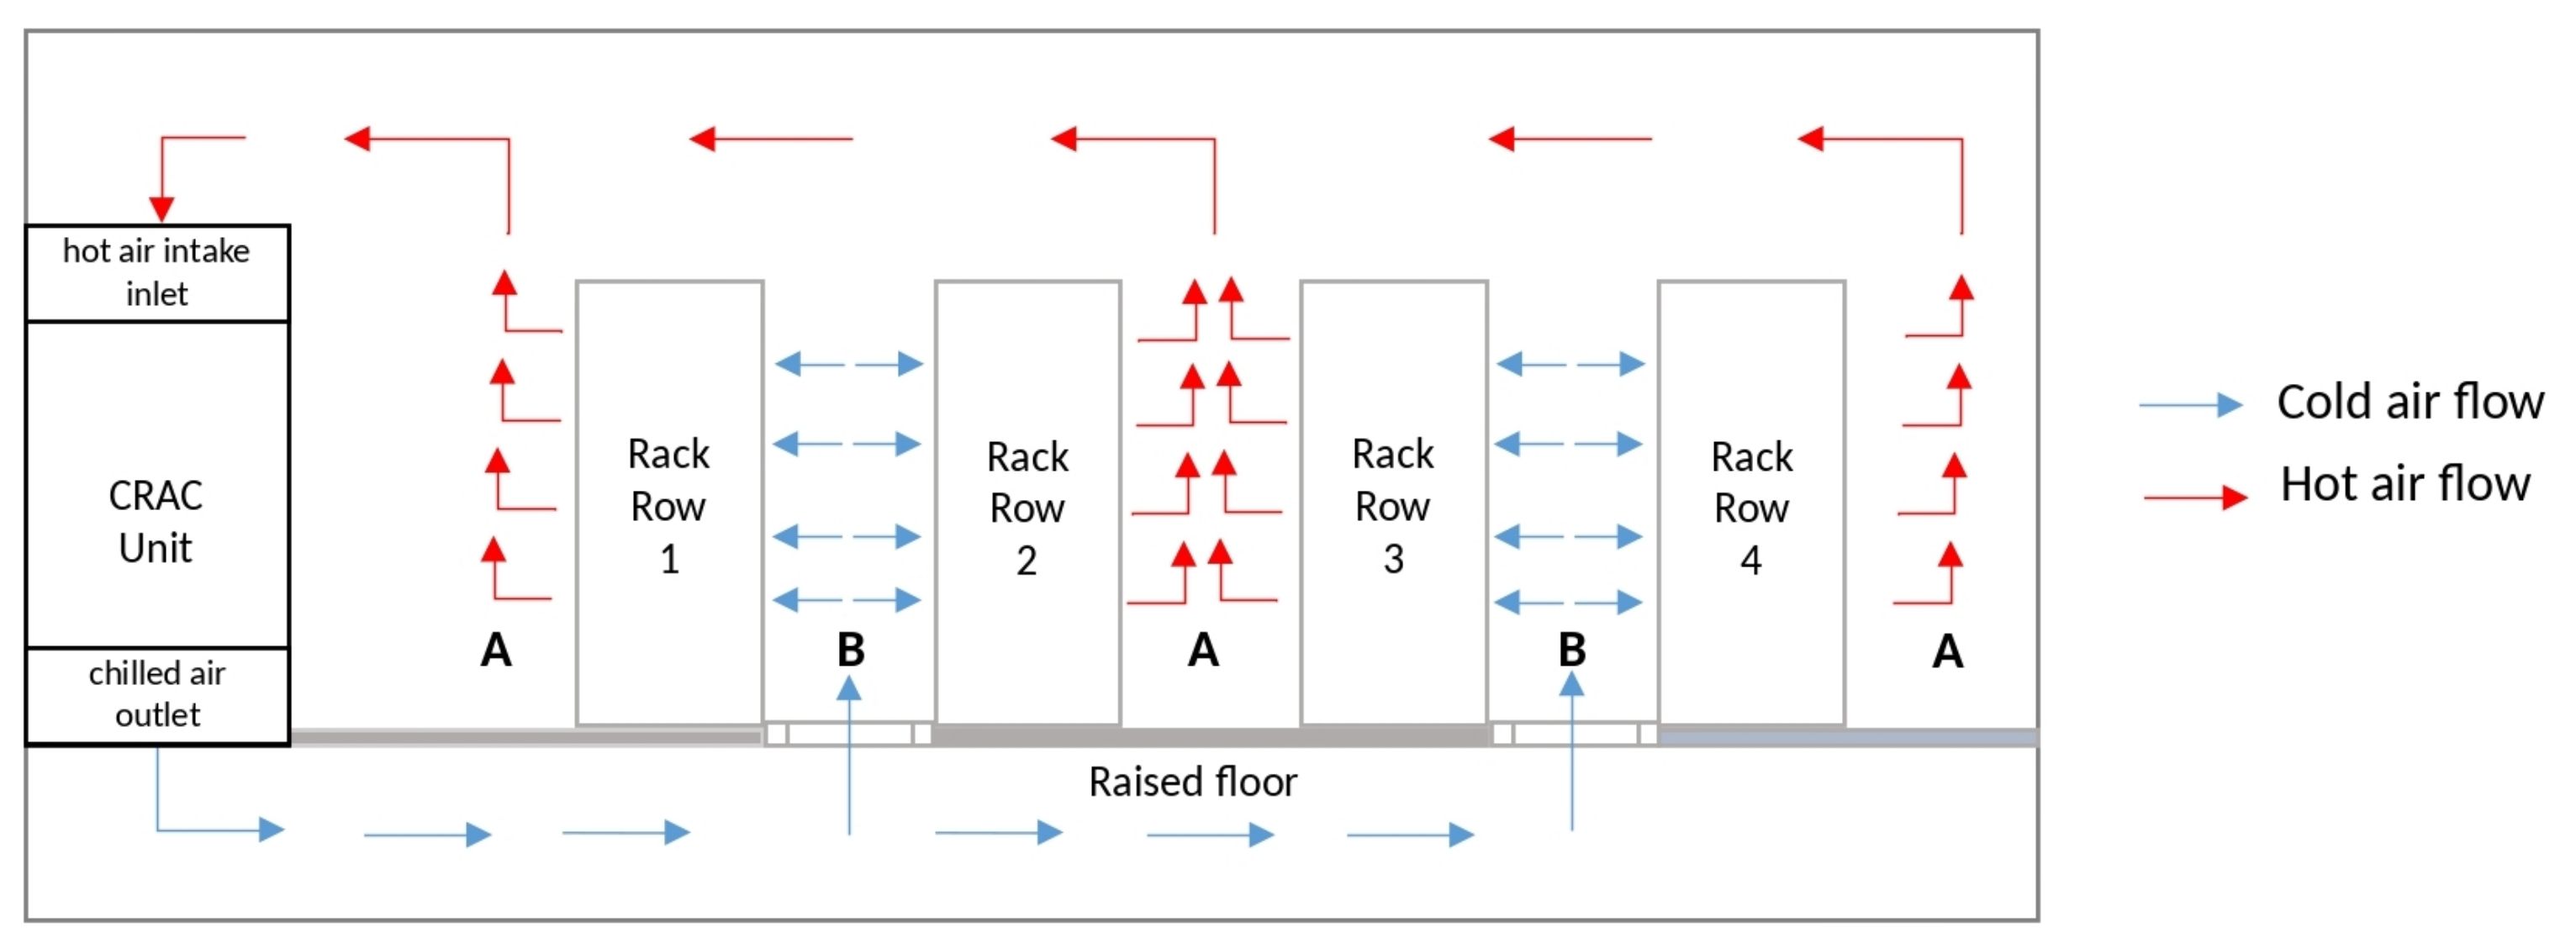
3.1. Cooling with Insufflation Downwards (DownFlow)

The DownFlow insufflation is characterized by the process of collecting the hot air generated by the data center equipment through the air inlets located at the top of the CRAC. Then, after the cooling treatment of this collected hot air, the air is returned to the environment through insufflation to the confined space below the raised floor (plenum). Due to the natural pressure created in the environment, the cold air is pushed upwards through perforated floor plates or ventilation diffusers designed for this function. Therefore, in the environment above the raised floor, cold air is available for the servers’ internal cooling fans and other equipment installed inside the racks. Once the equipment is cooled, the equipment’s exhaust systems return a warm air current that rises to the environment and is again captured by the upper inlets of the CRAC, starting a new cooling cycle. The steps of the DownFlow type inflation are shown in Figure 1.
We already used this cooling method in the old data center, entirely using 03 CRAC units (model Stultz ASD 1072 A, 30 TR), specifically prepared for this air conditioning method. However, due to the old building structural restrictions, it was only possible to install the raised floor with a height of 40 cm, which was enough to fit the passage of data and power cables. As a result, since the previous solution had three CRAC units, this allowed us to reduce the costs of adapting the new solution in the new data center and reuse the equipment, leading to savings in training costs and changes in the maintenance process.
As a factor of improving and optimizing the system, we decided to adopt 70 cm of height, with an increase of 75% in the floor elevation, taking into account the statement by IBM [49] that “the highest raised floor allows for a better balance of air conditioning in space”. Based on a study by Beitelmal [50], this height value brought us closer to the 76.2–91.4 cm height range, which is considered the best option for raised data center floors. Compared to the old setup, the main benefits are the more uniform airflow rates through the air diffuser grids, more uniform temperature at the top of the racks, and a higher uniformity of static pressure within the plenum.

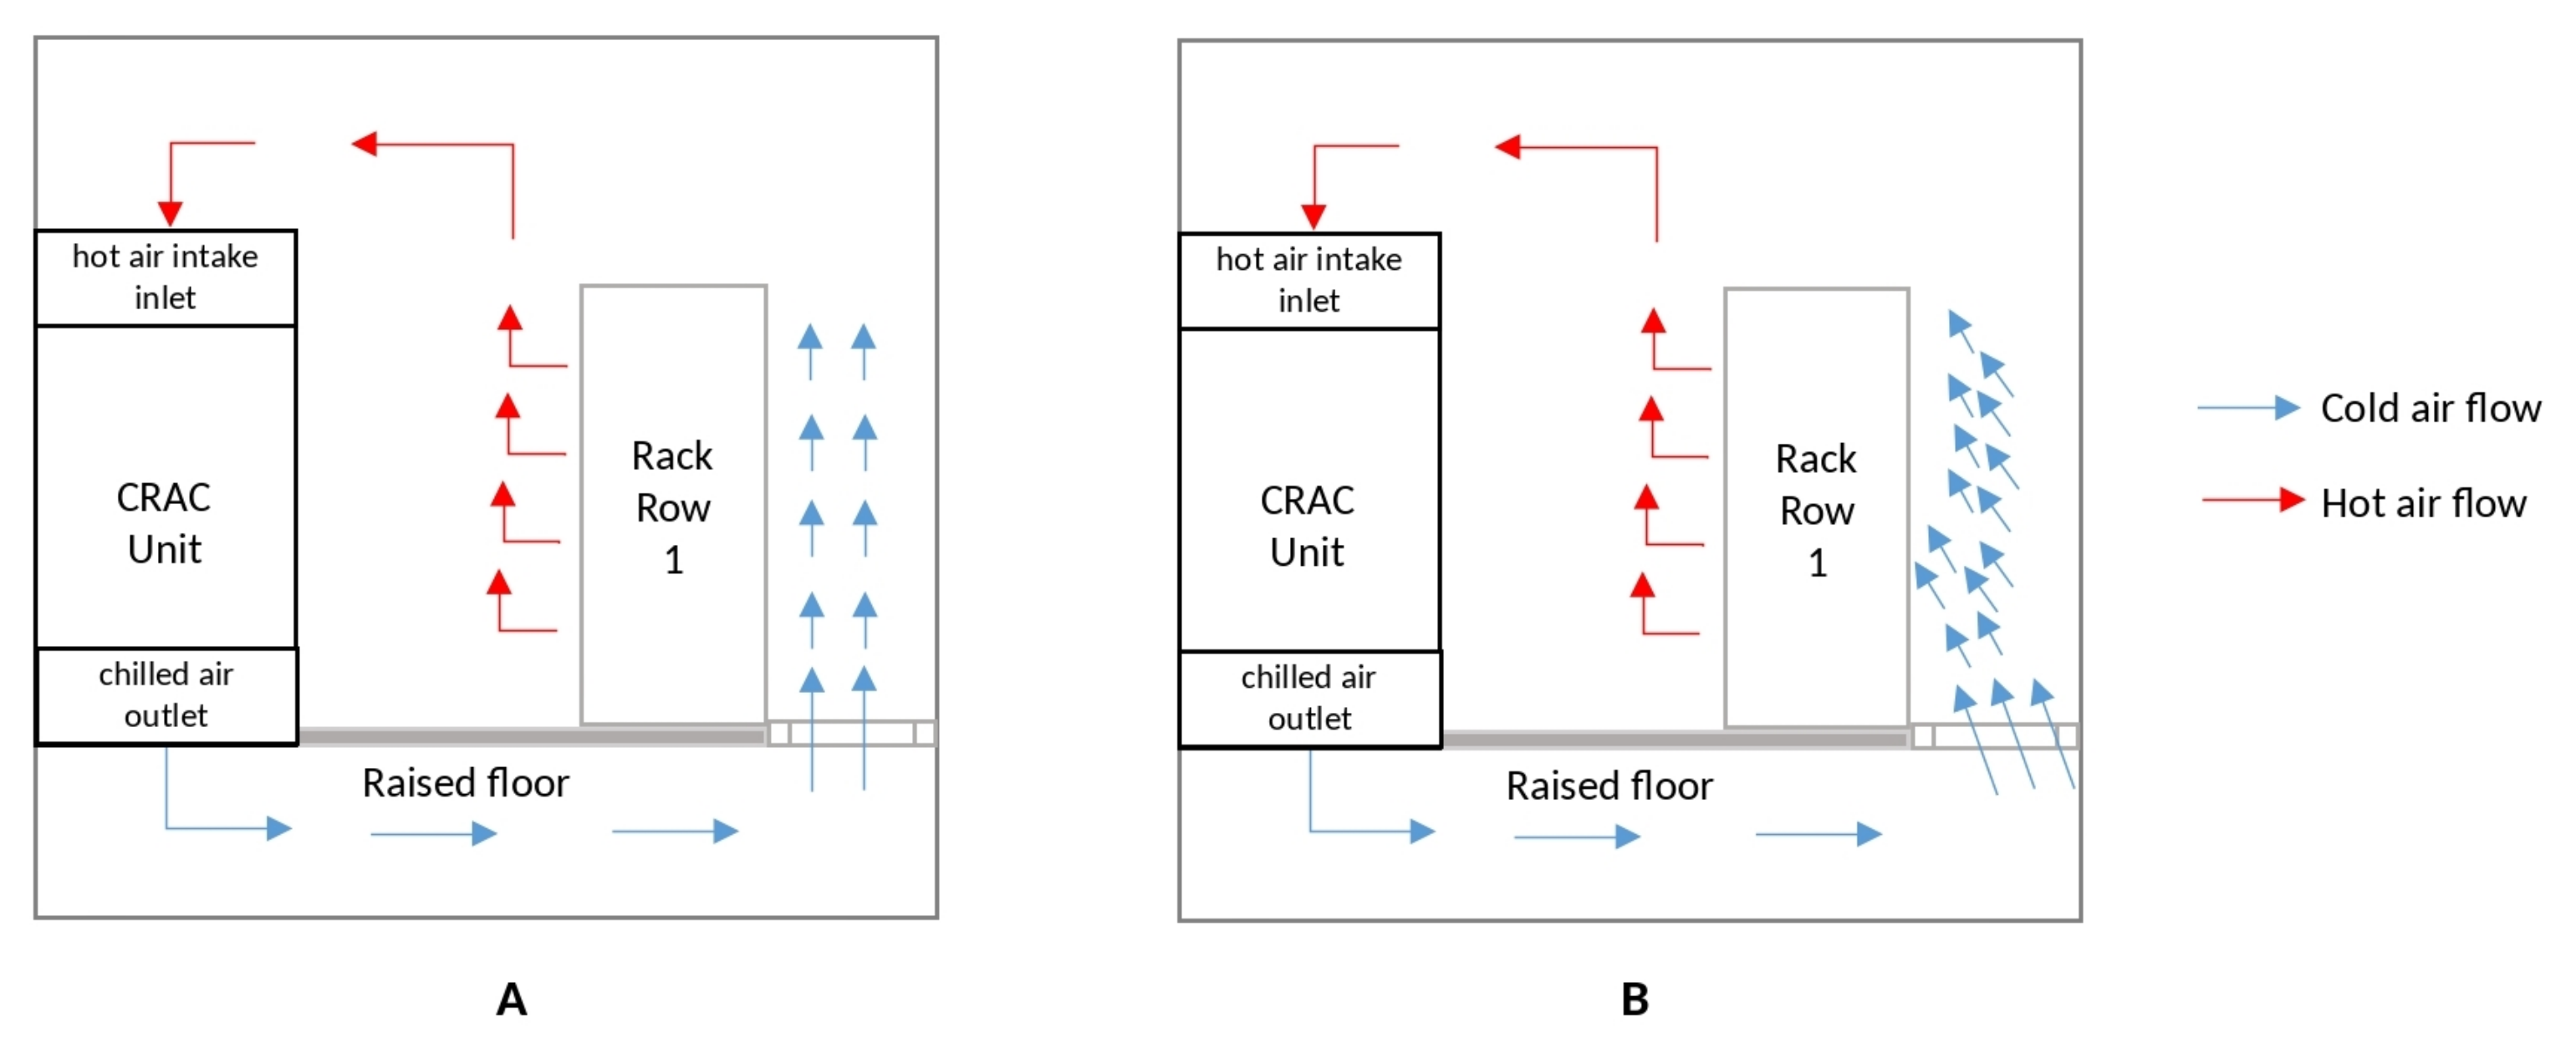
3.2. High Flow Air Diffusers

In order to implement well the DownFlow cooling system (described in the previous section), with sufficient cold air pressure coming from the plenum, it is necessary to use diffuser plates or grilles with high airflow on the raised floor to make it easier for the cold air below the raised floor to be sucked in by the equipment installed in the racks. It is important that the cooled air leaves from the plenum only through the diffuser plates or grilles in the direction of the rows of racks, preventing the cold air from escaping through other areas of the raised floor that are not to be used for the cooling process of the servers, since this waste of resources implies cooling inefficiency and consequently energy inefficiency.
In our old data center, we already used perforated plates with high airflow arranged near the rack’s entrance and the positioning of the rows of racks alternating cold aisles with hot aisles. The layout concept, where the rows of racks are positioned face to face so that there is a constant alternation between cold and hot aisles, is shown in Figure 2.
According to the study by Ni et al. [51], floors with diffusing grids that have adjustable drivers are more efficient than those without this feature. Wan et al. [52] show that integrating this type of diffusing grid with other advanced technologies can reduce the cooling cost by 30%. Thus, with bases in these studies and in the indications from refrigeration equipment suppliers [53,54], we implemented the replacement of the perforated plates (without drivers) by using high airflow diffuser grids with airflow direction control in the cooling project of the new data center. Unlike perforated plates, grids allow adjustment in the direction and have different angles to the outflow of cold air that passes through them, making the servers receive better ventilation for equipment installed in the lower and upper parts of the racks. Figure 3 shows the comparison of the difference in the direction of the cold airflow next to the racks implemented in the old and new data centers.

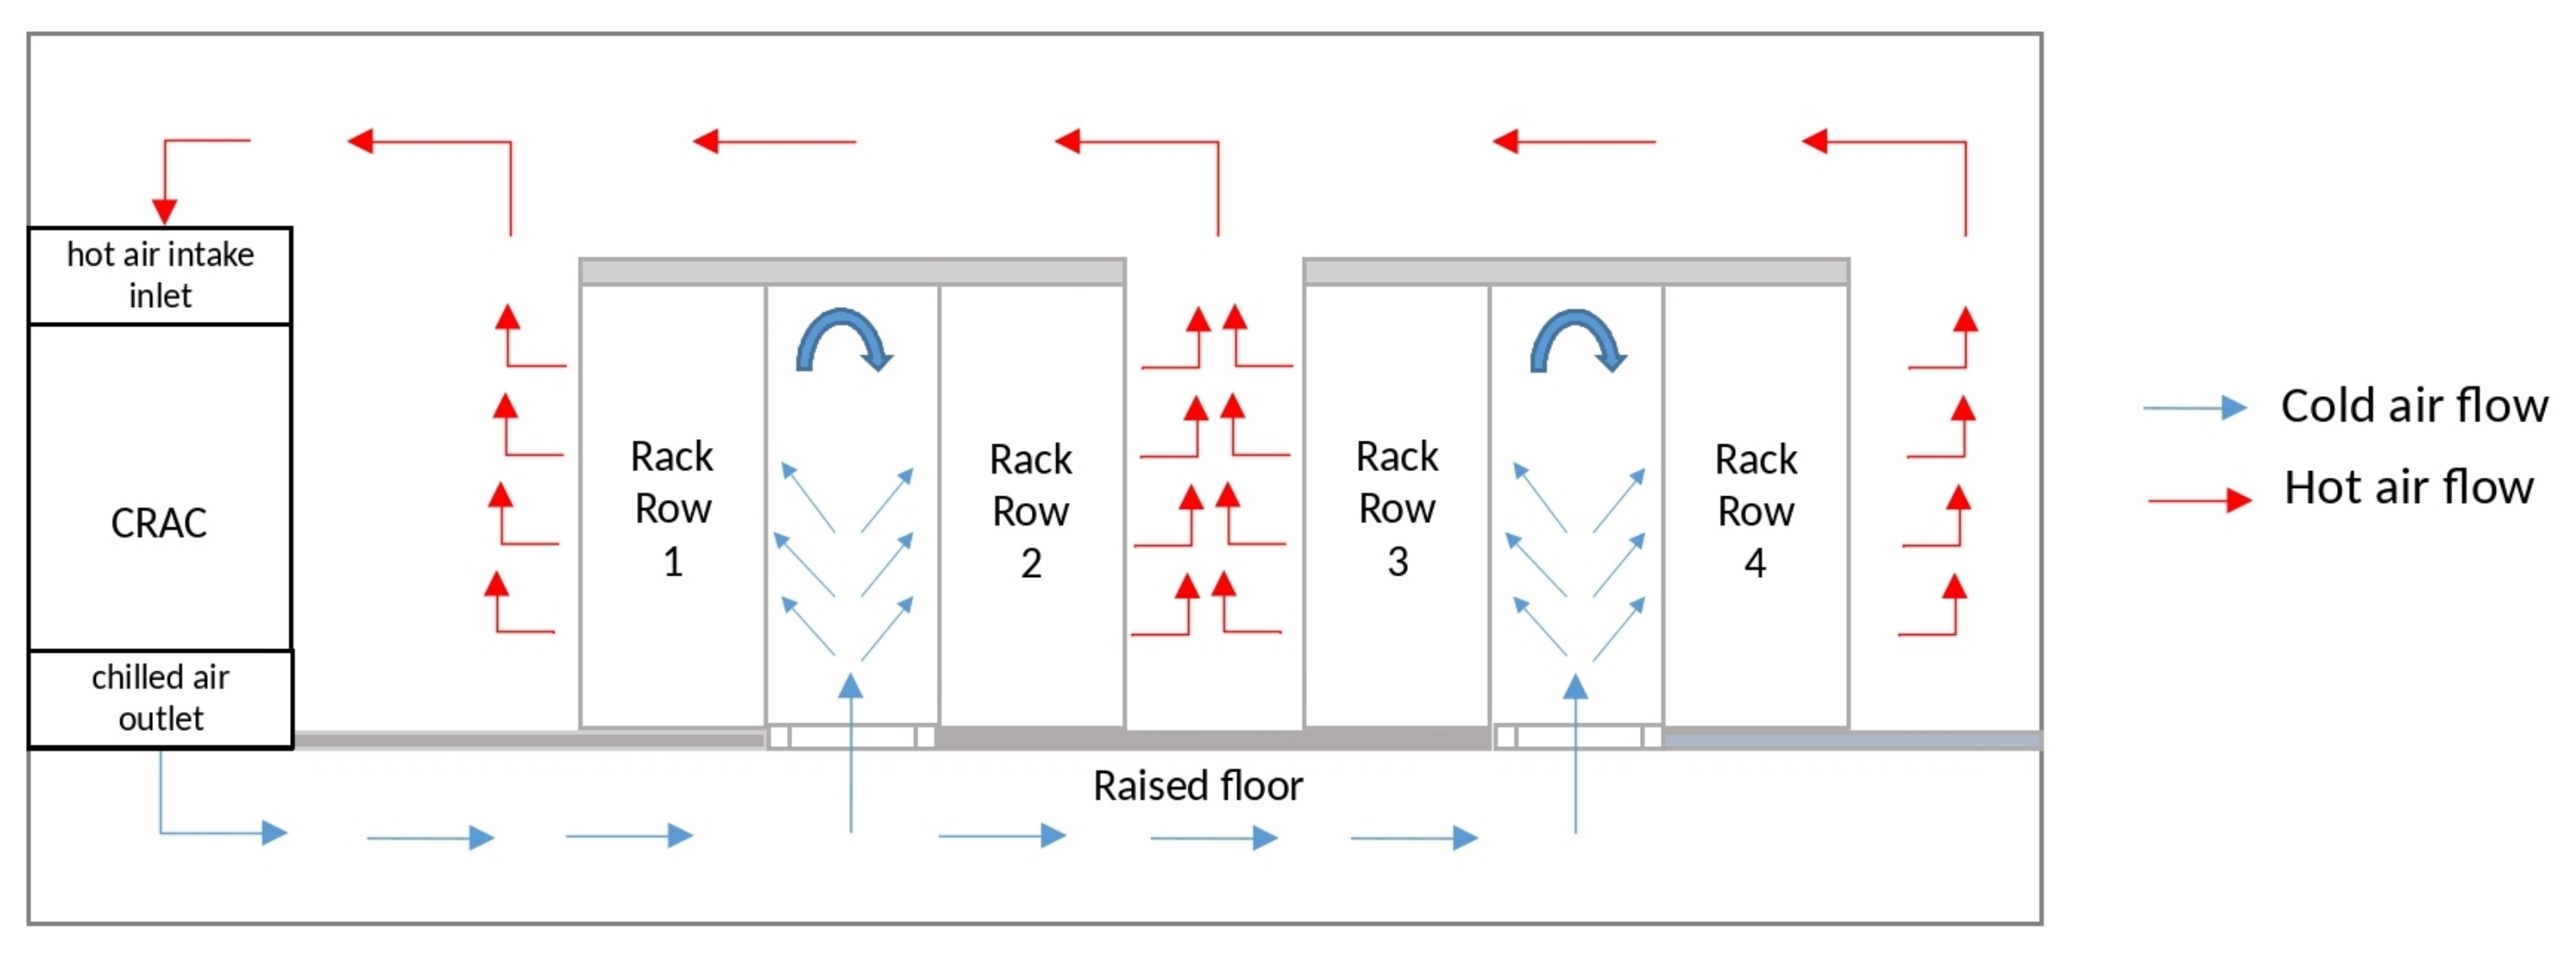
3.3. Cold Aisle Confinement

According to Lu et al. [55], the cold aisle containment system uses the method of confining the entire cold aisle of the rack row. Thus, it is possible to guarantee a greater concentration of chilled air at the front of the servers, facilitating the process of cooling and making the rest of the data center become a large open area for the return of hot air and, consequentially, having the proper separation between flows of hot and cold air. Figure 4 shows an example of cold aisle confinement.
Compared to another aisle containment option, which in this case has the main goal of containing the hot aisle, and also through the analysis of information from suppliers of climatization equipment for data centers [56], confining cold corridors has shown the following benefits:
  • Lower implementation cost —adhering to the context and the search for making the new data center construction cost planning as small as possible without compromising the quality of air conditioning;
  • Implementation simplicity—installing doors and a roof for the basic confinement of the aisle. The low implementation complexity helped to not compromise the planned schedule for putting the new data center into production;
  • Increased operating time without direct power—during an event that causes the initialization of the auxiliary power systems that supply the CRAC (e.g., generator set) to fail to start, or even an eventual delay in starting it, the confinement of the cold aisle creates an internal bank of cold air storage that provides the servers a significant additional running time before they shut down due to excessive temperature. This attribute related to this type of aisle confinement makes it possible to have greater certainty that the automated process of shutting down our 346 pieces of old equipment, added to the more 80 new ones, would have the necessary time to be completed without being compromised by the excess of heat.
We based our approach on the work of Shrivastava and Ibrahim [57], who demonstrate that a well-sealed containment system of cold aisles offers a better thermal environment for the equipment contained in the data center. Moreover, it can provide a longer dwell time in the event of a cooling failure. In this context, it is also expected that the equipment’s capacity to draw in cold air through the flow from the plenum will be amplified as long as there is an adequate sealing of the containment system.

4. Results

After 7 months of the data center’s construction, we assessed the solution’s efficiency regarding the servers’ cooling temperature control since the load to be cooled increased with the entry of more than 80 pieces of equipment. In this way, we compared the average values of inlet air temperatures recorded by servers installed in our new data center. These average values are an essential measurement parameter of the efficient cooling equipment’s study within a data center, and this efficiency directly impacts energy consumption. Fulton [58] states that the temperature of the servers’ entrance is one of the most critical points in the operation of a data center. Therefore, controlling that temperature is critical to any data center’s efficient performance.
We collected temperature data of eight high-scale processing servers, which by the nature of their activities, tend to induce high heat production (all servers are equipped with three NVIDIA Tesla V100 GPUs for data science research). These data are automatically recorded by sensors located on the motherboard of these servers and stored in an internal log. Hence, there is no interference from the operating system or any other software running on the same server.
We chose these high-scale processing servers because they are positioned at the top of the racks, approximately 178 cm away from the cold air outlet coming from the raised floor. Bearing in mind that, compared to other equipment located in lower positions of the rack, these servers tend to draw less cold air and, consequently, register higher inlet temperatures than the others.
Once the sampling elements have been defined, the set of input temperature data collected from each server is consolidated in such a way as to calculate the individual inlet temperature averages of these eight devices, considering two specific periods:
  • April 2018–April 2019—Period before moving to the new data center, from April 2018, when these servers were installed in the old data center, until April 2019, when we shut down these eight servers to change the building;
  • May 2019–January 2020—Period after the change of building, from May 2019, when we started the initialization of the eight servers already in the new data center, until January 2020, when we set the cutoff point of this study.
Table 2 shows the data extracted from the eight servers, taking into account the two periods mentioned above. We can see the temperature reduction through the analysis of the column “Average Temperature Difference (°C)”, which is a result of the comparison of the average temperature collected before and after the move to the new data center. For example, we have the GPU Server 06, which in the old environment had an inlet temperature of 28.18 °C, and in the new environment, it had 15.26 °C. For this server, there was an environmental heat suppression of approximately 46%, thus minimizing the possibility of interference from high temperatures that could be harmful to its processing performance or its general functioning.
Considering the temperature data extracted from the GPUs servers during the two periods as statistically valid samples, which represent the inlet temperature of all other servers of the data center, it is possible to verify that there was an equivalent reduction of temperature for all equipment in the new data center of approximately 41%. This implies a reduction in the cost of current cooling equipment and the possibility of adding more equipment to be refrigerated.
The temperature reduction in the new data center was achieved by reusing the same three CRACs (model Stultz ASD 1072 A, 30 TR) from the old data center, despite the addition of 36 more pieces of network equipment (routers and switches) and 44 new servers, added to the 346 pieces old equipment (servers, storage devices, network assets, and others). In the old data center, where less equipment was cooled, we used the theee CRACs simultaneously and uninterruptedly throughout the week, with no redundancy if one of the units failed, which was a problem. In contrast, after implementing the improvements in the new data center, we have worked with redundancy, rotating the CRACs weekly, so that we have one of the units in standby mode and the other two units operating simultaneously.
In order to evaluate the data center energy efficiency, we applied the Power Usage Effectiveness ( P U E ) value [59]. The ( P U E ) is defined by [59] as the total power supplied to the data center divided by the power consumed by IT equipment, defined in Equation (1). The target value is 1.0 since the lower the value (closer to 1), the better the data center’s energy efficiency index [52,60]
P U E = Total   data   center   power   consumption IT   equipment   power   consumption
We measured 473,832 kWh of power consumed by IT equipment and the value of 532,218 of total electrical power supplied to the data center. In this way, the value of the ( P U E ) obtained was: 1.123. Furthermore, we calculated the Data Center infrastructure Efficiency ( D C i E ) defined in Equation (2) and obtained 88% efficiency, i.e., the reciprocal of ( P U E ).
D C i E = 1 P U E
Compared to other companies, our results demonstrated competitive energy efficiency [60] when conducting a comparative study of ( P U E ) in data centers of different companies, e.g., Google (1.12), Facebook (1.08), Microsoft (1.12), eBay (1.45), Yahoo (1.08), HP (1.19), and others. According to [60], we would be among the 2% of the best energy-efficient data centers. It indicates that with the reuse of legacy systems, layout changes, and cooling improvements, we beat the results of other similar big companies.

5. Conclusions

This paper presents a practical approach to decrease a data center’s temperature in a technologist industry by reusing equipment and changing the servers’ layout. We obtained an average reduction of 41% in temperature. The most related work [28], which implements layout changes, reach 35% energy-efficiency with software control implementation. The other previous works applied experiments assessing the energy consumption of data centers in specific applications and reach an inferior performance compared with [28], which implements a modernization of servers. Heller et al. [41] achieved an efficiency of 50% with simulation results. Our approach achieves a result that is 6% better than Song et al. [28], with a less costly solution in terms of implementation time. Moreover, our approach has other advantages: reusing cooling and server devices and not having software changes.
In general, our work presents and discusses the industry’s point of view with a practical bias, generating instances for other companies to implement the proposed solution.
Since (a) we used a layout arrangement of our server racks, privileging the alternation between cold air corridors and hot air corridors, (b) we made use of high air diffuser grids on the entire floor of our cold air aisles, (c) we confined all the cold aisles to favor a better intake of cold air by the rack-mounted servers, and (d) reused all of our refrigeration units from our old data center, without having to purchase any new units, we highlight the following key contributions of our work:
  • Better electricity efficiency in our new data center;
  • Results of better cooling performance for old and new servers, even if geographically the new data center is located in a city with a humid tropical climate with an average temperature of 27 °C (with peaks of 37 °C).
We noticed that the combination of the implementations brought about two possible solutions:
  • Since our equipment works smoothly in the temperature range of 20–22 °C, the servers’ input temperature value and the current value measured in the environment is around 15 and 16 °C. We use this difference in such a way as to reduce the operation time of the CRACs. This would reduce electricity consumption and consequently reduce expenses;
  • The option to bring more servers into the new data center, since the refrigerated thermal load has clearance for this if we use 22 °C as the maximum input temperature limit in the cold aisles.
The first option becomes more attractive for more conservative plans that do not consider the growth of the amount of equipment housed within the data center. This is due to the fact that the feasibility will persist only if the current thermal load to be cooled remains stable, which implies not changing the current number of servers or, at most, only replacing old equipment with new ones.
The second option has advantages, in the strategic aspect, when considering the feasibility of offering physical space for new servers without compromising the data center’s cooling quality. The inclusion of new projects, which require new machines or the expansion of existing projects, is possible without burdening resources related to the data center’s cooling system.
As future work, we envision to:
  • Explore the techniques pointed out by industrial and practical related works, providing other practical experimentation results;
  • Develop a methodology to optimize the energy efficiency based on software solution;
  • Develop a new measure to evaluate the impact of the direction of the air in data centers.

Author Contributions

R.d.S.M., F.d.S.P., and G.R.C. participated in the proposal, developing the solution, and writing. F.T.G., F.d.S.S., and P.R.F. guided the research, experiments, and writing of the article. All authors have read and agreed to the published version of the manuscript.

Funding

This work was partially supported by Samsung Eletrônica da Amazônia Ltda., under the auspice of the informatics law n° 8.387/91.

Institutional Review Board Statement

Not applicable.

Informed Consent Statement

Not applicable.

Conflicts of Interest

The authors declare no conflict of interest.

References

  1. Hasan, M.M.; Popp, J.; Oláh, J. Current landscape and influence of big data on finance. J. Big Data 2020, 7, 1–17. [Google Scholar] [CrossRef]
  2. Klimek, M. Financial Optimization of the Resource-Constrained Project Scheduling Problem with Milestones Payments. Appl. Sci. 2021, 11, 661. [Google Scholar] [CrossRef]
  3. De Aguiar, E.J.; Faiçal, B.S.; Krishnamachari, B.; Ueyama, J. A Survey of Blockchain-Based Strategies for Healthcare. ACM Comput. Surv. 2020, 53. [Google Scholar] [CrossRef] [Green Version]
  4. Giuntini, F.T.; Cazzolato, M.T.; dos Reis, M.d.J.D.; Campbell, A.T.; Traina, A.J.; Ueyama, J. A review on recognizing depression in social networks: Challenges and opportunities. J. Ambient Intell. Humaniz. Comput. 2020, 11, 4713–4729. [Google Scholar] [CrossRef]
  5. Althnian, A.; AlSaeed, D.; Al-Baity, H.; Samha, A.; Dris, A.B.; Alzakari, N.; Abou Elwafa, A.; Kurdi, H. Impact of Dataset Size on Classification Performance: An Empirical Evaluation in the Medical Domain. Appl. Sci. 2021, 11, 796. [Google Scholar] [CrossRef]
  6. Fischer, C.; Pardos, Z.A.; Baker, R.S.; Williams, J.J.; Smyth, P.; Yu, R.; Slater, S.; Baker, R.; Warschauer, M. Mining Big Data in Education: Affordances and Challenges. Rev. Res. Educ. 2020, 44, 130–160. [Google Scholar] [CrossRef] [Green Version]
  7. Neto, J.R.; Boukerche, A.; Yokoyama, R.S.; Guidoni, D.L.; Meneguette, R.I.; Ueyama, J.; Villas, L.A. Performance evaluation of unmanned aerial vehicles in automatic power meter readings. Ad Hoc Netw. 2017, 60, 11–25. [Google Scholar] [CrossRef]
  8. Giuntini, F.T.; Beder, D.M.; Ueyama, J. Exploiting self-organization and fault tolerance in wireless sensor networks: A case study on wildfire detection application. Int. J. Distrib. Sens. Netw. 2017, 13, 1550147717704120. [Google Scholar] [CrossRef]
  9. Filho, G.P.R.; Meneguette, R.I.; Maia, G.; Pessin, G.; Gonçalves, V.P.; Weigang, L.; Ueyama, J.; Villas, L.A. A fog-enabled smart home solution for decision-making using smart objects. Future Gener. Comput. Syst. 2020, 103, 18–27. [Google Scholar] [CrossRef]
  10. Safara, F.; Souri, A.; Baker, T.; Al Ridhawi, I.; Aloqaily, M. PriNergy: A priority-based energy-efficient routing method for IoT systems. J. Supercomput. 2020, 76, 8609–8626. [Google Scholar] [CrossRef]
  11. Data Center Market—Global Outlook and Forecast 2020–2025. 2020. Available online: https://www.researchandmarkets.com/reports/4986841/data-center-market-global-outlook-and-forecast (accessed on 29 April 2021).
  12. Salehi, P.; Zhang, K.; Jacobsen, H.A. On Delivery Guarantees in Distributed Content-Based Publish/Subscribe Systems. In Middleware ’20, Proceedings of the 21st International Middleware Conference, Delft, The Netherlands, 7–11 December 2020; Association for Computing Machinery: New York, NY, USA, 2020; pp. 61–73. [Google Scholar] [CrossRef]
  13. Hasenburg, J.; Stanek, F.; Tschorsch, F.; Bermbach, D. Managing Latency and Excess Data Dissemination in Fog-Based Publish/Subscribe Systems. In Proceedings of the 2020 IEEE International Conference on Fog Computing (ICFC), Sydney, NSW, Australia, 21–24 April 2020; pp. 9–16. [Google Scholar] [CrossRef]
  14. Pereira Rocha Filho, G.; Yukio Mano, L.; Demetrius Baria Valejo, A.; Aparecido Villas, L.; Ueyama, J. A Low-Cost Smart Home Automation to Enhance Decision-Making based on Fog Computing and Computational Intelligence. IEEE Lat. Am. Trans. 2018, 16, 186–191. [Google Scholar] [CrossRef]
  15. Shvachko, K.; Kuang, H.; Radia, S.; Chansler, R. The hadoop distributed file system. In Proceedings of the 2010 IEEE 26th Symposium on Mass Storage Systems and Technologies (MSST), Incline Village, NV, USA, 3–7 May 2010; pp. 1–10. [Google Scholar]
  16. Widodo, R.N.S.; Abe, H.; Kato, K. HDRF: Hadoop data reduction framework for hadoop distributed file system. In Proceedings of the 11th ACM SIGOPS Asia-Pacific Workshop on Systems, Tsukuba, Japan, 24–25 August 2020; pp. 122–129. [Google Scholar]
  17. Elkawkagy, M.; Elbeh, H. High Performance Hadoop Distributed File System. Int. J. Netw. Distrib. Comput. 2020, 8, 119–123. [Google Scholar] [CrossRef]
  18. Salloum, S.; Dautov, R.; Chen, X.; Peng, P.X.; Huang, J.Z. Big data analytics on Apache Spark. Int. J. Data Sci. Anal. 2016, 1, 145–164. [Google Scholar] [CrossRef] [Green Version]
  19. Dagdia, Z.C.; Zarges, C.; Beck, G.; Lebbah, M. A distributed rough set theory based algorithm for an efficient big data pre-processing under the spark framework. In Proceedings of the 2017 IEEE International Conference on Big Data (Big Data), Boston, MA, USA, 11–14 December 2017; pp. 911–916. [Google Scholar]
  20. Jianpeng, H.; Xiyang, J.; Yifei, T.; Feng, G. Research of elevator real time monitoring method based on spark. Mater. Sci. Eng. 2020, 758, 012078. [Google Scholar] [CrossRef]
  21. Ichinose, A.; Takefusa, A.; Nakada, H.; Oguchi, M. A study of a video analysis framework using Kafka and spark streaming. In Proceedings of the 2017 IEEE International Conference on Big Data (Big Data), Boston, MA, USA, 11–14 December 2017; pp. 2396–2401. [Google Scholar]
  22. Hiraman, B.R.; Viresh, M.C.; Abhijeet, C.K. A study of Apache Kafka in big data stream processing. In Proceedings of the 2018 International Conference on Information Communication, Engineering and Technology (ICICET), Pune, India, 29–31 August 2018; pp. 1–3. [Google Scholar]
  23. De Alwis, B.; Sillito, J. Why are software projects moving from centralized to decentralized version control systems? In Proceedings of the 2009 ICSE Workshop on Cooperative and Human Aspects on Software Engineering, Vancouver, BC, Canada, 17 May 2009; pp. 36–39. [Google Scholar]
  24. Correa, E.S.; Fletscher, L.A.; Botero, J.F. Virtual Data Center Embedding: A Survey. IEEE Lat. Am. Trans. 2015, 13, 1661–1670. [Google Scholar] [CrossRef]
  25. Jiadi, L.; Yang, H.; Huan, L.; Xinli, Z.; WenJing, L. Research on Data Center Operation and Maintenance Management Based on Big Data. In Proceedings of the 2020 International Conference on Computer Engineering and Application (ICCEA), Guangzhou, China, 18–20 March 2020; pp. 124–127. [Google Scholar] [CrossRef]
  26. Rocha, E.; Leoni Santos, G.; Endo, P.T. Analyzing the impact of power subsystem failures and checkpoint mechanisms on availability of cloud applications. IEEE Lat. Am. Trans. 2020, 18, 138–146. [Google Scholar] [CrossRef]
  27. Li, Y.; Wang, X.; Luo, P.; Pan, Q. Thermal-aware hybrid workload management in a green datacenter towards renewable energy utilization. Energies 2019, 12, 1494. [Google Scholar] [CrossRef] [Green Version]
  28. Song, Z.; Zhang, X.; Eriksson, C. Data center energy and cost saving evaluation. Energy Proc. 2015, 75, 1255–1260. [Google Scholar] [CrossRef] [Green Version]
  29. Liu, L.; Zhang, Q.; Zhai, Z.J.; Yue, C.; Ma, X. State-of-the-art on thermal energy storage technologies in data center. Energy Build. 2020, 226, 110345. [Google Scholar] [CrossRef]
  30. Patterson, M.K. The effect of data center temperature on energy efficiency. In Proceedings of the 2008 11th Intersociety Conference on Thermal and Thermomechanical Phenomena in Electronic Systems, Orlando, FL, USA, 28–31 May 2008; pp. 1167–1174. [Google Scholar] [CrossRef] [Green Version]
  31. Han, J.W.; Zhao, C.J.; Yang, X.T.; Qian, J.P.; Fan, B.L. Computational modeling of airflow and heat transfer in a vented box during cooling: Optimal package design. Appl. Therm. Eng. 2015, 91, 883–893. [Google Scholar] [CrossRef]
  32. Prabha, B.; Ramesh, K.; Renjith, P.N. A Review on Dynamic Virtual Machine Consolidation Approaches for Energy-Efficient Cloud Data Centers. In Data Intelligence and Cognitive Informatics; Jeena Jacob, I., Kolandapalayam Shanmugam, S., Piramuthu, S., Falkowski-Gilski, P., Eds.; Springer: Singapore, 2021; pp. 761–780. [Google Scholar]
  33. Varshni, Y. Temperature dependence of the energy gap in semiconductors. Physica 1967, 34, 149–154. [Google Scholar] [CrossRef]
  34. Gerwin, H.; Scherer, W.; Teuchert, E. The TINTE Modular Code System for Computational Simulation of Transient Processes in the Primary Circuit of a Pebble-Bed High-Temperature Gas-Cooled Reactor. Nucl. Sci. Eng. 1989, 103, 302–312. [Google Scholar] [CrossRef]
  35. Ehlers, T.A.; Chaudhri, T.; Kumar, S.; Fuller, C.W.; Willett, S.D.; Ketcham, R.A.; Brandon, M.T.; Belton, D.X.; Kohn, B.P.; Gleadow, A.J.; et al. Computational Tools for Low-Temperature Thermochronometer Interpretation. Rev. Mineral. Geochem. 2005, 58, 589–622. [Google Scholar] [CrossRef]
  36. Satheesh, A.; Muthukumar, P.; Dewan, A. Computational study of metal hydride cooling system. Int. J. Hydrogen Energy 2009, 34, 3164–3172. [Google Scholar] [CrossRef]
  37. Grilli, F.; Pardo, E.; Stenvall, A.; Nguyen, D.N.; Yuan, W.; Gömöry, F. Computation of Losses in HTS Under the Action of Varying Magnetic Fields and Currents. IEEE Trans. Appl. Supercond. 2014, 24, 78–110. [Google Scholar] [CrossRef]
  38. Shahid, S.; Agelin-Chaab, M. Analysis of Cooling Effectiveness and Temperature Uniformity in a Battery Pack for Cylindrical Batteries. Energies 2017, 10, 1157. [Google Scholar] [CrossRef] [Green Version]
  39. Murray, A.V.; Ireland, P.T.; Wong, T.H.; Tang, S.W.; Rawlinson, A.J. High Resolution Experimental and Computational Methods for Modelling Multiple Row Effusion Cooling Performance. Int. J. Turbomach. Propuls. Power 2018, 3, 4. [Google Scholar] [CrossRef] [Green Version]
  40. Nebot-Andrés, L.; Llopis, R.; Sánchez, D.; Catalán-Gil, J.; Cabello, R. CO2 with Mechanical Subcooling vs. CO2 Cascade Cycles for Medium Temperature Commercial Refrigeration Applications Thermodynamic Analysis. Appl. Sci. 2017, 7, 955. [Google Scholar] [CrossRef] [Green Version]
  41. Heller, B.; Seetharaman, S.; Mahadevan, P.; Yiakoumis, Y.; Sharma, P.; Banerjee, S.; McKeown, N. Elastictree: Saving energy in data center networks. In Proceedings of the 7th USENIX Symposium on Networked Systems Design and Implementation (NSDI ’10), San Jose, CA, USA, 28–30 April 2010; Volume 10, pp. 249–264. [Google Scholar]
  42. McKeown, N.; Anderson, T.; Balakrishnan, H.; Parulkar, G.; Peterson, L.; Rexford, J.; Shenker, S.; Turner, J. OpenFlow: Enabling innovation in campus networks. ACM SIGCOMM Comput. Commun. Rev. 2008, 38, 69–74. [Google Scholar] [CrossRef]
  43. Han, Y.; Li, J.; Chung, J.Y.; Yoo, J.H.; Hong, J.W.K. SAVE: Energy-aware virtual data center embedding and traffic engineering using SDN. In Proceedings of the 2015 1st IEEE Conference on Network Softwarization (NetSoft), London, UK, 13–17 April 2015; pp. 1–9. [Google Scholar]
  44. Ma, X.; Zhang, Z.; Su, S. Energy-aware virtual data center embedding. J. Inf. Process. Syst. 2020, 16, 460–477. [Google Scholar]
  45. Sun, P.; Guo, Z.; Liu, S.; Lan, J.; Wang, J.; Hu, Y. SmartFCT: Improving Power-Efficiency for Data Center Networks with Deep Reinforcement Learning. Comput. Netw. 2020, 179, 107255. [Google Scholar] [CrossRef]
  46. Saadi, Y.; El Kafhali, S. Energy-efficient strategy for virtual machine consolidation in cloud environment. Soft Comput. 2020, 14845–14859. [Google Scholar] [CrossRef]
  47. MirhoseiniNejad, S.; Moazamigoodarzi, H.; Badawy, G.; Down, D.G. Joint data center cooling and workload management: A thermal-aware approach. Future Gener. Comput. Syst. 2020, 104, 174–186. [Google Scholar] [CrossRef]
  48. Kaffes, K.; Sbirlea, D.; Lin, Y.; Lo, D.; Kozyrakis, C. Leveraging application classes to save power in highly-utilized data centers. In Proceedings of the 11th ACM Symposium on Cloud Computing, Virtual Event, USA, 19–21 October 2020; pp. 134–149. [Google Scholar] [CrossRef]
  49. IBM Knowledge Center. Raised Floors. 2020. Available online: https://www.ibm.com/support/knowledgecenter/en/POWER8/p8ebe/p8ebe_raisedfloors.htm (accessed on 28 January 2021).
  50. Beitelmal, A.H. Numerical investigation of data center raised-floor plenum. In Proceedings of the ASME International Mechanical Engineering Congress and Exposition, Houston, TX, USA, 13–19 November 2015; Volume 57496, p. V08AT10A046. [Google Scholar]
  51. Ni, J.; Jin, B.; Zhang, B.; Wang, X. Simulation of thermal distribution and airflow for efficient energy consumption in a small data centers. Sustainability 2017, 9, 664. [Google Scholar] [CrossRef] [Green Version]
  52. Wan, J.; Gui, X.; Kasahara, S.; Zhang, Y.; Zhang, R. Air flow measurement and management for improving cooling and energy efficiency in raised-floor data centers: A survey. IEEE Access 2018, 6, 48867–48901. [Google Scholar] [CrossRef]
  53. Access Floor Systems. 24′′ × 24′′ Floor Grill. 2018. Available online: https://www.accessfloorsystems.com/index.php/products/air-flow-options/grills/24-inch-x-24-inch-grill.html (accessed on 25 March 2021).
  54. Tate Access Floors. Multi-Zone Opposed Blade Damper. 2018. Available online: https://www.tateinc.com/en-us/products/airflow-panels-and-controls/airflow-controls/multi-zone-opposed-blade-damper (accessed on 25 March 2021).
  55. Lu, H.; Zhang, Z.; Yang, L. A review on airflow distribution and management in data center. Energy Build. 2018, 179, 264–277. [Google Scholar] [CrossRef]
  56. Abreu, M. Contenção do Corredor Quente ou do Corredor Frio? Qual a Melhor Técnica? 2020. Available online: https://blog.innotechno.com.br/contencao-do-corredor-quente-ou-do-corredor-frio-qual-melhor-tecnica/ (accessed on 11 May 2021).
  57. Shrivastava, S.K.; Ibrahim, M. Benefit of cold aisle containment during cooling failure. In Proceedings of the International Electronic Packaging Technical Conference and Exhibition, Maui, HI, USA, 6–11 July 2003; Volume 55768, p. V002T09A021. [Google Scholar]
  58. Fulton, J. Control of Server Inlet Temperatures in Data Centers-A Long Overdue Strategy; White Paper; AFCO Systems: Farmingdale, NY, USA, 2006; Available online: https://citeseerx.ist.psu.edu/viewdoc/download?doi=10.1.1.95.1066&rep=rep1&type=pdf (accessed on 11 May 2021).
  59. Brady, G.A.; Kapur, N.; Summers, J.L.; Thompson, H.M. A case study and critical assessment in calculating power usage effectiveness for a data centre. Energy Convers. Manag. 2013, 76, 155–161. [Google Scholar] [CrossRef]
  60. Zaman, S.K.; Khan, A.u.R.; Shuja, J.; Maqsood, T.; Mustafa, S.; Rehman, F. A Systems Overview of Commercial Data Centers: Initial Energy and Cost Analysis. Int. J. Inf. Technol. Web Eng. 2019, 14, 42–65. [Google Scholar] [CrossRef] [Green Version]
Figure 1. DownFlow cooling scheme, where (A) is the flow of cold air coming under the raised floor towards the rack row and (B) the flow of hot air returning to the CRAC.
Applsci 11 04719 g001
Figure 2. Layout showing the alternating arrangement between (A) hot aisle and (B) cold aisle.
Applsci 11 04719 g002
Figure 3. Airflow direction comparison: (A) old data center using high flow perforated plates; (B) new data center using high flow angle control grids.
Applsci 11 04719 g003
Figure 4. Cold aisle containment, by adding doors and a closed roof to the aisles in such a way as to contain and concentrate the cold airflow in the front area of the racks.
Applsci 11 04719 g004
Table 1. Summary of related work on energy saving in data centers.
WorkApproachEnergy Save
Heller et al. [41]Central control softwareup to 50%
Han et al. [43]Software-defined networks(SDN)18.75%
Song et al. [28]Air controller, layout and location changes35%
Ma et al. [44]Heuristic and optimization algorithms11% to 28%
Sun et al. [45]Deep learning by reinforcement and SDNaround 12%
Saadi et al. [46]Optimizing the workload cost function21% on average
MirhoseiniNejad et al. [47]Low complexity holistic modelaround 11%
Kaffes et al. [48]Allocation mechanism of different sets of cores9%
Table 2. Extracted inlet temperatures and percentage of reduction of temperatures per server for the two analyzed periods: before moving to the new data center (April 18–April 19), and after (May 19–January 20).
EquipmentAverage Inlet Temperature (°C)—April 18–April 19 (SD)Average Inlet Temperature (°C)—May 19–January 20 (SD)Average Temperature Difference (°C)Percentage of Reduction
GPU Server 0125.76 ( ± 3.42 )15.35 ( ± 1.42 )10.4140%
GPU Server 0222.60 ( ± 2.00 )15.27 ( ± 1.41 )7.3332%
GPU Server 0326.83 ( ± 3.41 )16.31 ( ± 1.43 )10.5339%
GPU Server 0425.55 ( ± 3.80 )15.21 ( ± 1.37 )10.3440%
GPU Server 0522.77 ( ± 1.26 )15.31 ( ± 1.47 )7.4733%
GPU Server 0628.18 ( ± 1.94 )15.26 ( ± 1.41 )12.9146%
GPU Server 0728.04 ( ± 1.26 )15.28 ( ± 1.49 )12.7646%
GPU Server 0827.34 ( ± 1.97 )15.21 ( ± 1.40 )12.1344%
Average25.8815.4010.4841%
Publisher’s Note: MDPI stays neutral with regard to jurisdictional claims in published maps and institutional affiliations.

