Abstract
The thermoelectric generator (TEG) stands out among many energy harvesters due to its simple structure, small size, rich thermal energy, and the absence of pollution and noise. However, previous studies have rarely probed into the influence of TEG internal resistances on extracting maximum power from TEGs, and the tracking of efficiency is limited. By analyzing the relationship between the tracking efficiency and the TEG internal resistances, a time exponential rate perturbation and observation (P&O) technology is proposed to achieve maximum power point tracking (MPPT) for a wide resistance range of the TEG. Using the time exponential rate P&O, the MPPT circuit observed the power change by comparing the positive-channel metal-oxide semiconductor (PMOS) on-time and perturbs the power by adjusting the negative-channel metal-oxide semiconductor (NMOS) on-time exponentially. The MPPT circuit was implemented in a 110 nm complementary metal-oxide semiconductor (CMOS) process. The tracking efficiency maintained a high level from 98.9 to 99.5%. The applicable range of the TEG resistance was from 1 to 12 Ω, which reflects an enhancement of at least 2.2 times.
1. Introduction
With the flourishing of wearable devices and implantable medical devices, self-powered applications are preferred in order to avoid regular battery replacement or recharging. Therefore, clean and environmentally friendly energy harvesting technology, which scavenges ambient energy, is receiving more and more attention due to its long service life [1,2,3,4,5,6]. The thermoelectric generator (TEG), which converts thermal energy into electricity based on the Seebeck effect, stands out among many energy harvesters due to its simple structure, small size, rich thermal energy, and the absence of pollution and noise [7,8,9,10,11,12].
A TEG is composed of a series of thermocouples (TC) sandwiched between two high-thermal-conductivity substrates. It can be modeled as a DC voltage source ETEG and an internal resistance RTEG connected in series, as shown in Figure 1. According to the Seebeck effect, the ETEG can be expressed as
where N is the number of thermocouples, ΔT is the temperature difference between the two sides of the TEG, and α is the Seebeck coefficient in V/K. α is material-related and not relevant to the size of the thermocouples. The RTEG is mainly determined by the size and the electrical resistivity of the semiconductor materials. Limited by the device area and temperature differences, the ETEG fluctuates within the range of 50–400 mV and the RTEG varies from 1 Ω to 12 Ω in most wearable applications [13,14]. Therefore, extracting as much power as possible is crucial for the TEG converter.
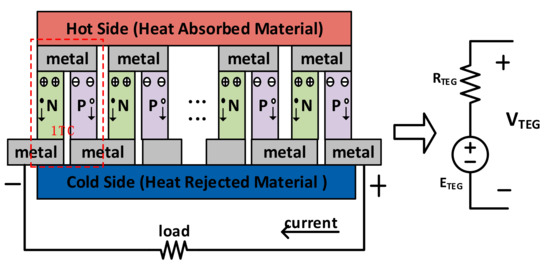
Figure 1.
Thermoelectric generator and its equivalent electrical model.
Because of the restricted space condition, maximum power point tracking (MPPT) methods for wearable devices usually adopt fractional open-circuit voltage (FOCV) [15,16] or perturbation and observation (P&O) [17,18] techniques, rather than complex algorithms that must collect and manage large amounts of data [19].
According to the TEG electrical model in Figure 1, the maximum output power occurs when the TEG output voltage (VTEG) is half of its present open-circuit voltage (ETEG). A conventional MPPT circuit using the FOCV technique is illustrated in Figure 2. The circuit periodically turns on S1 and turns off the connection of the TEG and boost circuit to sample the open-circuit voltage on the TEG. During the boost circuit operation, the control signals of the boost circuit are automatically tuned by a hysteresis comparator and an MPPT controller to keep VTEG around half of VOC [20,21]. Although the FOCV technique is simple to implement, it must frequently stop the boost circuit for a while to sample the VTEG, which reduces the system efficiency. To overcome the drawback of the FOCV technique, the P&O technique is proposed for TEG by Rawy [22] and Bandyopadhyay [23]. However, the tracking efficiencies fluctuate wildly, especially for a wide RTEG range.
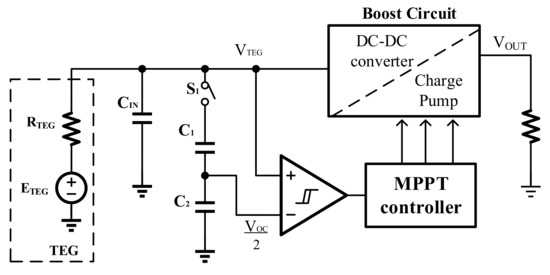
Figure 2.
Conventional MPPT circuit using the fractional open circuit technique.
The remainder of the paper is organized as follows. By analyzing the influence of TEG internal resistances on tracking efficiency, a time exponential rate P&O technology is proposed in Section 2. Using the time exponential rate P&O, the MPPT circuit observes the power by comparing a positive-channel metal-oxide semiconductor (PMOS) on-time and perturbs the power by adjusting a negative-channel metal-oxide semiconductor (NMOS) on-time exponentially. The detailed circuit modules including zero current detection and power modulator are demonstrated respectively in Section 3. Section 4 presents the simulation results of the proposed MPPT circuit, which shows an enhanced tracking efficiency for a wide RTEG range. Conclusions and discussion are included in Section 5.
2. Time Exponential Rate P&O Algorithm
Considering the low output voltage of TEG (<400 mV), a boost DC–DC converter is used to step up the voltage, as shown in Figure 3. According to the volt-second theory of inductors, the relationship between the voltage and on-time of a boost converter is
where VOUT is the output voltage of the boost converter, and tMN and tMP are the on-time of the power transistors MN and MP, respectively.
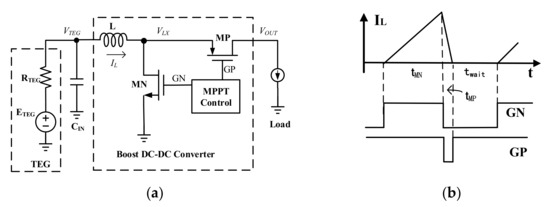
Figure 3.
Proposed boost DC–DC converter: (a) topology architecture; (b) inductor current and control signals.
Because of the high conversion rate for this implementation, the inductor current IL declines much faster than it increases and the boost converter works in discontinuous conduction mode. Accordingly, the average current through the inductance can be expressed as
where L is the inductance and T is the cycle time of the converter. The input power of the converter can be expressed as
By substituting Equation (2) into Equation (4) and considering the high conversion rate (VOUT ≫ VTEG), PIN can be approximated to
Observing Equation (5), we find that the on-time tMP reflects the PIN when the converter works in pulse width modulation (PWM) mode and the output VOUT changes slightly.
As a function of the equivalent resistance of the boost converter (Req), PIN can be expressed as
The PIN reaches the maximum when Req is equal to RTEG.
According to Equation (6), tracking efficiency, which is the ratio of input power to ideal maximum input power, can be expressed as
where ε is any constant in the range of 0 to 1. By rearranging Equation (7), we can obtain
By analyzing Equation (7) and Equation (8), we find that if Req is in the range of RTEG/β to βRTEG, the tracking efficiency of the MPPT system will remain higher than ε. When Req(n) is a geometric sequence with a common ratio β1/2, there are at least three Req(n) in the range of RTEG/β to βRTEG for arbitrary RTEG, as shown in Figure 4.

Figure 4.
Req(n) is a geometric sequence with a common ratio β1/2, and Req(k) is one of the Req(n) closest to RTEG.
Figure 5 graphically represents the entire process of the time exponential rate P&O algorithm. In each MPPT cycle, the present tMP is sampled and compared with the tMP sampled in the previous MPPT cycle. The comparison reveals the input-power changes of two consecutive MPPT cycles based on Equation (5), as VOUT shows little change between the short sampling time intervals. If the tMP of an MPPT cycle is larger than the previous cycle, it means that input power has increased in the cycle. Then the movement direction of Req is the same as the previous cycle; otherwise, the circuit changes the movement direction of REquation. Therefore, the circuit gradually approaches the maximum power point (MPP) and hovers at the three states closest to the MPP in the end. The three states are points B, C, and D in Figure 5.
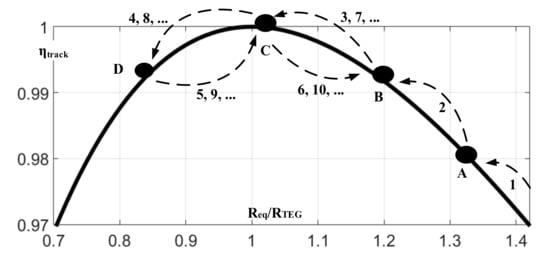
Figure 5.
Process of the time exponential rate P&O algorithm.
Because of the high conversion rate (tMN ≫ tMP), Req can be approximated to
According to Equation (9), Req is inversely proportional to the square of the tMN, and the function of moving the Req exponentially is easy to implement by tuning the tMN exponentially.
By adopting the time exponential rate P&O, the change rate of the perturbation can be set properly, neither too small to distinguish the power change nor too large to reduce the tracking efficiency for various RTEG. The MPPT circuit achieves an enhanced tracking efficiency for a wide internal resistance range of TEG. Meanwhile, the circuit observes and perturbs power according to the power transistor on-time, which simplifies the circuit significantly.
3. Circuit Implementation
The architecture of the proposed MPPT circuit based on the time exponential rate P&O is shown in Figure 6, including a zero current detection (ZCD), a power modulator (PM), a time sensor, an oscillator (OSC), and power transistor drivers (Ndriver, Pdriver). The boost converter works in PWM mode. ZCD predicts when reverse current occurs on the inductor, then turns off MP by signaling GP_OFF and outputs a digital signal TP<8:0> to represent the length of time (tMP). According to the time exponential rate P&O, the power modulator compares the TP<8:0> of two consecutive MPPT cycles to obtain the input power change and then generates a pulse width modulating signal (VPMO) to adjust tMN. The time sensor converts the MN on-time to voltage VON. Once VON reaches VPMO, the output of the comparator resets the following D flip-flop, thereby defining tMN.
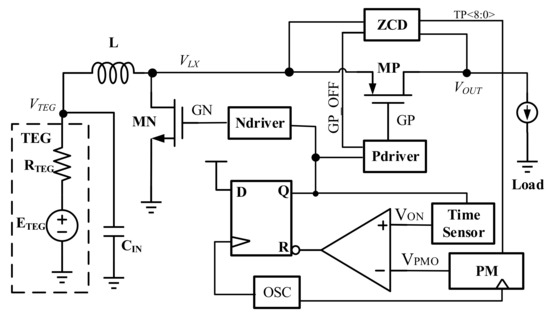
Figure 6.
The architecture of the proposed MPPT circuit.
3.1. Predictive Zero Current Detection
According to the time exponential rate P&O algorithm, the power change is obtained by comparing the MP on-time. Therefore, a high-precision ZCD is crucial.
When the ZCD turns off MP slowly, a reverse current appears on the inductor for a time, as shown in Figure 7a. Because the drain–substrate PN junction of the MN forms a discharge path of the reverse current, the voltage at the right end of the inductor (VLX) will first fall to the negative PN junction voltage (−VD). When the ZCD turns off MP quickly, a little forward current remains on the inductor, as shown in Figure 7b. The forward current flows through the source–substrate PN junction of the MP. Therefore, the VLX will first jump to the sum of the substrate voltage and the PN junction voltage (VOUT + VD).
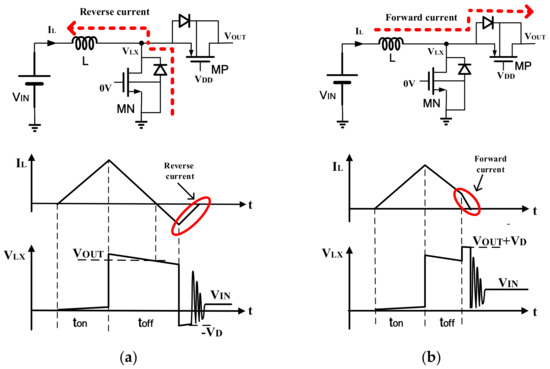
Figure 7.
The discharge path of remaining current and waveforms after the MP is turned off (a) slowly and (b) quickly.
Based on the above analysis, there are two different situations of the VLX after the MP is turned off, and a predictive ZCD is proposed as shown in Figure 8. When the MP is turned on, current source I1 starts to charge capacitor C1. Until VC1 is higher than VTP, DFF is set by the COM1 and the ZCD output signal GP_OFF turns off the MP. In each converter cycle, after the MP is turned off, VLX is compared with VOUT/2 by a dynamic comparator COM2. Then the 9-bit bidirectional counter (BDC) is triggered to read the result of the COM2. If the BDC input DIR is high, the BDC output TP<8:0> is plus one. Otherwise, the TP<8:0> is minus one. The TPn<8:0> is used to control whether a series of proportional-current mirrors are connected to resistor R2, which defines VTP.
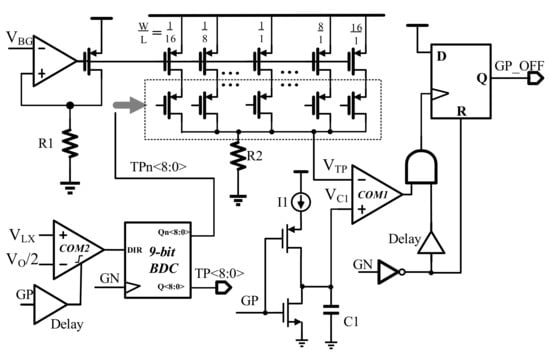
Figure 8.
Predictive zero current detection.
When VLX is higher than VOUT/2, which means the MP is turned off early in the cycle, TP<8:0> and VTP will increase and the MP will be shut down later in the next cycle, and vice versa. Therefore, the predictive ZCD continuously corrects the TP<8:0> in each cycle and the tMP is set around the best turn-off time adaptively. Consequently, the high-precision predictive ZCD is achieved. Meanwhile, the digital output TP<8:0> can be handled easily by the following circuit.
3.2. Time Exponential Rate Power Modulator
According to the time exponential rate P&O algorithm in Section 2, a proposed power modulator observes the power change by comparing TP<8:0> and provides the control signal VPMO to change the length of time tMN, as shown in Figure 9. The input control signals CLK_TP, CLK_TN, and CLK_SAV come from OSC and are used to execute the power modulator sequentially, as shown in Figure 9b. Generally, an MPPT cycle, during which the circuit changes tMN once, includes dozens of DC–DC converter cycles to ensure that the circuit reaches a stable state again.
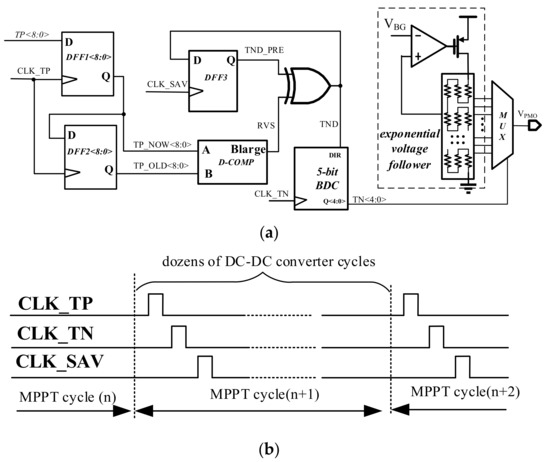
Figure 9.
Time exponential rate power modulator (a) schematic and (b) input control signal.
At the beginning of each MPPT cycle, two groups of flip-flops (DFF1<8:0>, DFF2<8:0>) are triggered to save the present and previous time-length values TP<8:0>. After that, a digital comparator (D-COMP) compares these two values, and outputs a high level when the previous one is larger. Then, the D-COMP output (RVS) and the previous moving direction of tMN (TND_PRE) perform the XOR operation. If RVS is low, the present moving direction (TND) is set to equal to the previous. If not, the TND will be reversed. According to the TND, signal TN<4:0> will be made plus or minus one by 5-bit BDC when the pulse CLK_TN arrives. An exponential voltage follower consists of an amplifier, a transistor, and a series of resistors, and outputs a series of voltages, which grows exponentially. According to TN<4:0>, the output of the power modulator (VPMO) increases or decreases exponentially in each MPPT cycle by the multiplexer (MUX) and the voltage follower. Finally, the DFF3 is triggered to save TND for calculation in the next MPPT cycle.
4. Simulation Results
The proposed MPPT circuit using the time exponential rate P&O algorithm for TEG was implemented and simulated with a 110 nm standard complementary metal-oxide semiconductor (CMOS) process. The total silicon chip occupied an area of 1.5 mm2 (with pads), as shown in Figure 10.
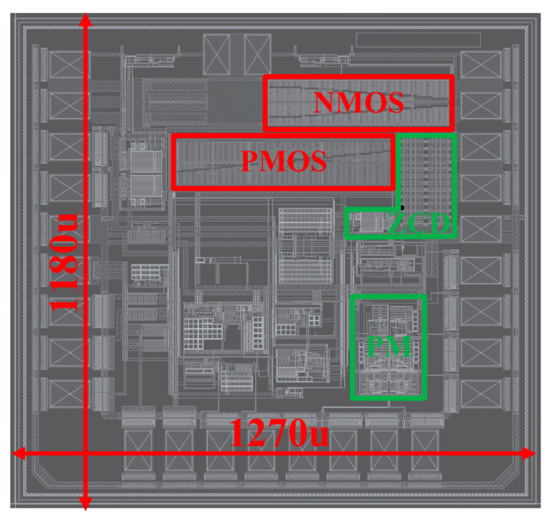
Figure 10.
Layout view of the proposed MPPT circuit.
A voltage source ETEG and a resistance RTEG were connected in series to mimic the TEG. Figure 11 displays the simulation waveform of the TEG output voltage VTEG when ETEG changed from 50 mV to 400 mV and RTEG was 6 Ω. There is an enlarged view of the simulation results at the bottom of the figure. As described in Section 2, VTEG oscillated between the three states closest to ETEG/2, which is the maximum power point.
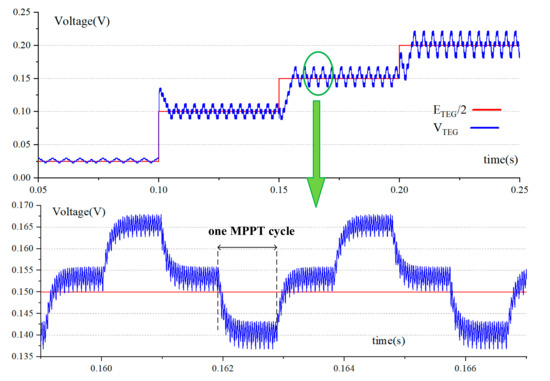
Figure 11.
The waveform of VTEG, when ETEG changes from 50 mV to 400 mV and RTEG is 6 Ω.
The input power of the DC–DC converter was obtained by the calculator module embedded in Spectre. The input power was divided by the ideal maximum power output of the TEG to obtain the tracking efficiency of the proposed MPPT circuit. The simulation result of the tracking efficiencies was between 98.9% and 99.5% for ETEG from 50 mV to 400 mV and RTEG from 1 Ω to 12 Ω, as shown in Figure 12, indicating that the MPPT circuit maintained extremely high tracking efficiency in a wide TEG range.
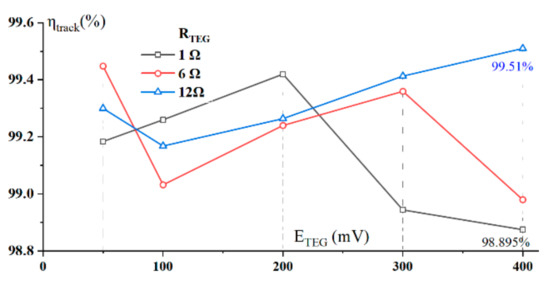
Figure 12.
Tracking efficiencies of the proposed circuit at different conditions.
For comparison, Figure 13 illustrates the tracking efficiencies of the compared MPPT circuit, which realizes P&O technology by fixed time step length perturbing. With the increase in RTEG, the perturbation of tMN should be smaller to maintain the same tracking efficiency. Therefore, the ηtrack of the long-time step circuit gradually decreases from 98.7% to 92.3%. However, when the fixed-time step length is set to short, the change in power is too small to be observed correctly at low RTEG. Therefore, the circuit will oscillate before reaching the MPP. Then, the ηtrack maintains a high level at high RTEG and decreases significantly at low RTEG, as shown in Figure 13. Comparing with the fixed-time step P&O scheme, the proposed time exponential rate P&O scheme maintains high tracking efficiency in a wider RTEG range.
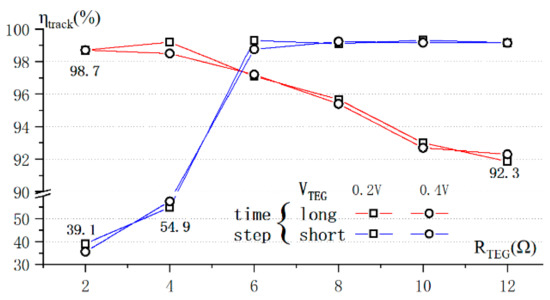
Figure 13.
Tracking efficiencies of the compared MPPT circuit with a fixed-time step P&O scheme.
Table 1 shows a comparison of this work with other state-of-the-art MPPT techniques for TEG. A previous MPPT circuit with the FOCV technique by Luo [20] achieved peak tracking efficiencies of 96%, but only TEGs with fixed internal resistance were utilized and the influence of internal resistances on tracking efficiency was not considered. Shrivastava [21] tested different internal resistances, and the tracking efficiency decreased by 7% when the internal resistance varied from 5 to 10 Ω. Moreover, the FOCV technique must frequently stop the boost circuit for a while to sample the open-circuit voltage, which reduces the system efficiency. Comparing with previous works using the P&O technique [22,23], the proposed MPPT circuit using the time exponential rate P&O technique maintains tracking efficiency at a high level from 98.9 to 99.5%, and the applicable range of the TEG resistance is from 1 to 12 Ω, which reflects an enhancement of at least 2.2 times.

Table 1.
Performance comparisons with related works.
5. Conclusions and Discussions
The time exponential rate P&O technology is proposed in this work to extract the maximum electrical energy from TEG. By using the time exponential rate P&O, the proposed MPPT circuit observes the power change by comparing PMOS on-time and perturbs the power by adjusting NMOS on-time exponentially, which shows an enhanced tracking efficiency for a wide range of TEG. The MPPT circuit was implemented in a 110 nm CMOS process and its tracking efficiencies varied from 98.9% to 99.5% with TEG open-circuit voltage from 50 mV to 400 mV and the TEG internal resistance from 1 Ω to 12 Ω.
This time exponential rate P&O technology is expected to contribute to the versatility of the MPPT circuit for various TEGs, which are made of varied semiconductor materials and have different internal resistances. However, there are also limitations of the proposed MPPT circuit. Nowadays, a multiple-input multiple-output (MIMO) converter is a trend for energy harvesters. The MIMO converter can store partial electricity when the ambient energy is redundant, and this electricity can be used to power the load when the ambient energy is insufficient. However, the proposed MPPT circuit is designed for a single-input single-output (SISO) system. The time exponential rate P&O technology should be reconsidered for the MIMO system, especially when the voltage of the electricity storage capacitor (VST) is low, and a high conversion rate (VST ≫ VTEG) is impossible. These challenges are an important future research direction for the MPPT circuit.
Author Contributions
Conceptualization, H.C. and J.M.; methodology, J.M. and H.C.; investigation, J.M.; data curation, J.M. and Y.L. (Yi Lv); project administration, W.L.; funding acquisition, Z.S. and Y.L. (Yu Lei). All authors have read and agreed to the published version of the manuscript.
Funding
This research was funded by the National Key Research and Development Program of China (2017YFB0701703, 2017YFA0206104, 2017YFB0405601, 2018YFB0407500), National Natural Science Foundation of China (61874178, 61874129, 91964204, 61904186, 61904189), Strategic Priority Research Program of the Chinese Academy of Sciences (XDB44010200), Science and Technology Council of Shanghai (17DZ2291300, 19JC1416801), Shanghai Sailing Program (19YF1456100).
Institutional Review Board Statement
Not applicable.
Informed Consent Statement
Not applicable.
Data Availability Statement
Not applicable.
Acknowledgments
The authors would thank the Semiconductor Manufacturing International Corporation (SMIC) for support.
Conflicts of Interest
The authors declare no conflict of interest.
References
- Said, O.; Albagory, Y.; Nofal, M.; Al Raddady, F. IoT-RTP and IoT-RTCP: Adaptive Protocols for Multimedia Transmission over Internet of Things Environments. IEEE Access 2017, 5, 16757–16773. [Google Scholar] [CrossRef]
- Wang, Y.; Gawryszewska-Wilczynsk, P.; Zhang, X.; Yin, J.; Wen, Y.; Li, H. Photovoltaic efficiency enhancement of polycrystalline silicon solar cells by a highly stable luminescent film. Sci. China Mater. 2020, 63, 544–551. [Google Scholar] [CrossRef]
- Meneghello, F.; Calore, M.; Zucchetto, D.; Polese, M.; Zanella, A. IoT: Internet of Threats? A Survey of Practical Security Vulnerabilities in Real IoT Devices. IEEE Internet Things J. 2019, 6, 8182–8201. [Google Scholar] [CrossRef]
- Chen, I.-C.; Liang, C.-W.; Tsai, T.-H. A Single-Inductor Dual-Input Dual-Output DC–DC Converter for Photovoltaic and Piezoelectric Energy Harvesting Systems. IEEE Trans. Circuits Syst. II Express Briefs 2019, 66, 1763–1767. [Google Scholar] [CrossRef]
- Chen, P.-H.; Cheng, H.-C.; Lo, C.-L. A Single-Inductor Triple-Source Quad-Mode Energy-Harvesting Interface With Automatic Source Selection and Reversely Polarized Energy Recycling. IEEE J. Solid-State Circuits 2019, 54, 2671–2679. [Google Scholar] [CrossRef]
- Munoz, R.; Vilalta, R.; Yoshikane, N.; Casellas, R.; Martinez, R.; Tsuritani, T.; Morita, I. Integration of IoT, Transport SDN, and Edge/Cloud Computing for Dynamic Distribution of IoT Analytics and Efficient Use of Network Resources. J. Light. Technol. 2018, 36, 1420–1428. [Google Scholar] [CrossRef]
- Jaziri, N.; Boughamoura, A.; Müller, J.; Mezghani, B.; Tounsi, F.; Ismail, M. A comprehensive review of Thermoelectric Generators: Technologies and common applications. Energy Rep. 2020, 6, 264–287. [Google Scholar] [CrossRef]
- Watson, T.C.; Vincent, J.N.; Lee, H. Effect of DC-DC voltage step-up converter impedance on thermoelectric energy harvester system design strategy. Appl. Energy 2019, 239, 898–907. [Google Scholar] [CrossRef]
- Verma, G.; Sharma, V. A Novel Thermoelectric energy harvester for Wireless Sensor Network Application. IEEE Trans. Ind. Electron. 2018, 66, 1. [Google Scholar] [CrossRef]
- Coustans, M.; Krummenacher, F.; Kayal, M. A Fully Integrated 60 mV Cold-Start Circuit for Single Coil DC–DC Boost Converter for Thermoelectric Energy Harvesting. IEEE Trans. Circuits Syst. II Express Briefs 2019, 66, 1668–1672. [Google Scholar] [CrossRef]
- Lim, B.-M.; Seo, J.-I.; Lee, S.-G. A Colpitts Oscillator-Based Self-Starting Boost Converter for Thermoelectric Energy Harvesting With 40-mV Startup Voltage and 75% Maximum Efficiency. IEEE J. Solid-State Circuits 2018, 53, 3293–3302. [Google Scholar] [CrossRef]
- Bassi, G.; Colalongo, L.; Richelli, A.; Kovacs-Vajna, Z.M. 100 mV–1.2 V fully-integrated DC–DC converters for thermal energy harvesting. IET Power Electron. 2013, 6, 1151–1156. [Google Scholar] [CrossRef]
- Tellurex. Tellurex Thermoelectric Energy Harvester-G1-1.0-127-1.27. 2011. Available online: http://educypedia.karadimov.info/library/termo.pdf (accessed on 18 May 2021).
- Cauchy, C.J.; Wertenberger, L.W. Thermoelectric Module and Method of Manufacturing the Same. U.S. Patent 6103967, 15 August 2000. [Google Scholar]
- Shim, M.; Kim, J.; Jeong, J.; Park, S.; Kim, C. Self-Powered 30 µW to 10 mW Piezoelectric Energy Harvesting System With 9.09 ms/V Maximum Power Point Tracking Time. IEEE J. Solid-State Circuits 2015, 50, 2367–2379. [Google Scholar] [CrossRef]
- Leoni, A.; Pantoli, L. SPICE Model Identification Technique of a Cheap Thermoelectric Cell Applied to DC/DC Design with MPPT Algorithm for Low-Cost, Low-Power Energy Harvesting. Appl. Sci. 2019, 9, 3744. [Google Scholar] [CrossRef]
- Vaisband, I.; Saadat, M.; Murmann, B. A Closed-Loop Reconfigurable Switched-Capacitor DC-DC Converter for Sub-mW Energy Harvesting Applications. IEEE Trans. Circuits Syst. I Regul. Pap. 2015, 62, 385–394. [Google Scholar] [CrossRef]
- Teh, Y.-K.; Mok, P.K.T. Design of Transformer-Based Boost Converter for High Internal Resistance Energy Harvesting Sources With 21 mV Self-Startup Voltage and 74% Power Efficiency. IEEE J. Solid-State Circuits 2014, 49, 2694–2704. [Google Scholar] [CrossRef]
- M’Zoughi, F.; Garrido, I.; Garrido, A.J.; De La Sen, M. Rotational Speed Control Using ANN-Based MPPT for OWC Based on Surface Elevation Measurements. Appl. Sci. 2020, 10, 8975. [Google Scholar] [CrossRef]
- Luo, Z.; Zeng, L.; Lau, B.; Lian, Y.; Heng, C.-H. A Sub-10 mV Power Converter with Fully Integrated Self-Start, MPPT, and ZCS Control for Thermoelectric Energy Harvesting. IEEE Trans. Circuits Syst. I Regul. Pap. 2017, 65, 1744–1757. [Google Scholar] [CrossRef]
- Shrivastava, A.; Roberts, N.E.; Khan, O.U.; Wentzloff, D.D.; Calhoun, B.H. A 10 mV-Input Boost Converter with Inductor Peak Current Control and Zero Detection for Thermoelectric and Solar Energy Harvesting With 220 mV Cold-Start and 14.5 dBm, 915 MHz RF Kick-Start. IEEE J. Solid-State Circuits 2015, 50, 1820–1832. [Google Scholar] [CrossRef]
- Rawy, K.; Kalathiparambil, F.; Maurath, D.; Kim, T.T.-H. A Self-Adaptive Time-Based MPPT with 96.2% Tracking Efficiency and a Wide Tracking Range of 10 μA to 1 mA for IoT Applications. IEEE Trans. Circuits Syst. I Regul. Pap. 2017, 64, 2334–2345. [Google Scholar] [CrossRef]
- Bandyopadhyay, S.; Chandrakasan, A.P. Platform Architecture for Solar, Thermal, and Vibration Energy Combining with MPPT and Single Inductor. IEEE J. Solid-State Circuits 2012, 47, 2199–2215. [Google Scholar] [CrossRef]
Publisher’s Note: MDPI stays neutral with regard to jurisdictional claims in published maps and institutional affiliations. |
© 2021 by the authors. Licensee MDPI, Basel, Switzerland. This article is an open access article distributed under the terms and conditions of the Creative Commons Attribution (CC BY) license (https://creativecommons.org/licenses/by/4.0/).