1. Introduction
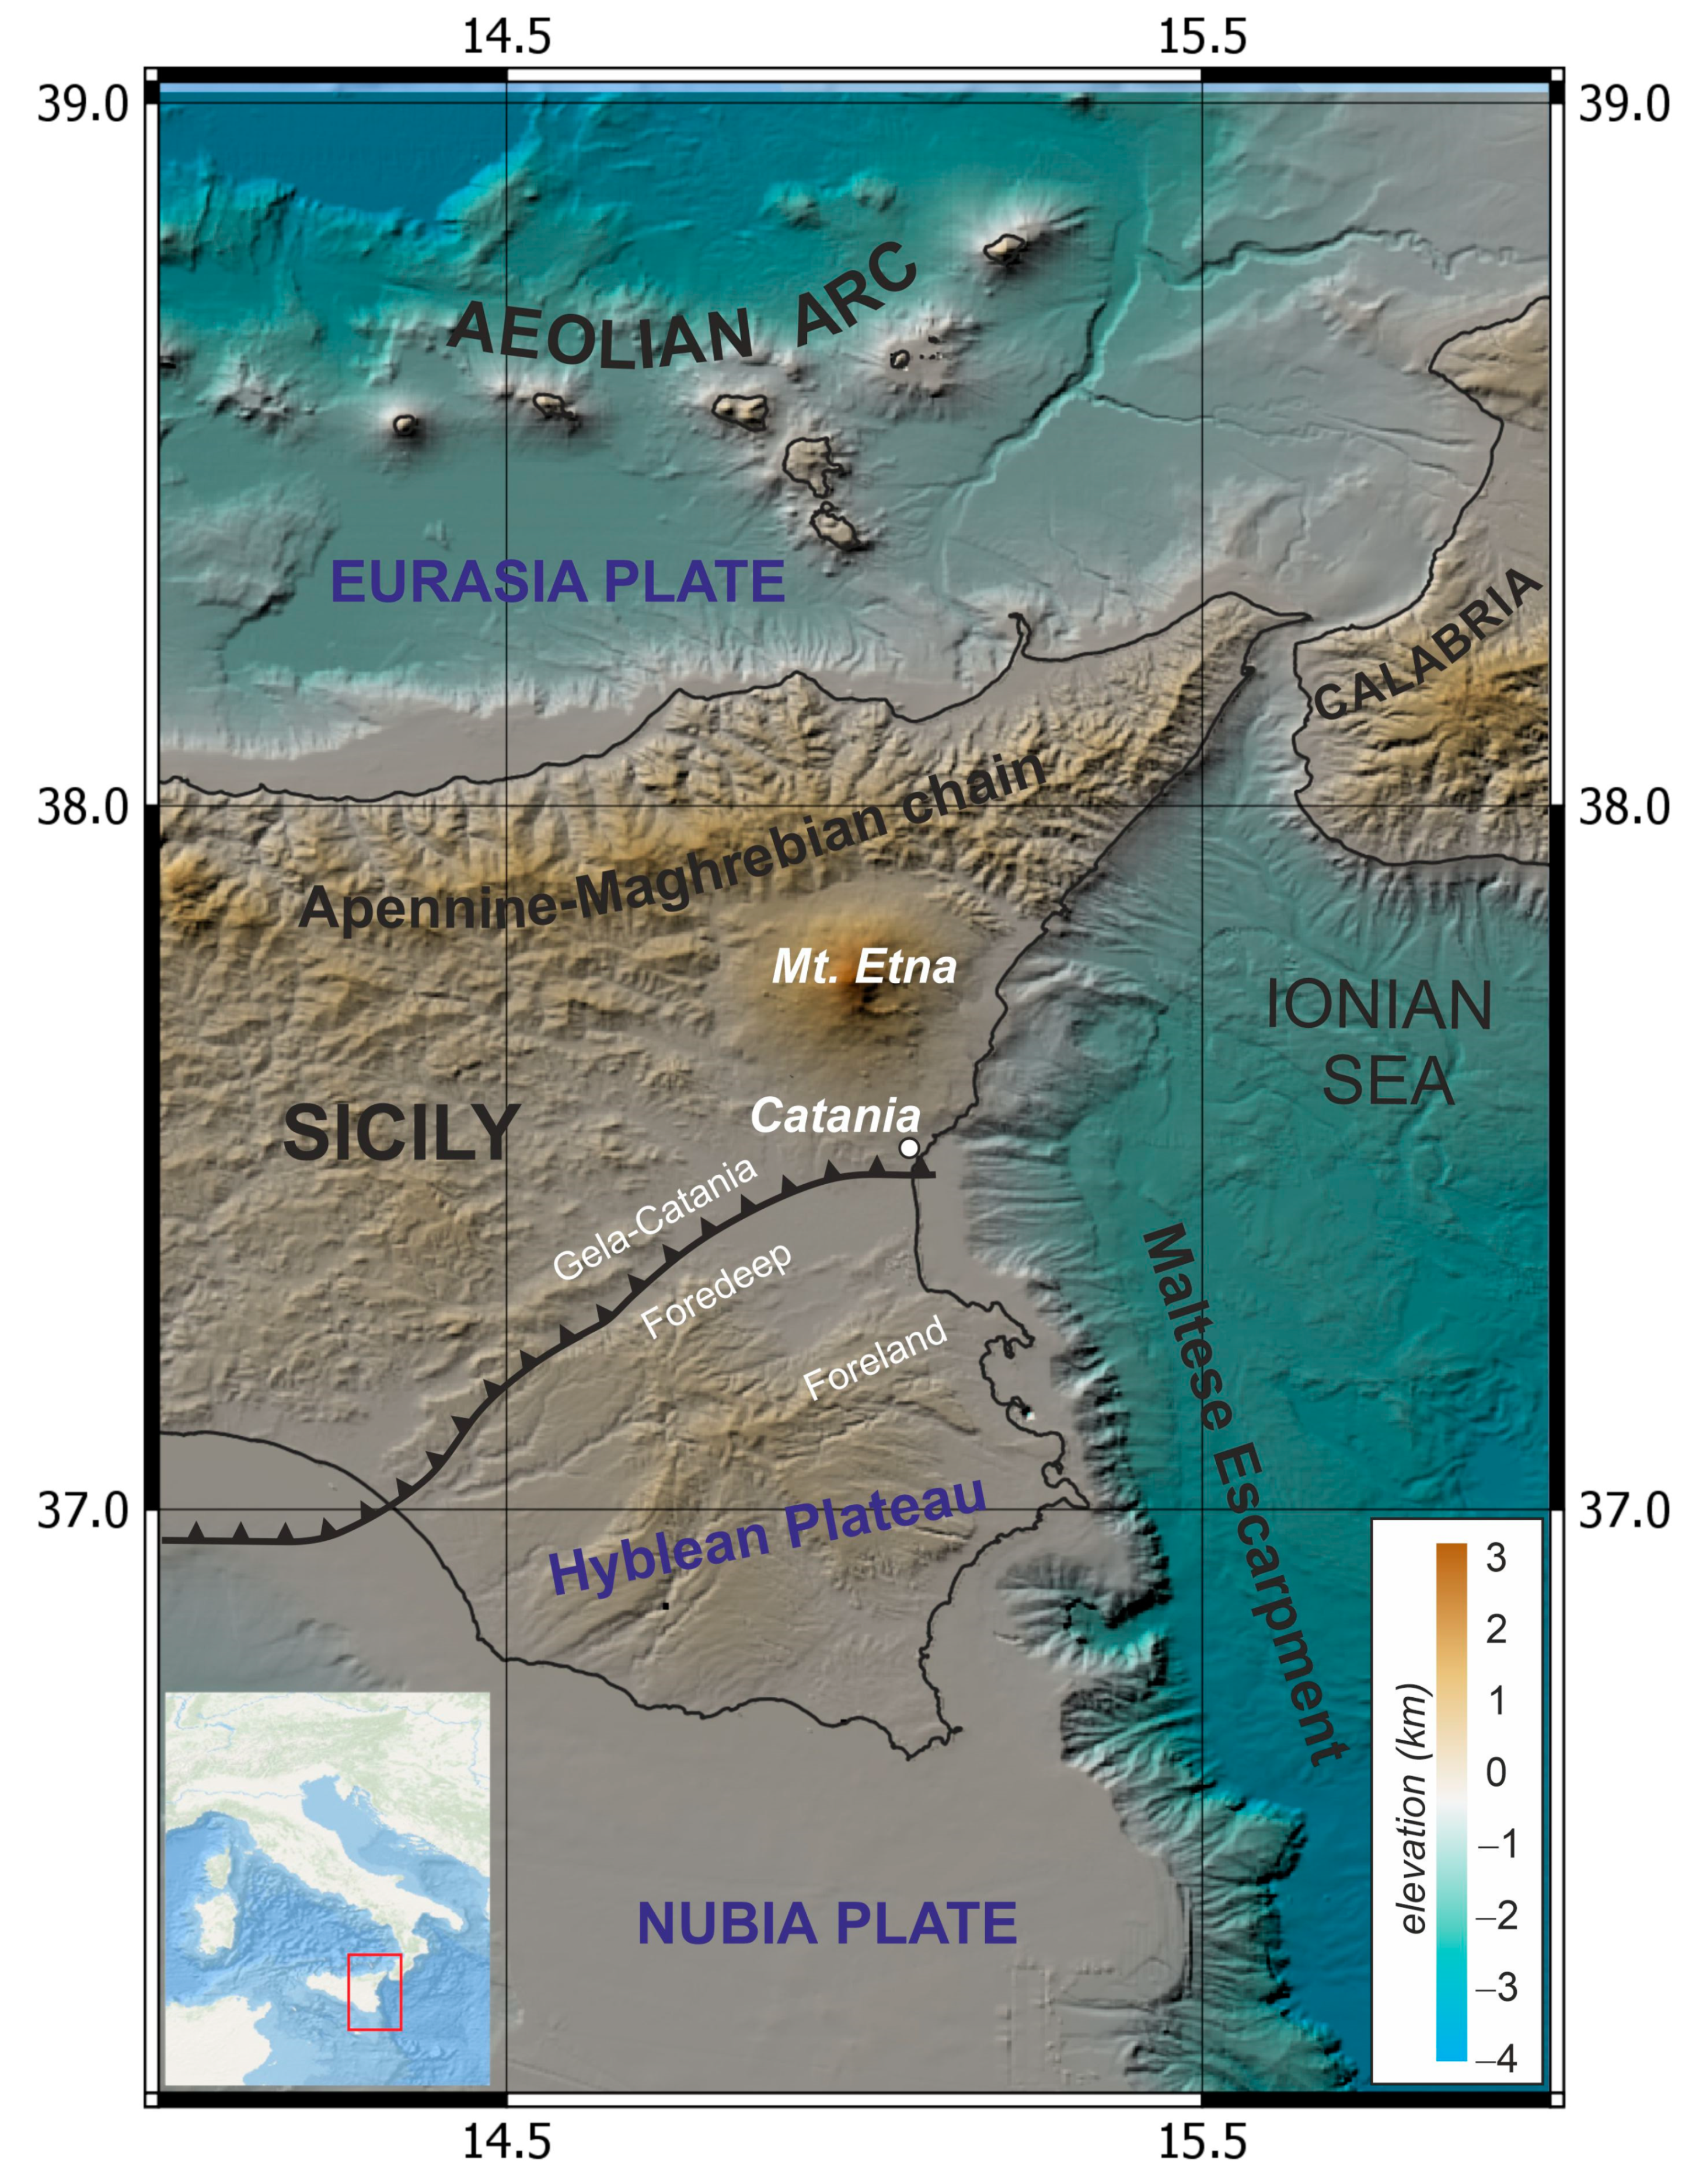
Mt. Etna is the largest and highest volcano in continental Europe. It is located in the central Mediterranean Sea, in eastern Sicily (Italy), just north of the city of Catania (
Figure 1). It lies on continental crust, over the collisional belt between the Nubia and the Eurasia plates. The northern side of Etna lies on the external units of the Apennine-Maghrebian chain, while the southern foot lies on the foredeep deposits, where the foreland bends northwards beneath the chain. This geodynamic framework is further complicated by the presence of the Maltese Escarpment, on the eastern foot of the volcano, separating the continental crust in the west from the oceanic one of the Ionian basin in the east. Just east of Etna, in fact, the collisional dynamics are no longer characterized by continental crust collision but by the subduction of the oceanic Ionian beneath the Calabrian Arc.
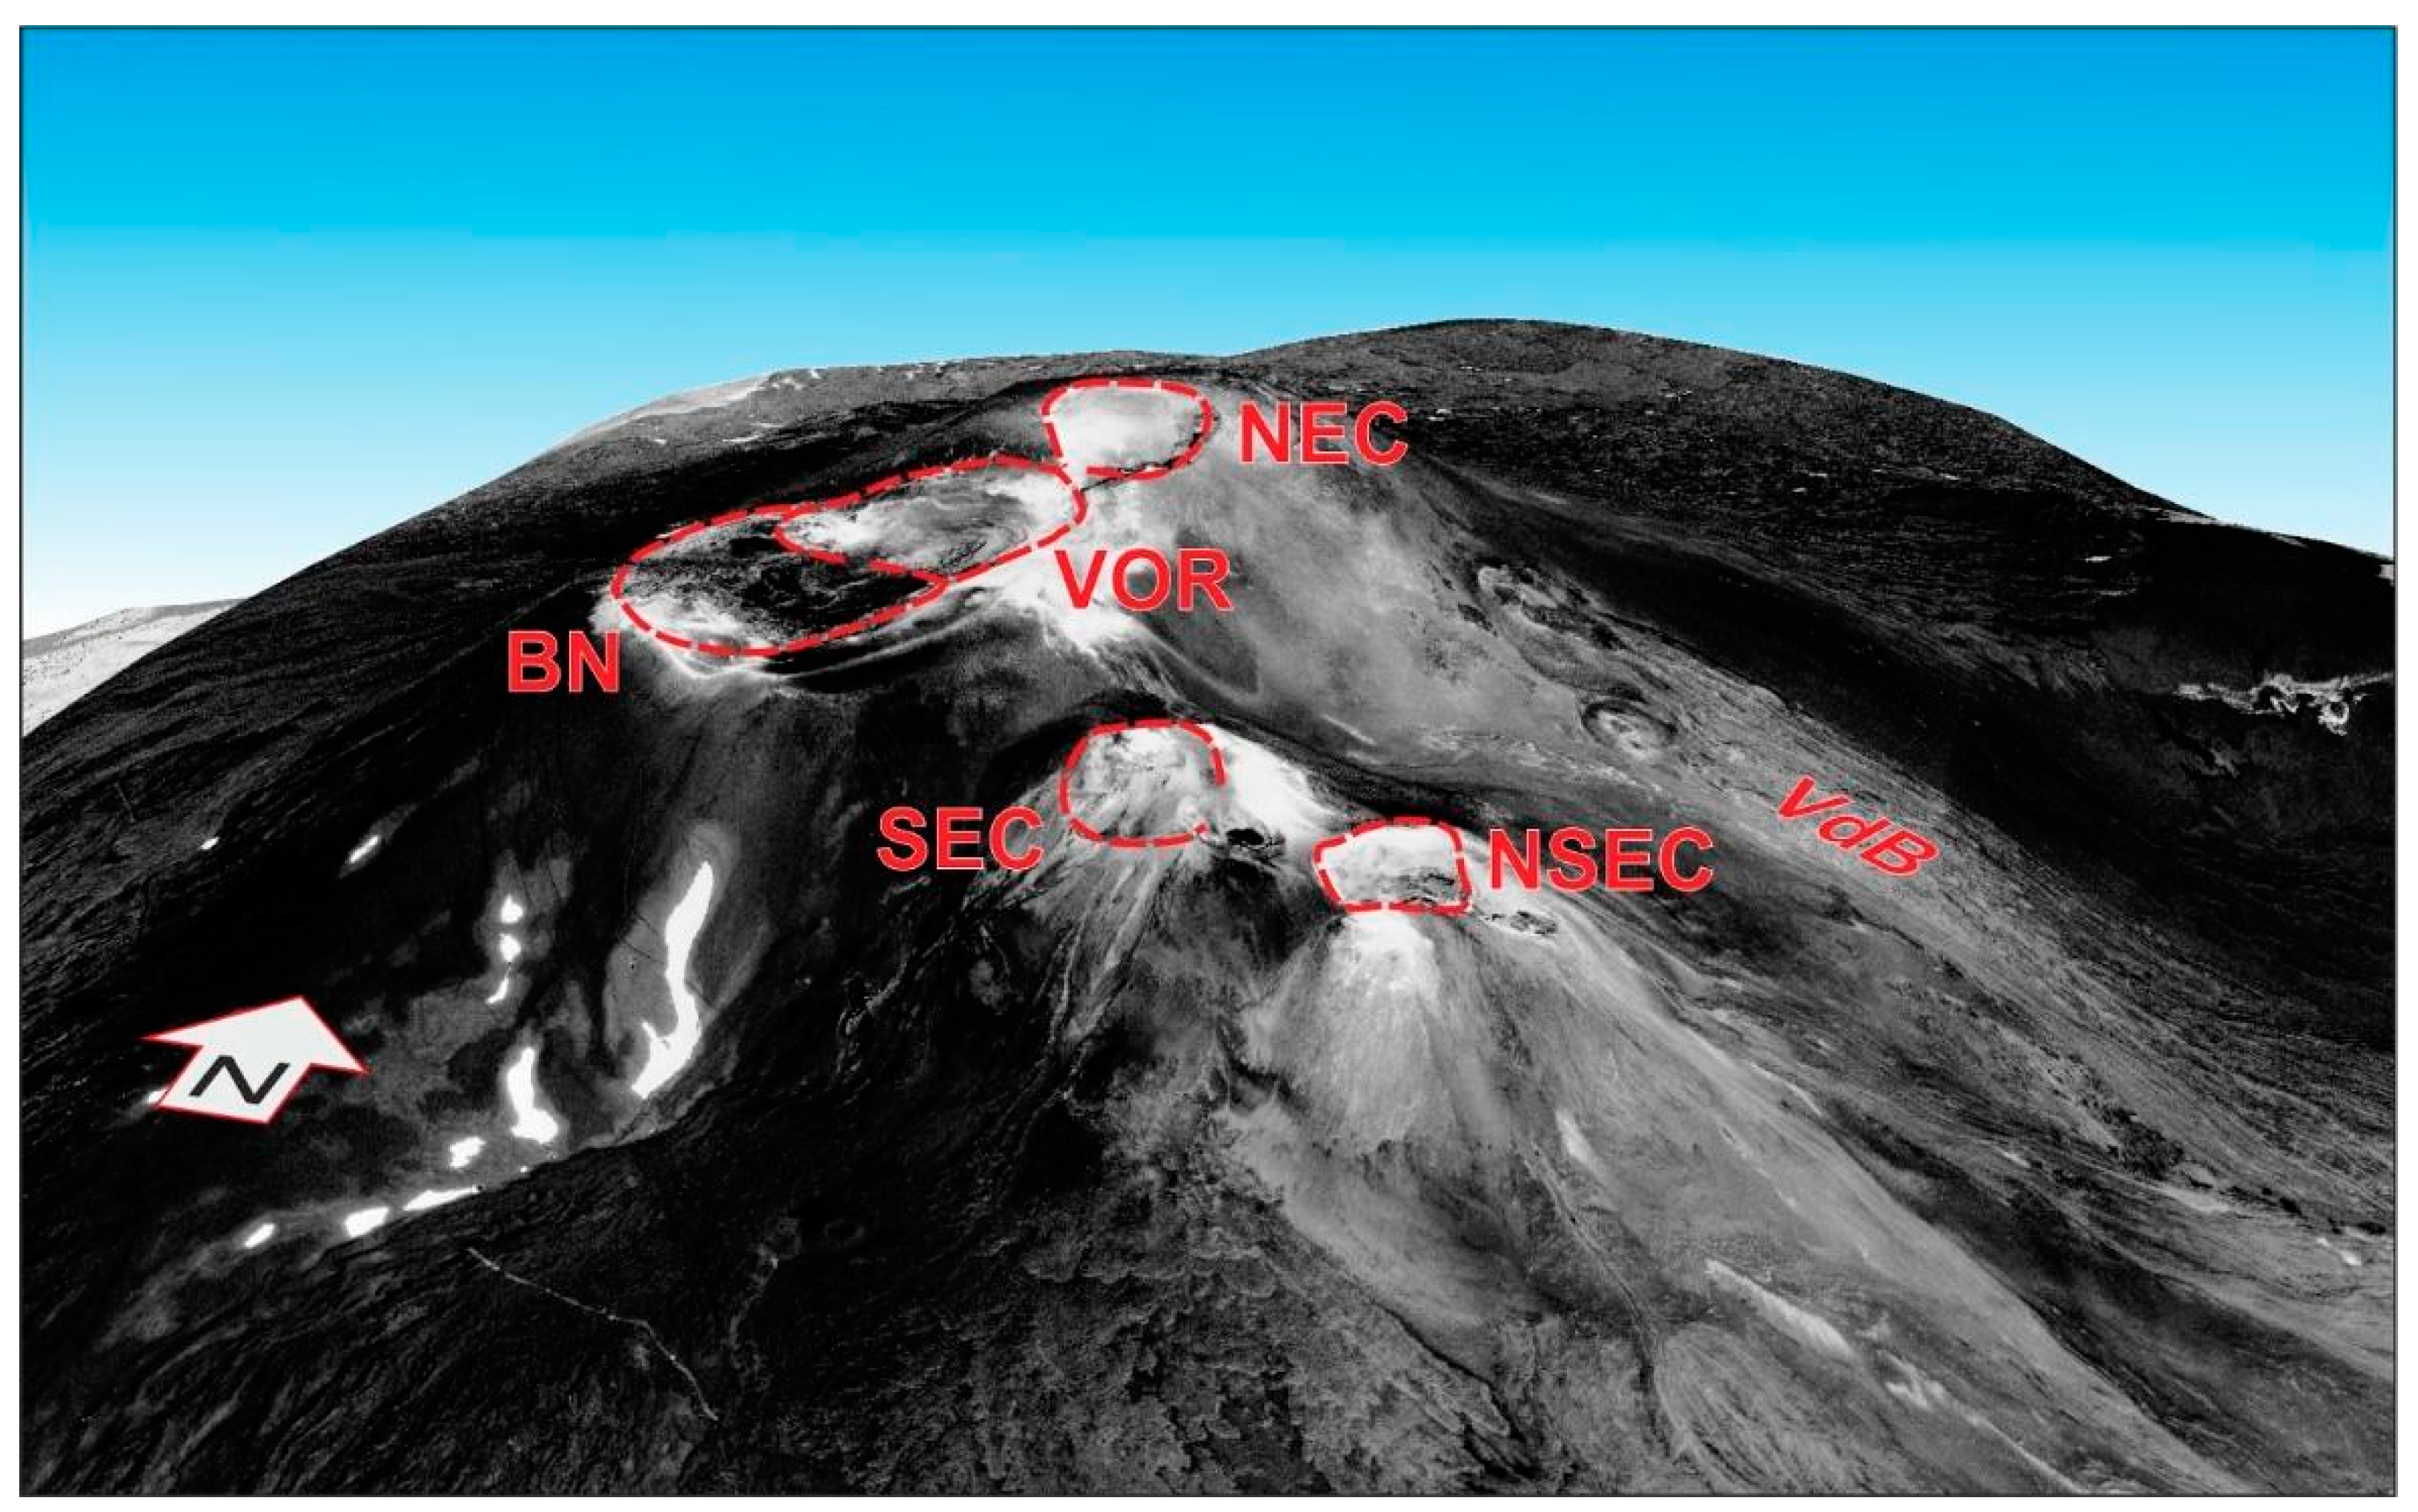
The Mt. Etna volcano is also one of the most active volcanoes on our planet. It erupts almost continuously, usually from its four summit craters (
Figure 2), named Voragine (VOR), Northeast Crater (NEC), Bocca Nuova (BN) and Southeast Crater (SEC), where, since 2011, a new cone has formed and rapidly grown on its eastern slope, named the New Southeastern Crater (NSEC) [
1]. Less frequently, magma rises up from lateral fissures and eruptions occur at lower altitudes on the volcano’s flanks, producing more hazardous lava flows for those villages and rural areas surrounding the volcano.
Eruptive activity at summit craters is usually characterized by strombolian activity of varying intensity, up to the more energetic fire fountains and high-energy paroxysms.
2. The December 2015 Activity
Before the 2015 events, eruptive activity at Etna consisted of a series of paroxysmal episodes at NSEC, which produced 50 lava fountains from 2011 to 2014. Conversely, after several years of mainly degassing activity, starting on 3 December 2015, the VOR crater underwent an extraordinary sequence of four very energetic paroxysms until December 5. Such a rapid sequence of such powerful events was never observed before on Etna, especially if considering that, in the short period of time between 2 and 18 December 2015, all the four summit craters produced explosive activity. The most powerful event was the first one, while the following three events showed a decreasing energy. All showed the same pattern starting from strombolian activity and rapidly evolving to lava fountains in a few minutes, producing very high lava fountains, launching incandescent clasts to more than 3 km above the crater rim and producing an eruptive column reaching 14 km a.s.l., then decreasing again to strombolian activity before ending [
2]. In detail, on 3 December, at about 02:00 UTC the explosive activity at the Voragine crater was characterized by a very fast increase in the initial strombolian activity, which at about 2:40 UTC culminated in a lava fountain (I episode) lasting 90 min, reaching a maximum height of the lava jet thrust of 4100 m above the vent [
3], and then gradually passed again to strombolian activity. The same sequence was recorded twice on December 4; the lava fountains occurred at 9:15 UTC (II episode ca. 80 min) and at 20:30 UTC (III episode with a duration of 90 min). Finally, in the early afternoon of December 5 from 13:30 UTC, a slower increase in explosive activity was observed at the VOR crater, switching to fountain activity at about 15:00 UTC for ca. one hour and a half (IV episode). The entire sequence at VOR ended with the last episode in the afternoon of December 5, lasting only 38 h, followed by weak strombolian activity and short lava flows from NSEC until 8 December. Authors in [
2] estimated a volume for pyroclastic deposits of about 7.1 × 10
6 m
3, resulting in an average of about 1.8 × 10
6 m
3 erupted during each paroxysm.
Such a violent eruptive phase, characterized by a sequence of paroxysms ranging from lava fountains to sub-plinian explosions, are not uncommon. In the first half of 2000, Mt. Etna generated 66 paroxysmal episodes [
4] from the SEC, while the VOR crater produced less but very powerful activity, a sub-plinian eruption in July 1998 [
5] and another very strong paroxysm one year later, in September 1999 [
6]. Between 2011 and 2015, Mt. Etna saw more than 50 paroxysmal episodes from its summit vents. Furthermore, these kinds of eruptions have also been observed on other basaltic volcanoes, from the first observations and studies of Pelèean eruptions at Manam (Papua New Guinea) in the 1960s to the more recent sequences at Kilawea (Hawaii) in the 1980s or at Fuego (Guatemala) in 2018.
3. Materials and Methods
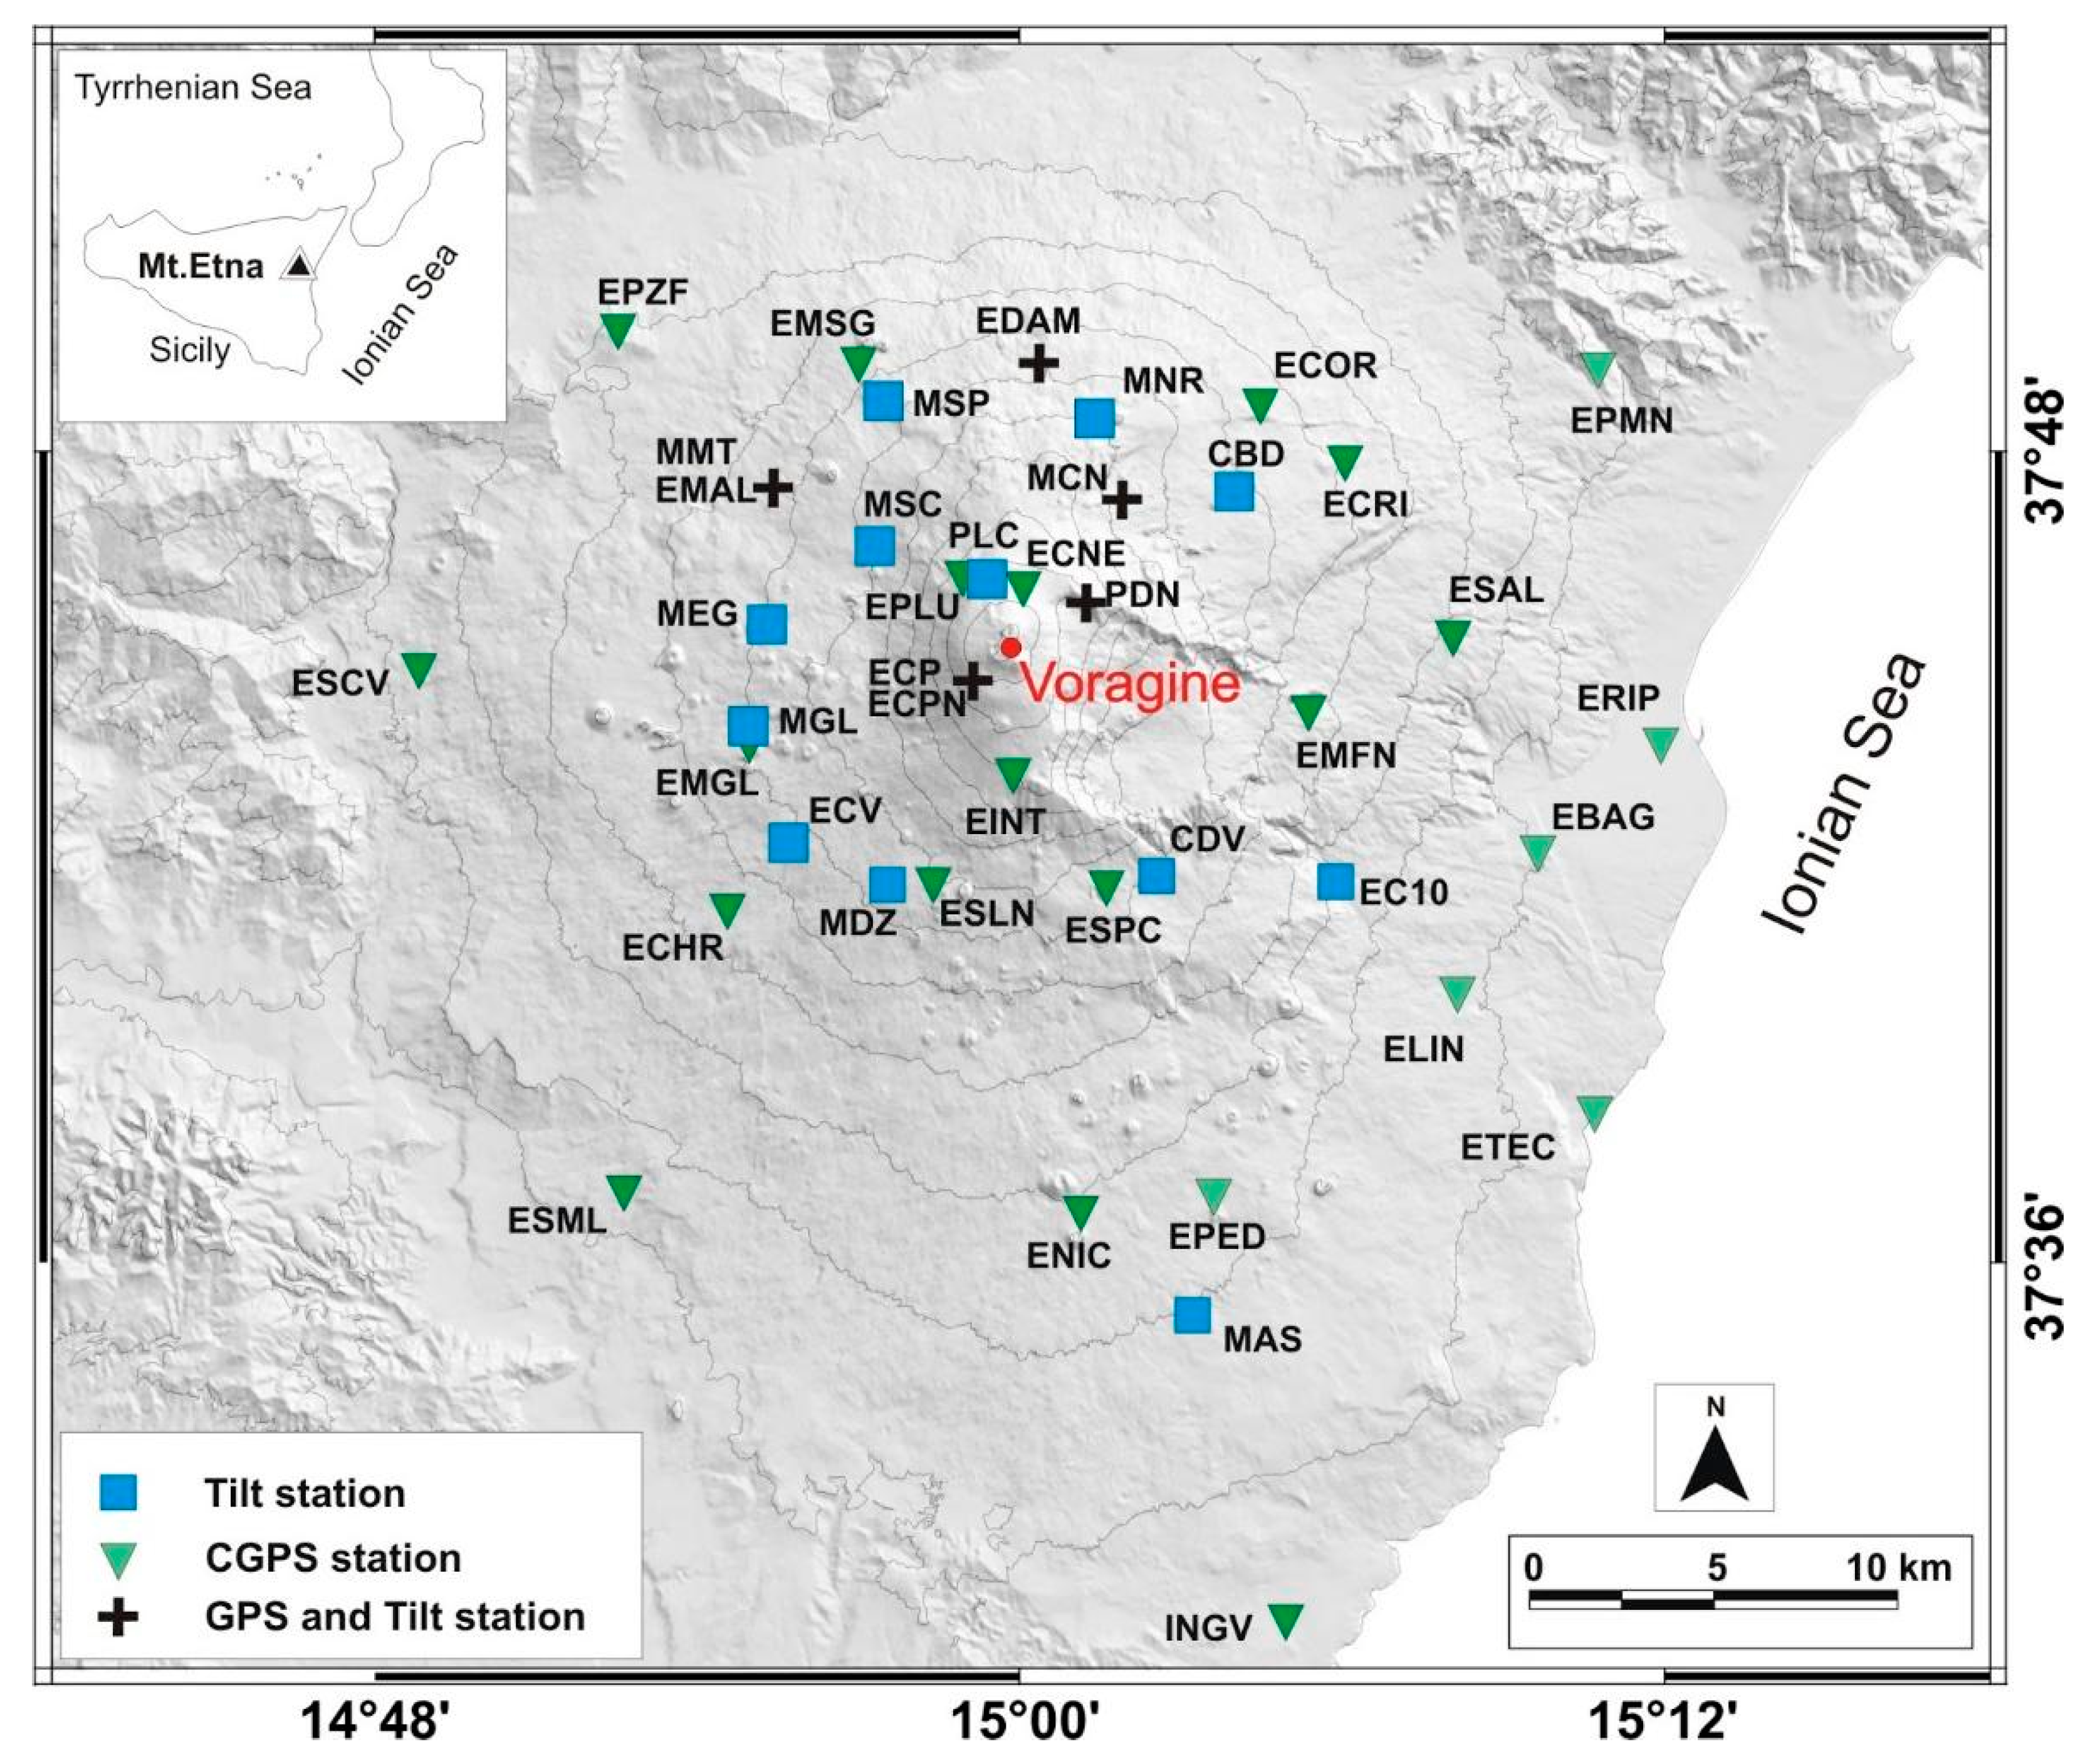
To perform our analysis of the source feeding such a violent crisis on Etna, we exploited the multi-parametric dataset coming from the permanent ground deformation networks on the volcano (
Figure 3) and the DInSAR images pair acquired across the entire eruptive period by the ESA Sentinel-1 satellite.
3.1. Tilt Data
On Mt. Etna, surface local inclination variations are continuously monitored by using instruments able to detect tilt changes with high-precision data.
In December 2015, the Mt. Etna permanent tilt network consisted of 14 borehole instruments and a long-base device (PDN,
Figure 3). Over the last ten years, INGV improved the network through the installation of sensors at greater depth: currently, eight stations are at 27–30 m depth and six are 10 m deep, including three summit stations.
The deeper stations use biaxial self-leveling instruments with very high-precision (10
−8–10
−9 radians) electrolytic bubble sensors for measuring the angular movement and magnetic compasses that are able to detect tides. Almost all stations have a sampling rate of 1 min. A description of the tilt instrumental characteristics is provided by [
7,
8,
9].
Continuous tiltmeters recorded variations during the four fountain episodes occurring on 3–5 December 2015. Tilt changes during the first, most powerful lava fountain were recorded at all the stations showing values comprising a few tenths to a couple of microradians with a mean value of 1.1 (
Figure 4). The magnitude of episode II was slightly lower (mean value of 0.85 microrads), while the successive episodes had a significantly smaller amplitude (mean values, respectively, of 0.5 and 0.35 microradians).
The first change occurred on December 3 at about 02:30 UTC and all the four episodes showed a mean duration of about 1 h. The pattern of the ground tilt was the same for each event, even if its magnitude decreased from the first to last episode, evidencing similar sources (
Figure 4). At the end of the entire sequence, the tilt showed the same trends as before the fountains.
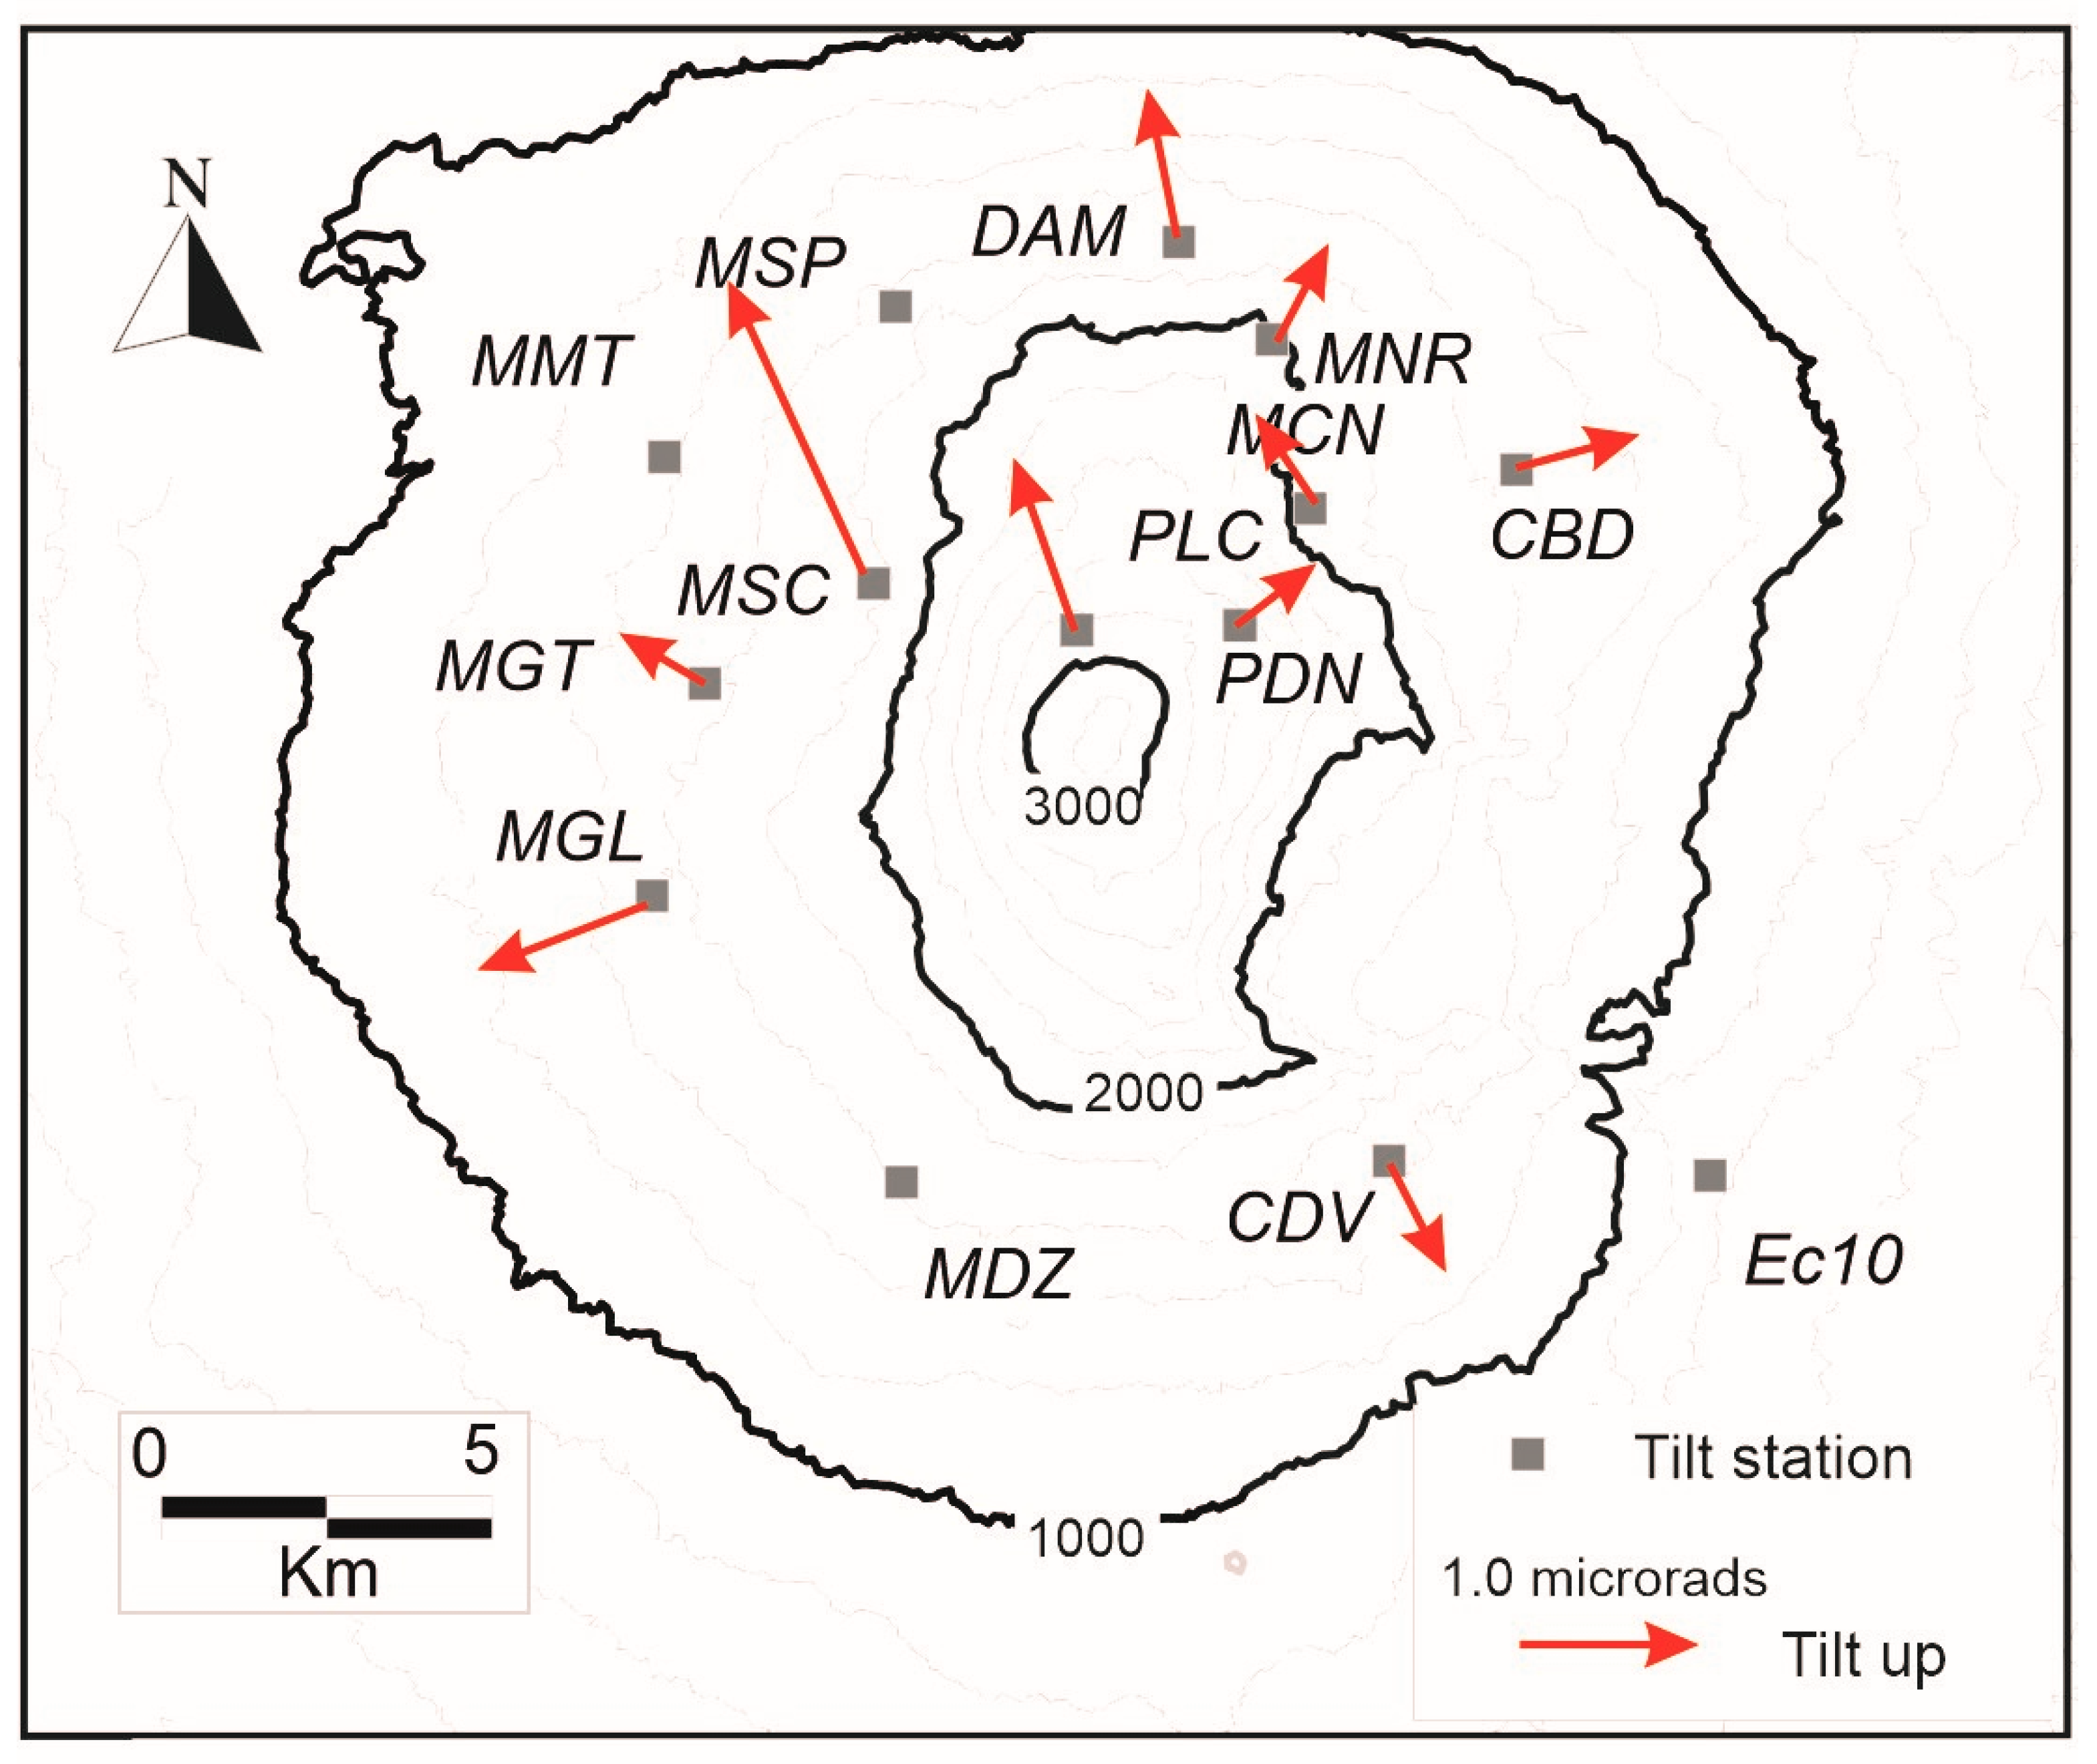
The tilt vectors showed a general lowering toward an area positioned just west of the Mt. Etna summit (
Figure 5), suggesting a repeated occurrence of deflation processes.
3.2. GPS Data
Geodetic monitoring on Etna started early in the 1970s with pioneristic trilateration networks; since then, a continuous evolution of methods and technologies has led to the current configuration and complexity designed for several applications and studies at different space and time scales [
10,
11,
12]. Now, with its 39 permanent stations, the Etnean GPS network is one of the largest deployed on an active volcano (Etn@net, [
13]). For surveillance purposes, most of the stations are acquired every second and processed in real-time at high-rate (1 Hz) by using the epoch-by-epoch algorithm of Geodetics
® RTD software package [
14].
High-rate GPS time series contain both systematic errors (e.g., multipath) and unmodeled stochastic noise, which can be in the same order of magnitude of the displacement signal. In this study, we applied an ad-hoc strategy in order to minimize the noise level of the time series. To this end, the high-rate data from continuous GPS stations belonging to the INGV Etnean GPS network were processed in kinematic mode (which means assuming that the station is continuously moving) by using three different algorithms: (i) precise epoch-by-epoch solutions [
14], by using the Geodetics RTD software which provides independent estimates of positions for each epoch of dual-frequency; (ii) Precise Point Positioning (PPP) solutions [
15] by using the GIPSY software; and (iii) differential phase kinematic [
16] by using the TRACK software [
17], which uses the ionosphere-free LC observable double-differences with respect to nearby fixed stations. All the available raw GPS data were decimated at 30 s and the solutions were sub-sampled with medians in windows of 10 min. As a reference fixed station we chose ENIC (see
Figure 3).
To highlight the displacement signals in the noisy time series of GPS components, we calculated the baseline variations; this allowed us to significantly reduce common sources of noise (e.g., atmosphere, constellation geometry, etc.) which were predominant in the high-rate GPS data. In order to enhance the useful variations against the background noise and to further reduce the geodetic correlated noise, we combined the obtained time series from the different processing software by a weighted mean optimized to minimize the resulting associated uncertainties [
18]. This can be obtained by considering the inverses of estimated variances as weights (covariance matrix is also provided in the
Supplementary Material).
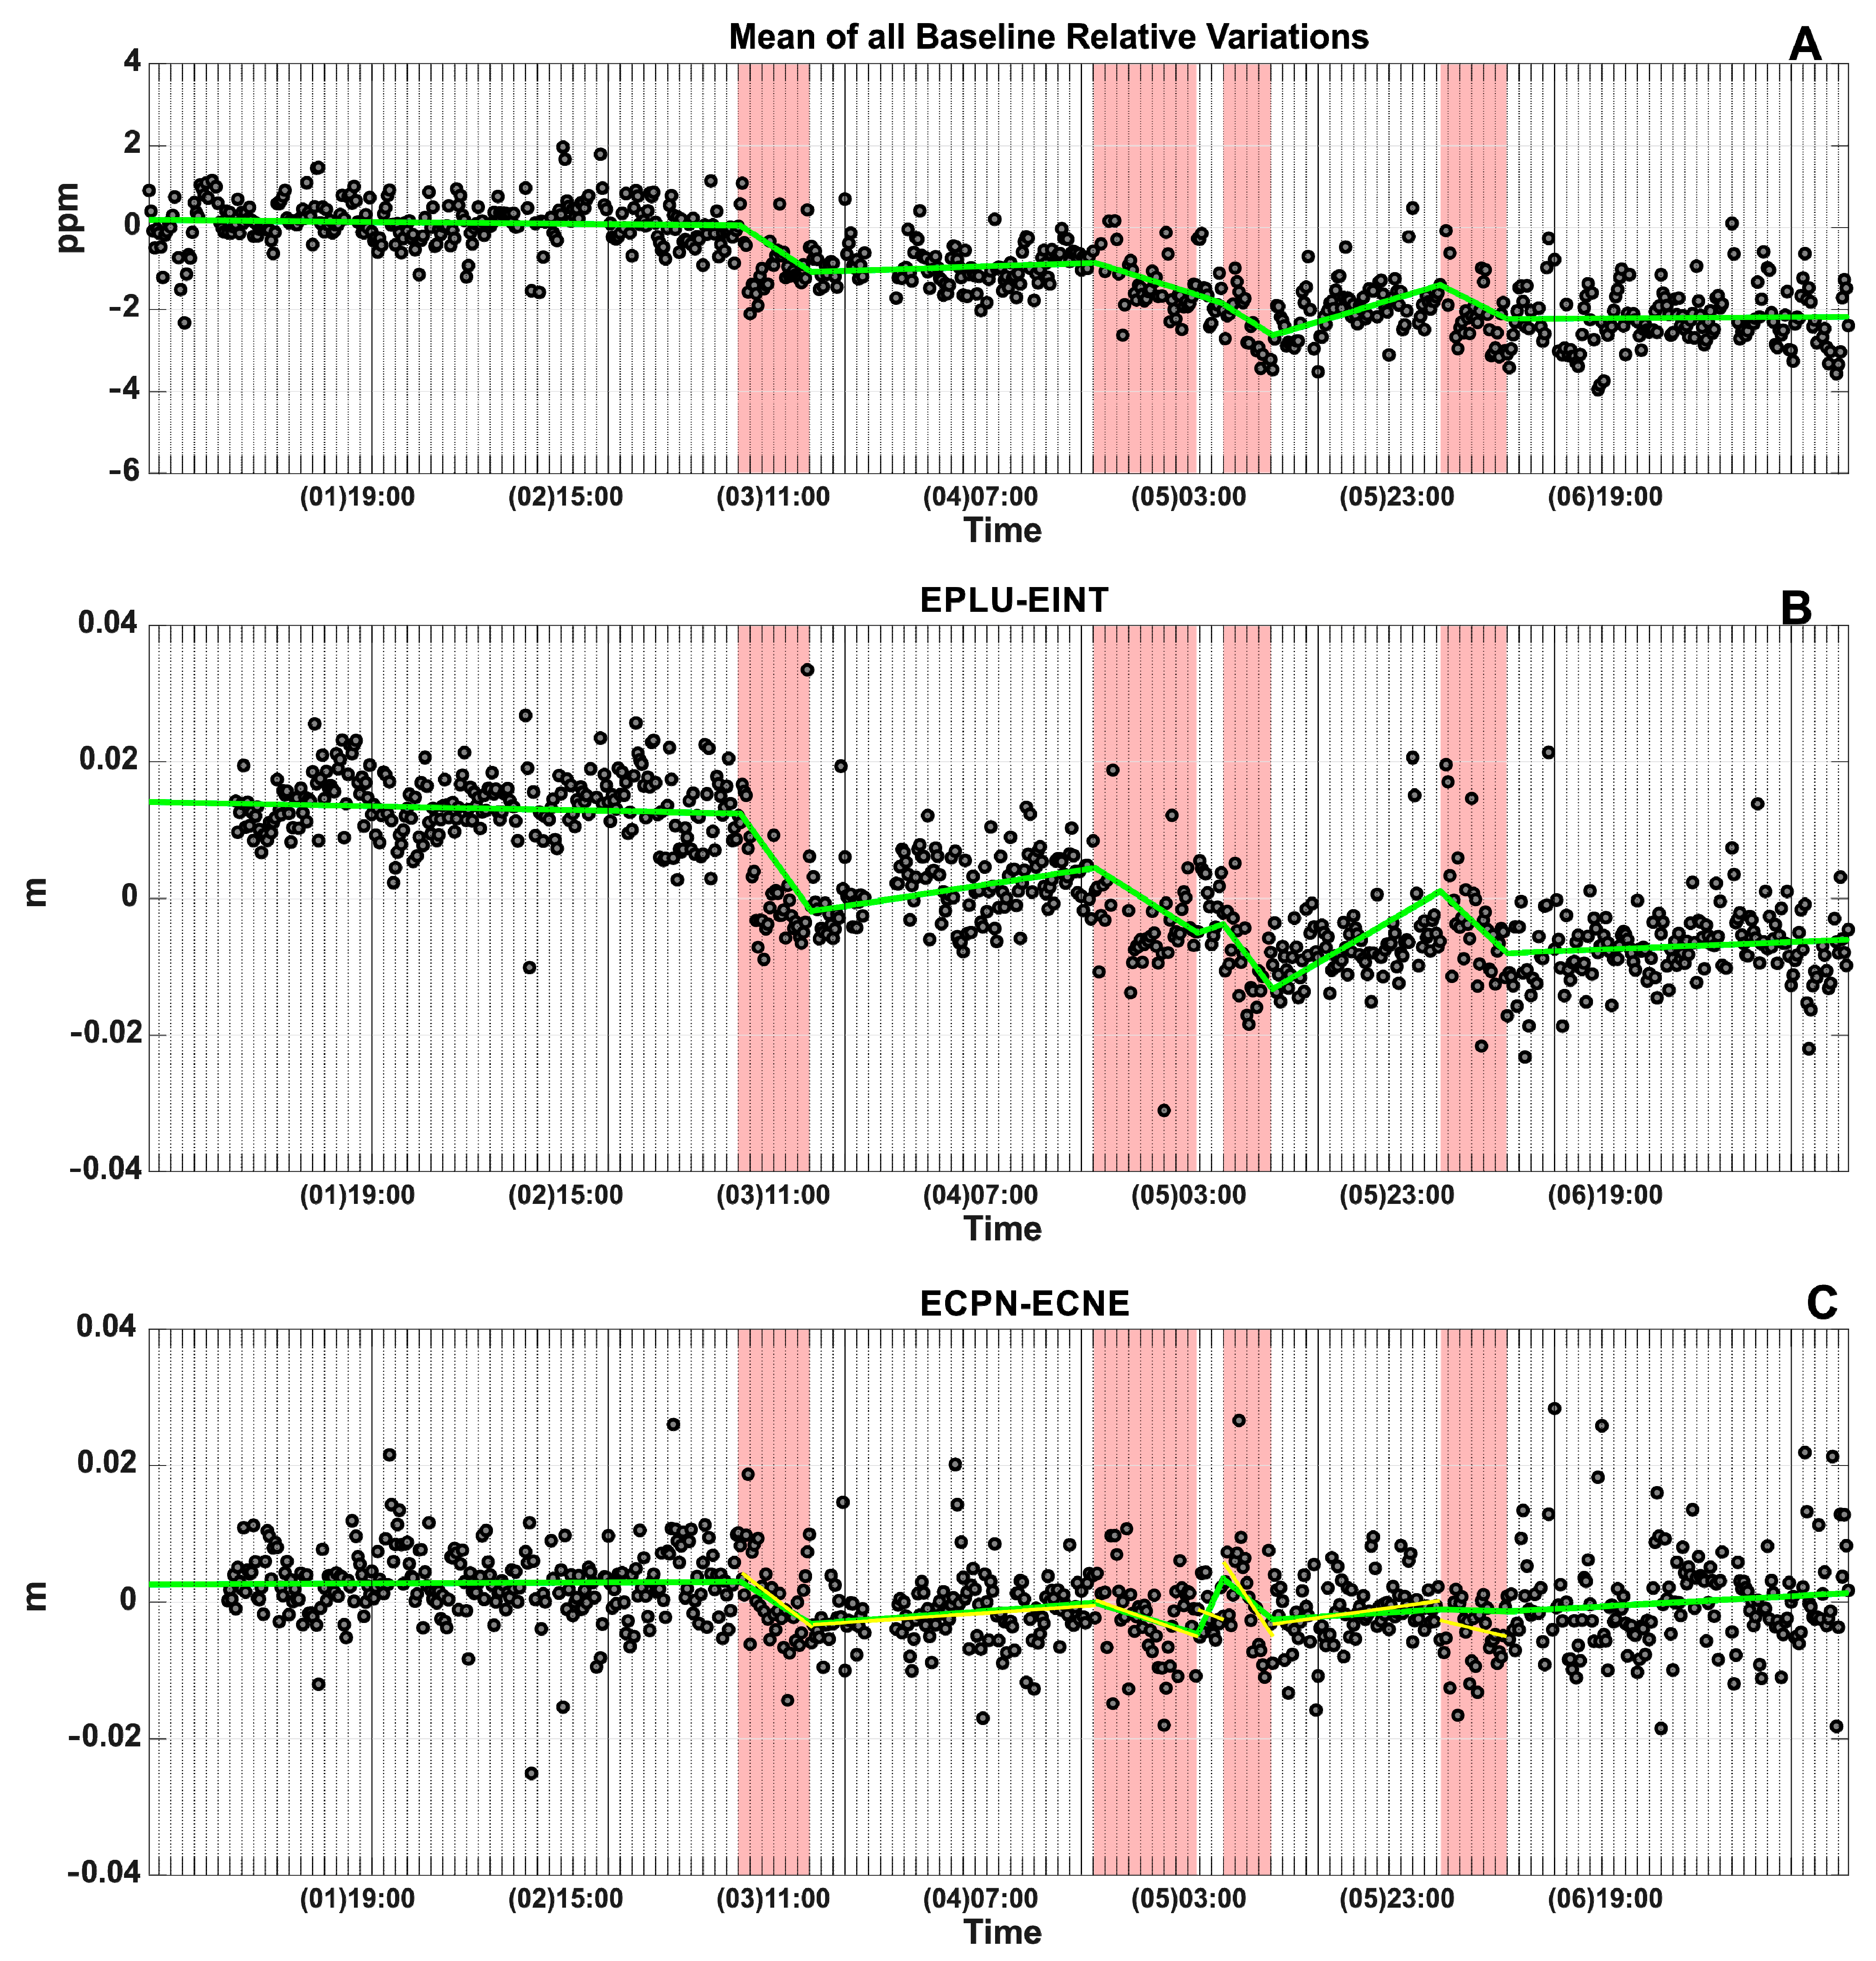
Figure 6 shows the time series calculated as the mean of all the considered baseline relative variations, expressed in parts-per-million (ppm). To estimate the displacements and their associated uncertainties, a piecewise linear regression was carried out on the baseline time series. The choice of using a piecewise line to infer the slopes followed a physical time continuity. The break points for the segmented line were set to the beginning and ends of the paroxysms. A robust regression algorithm [
19] was applied, by which the piecewise regression line was made to fit the data set as closely as possible while minimizing the sum of squares of the differences.
To verify the stability of the regression results, we tried to linearly fit independently the episodes (e.g., yellow line in
Figure 6C). It is worth noting that the variations are quite similar and comparable with the ones obtained by piecewise regression. The only discrepancy with our approach is the period in between the second and third paroxysms when the independent linear fit does not show the same positive step as in the piecewise line. However, this does not affect the coherent deflective behavior during the third paroxysm.
To infer the sources, we considered the total variations of the regression lines in the eruptive periods.
Figure 6 shows that the eruptive periods were characterized by a shrinking, albeit small, of the baselines crossing the summit area. This indicates a contraction of the volcano edifice. The deformation strength was higher for the first event than for the last one, indicating a progressive decay of the eruption energy. In some cases, it is possible to also see a small inflation phase prior to the eruptions (a lengthening of some baselines crossing the summit area).
It is worth noting that such variations are within the error bars of the data; nevertheless, they are coherent among the baselines and follow the expected volcanic behavior, thus can be considered reliable for a source estimation.
3.3. DInSAR Data
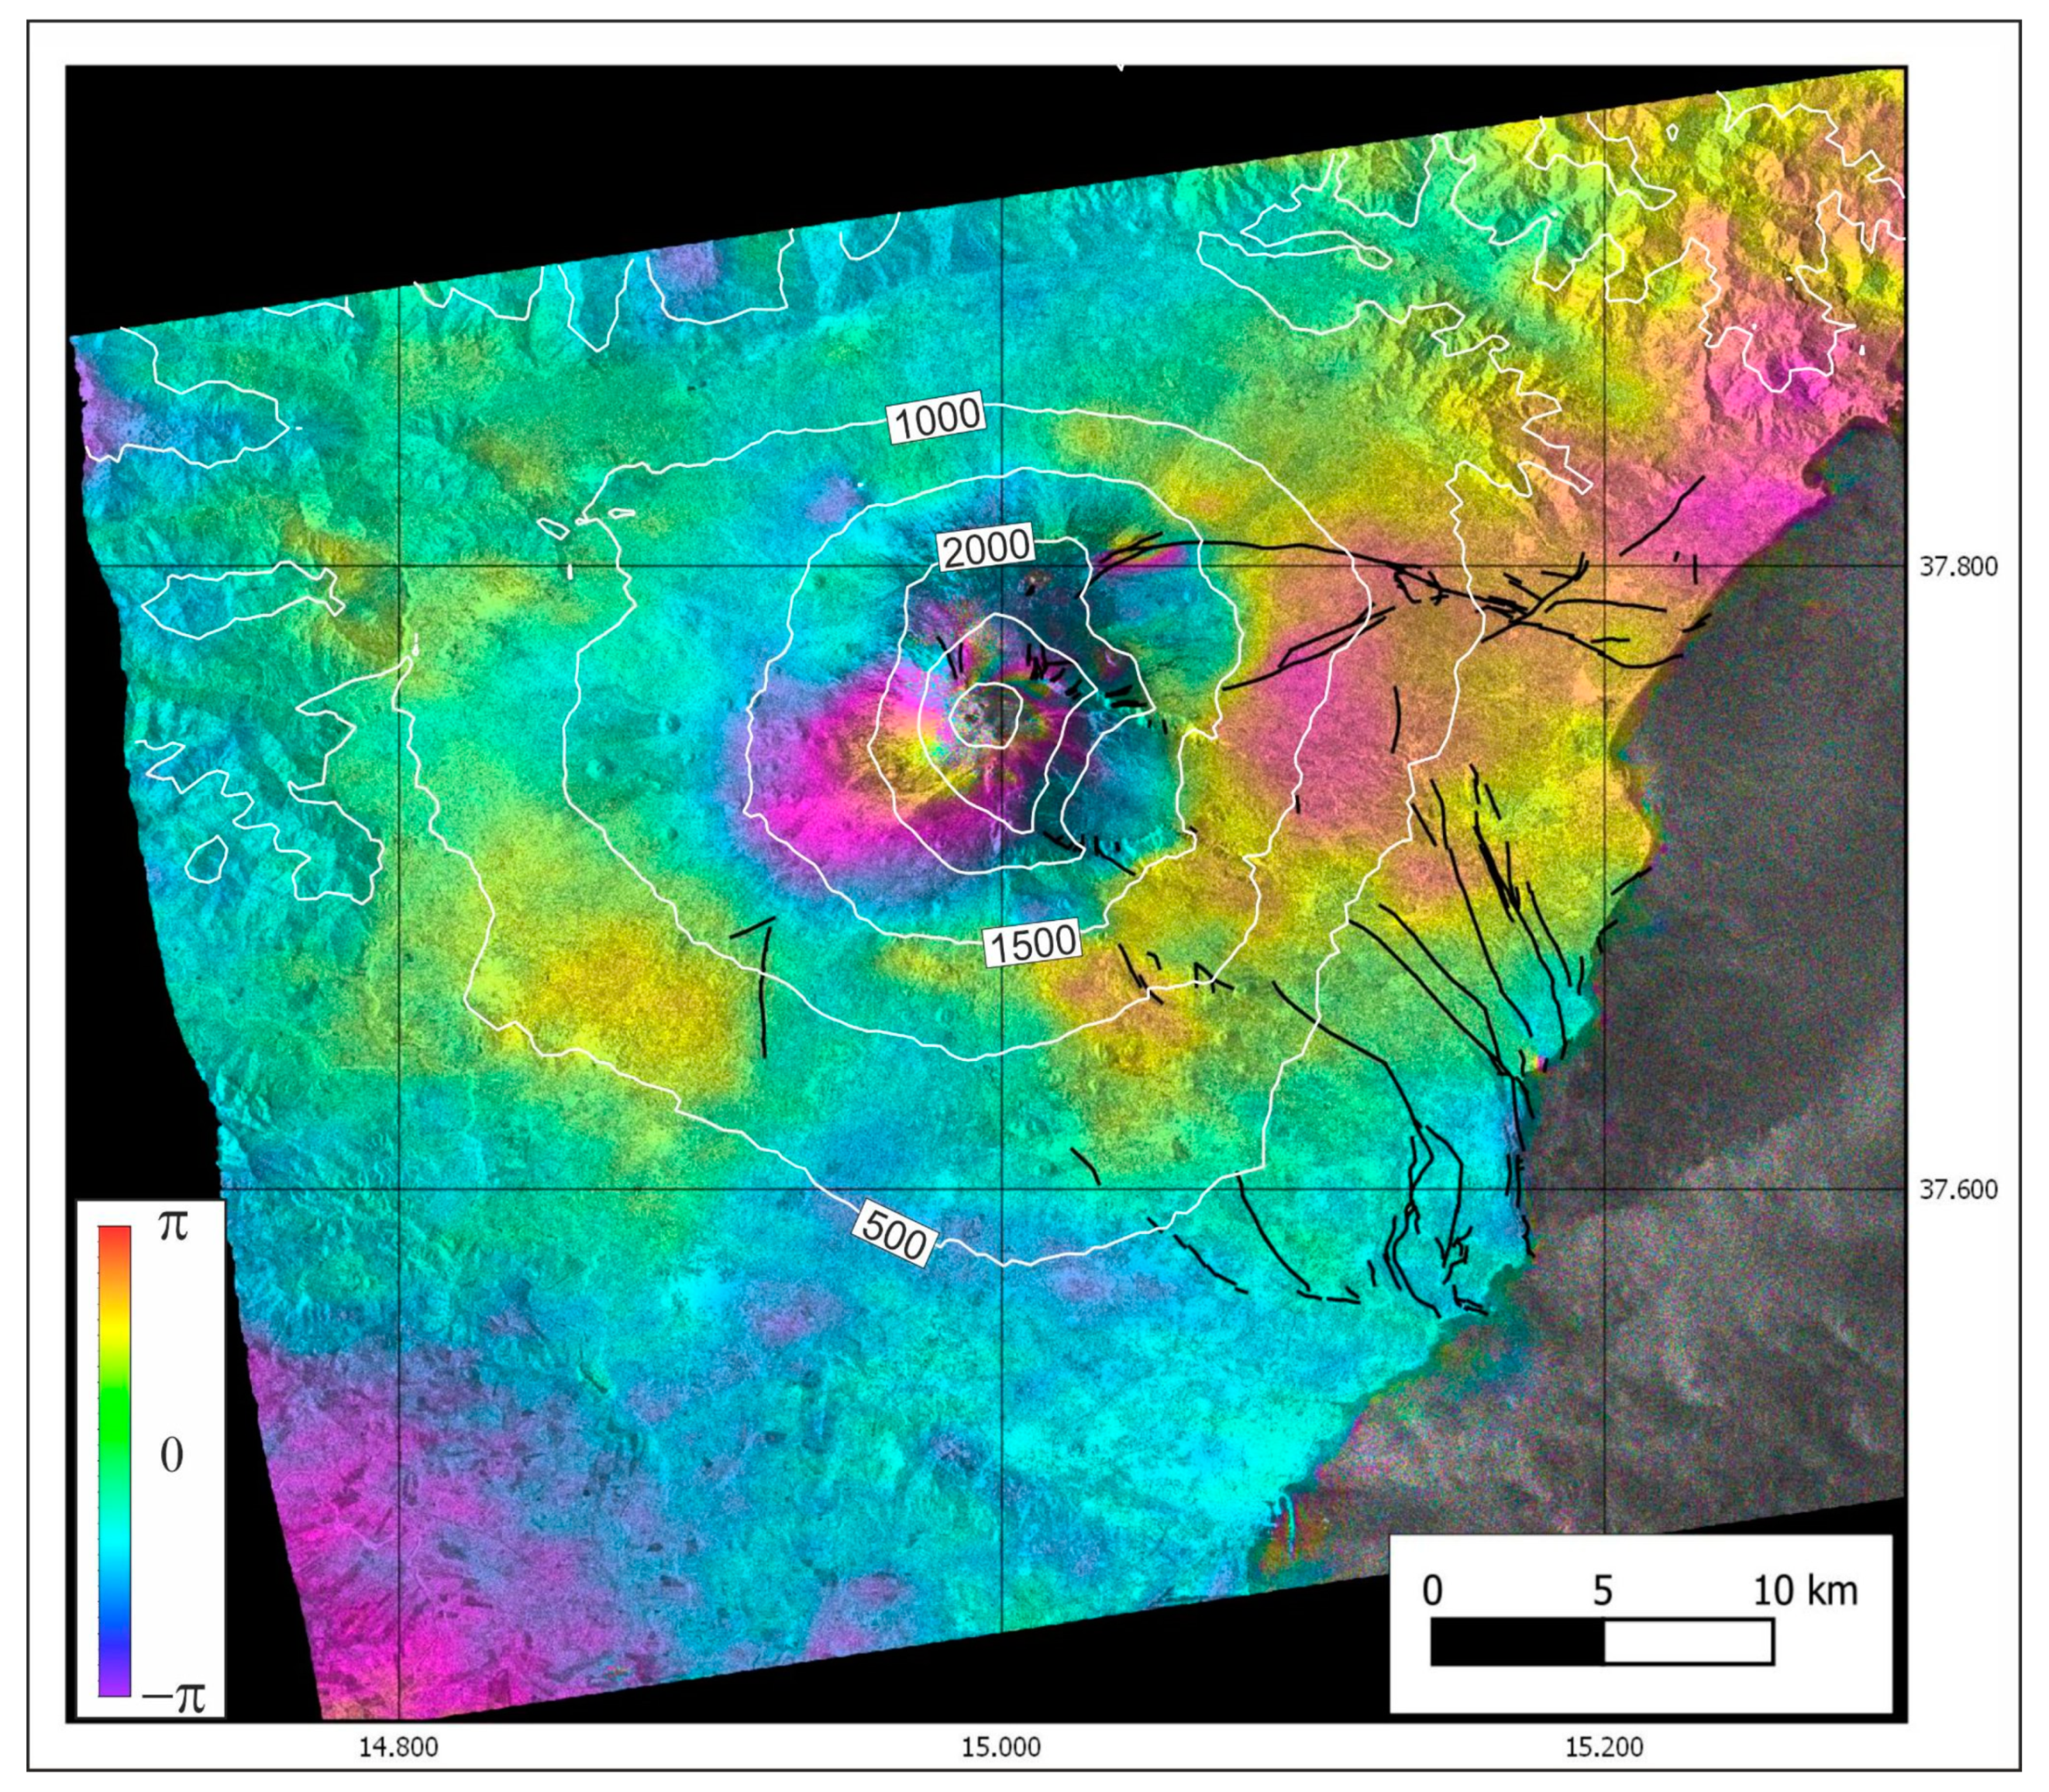
Sentinel 1A SAR (Synthetic Aperture Radar) images were acquired in TopSAR (Terrain Observation with Progressive Scans SAR) Interferometric Wide mode, during ascending orbit over Mt. Etna on December 2 and successively on the next ascending pass on December 14, after the four paroxysms occurred. The differential interferogram (DInSAR) combining the two subsequent passes, encompassing the entire eruptive activity at the central crater, was processed with the GAMMA software, and in order to remove the topographic phase, a Shuttle Radar Topography Mission (SRTM) Version 4 digital elevation model with 3 arc-sec resolution was used, and is shown in
Figure 7. This interferogram is very useful to draw the total cumulated ground deformation pattern affecting the volcano after such a violent eruptive phase. The interferogram clearly shows that, from December 2 to 14, the entire upper part of the volcano moved away from the satellite, meaning that it moved downwards and/or eastwards (the satellite views from the west with an incidence angle of about 38° from the vertical). The downwards and eastwards movement of the ground is more evident on the upper western side of the volcano, while on the eastern side, the downwards movements could be partially compensated by a westward one, coherently with a deflation/contraction pattern.
Another small area showing local deformation is detected by DInSAR on the middle NE flank of the volcano, related to the uppermost part of the well-known Provenzana-Pernicana fault system [
20,
21] that was affected by a seismic swarm on 8 December 2015, following the abrupt deflation produced by the four eruptions. Additionally, in this area, the ground deformation pattern, moving away from the satellite on the southern side of the fault (hangingwall), reveals a downwards/eastwards ground motion, in agreement with the usual oblique normal and left-lateral displacement of this fault system, clearly related to the flank dynamics of the volcano [
22,
23,
24,
25].
3.4. SISTEM—DInSAR and GPS Integrated Data
To estimate the total deformation occurring at the volcano during the entire crisis, we produced a high-resolution map by integrating the DInSAR data with the GPS displacements, calculated through PPP (Precise Point Positioning) processing by the GIPSY-OASIS package on a daily basis over the same InSAR time window. This processing is independent and widely different from the high-rate (HR) one, not only due to the different observation times but also being performed on daily standard RINEX (Receiver INdependent EXchange) data, decimated from the original 1 to 30 s rate, processed in static mode to achieve a unique, precise and not-moving solution for each day. 3D GPS and 1D/LOS DInSAR displacements were integrated by the SISTEM algorithm [
26], a software that allows the complete integration of different ground deformation datasets in order to calculate, point-by-point with the DInSAR ground resolution, the 3D components of the ground motion over the 12-day period covered by DInSAR data. In this way, an integrated map can be produced, similar to an interferogram for spatial resolution but containing, for each pixel, the 3D motion of the ground (instead of the LOS component of the DInSAR image).
The main source of error of the DInSAR measurements is due to atmosphere noise, especially related to the strong topography at Etna (often more than a fringe from base to summit, see [
27,
28] and references therein). For this reason a preliminary step, before their use, is the validation-correction of the DInSAR data with GPS and/or other independent measures. The SISTEM algorithm not only integrates but also simultaneously validates the DInSAR data with GPS by taking advantage of the positive features of both these techniques, i.e., the high spatial resolution of the DInSAR and the 3-D measurements and subcentimeter accuracy level of the GPS. This integrated and cross-validated information is able to give a more reliable interpretation of the geophysical phenomena producing ground deformations.
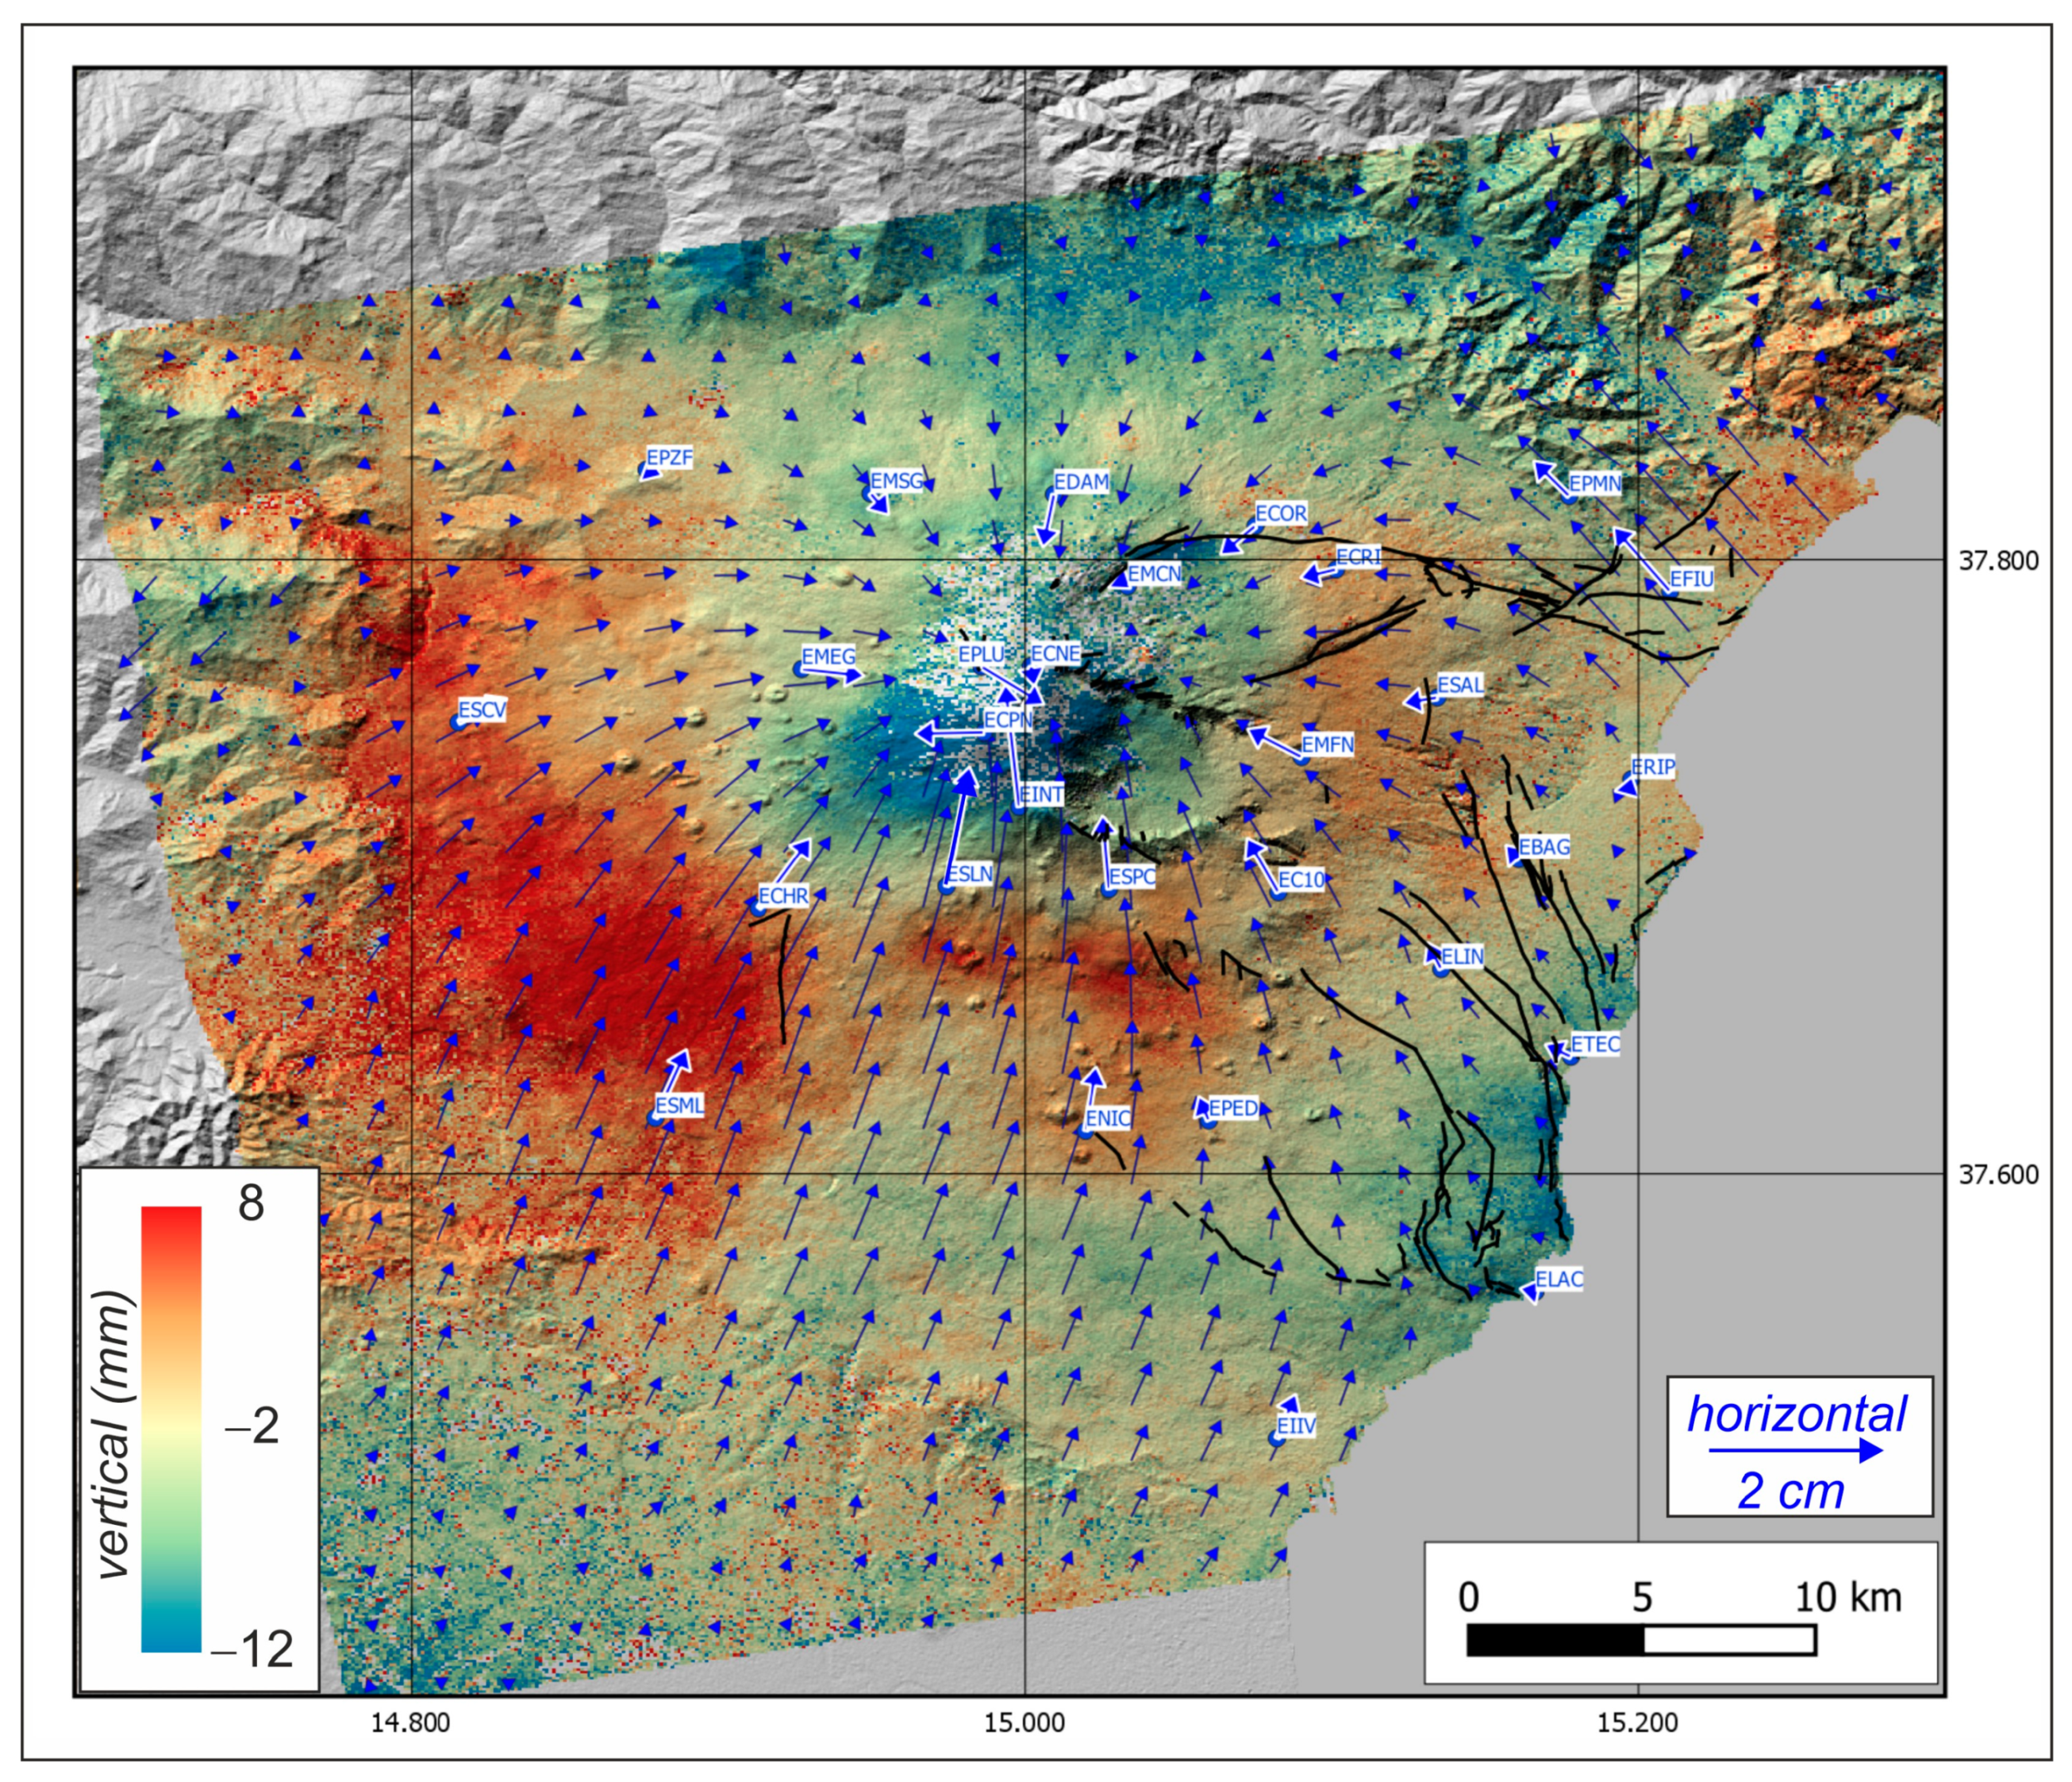
The general pattern evidenced by DInSAR data (
Figure 7) is mostly coherent with the deformation highlighted by the 12-day GPS displacement pattern (thick arrows in
Figure 8), both evidencing, even with different resolution and completeness of information (1D but high-resolution for InSAR and 3D but low-resolution for GPS), a contraction of the volcano. The integration of both datasets (thin arrows and colors in
Figure 8) images a general deflation of the edifice well, especially evident on its western and southern slopes. The match between the integrated and original observed GPS and DInSAR datasets has been checked and validated for looking at possible artifacts. Results of the validation process evidence a mean difference between observed GPS displacements and SISTEM displacements at GPS points of about 1–1.5 mm (abundantly within the GPS errors) and differences within 5 mm for most of the DInSAR interferogram (figures GPS vs. SISTEM and SAR vs. SISTEM provided in the
Supplementary Materials). The main deflation seems to affect the upper part of the volcano, above 1700–1800 m a.s.l. (in agreement with the interferogram, see
Figure 7), which shows an evident radial contraction and a subsidence of the ground.
A slight uplift is visible at a lower altitude, on the western and southern slopes. This particular feature lets us suppose that two dynamics occurred in the 12-day interval encompassing the four fire fountains sequence: the rapid depletion of the feeding system, related to the four eruptions and leading to the summit deflation with, probably, a simultaneous pressurization of a deeper source, producing a wider uplift, visible at the volcano periphery, where it is not masked by the local deflation. These wider and, reasonably, deeper dynamics cannot be investigated here, due to the superimposition of the much stronger deflation; it needs more data, covering also longer and different time windows, to be constrained and it is beyond the scope of this study.
4. Modeling
We used high-rate measurements from both GPS baselines and tilt variations to estimate the causal sources of each paroxysm and, then, the integrated 3D SISTEM ground deformation map to search for a cumulative source feeding the entire sequence. In this way we exploited the availability and potential of HR data showing the continuous and rapid deformation, even with a non-optimal signal-to-noise ratio, and the powerful integrated map, in terms of both spatial resolution and quality of the signal. This allowed us to identify the single-shot sources feeding each paroxysm and the entire feeding system involved during the whole sequence.
Among all the possible HR baselines, we chose the baselines that showed clear patterns, avoiding too-noisy baselines and redundancy (using a single GNSS site for at most two baselines).
To calculate the displacements and their associated uncertainties, we fitted the baseline time series with a piecewise linear regression line. The variations were calculated from the segments at the eruptive periods.
Similarly, the tilt variations in the same periods were considered in the joint inversion.
The analytical model adopted to fit the geodetic data was the finite spherical source model [
29] and we used the GAME software [
30] to invert the data, applying a hybrid approach of genetic algorithm and pattern search [
31]. The objective function was the sum of the squared model residues weighted with their associated uncertainties. The model parameter uncertainties were estimated by using a Jackknife approach [
30,
32].
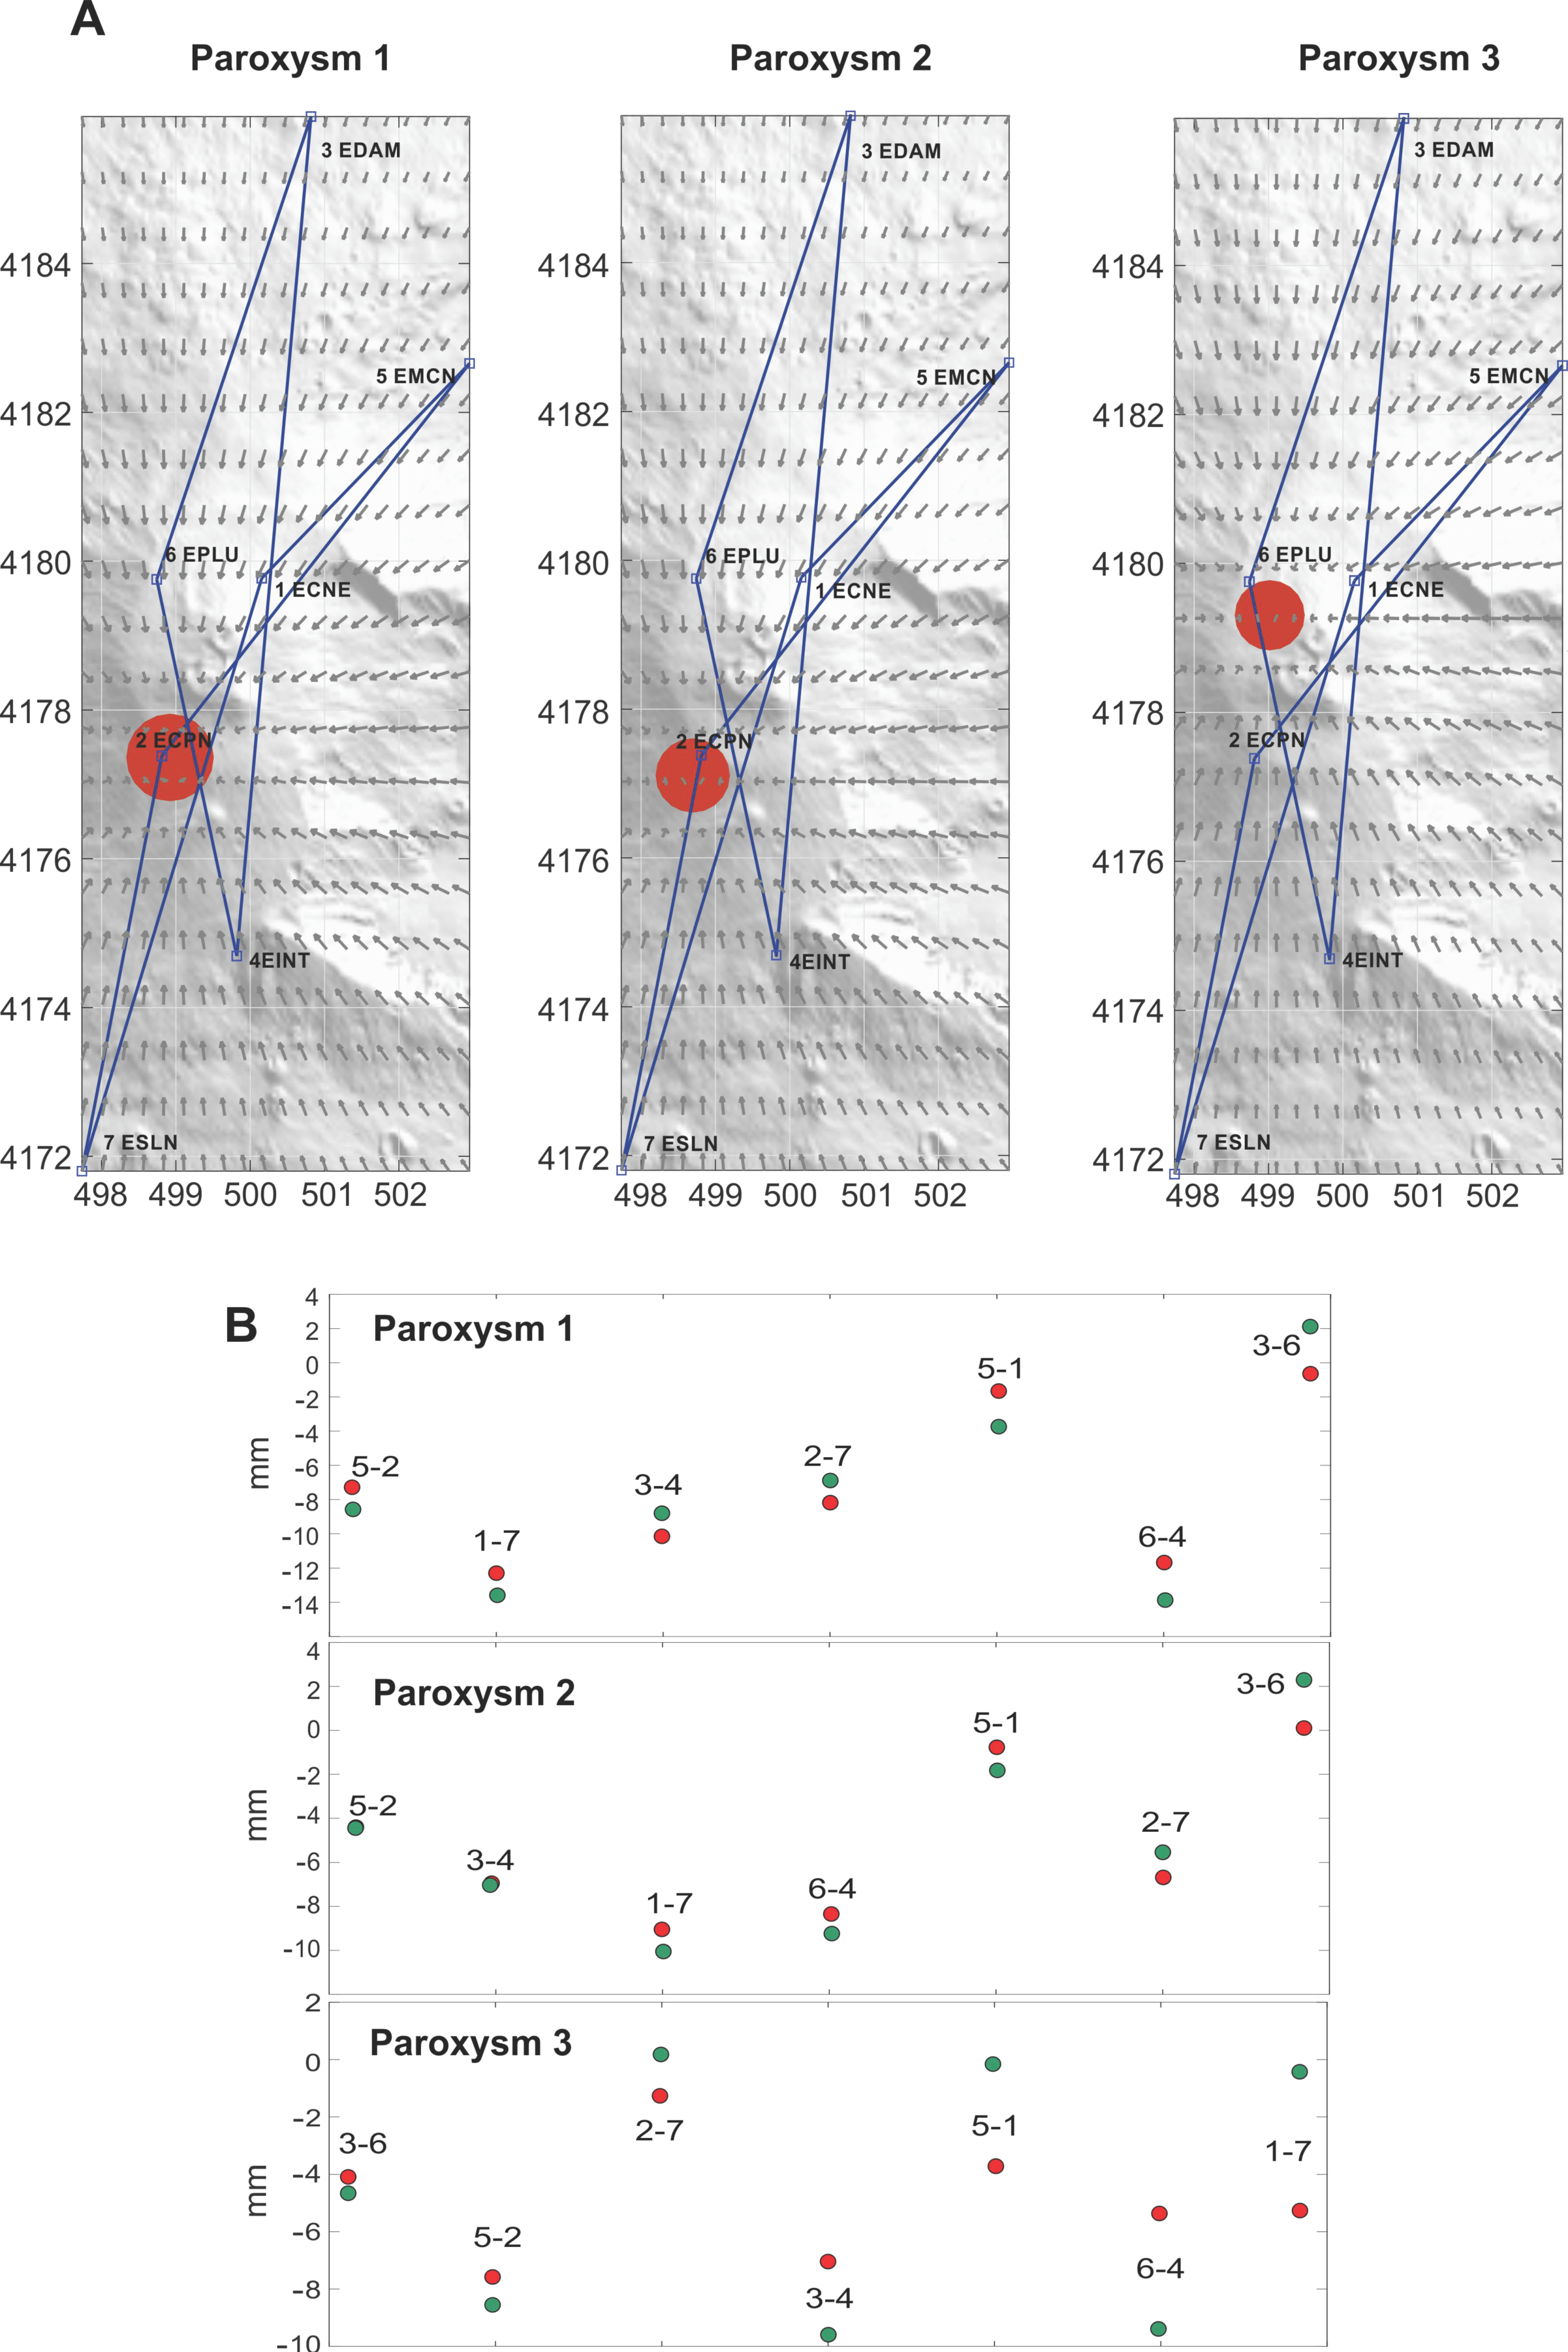
The resulting sources show similar depths and coherent horizontal positions (within the area of summit craters) as shown in
Table 1. The location of the source was very stable for the three paroxysms; taking into account the differences among the three solutions, the results clearly define a volume located at around 1.8 km depth beneath the summit craters area. The model fitting with the measured deformation data degrades as the energy of the eruption decreases; it is good for the first event, becoming just sufficient for the third event (see
Figure 9).
In fact, the first two, stronger, paroxysms are those with the strongest signal-to-noise ratio and this allows a better match between predicted and measured deformation. The third one shows a less-fitting modeled deformation, especially on baselines 6–4 and 1–7 (
Figure 9), due to a lower signal-to-noise ratio in the deformation data.
The last fountain did not show enough deformation to be coherently measured by a sufficient number of considered GPS baselines. Thus, we avoided modeling the source. The model’s fit with tilt data is shown in
Table 2.
In order to model the source feeding the entire sequence, that should represent the average location of the origin of the magma drained during the four paroxysms, we analyzed the longer-term (12 days) but lower-noise data coming from GNSS and DInSAR. The 3D deformation pattern depicted by integrating GNSS and DInSAR data from December 2 to 14 clearly defines a radial contraction of the entire edifice, accompanied by a general subsidence centered on the summit part, indicating an evident deflation of the edifice. A circular slight uplift at a lower altitude permits hypothesizing that a deep source was pressurizing, able to produce a wider smooth effect, underlying the more evident and stronger deflation. However, this uplift was not accompanied by radial horizontal expansion, the dominating deformation being the centripetal direction of horizontal displacements imputable to the deflation. For this reason, the deep pressurizing source cannot be constrained by a clear deformation and we concentrated our efforts on modeling the deflating source.
In order to define the source of the observed cumulative deflation, we inverted the 3D SISTEM integrated data using a pressure source model, as formulated by [
33], and implemented it into the dMODELS Matlab
® software package [
34]. To search the minimum of the residuals, we used an optimization routine based on the genetic algorithms approach, as modified by [
5], using the same procedure described in [
23] by considering also the volcano topography.
The goodness of the SISTEM integration, depends on the number of GPS points and on the geometry of the GPS network, and this issue was largely investigated in [
26].
Before using the integrated data, the deformation calculated by the integration has been cchecked and validated at all corresponding GPS points, to ensure that it reproduces what really observed by GPS; we also revert the SISTEM output into LOS displacements for calculating the fit with the original DInSAR data (see
supplementary material). Once being sure that SISTEM integration does not introduce artifacts and unreal signals, we think that inverting the integrated and validated data provides a better-constrained model than inverting only the original GPS and DInSAR data. In this way, we gain millions of points with 3D information instead of few tens with 3D and millions with only 1D.
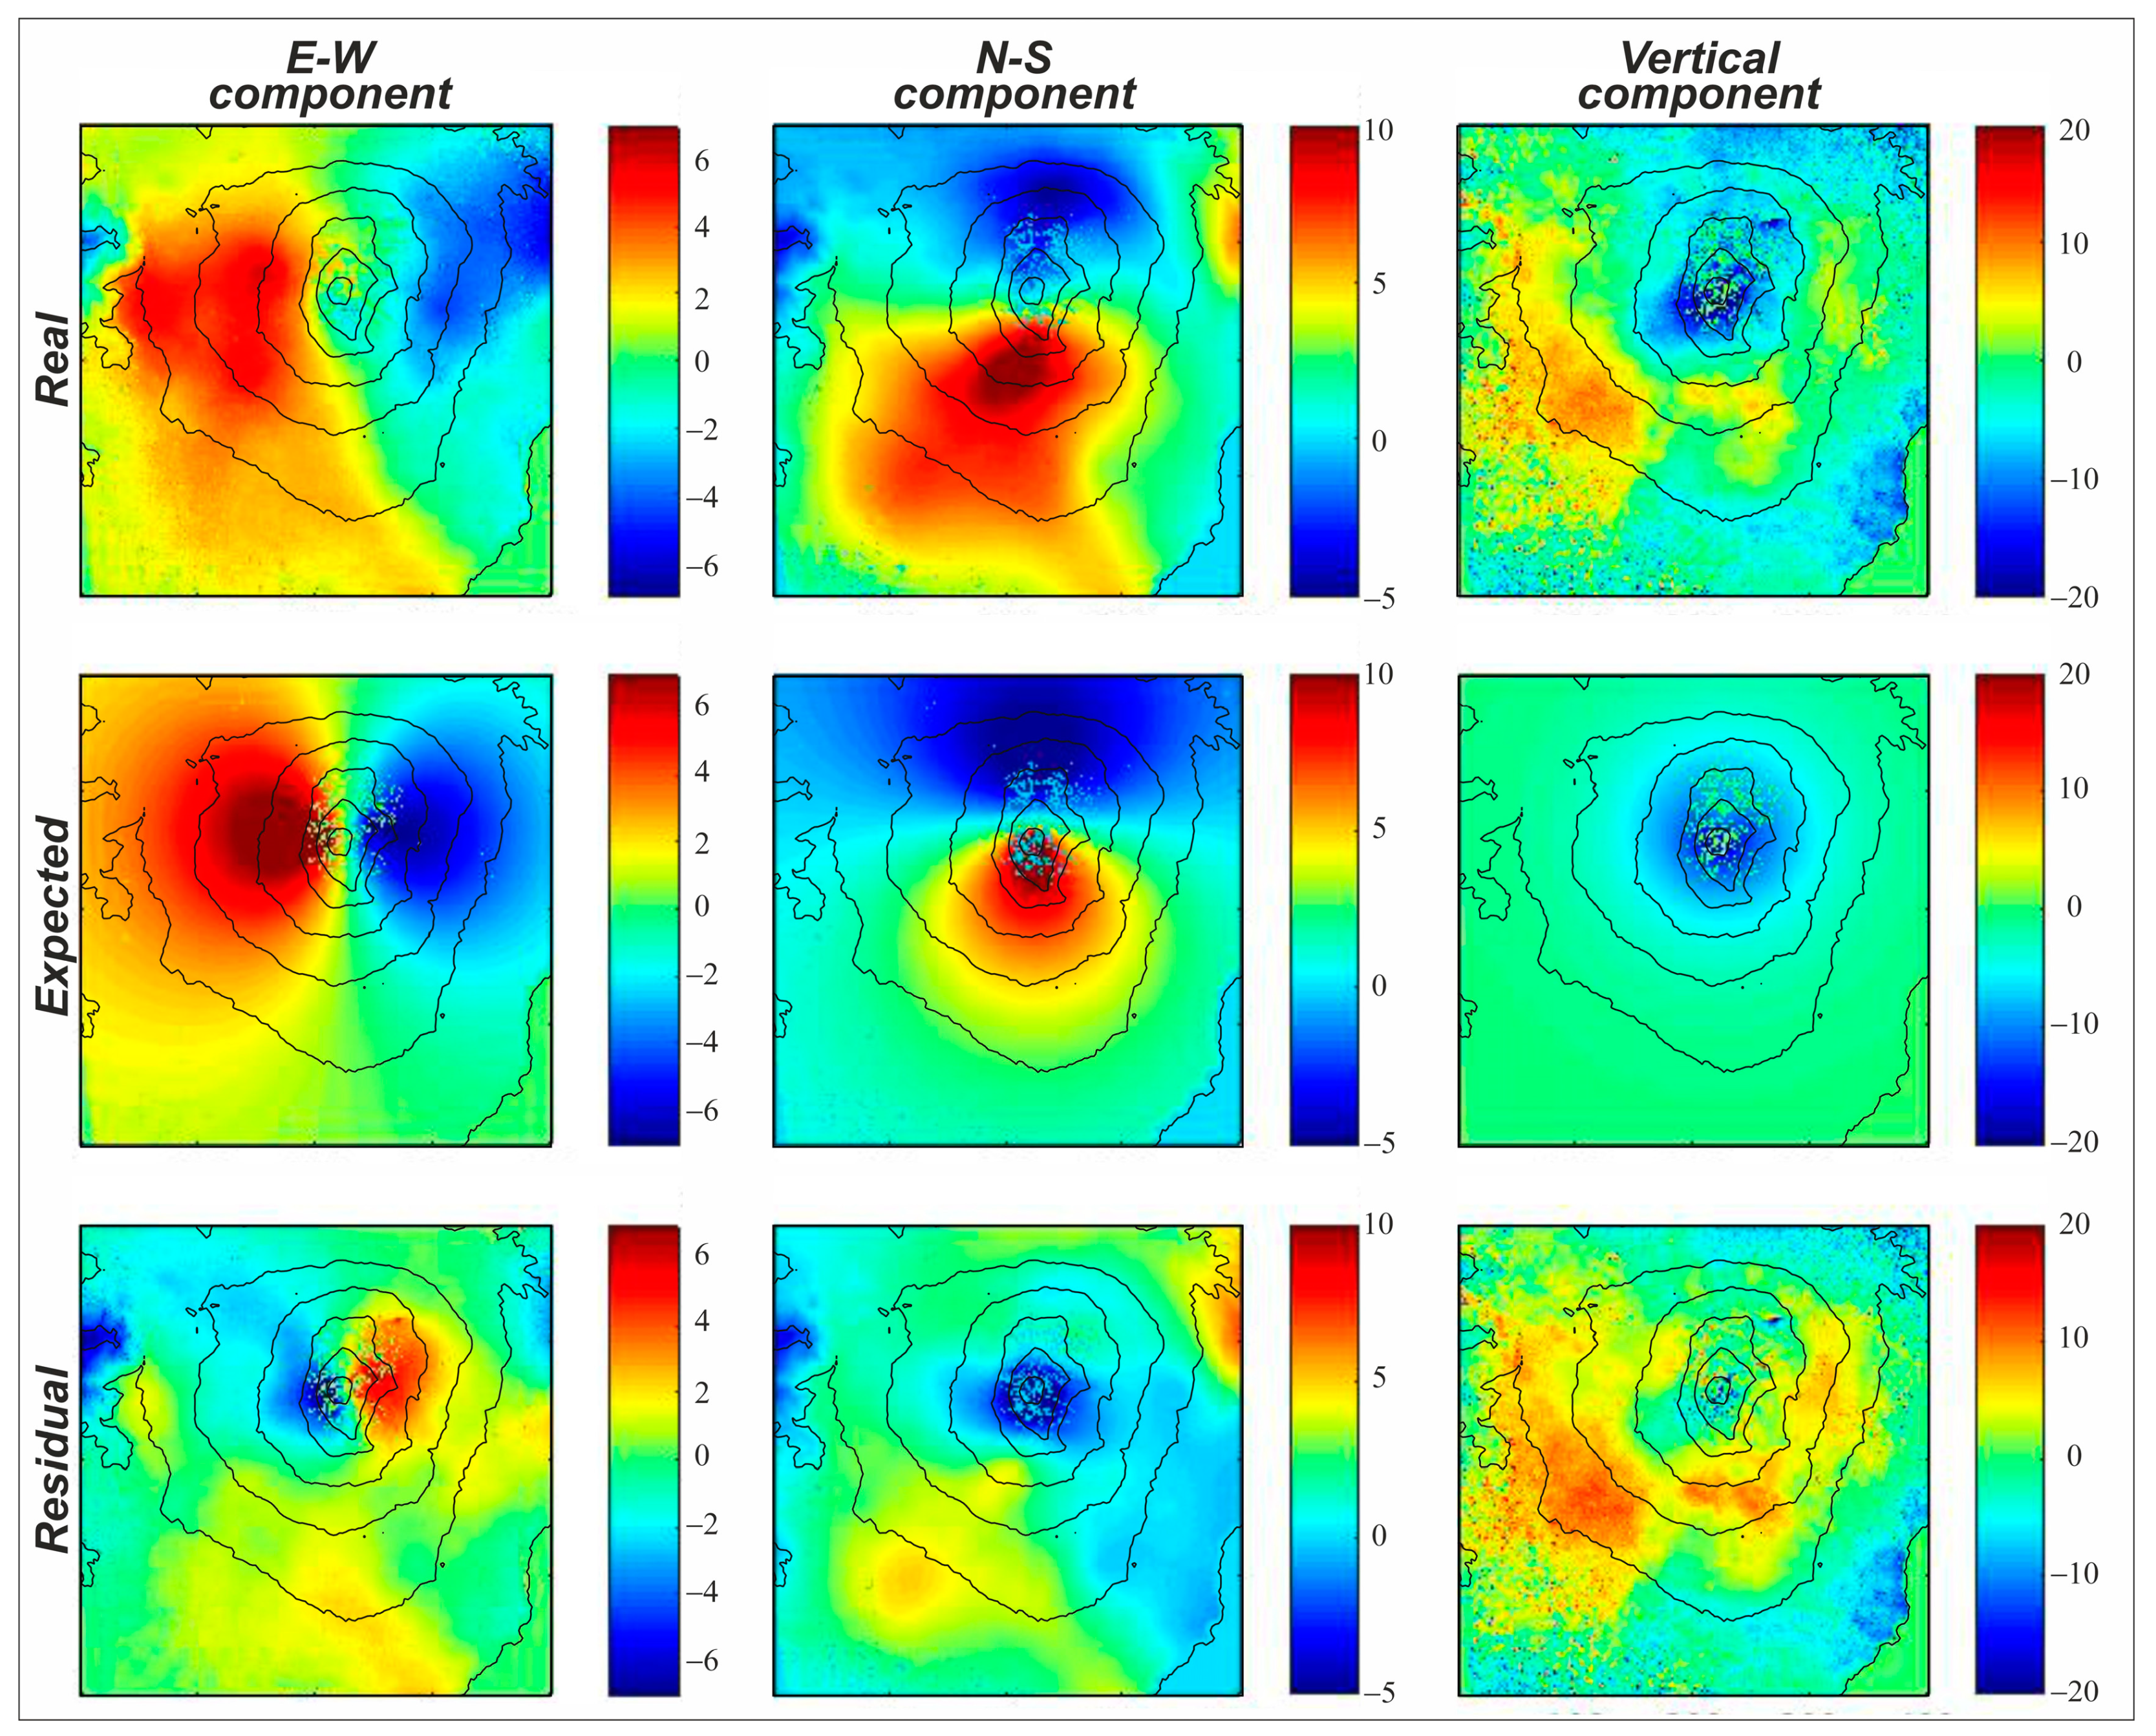
The solution converged to a final fitness value of 75% with an average misfit of 1.4 and 4 mm for the horizontal and vertical components, respectively. The distribution of the residuals (
Figure 10) shows a general good fit of the expected deformation with the observed one all over the volcano. Larger residuals can be observed on the vertical component, where the uplift at a lower altitude remains unmodeled, while the subsidence due to the deflation is well matched by the model.
The general solution for a prolate spheroid depends on eight parameters: the dimensionless pressure change ∆P/ µ; the semimajor axis; the geometric aspect ratio A between the length of the semimajor axis a and that of the two semiminor axes b; the source location (x,y,z); the dip angle θ (measured from the free surface) and the azimuth angle φ (measured clockwise from the positive North direction). In addition, we calculated the volume change of the spheroid, according to [
35].
The solution converged to an almost vertically dipping (78°) prolate spheroid, N–S oriented (N185E), located at about 6 km beneath the summit craters, losing about 6.5 million cubic meters during the entire eruptive cycle (
Table 3), which is close to the volume (7 million cubic meters) estimated by [
2]. This location should represent the original source of magma, that was gradually depleted to feed the shallower single-shot sources, where the gas exsolved and pressurized to charge each paroxysm.
5. Discussion
HR data coming from tiltmeters and GNSS networks on Mt. Etna allowed us to investigate in detail the very rapid deformation accompanying each of the four paroxysmal episodes of the Voragine crater at Mt. Etna. From the time-series analysis it is evident that the four paroxysms produced decreasing ground displacements, both on GNSS and tilt signals, confirming the decreasing energy and volumes emitted, as reported by [
2]. By inverting the ground deformation data recorded during the first three events, the location of the modeled sources appears quite stable. Indeed, although the sources were estimated separately in each of the considered periods, the coherence in the retrieved positions suggests the presence of a single depletion volume; in fact considering the dispersion of the three solutions, all of them fall in a small volume located beneath the summit craters at a depth of about 5 km below the summit craters area. The involved volumes range from 0.9 to 1.4 × 10
6 m
3. The total volume of the first three paroxysms, coming from the modeled sources by HR data, is about 3.3 × 10
6 m
3. Even considering a hypothetical volume of the fourth one, that should not exceed that of the third, the total volume is lower than the volume erupted, as calculated by [
2] for the entire sequence (around 7 × 10
6 m
3). This discrepancy could be related to the noisy data with respect to the low deformation signal and/or to the not completely elastic behavior of the medium close to the surface and around the summit craters and feeding system.
We should also consider that the shallow single-shot source mainly represents a level where part of the magma, coming from depth, is temporarily stored for a few hours before each paroxysm. Thus, the deflation does not necessarily represent the total volume erupted from this source but only a partial variation of volume, the magma being mainly in transit there.
The cumulated ground deformation revealed by more precise daily GNSS solution and 12-days Sentinel-1 SAR interferogram depicts an overall wide deflation and contraction of the entire edifice, suggesting a significant depletion of a deeper source, with respect to those resulting from HR data inversions. The integration of both datasets makes the ground deformation pattern even more evident and precise and allows a well-constrained inversion to search for the source feeding the eruptive sequence. The modeled source is a vertical and N–S oriented prolate spheroid, located at a higher depth of almost 6 km b.s.l., always beneath the summit craters area. The volume lost by this source is about 6 × 10
6 m
3, much more similar to the 7.1 × 10
6 m
3 calculated by [
2] for the entire sequence, with respect to the single-shot sources. This seems to confirm the role of the shallower source as a local and temporary storage of magma in transit and coming, instead, from this middle-depth source at 6 km b.s.l. The DInSAR and integrated data also reveal a slight uplift at lower altitudes on the flanks of the volcano; even though proving impossible to be well constrained and modeled, this information enabled hypothesizing a further and deeper source that was pressurizing during the entire period. As stated before, this eventual deeper source needs more data to be constrained, over larger and different time windows, and is beyond the scope of this investigation.
Considering this pulsating behavior of the shallow source, we can postulate that the shallower source (~1.5–2 km b.s.l.) slowly accumulated, before each paroxysm, the same volume of magma lost during each episode (as resulting from HR data inversions). We can use the volume changes modeled and time intervals occurring between two consecutive paroxysms to infer the magma feeding rate from the middle depth (~6 km b.s.l.) to the shallower source, during each quiet phase. We can estimate that the shallow source charged at a rate of about 10 m
3/s before the second episode, 25 m
3/s before the third one and about 15 m
3/s before the last lava fountain (considering a volume not greater than the third one). This gives an average
recharging rate of around 16 m
3/s of magma ascent during the quiet inter-paroxysm recharging phases. If we consider instead the total volume depleted from the middle-depth source (6.5 × 10
6 m
3), we can estimate an
overall supply rate of about 29 m
3/s of magma that moved from 6 km b.s.l. to the surface during the entire 2.6-days period, or 31 m
3/s if we consider the total volume (7.1 × 10
6 m
3) reported by [
2]. This mean value (29 to 31 m
3/s) averages a rate that actually oscillated from the
recharging rate of ~16 m
3/s during closed-vent and non-eruptive conditions (magma moving from 6 to 1.5–2 km b.s.l), to the peak
eruptive discharge rate of more than 300 m
3/s during the paroxysms (considering a mean volume of about 1.8 × 10
6 m
3 erupted at each paroxysm in about 90 min).
We can perform a very preliminary comparison of this analysis with the last and ongoing (at the time of writing) sequence of paroxysms at SEC (started on 16 February 2021). There is still no precise estimation of the erupted volumes, so we can roughly estimate a total volume of about 45 to 60 × 10
6 m
3 erupted during 15 strong episodes occurring from 16 February to 19 March 2021 (based on the very first estimation of the volumes from INGV bulletins available at
https://www.ct.ingv.it/index.php/monitoraggio-e-sorveglianza/prodotti-del-monitoraggio/bollettini-settimanali-multidisciplinari, accessed on 5 April 2021). Starting from this preliminary information, an
overall supply rate of around 17 to 22 m
3/s can be estimated over the entire month. This rate is comparable to what happened in 2015 and analyzed here, leading to the supposition that the supply mechanism, geometry and rates hypothesized for the 2015 paroxysms can be valid generally for other similar eruptive sequences on Mt. Etna.
6. Conclusions
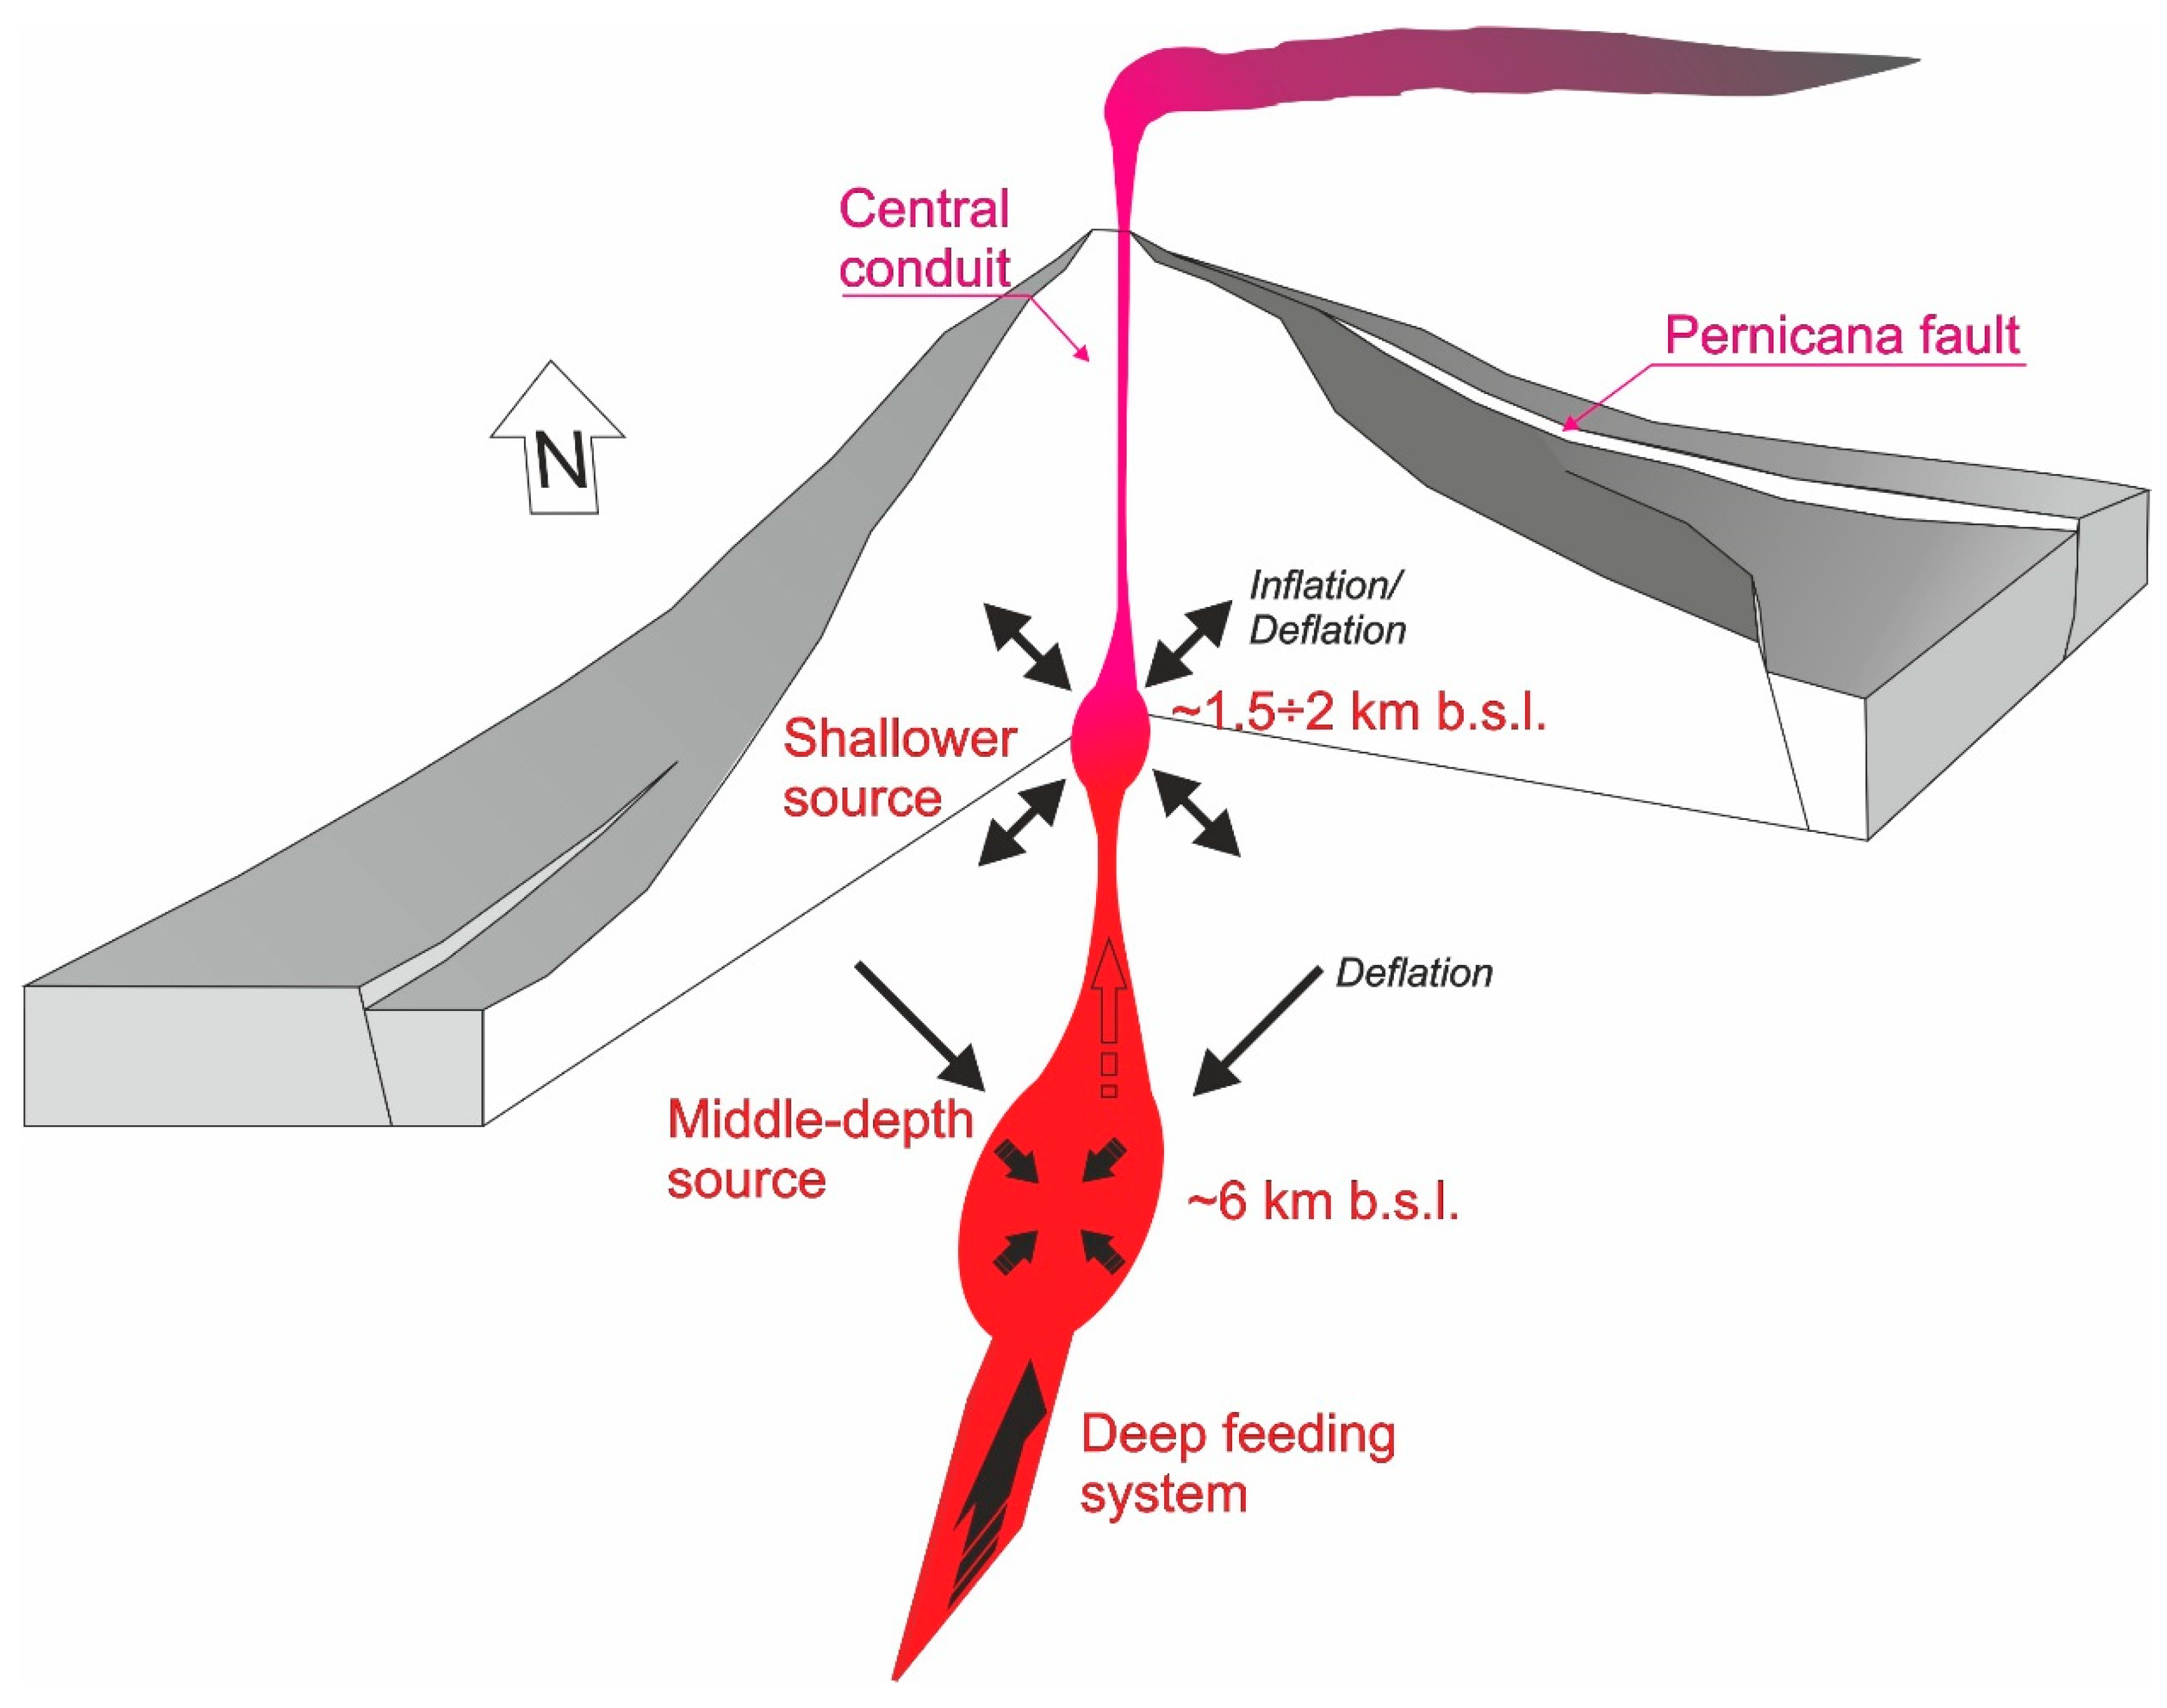
The coupling of high-rate, even if noisy, and precise, albeit if low-rate, data allowed us to perform a comprehensive investigation of the dynamics leading to and enabling very rapid magma movement and pressure accumulation and discharge, through an impressive sequence of very violent eruptions. The overall picture coming from the different rates data analyses constrains the feeding system underlying such a quick and violent sequence of eruptive episodes (well summarized in
Figure 11), allowing a rapid magma upraise and discharge from the summit crater, located at about 3300 m a.s.l. at Mt. Etna. In this framework, there is a deep, and not well-constrained here, pressurizing source that provides gas-rich magma to a middle-depth reservoir, located at about 6 km depth. This is the reservoir that gradually feeds the shallower system at about 1.5–2 km b.s.l., where the upper part of the magma batch temporarily stops and vesiculates, charging and producing each paroxysm when the pressure, mainly due to the exsolution of gas, exceeds the containment pressure of the hosting rocks inside the volcano.
The combined mechanism of two storage levels at different depths depicts the possible feeding system of such high-discharge rate events, with a middle-depth storage of gas-rich magma that charges, more or less continuously, at a recharging rate of about 15–20 m3/s, and a shallower level where magma stops temporarily, accumulating pressure due to the gas exsolution. When the pressure exceeds a threshold determined by lithostatic pressure and structural conditions of the shallower feeding system, the paroxysm starts, draining not only the magma accumulated in this shallower source but also part of that in the rest of the feeding system at an eruptive discharge rate of more than 300 m3/s. When the gas pressure is discharged below the threshold, the paroxysm ends and the shallower source starts to be re-charged again. The overall supply rate of the entire sequence is about 29–31 m3/s, which is similar to that estimated for the most recent sequence at SEC (February–March 2021). Thus, the model suggests a machine-gun-like mechanism, comprising a middle-depth reservoir continuously charging a shallower one that works as a firing chamber triggering each single-shot paroxysm. This mechanism, and the overall supply rates needed to feed this dynamic, could represent a general conceptual model for similar events at Etna and at all volcanoes.


