Article

Imaging Top of Volcanic Mounds Using Seismic Time- and Depth-Domain Data Processing

Petroleum & Marine Division, Korea Institute of Geoscience and Mineral Resources, Daejeon 34132, Korea
*
Author to whom correspondence should be addressed.
Appl. Sci. 2021, 11(9), 4244; https://doi.org/10.3390/app11094244
Submission received: 22 March 2021 / Revised: 3 May 2021 / Accepted: 4 May 2021 / Published: 7 May 2021
(This article belongs to the Special Issue Data Processing and Modeling on Volcanic and Seismic Areas)

Abstract

:
A seismic survey identified a basalt flow that could consist of cap rock of CO2 storage beneath saline aquifer sediment in the Southern Continental Shelf of Korea. To determine the precise depth of the basalt flow, specific depth-domain data processing of migration velocity analysis (MVA) was applied to the seismic survey data. The accurate depth measurement of a target structure provides crucial information when storing and stabilizing injected CO2 beneath basalt cap rock. Strong reflections of seismic amplitude at the volcanic mounds were adjusted from the time domain to the exact depth domain by the iterated velocity using MVA. The confidence of the updated velocity was verified by the horizontal alignment of seismic events sorted according to their common reflection point (CRP). The depth difference in volcanic mounds before and after MVA application ranged from 32.5 to 60 m along the vertical axis, showing the eruption shape on the strong-amplitude contour map in detail. The eruption shape of the top of volcanic mounds was verified with spatial continuity in 3D geological interpretation. The presented results provide suitable information that can be used to locate drilling sites and to prepare CO2 injection. The geological model obtained from both time- and depth-domain processing can significantly influence the calculation of the storage volume and can be useful for history matching studies.

1. Introduction

Areas affected by volcanic eruptions such as basalt lava flows or fissure vents are frequently found across the Earth’s surface, arousing considerable scientific interest [1]. The volcanic subsurface can be explored through the use of geophysical methodologies, e.g., gravity, magnetic and seismic surveys [2,3,4]. In the seismic exploration data, the volcanic area shows strong amplitude events due to the relatively high contrast of density and reflectivity [5]. Abrupt collapses, unexpected faults and subsidence are other common characteristics of magmatic intrusions resulting from volcanic activity [6]. Aspects of the reflection signal’s diversity present challenges in seismic data processing, particularly in the estimation of velocity information [6,7,8]. Since the seismic data related to volcanic activity have less commercial usefulness than the exploration data for hydrocarbon development, the complicated data-processing procedure is often not applied. In addition, representative research cases in which the velocity was obtained by processing seismic data have used geophone-recorded data, which contain accurate depth information [7,8].
The increase in the scientific and/or engineering curiosity regarding volcanic regions means that additional velocity-specific seismic data processing is required. Carbon capture and storage (CCS) projects have led to expanded efforts to assess the storage, from depleted reservoirs to saline aquifers with upper volcanic cap rocks [9,10]. Saline aquifers have the advantage of large storage volume but require a sealing structure in order to safely store CO2 [10,11]. Basalt flow, due to its rock-physical properties, may be a suitable cap rock for the storing CO2 in the aquifer beneath the flow. Moreover, the mineralization of carbon can prevent the migration of CO2, which leads to favorable stabilization for long-term storage [12]. To use basalt flow as the cap rock for CO2 storage, accurate verification of the fracture zone and deformation should be carried out in both the time and depth domains [13]. Optimized seismic data processing for basalt flow can provide an accurate understanding of the possible fracture zone due to velocity anomalies and possible deformations by subtle depth conversion.
In the Southern Continental Shelf of Korea (SCSK), there is an independent structure formed by volcanic events, showing the potential of CCS [14,15]. Two-dimensional seismic surveys were executed in 2018 across the areas of the SCSK to calculate the storage capacity of CO2 for the saline aquifer. Determination of the exact depth of the target is important when drilling injections and monitoring wells [16]. In the seismic sections, by applying only time-domain processing, basalt flow shows high reflectivity contrast, which might lead to errors during the geological interpretation. The boundary and lateral expansion of basalt flow are not easy to analyze in terms of potential cap rocks for CO2 storage.
To enhance the seismic sections’ resolution, we applied both time-domain and depth-domain processing using the MVA technique [17,18]. MVA is able to determine the velocity with high accuracy by considering subtle changes in spatial velocities. We demonstrated the iterated velocity and determined the accurate velocity from the flatness of the collected CRP gathers. In order to confirm the effectiveness of our processing, amplitude contour and root mean square (RMS) maps derived before and after MVA application were compared. If the precise boundary and depth of volcanic mounds can be defined, CO2 storage capacity can be calculated with confidence.

2. Structural and Geological Characteristics

The SCSK is located in the north of the East China Sea, which represents the western arm of the Pacific Ocean. The rocks of the region are igneous, metamorphic and sedimentary types, of which aged Precambrian gneiss and schist are the oldest [19]. Tertiary Pleistocene strata are widespread, and large deltas and marine terrace deposits can be found along the coasts. Several small, NNE-trending basins have been found, with a large area in the intermediate basement [20]. A previous study noted that a sequence of Late Cretaceous consists of fluviolacustrine, which is affected by volcanic activity [21].
Seismic reflections from the sequence between the Late Cretaceous and Late Eocene/Early Oligocene are low to very high in amplitude, showing the various depositional processes. The volcanic intrusion is thought to date back to the Early Miocene, and the flow was covered by silt and siltstone until the Late Miocene [20,21]. The sedimentary layer below the basalt eruption is mainly composed of unconsolidated inter-bedding sandstones, claystones and occasionally siltstones, attributed to the subsidence of the Jeju Basin during the Late Eocene to Early Oligocene [22]. A recent study focused on the potential for CO2 storage using the basalt flow’s sealing ability above the sedimentary layer [16]. In 2018, the Korea Institute of Geoscience and Mineral Resources (KIGAM) carried out a two-dimensional seismic survey on the Jeju Basin, north of the East China Shelf Basin, to assess its potential for the storage of CO2 (Figure 1a). A total of nine multichannel seismic lines were surveyed, covering an area of 130 square kilometers (Figure 1b).
The two formations of interest in this study were volcanic mounds and the lower depositional layer, which can be cap rocks and storage for CO2. The results of the well-log analysis showed that the petro-physical properties of good permeability and porosity are important for potential CO2 storage [23]. The top volcanic mounds were identified by anomaly in the well-log analysis for sonic and porosity properties (Figure 2). A vertical-depth error can occur and/or be accumulated in the seismic data that normally are recorded and displayed in the time-domain vertical axis.
Figure 1. (a) Survey area map and (b) seismic acquisition lines (modified from [24]). The bold red line is a representative seismic processing line.
Applsci 11 04244 g001

3. Results of Seismic Data Processing

Seismic data processing consists of time- and depth-domain stages; the latter includes MVA. The purpose of time-domain processing is to produce suitable subsurface images to carry out successful geological interpretation of CO2 storage feasibility. Depth-domain processing aims to accurately refine the depth of the subsurface, which is useful in the drilling process and in the computation of storage volume. The following sections explain how each of the two processing steps is executed, including the input parameters and results of filter application.

3.1. Time-Domain Processing

Time-domain data processing was performed on offshore seismic survey lines (Figure 1b) acquired from the study area (Figure 1a) using the Tamhae2 research vessel of KIGAM. The bold red line in Figure 1b is a representative seismic line, with approximately 37.5 line-km. Seismic data were acquired using a 1.2 km (96 channels) streamer and the air-gun source. Other detailed acquisition parameters are listed in Table 1.
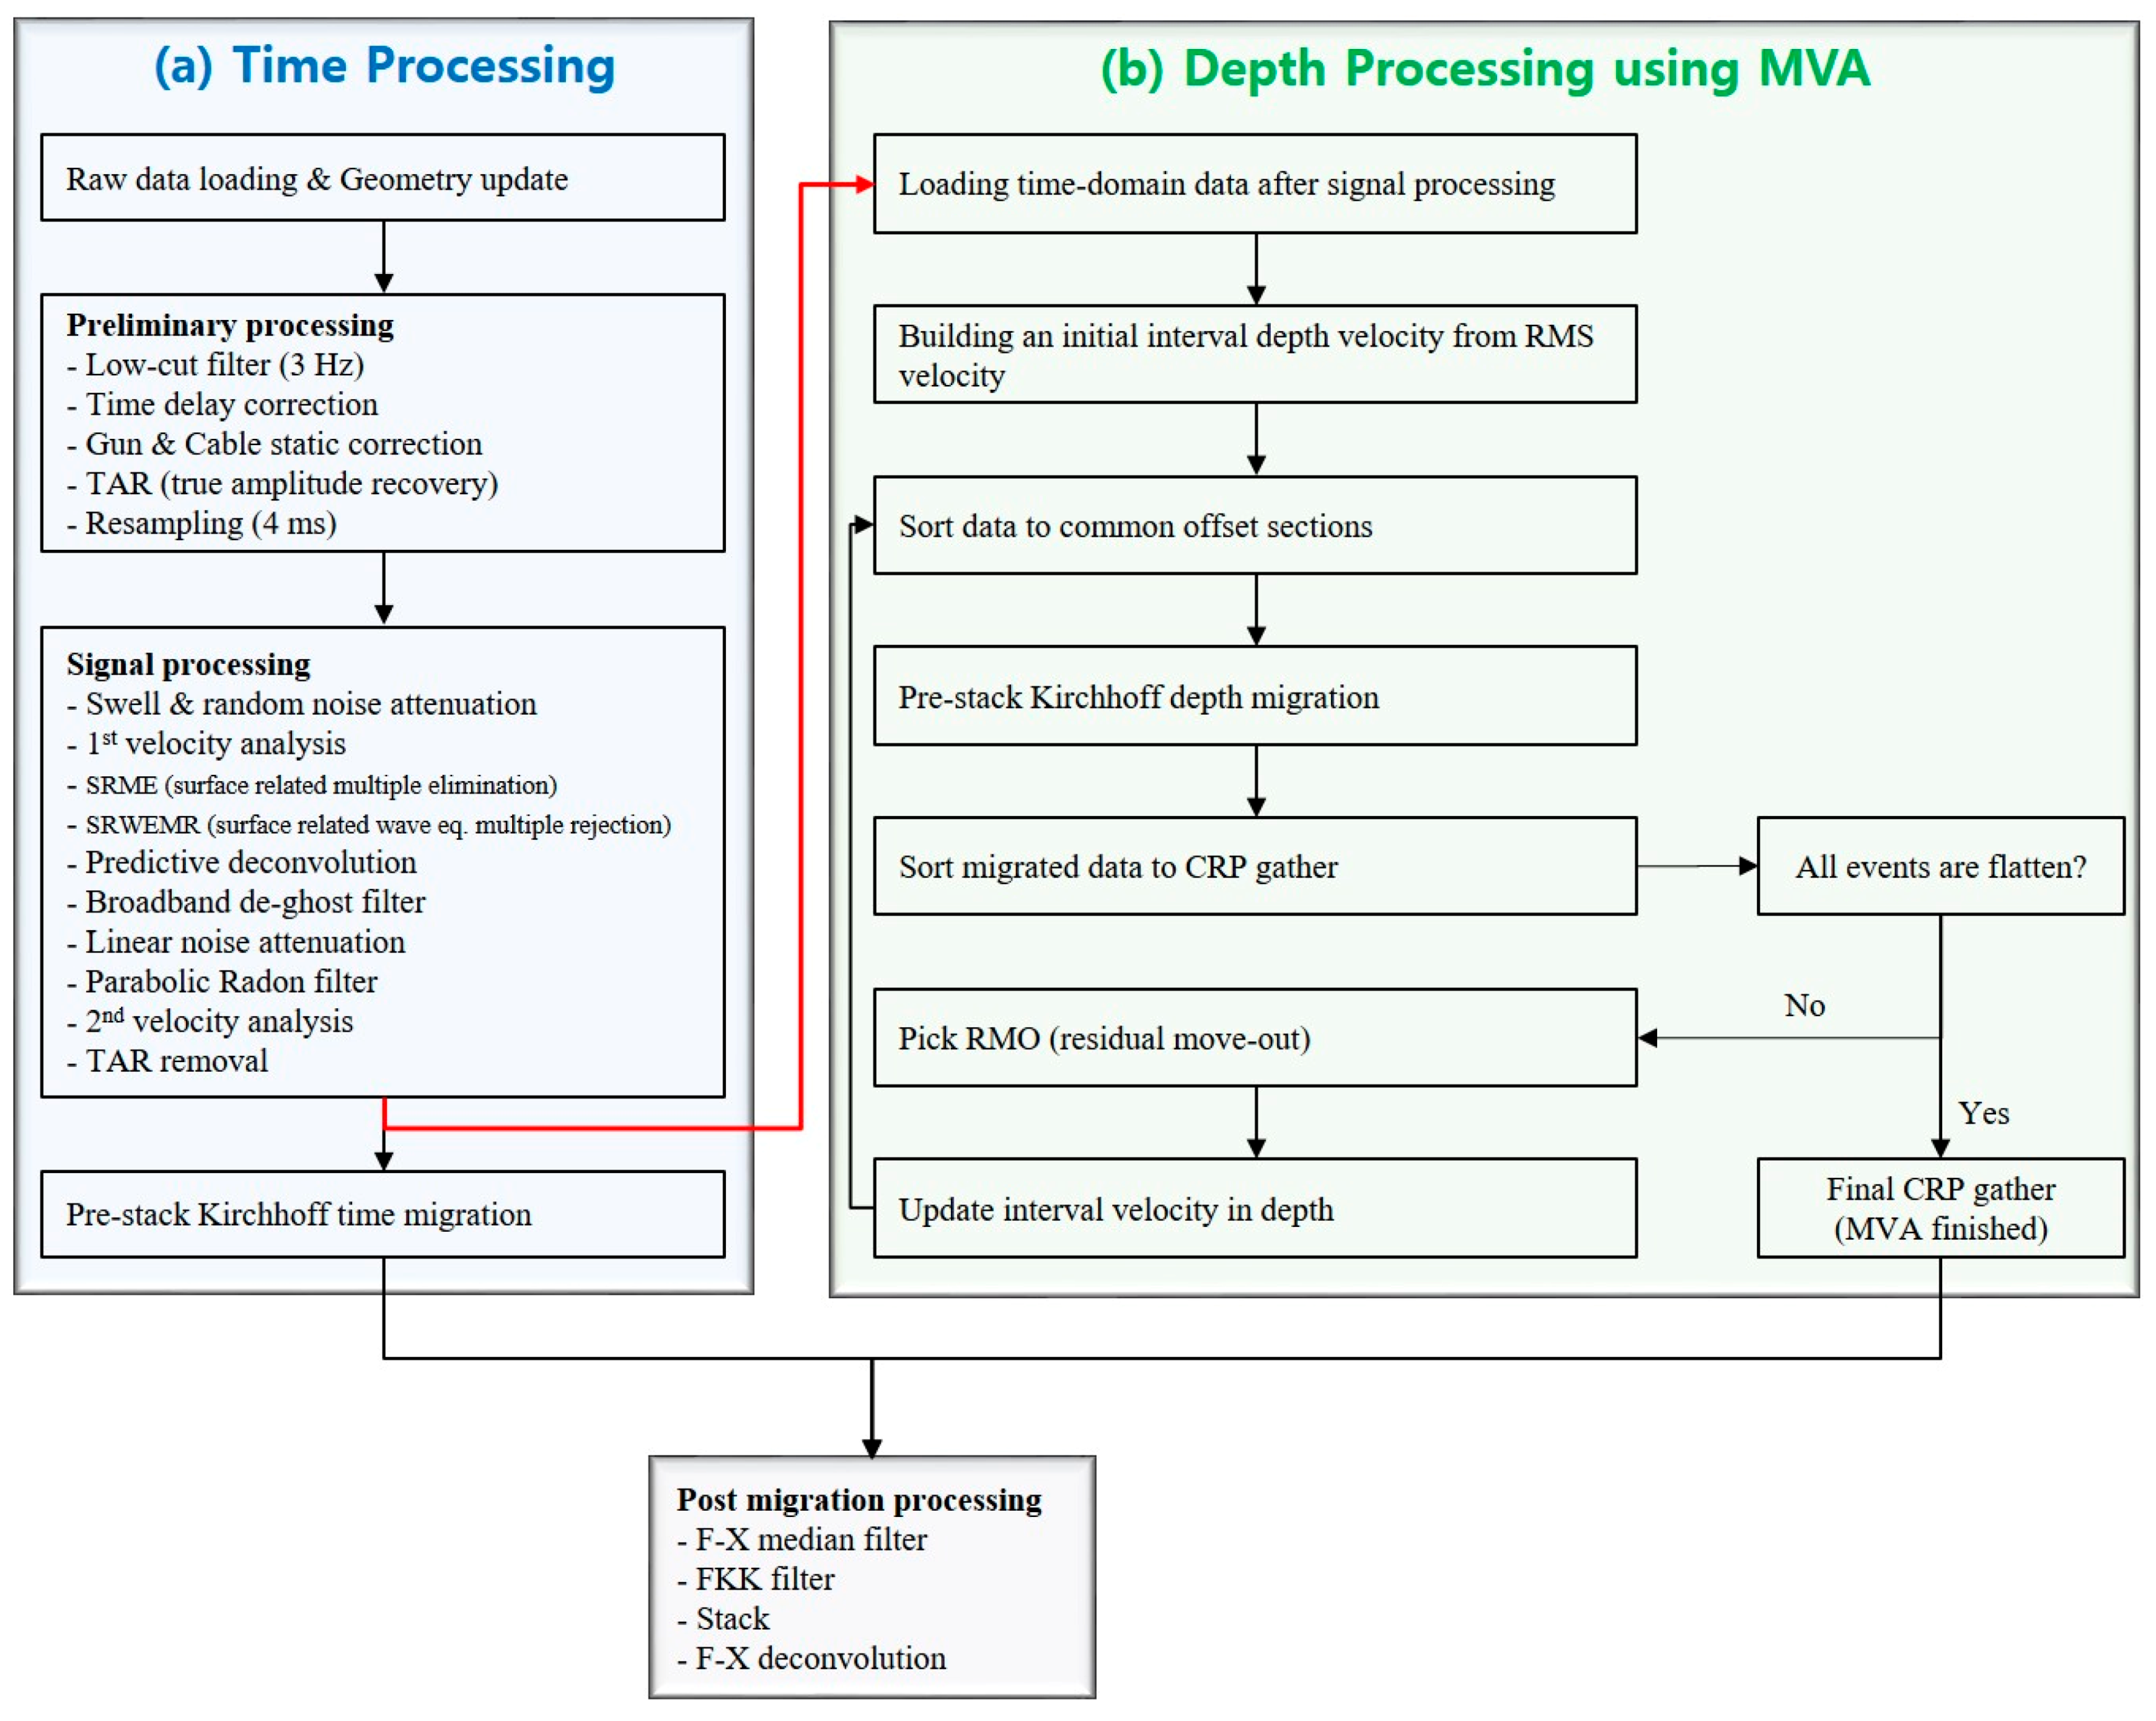
To confirm the effectiveness of the time-domain data processing techniques (Figure 3a) applied in this paper, the results before and after the signal processing were compared (Figure 4 and Figure 5). Figure 4a and Figure 5a show the shot gather and the stack section before the signal processing, and there is a multiple (refer to the arrows) at around 1.05 s. We can confirm from the results that the multiple was effectively attenuated (Figure 4b and Figure 5b) after the signal processing was applied. In addition, the amplitude spectra before (black line in Figure 4c) and after (red line in Figure 4c) the signal processing were compared to confirm the effectiveness of time-domain data processing. From Figure 4c, we can confirm that the low-frequency signals were enhanced and the notches at higher frequencies were removed after the signal-processing techniques were applied. Therefore, through the application of time-domain data processing, the multiples and noise inherent in the field data can be effectively attenuated. In addition, from the stack section (Figure 5b), after applying the time-domain processing, the connectivity of the horizontal layers in the region of interest (0.9 to 1.2 s) greatly improved, and detailed subsurface structures could be imaged.

3.2. Depth-Domain Processing Using the MVA Technique

Depth-domain data processing flattened the CRP gathers, which proves that the updated velocity is correct. The MVA technique is a data-processing method that can obtain a reasonable velocity estimation using tomography or a wave equation for the complex subsurface structures. Then, this velocity is used to generate a subsurface image in the depth domain. In this study, a depth-domain data-processing workflow (Figure 3b) using a tomography-based MVA technique [18] was applied. In order to obtain high-quality depth-domain results, e.g., seismic sections and velocities, the input data were used with data (Figure 4b) whose signal-to-noise ratio was improved after applying the signal processing in the time domain. The depth-domain interval velocity, converted from the time-domain RMS velocity by the Dix equation [25], was used as the initial velocity model. Next, the loaded time-domain data were sorted by the common offset data. After calculating the travel time [26] using the eikonal solver, we performed Kirchhoff pre-stack depth migration (PSDM) [27]. The migration results were sorted as CRP gathers, and the residual move-out (RMO) technique [28] was applied. Finally, ray-based tomographic velocity analysis [18] was applied to obtain the updated depth-domain velocity.
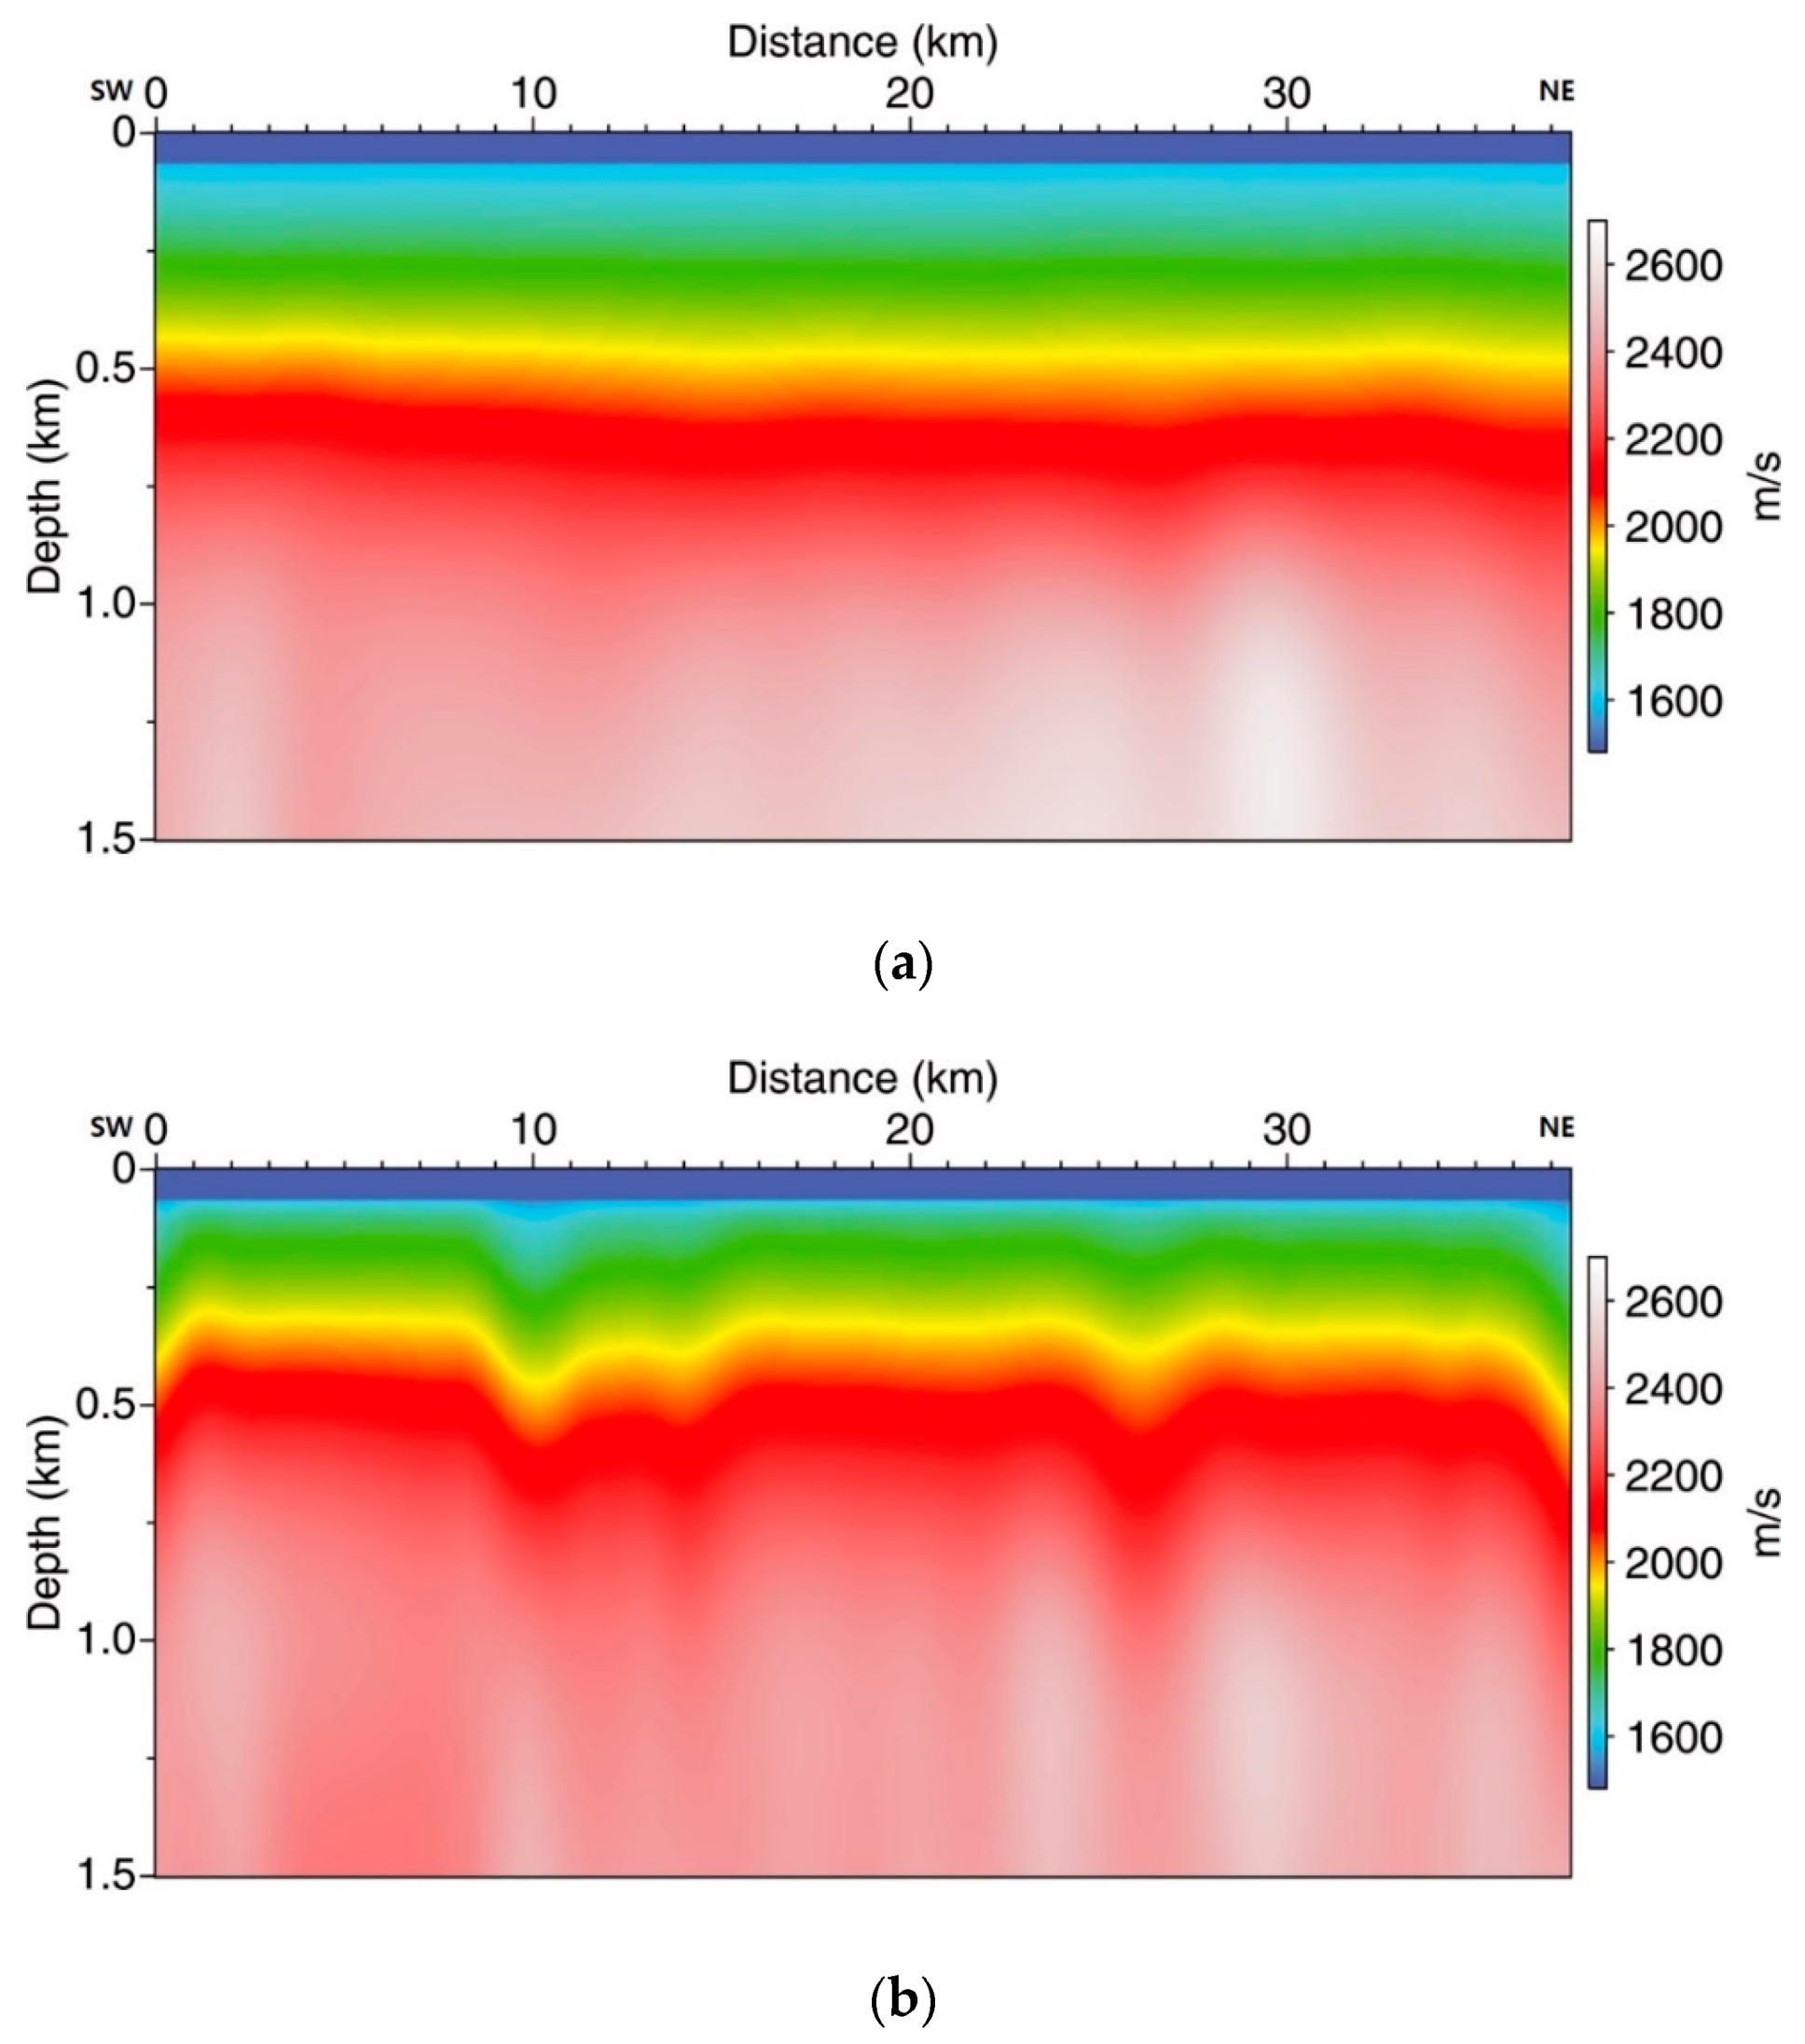
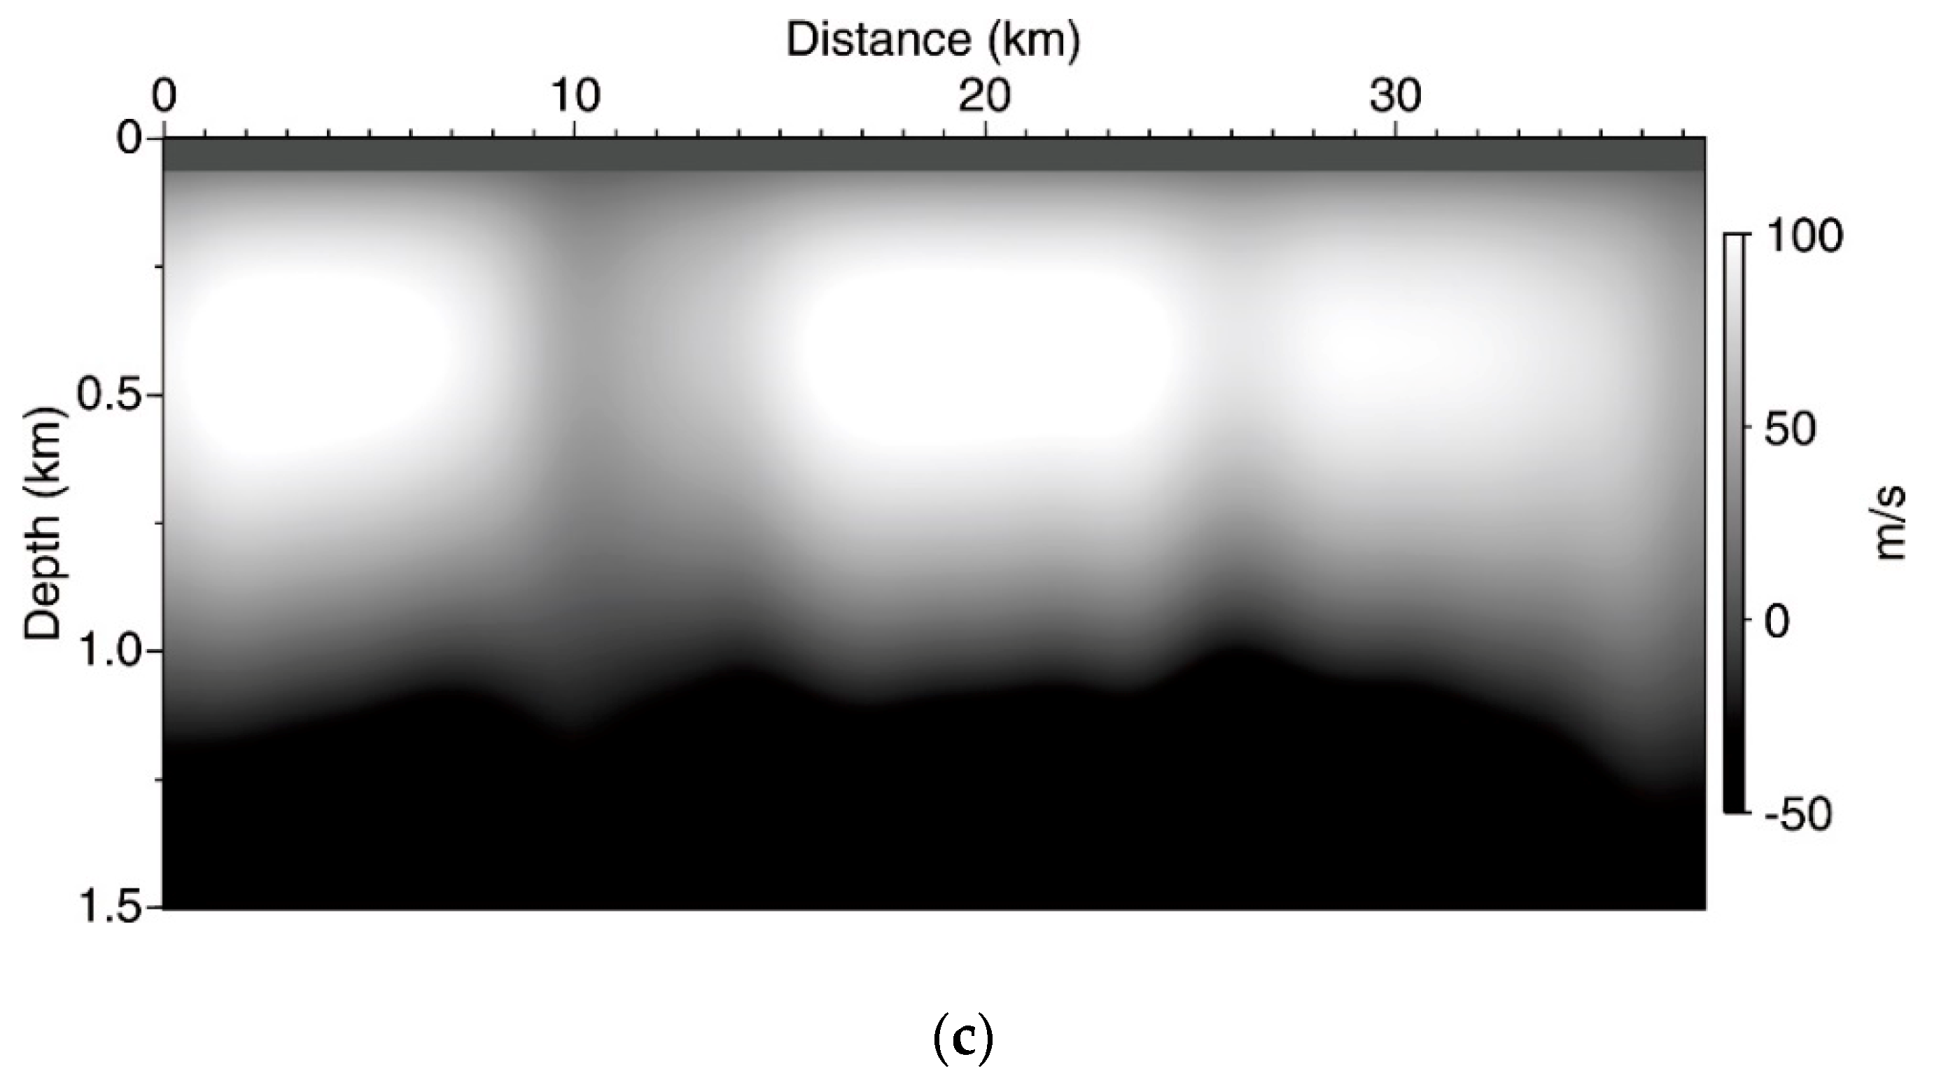
In this study, depth-domain processing using the MVA technique (Figure 3b) was repeated three times. By comparing the depth-domain initial velocity (Figure 6a) converted from the RMS velocity using time-depth conversion and the final velocity (Figure 6b) obtained after MVA at the third iteration, we were able to confirm that the overall subsurface velocity structures after applying MVA were greatly improved. In particular, it can be seen from the velocity differences in Figure 6c that the velocity was significantly updated in the region of interest (0.9 to 1.2 km), which corresponds to the depth of basalt flow.
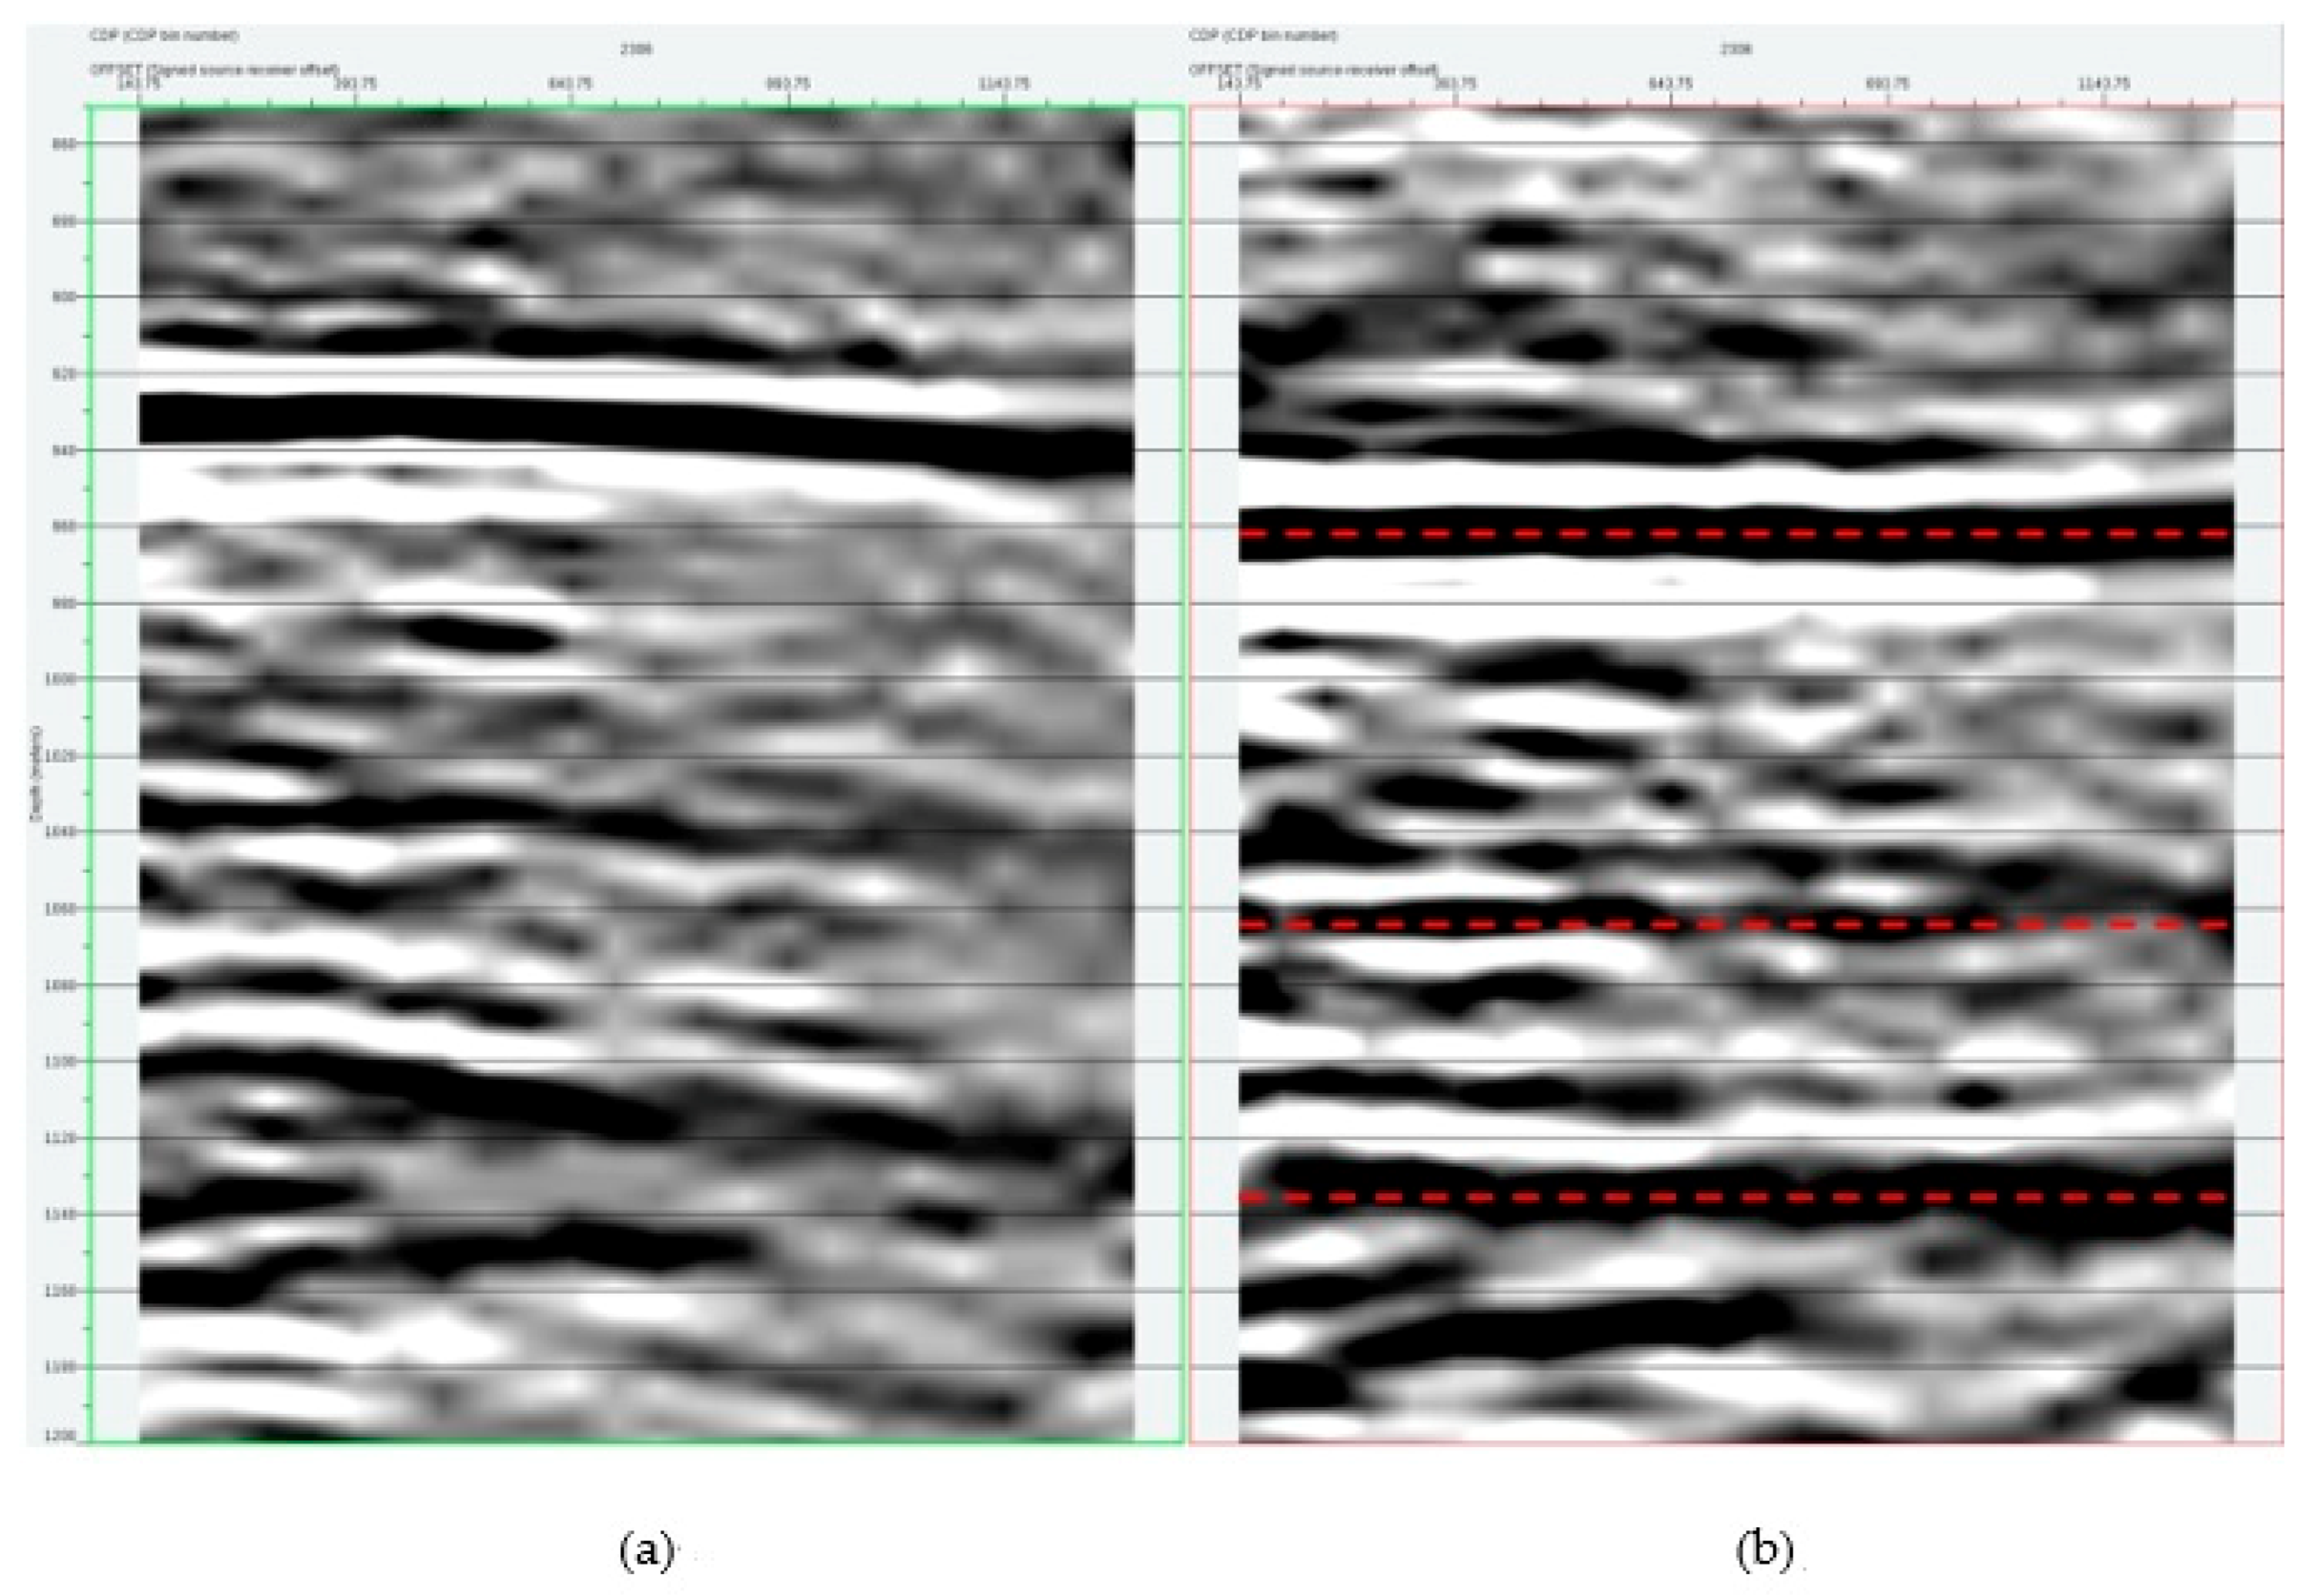
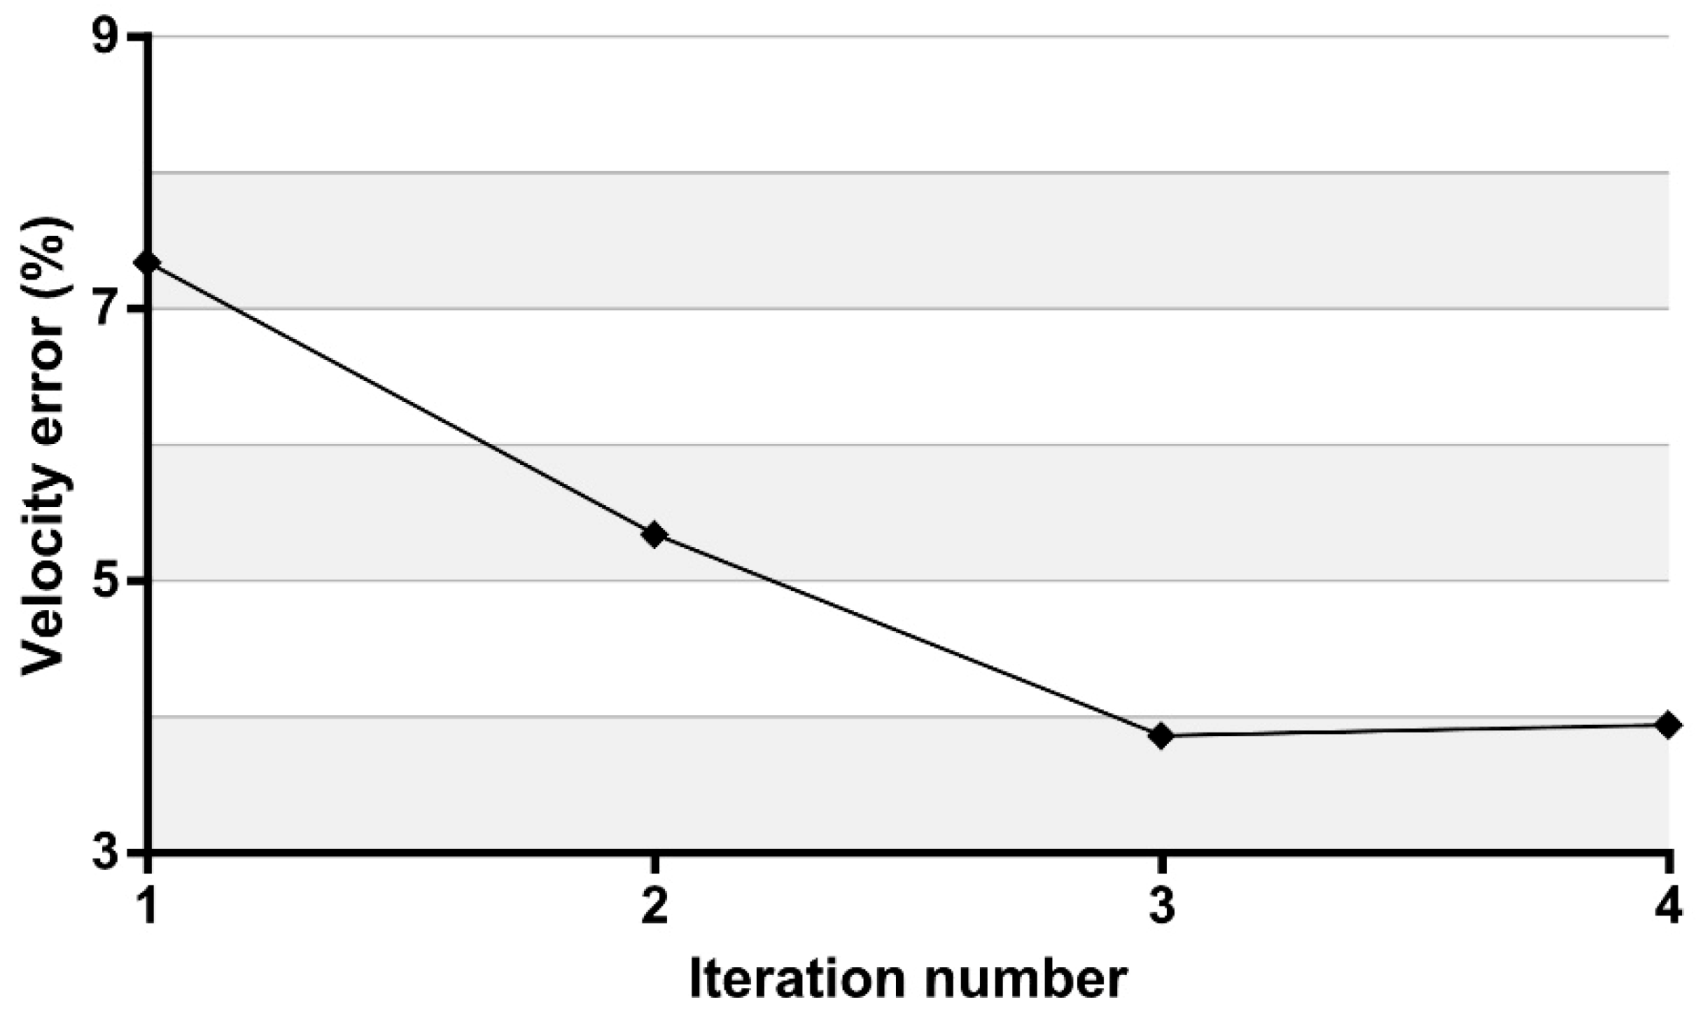
In general, the CRP gather is analyzed to verify whether the velocity is correct. CRP gathers are signals reflected from the same reflection point, so if the velocity is correct, the CRP gather should be flat [28]. Therefore, we compared CRP gathers before (Figure 7a) and after (Figure 7b) MVA to confirm that the final depth-domain velocity was reasonable. From Figure 7, we can observe that the CRP gather became flatter after the MVA was applied. Since the CRP gather was generated depending on the velocity, the depth of the reflection events in the CRP gather was corrected using the updated velocity after applying the MVA. In addition, in order to quantitatively confirm the accuracy of the updated velocity, the velocity error curve according to the number of iterations is shown in Figure 8. In general, the iteration number is determined by considering the trade-off between accuracy and computational cost. It can be seen that the velocity error was reduced to about 3.8% in the third iteration. From the error curve, we judged that the velocity error sufficiently converged in the third iteration, and thus the MVA process was stopped. Therefore, it was verified that the final depth-domain velocity obtained after applying the MVA was reasonable.
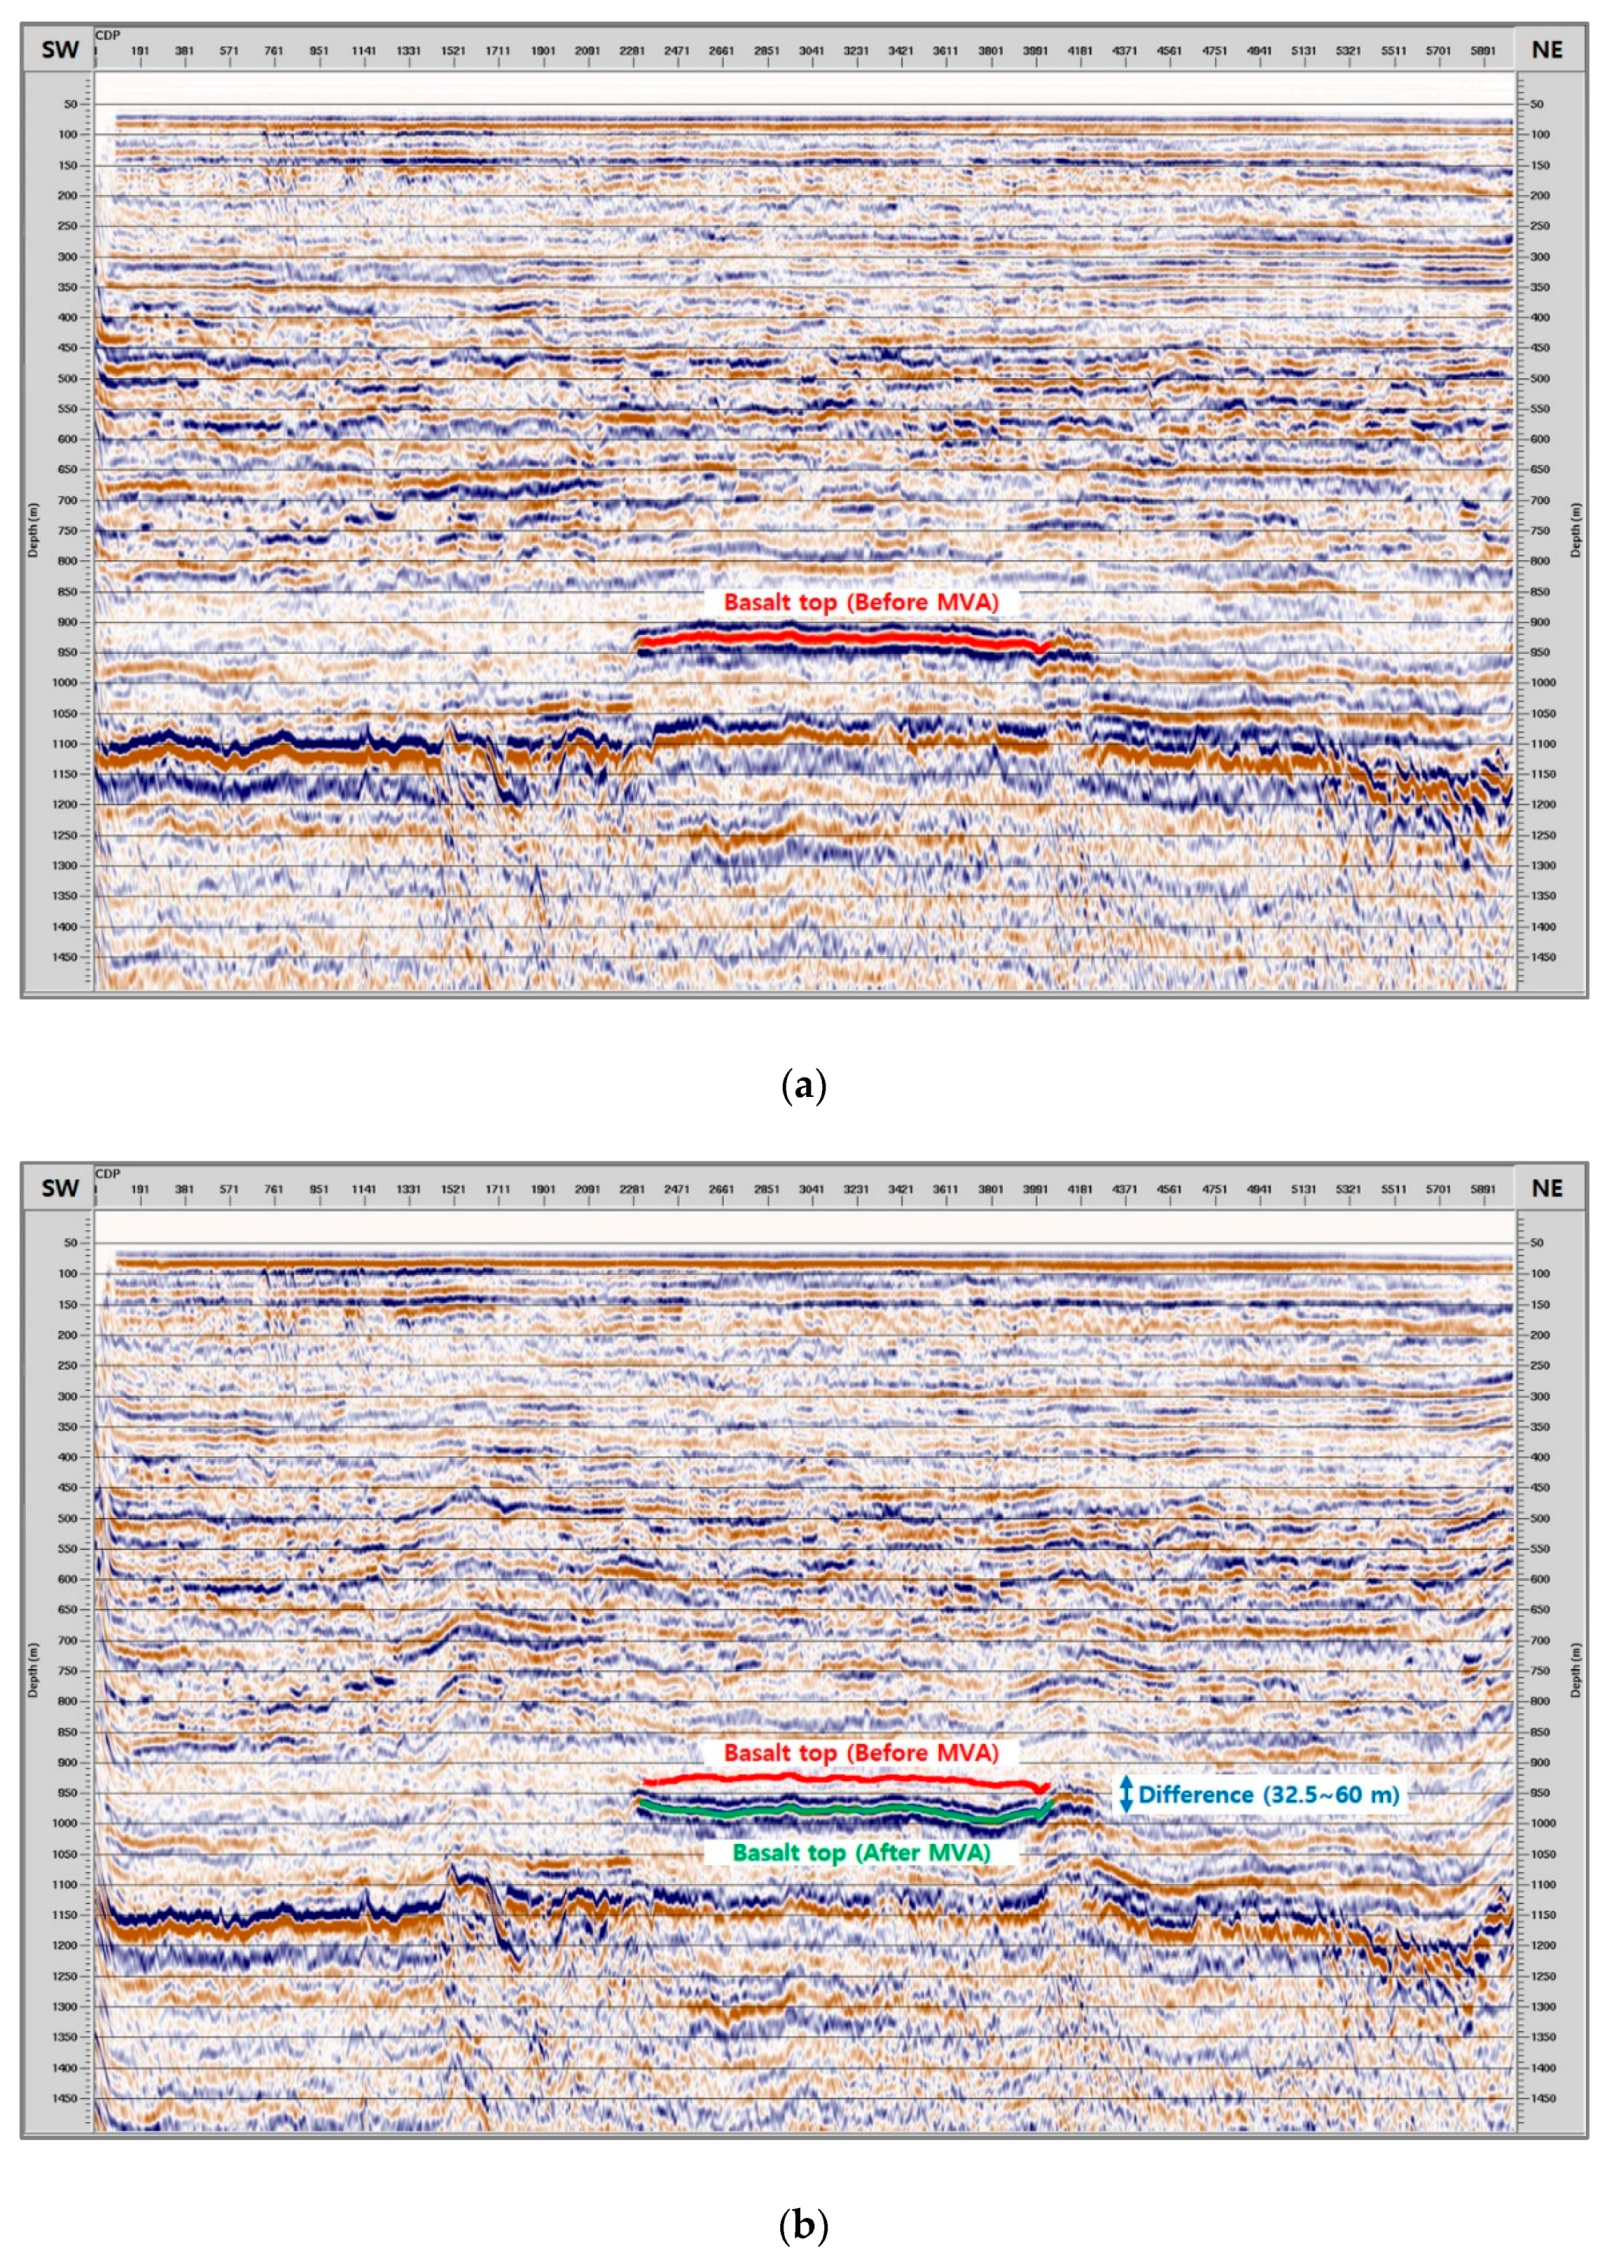
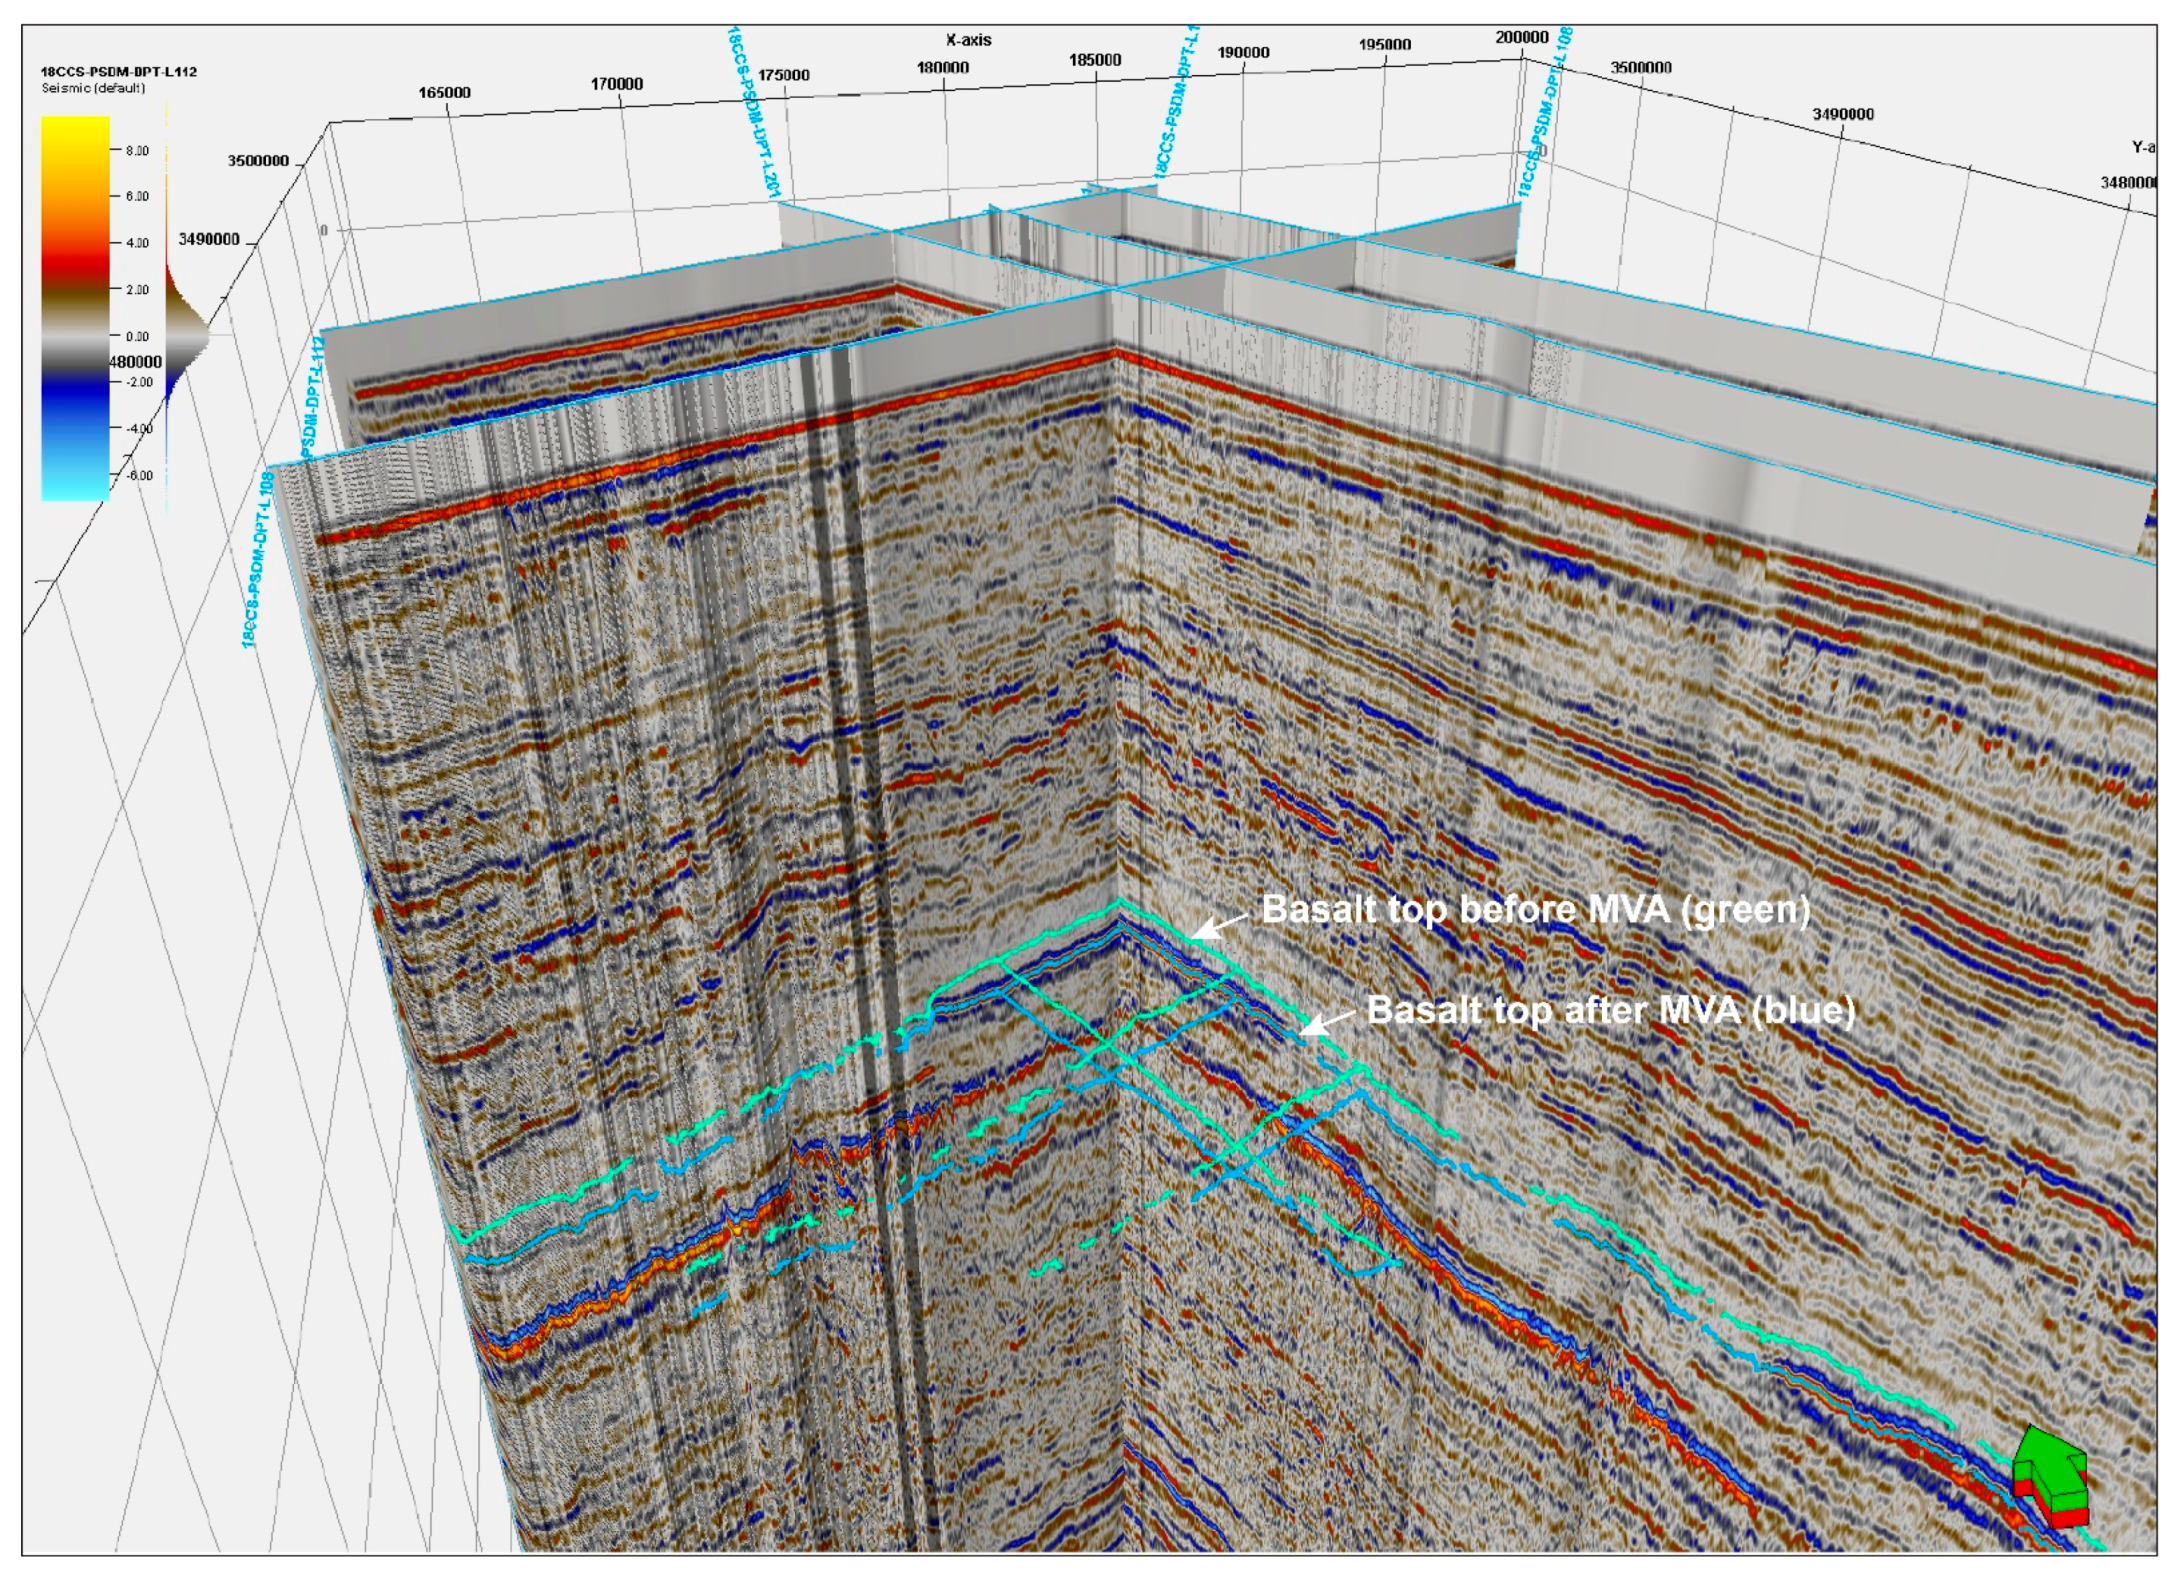
Finally, to confirm the effectiveness of the depth-domain data processing, we compared the stack sections before (Figure 9a) and after (Figure 9b) the MVA was applied. The red and green lines represent the top of the basalt before and after MVA was applied, respectively. In Figure 9b, the difference in depth between the two basalt tops ranges from 32.5 to 60 m. The 3D depth-domain stack sections after applying MVA are also shown in Figure 10. From the 3D results, the horizons between the in-line and the cross-line agree well with each other, and the spatial depth variance of the basalt top before and after the MVA application can be observed. Therefore, we confirmed that not only the velocity but also the subsurface structure was corrected after applying the depth-domain data processing using the MVA technique.

4. Seismic Interpretation

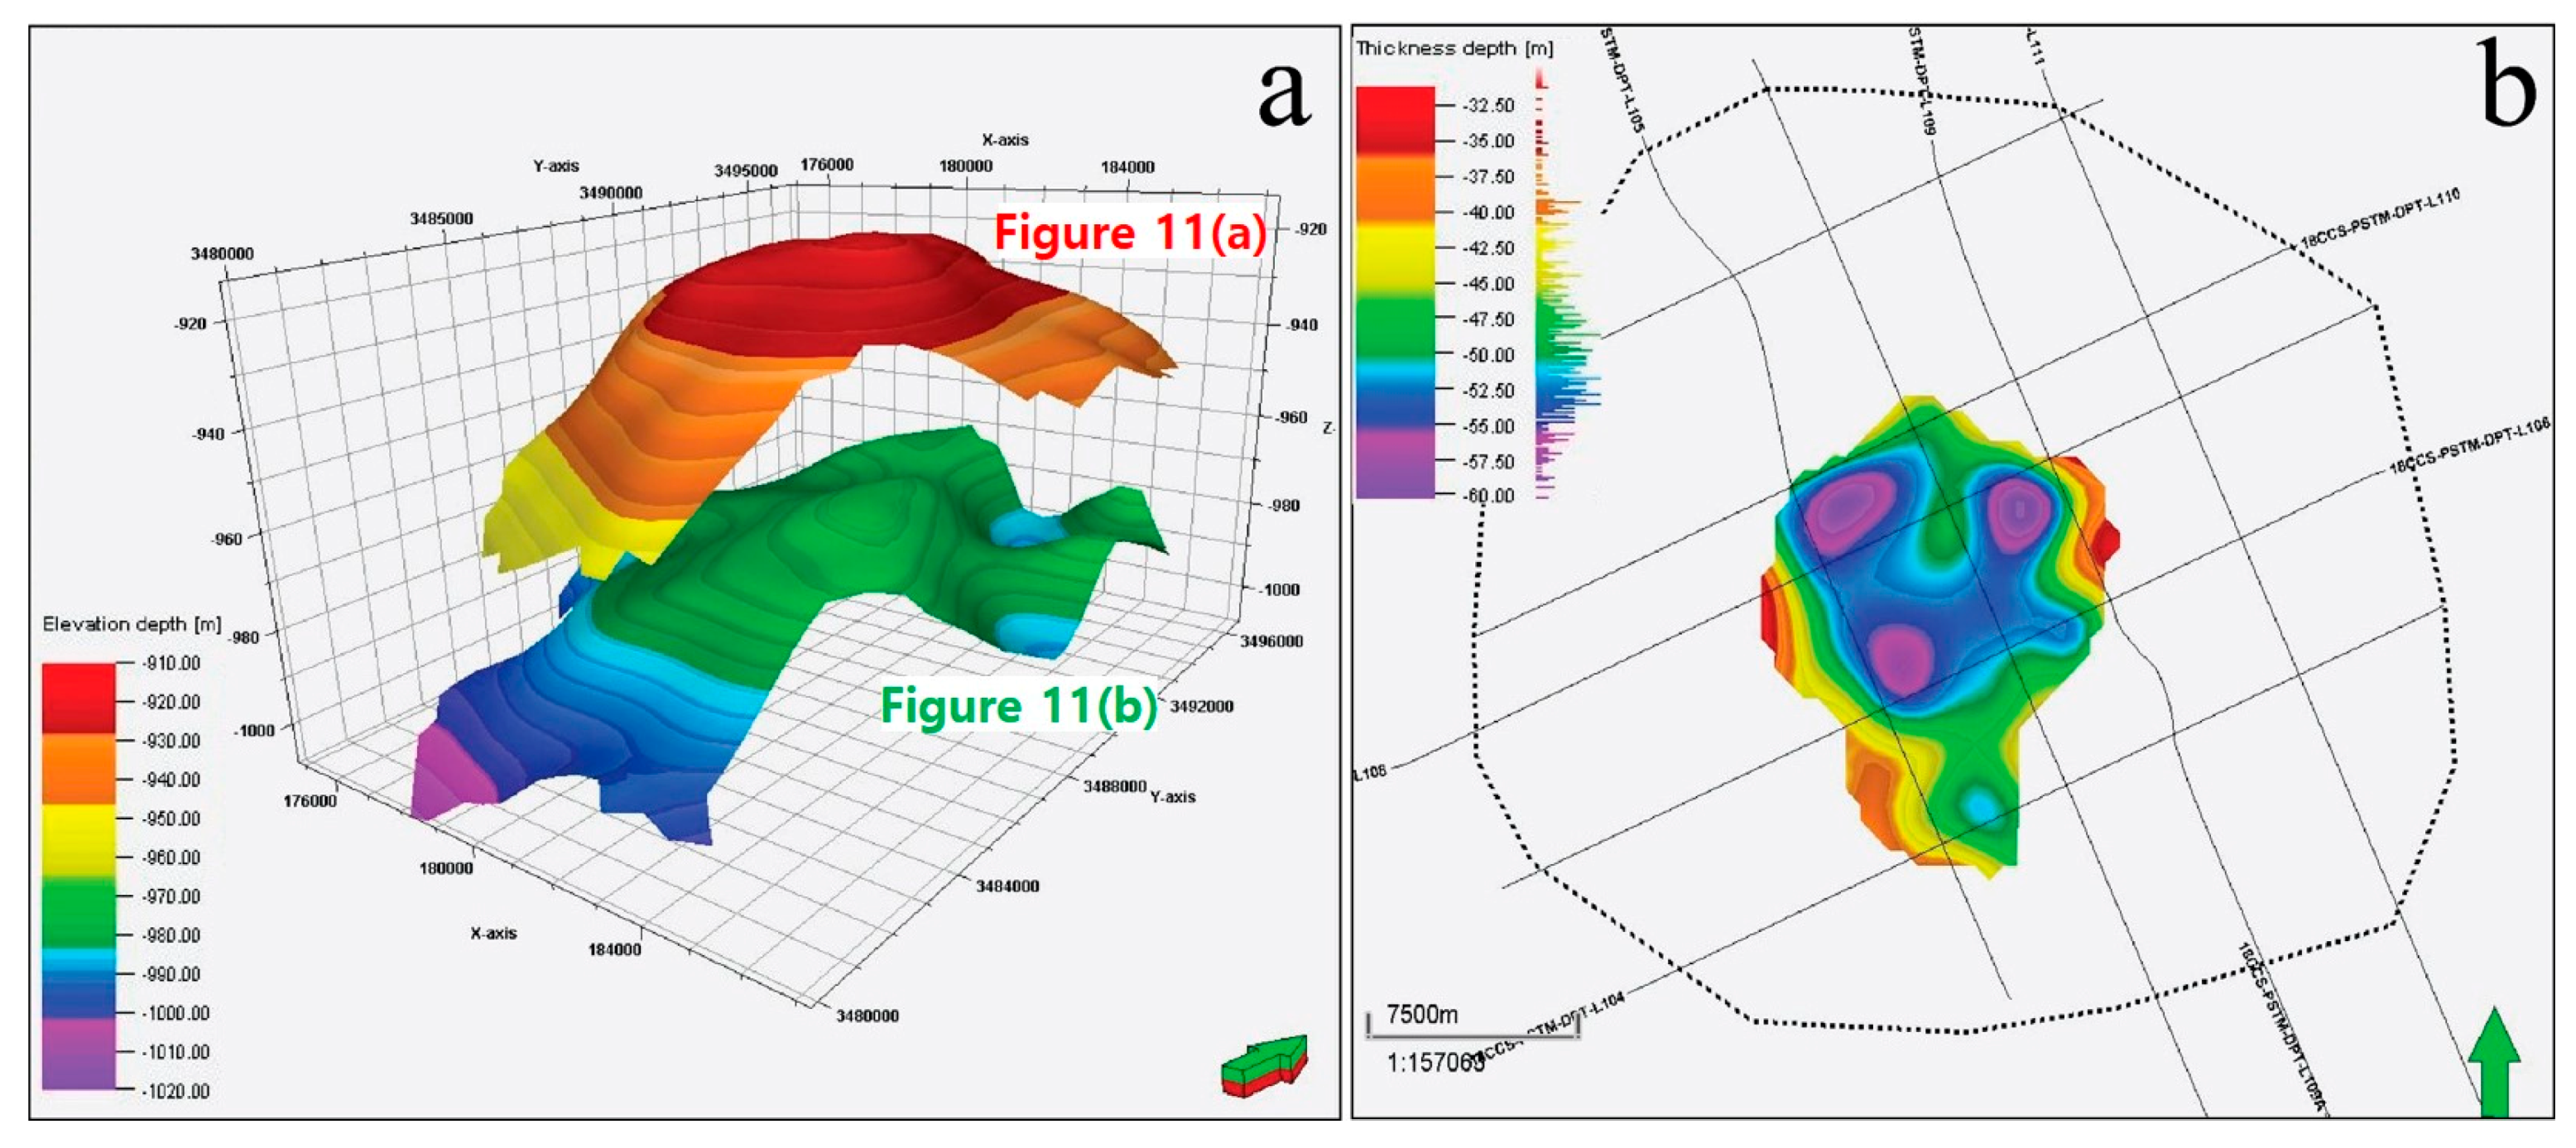
In order to compare the results obtained before and after the depth processing using the MVA technique was applied, we interpreted a reflector, which was strong amplitude (Figure 11). We picked the same reflector from the results obtained both before and after depth processing was applied, and the reflectors are represented by contour maps in Figure 11a,b. We confirmed the boundary using the seismic attribute of RMS analysis, indicating an amplitude anomaly (Figure 11c,d). The RMS seismic attribute is a post-stack analysis technique and computes the square root of the sum of squared amplitudes within the specified window used.
The strong reflector from time processing (upper image in Figure 12a) vertically ranged from 910 to 980 m, while the reflector from both time and depth processing (lower image in Figure 12a) was mainly positioned below, ranging from approximately 970 to 1020 m. The reflector was interpreted as the top of the volcanic mound. The volcanic body showed high acoustic impedance compared with the surrounding clastic rocks, and products derived from igneous rocks could be easily detected in sedimentary basins. The reflector constrained to the RMS seismic attribute showed a circle-shaped geometry and the volcanic body was located high in the center, indicating a volcanic mound (Figure 11a,c). Compared with mound shape, in both time and depth processing (Figure 11b,d), lateral changes were presented in greater detail, although the mound subjected to only time processing (Figure 11a,c) was smoother. As a result of the interpretation, the results (Figure 12a) from both time and depth processing using MVA show that the volcanic mound vertically shifted to a deeper position. The difference (Figure 12b) in the mound before and after depth processing was applied was varied, ranging from 32.5 to 60 m. We suggest that geological geometry or objects derived from both time and depth processing using MVA represent vertical differences and show lateral variations (Figure 12b).

5. Discussion

The direct subsurface information of a volcanic area can be acquired from the results of analysis by drilling a core and well-logging. In the research area, we unfortunately did not have adequate drilling or logging data. From the seismic survey data, we inferred a basalt flow with strong amplitude contrast but could not determine the precise depth of the target structure. Various geophysical methods pose challenges to acquiring the basalt depth from indirect survey data. We focused on improving the velocity by using composite seismic data-processing modules. MVA yielded accurate velocity information, and it is one of the most innovative techniques among the tomography-based methods. Another option for successful velocity calculation is the full waveform inversion method [29,30], which is based on wave equation extrapolation. The selection of a velocity-calculation method might be dependent on the available seismic data and geological interpretation.
The present seismic data-processing flow showed increased horizontal continuity with regard to expansion phenomena, which leads to a reduced elevation range but a more complicated shape. If more dense, gridded 3D seismic exploration data can be obtained and processed, and more specific basalt eruptions can be observed in seismic images. Even in the case of a 3D survey, the large aspect of the horizontal change will be similar and the vertical depth will be similar, as demonstrated by the present results.
One challenge that remains unresolved is the tracking of changes in the anisotropic medium. Although the basalt flow shows less anisotropy, it is necessary to accurately consider the anisotropy of the cap rocks and images because it has migrated from the eruption location. To consider the anisotropy, it is recommended to record the seismic reflection signal using a streamer for as long as possible. With large offset data, anisotropic MVA [31,32] will be possible, enabling the boundary of the basalt flow to be defined more accurately.

6. Conclusions

The resolution of the basalt flow structure was improved by the use of optimized time- and depth-domain data processing of offshore seismic data regarding the use of cap rocks for CO2 storage. Time processing yielded a subsurface image section with an improved signal-to-noise ratio by attenuating multiples and noise. Depth processing refined the velocity distribution so that the depth of the basalt flow was corrected by the lateral and vertical axis. Depth-domain processing used the MVA technique to update the velocity by the iteration of the travel-time calculation. Flattened CRP gathers qualitatively proved that the results of the processing approached the exact depth of the basalt flow. To quantify the accuracy of MVA, we confirmed that the velocity error stably decreased until third iteration. The slice map showed the aspect of basalt intrusion in detail and suggested that the cap rock was located at a greater depth of approximately 32.5–60 m compared with when only time-domain processing was applied. Comprehensive seismic data processing including both the time and depth domains is required when a relatively deep subsurface structure resulting from volcanic activity is to be imaged.

Author Contributions

Conceptualization, S.C. and M.K.; methodology, W.S. and S.C.; software, W.S. and C.L.; validation, W.S., S.C. and M.K.; investigation, S.C.; data curation, S.C. and M.K.; writing—original draft preparation, W.S., S.C. and C.L.; writing—review and editing, W.S., S.C. and M.K. All authors have read and agreed to the published version of the manuscript.

Funding

This research was funded by the Korea Institute of Geoscience and Mineral Resources (KIGAM), grant numbers 21-3413-1 (Technology development for storage efficiency improvement and safety assessment of CO2 geological storage) and 21-3312-1 (Development of the integrated geophysical survey and real-scale data processing technologies for 3D high-resolution imaging of the marine subsurface).

Institutional Review Board Statement

Not applicable.

Informed Consent Statement

Not applicable.

Data Availability Statement

Not applicable.

Acknowledgments

The software Generic Mapping Tools was used to plot the map of the study area [33].

Conflicts of Interest

The authors declare no conflict of interest.

References

  1. US Government. How Much of the Earth is Volcanic? Available online: https://www.usgs.gov/faqs/how-much-earth-volcanic?qt-news_science_products=0#qt-news_science_products (accessed on 18 March 2021).
  2. Blaikie, T.N.; Ailleres, L.; Betts, P.G.; Cas, R.A.F. Interpreting subsurface volcanic structures using geologically constrained 3-D gravity inversions: Examples of maar-diatremes, Newer Volcanics Province, Southeastern Australia. J. Geophys. Res. Solid Earth 2014, 119, 3857–3878. [Google Scholar] [CrossRef]
  3. Aiello, G.; Angelino, A.; D’Argenio, B.; Marsella, E.; Pelosi, N.; Ruggieri, S.; Siniscalchi, A. Buried volcanic structures in the Gulf of Naples (Southern Tyrrhenian Sea, Italy) resulting from high resolution magnetic survey and seismic profiling. Ann. Geophys. 2005, 48, 883–897. [Google Scholar]
  4. Tsuru, T.; No, T.; Fujie, G. Geophysical imaging of subsurface structures in volcanic area by seismic attenuation profiling. Earth Planets Space 2017, 69, 1–12. [Google Scholar] [CrossRef]
  5. Klamer, S.; Klamer, O. Identification of paleo-volcanic rocks on seismic data. In Updates in Volcanology—A Comprehensive Approach to Volcanological Problems, 1st ed.; Stoppa, F., Ed.; InTech: Rijeka, Croatia, 2012. [Google Scholar]
  6. Bruno, P.P.G.; Cippitelli, G.; Rapolla, A. Seismic study of the Mesozoic carbonate basement around Mt. Somma-Vesuvius, Italy. J. Volcanol. Geotherm. Res. 1998, 84, 311–322. [Google Scholar] [CrossRef]
  7. Lomax, A.; Zollo, A.; Capuano, P.; Virieux, J. Precise, absolute earthquake location under Somma-Vesuvius volcano using a new three-dimensional velocity model. Geophys. J. Int. 2001, 146, 313–331. [Google Scholar] [CrossRef]
  8. Hooft, E.E.E.; Heath, B.A.; Toomey, D.R.; Paulatto, M.; Papazachos, C.B.; Nomikou, P.; Morgan, J.V.; Warner, M.R. Seismic imaging of Santorini: Subsurface constraints on caldera collapse and present-daymagma recharge. Earth Planet. Sci. Lett. 2019, 514, 48–61. [Google Scholar] [CrossRef]
  9. Tartarello, M.C.; Palisant, A.; Bigi, S.; Beaubien, S.E.; Graziani, S.; Lombardi, S.; Ruggiero, L.; De Angelis, D.; Sacco, P.; Maggio, E. Preliminary results of geological characterization and geochemical monitoring of Sulcis Basin (Sardinia), as a potential CCS site. Ener. Proc. 2017, 125, 549–555. [Google Scholar] [CrossRef]
  10. McGrail, B.P.; Schaef, H.T.; Ho, A.M.; Chien, Y.; Dooley, J.J.; Davidson, C.L. Potential for carbon dioxide sequestration in flood basalts. J. Geophys. Res. Space Phys. 2006, 111, B12201. [Google Scholar] [CrossRef]
  11. Busch, A.; Amann, A.; Bertier, P.; Waschbusch, M.; Krooss, B.M. The significance of caprock sealing integrity for CO2 storage. In Proceedings of the SPE International Conference on CO2 Capture, Storage and Utilization, New Orleans, LA, USA, 10–12 November 2010. [Google Scholar]
  12. Matter, J.M.; Stute, M.; Snaebjornsdottir, S.O.; Oelkers, E.H.; Gislason, S.R.; Aradottir, E.S.; Sigfusson, B.; Gunnarsson, I.; Sigurdardottir, H.; Gunnlaugsson, E.; et al. Rapid carbon mineralization for permanent disposal of anthropogenic carbon dioxide emissions. Science 2016, 352, 1312–1314. [Google Scholar] [CrossRef] [Green Version]
  13. Jayne, R.S.; Wu, H.; Pollyea, R.M. Geologic CO2 sequestration and permeability uncertainty in a highly heterogeneous reservoir. Int. J. Green. Gas. Cont. 2019, 83, 128–139. [Google Scholar] [CrossRef]
  14. Kang, M.; Kim, J.H.; Kim, K.; Cheong, S.; Shinn, Y.J. Assessment of CO2 storage capacity for basalt caprock-sandstone reservoir system in the northern East China Sea. In Proceedings of the EGU General Assembly Conference Abstract, Vienna, Austria, 8–13 April 2018; p. 5772. [Google Scholar]
  15. Huh, D.; Park, Y.; Yoo, D.; Hwang, S. CO2 geological storage potential in Korea. Ener. Proc. 2011, 4, 4881–4888. [Google Scholar] [CrossRef] [Green Version]
  16. Litt, T.; Krastel, S.; Sturm, M.; Kipfer, R.; Orcen, S.; Heumann, G.; Franz, S.O.; Ulgen, U.B.; Niessen, F. ‘PALEOVAN’, International Continental Scientific Drilling Program (ICDP): Site survey results and perspectives. Quat. Sci. Rev. 2009, 28, 1555–1567. [Google Scholar] [CrossRef]
  17. Stork, C.; Clayton, R.W. Linear aspects of tomographic velocity analysis. Geophysics 1991, 56, 483–495. [Google Scholar] [CrossRef]
  18. Stork, C. Reflection tomography in the postmigrated domain. Geophysics 1992, 57, 680–692. [Google Scholar] [CrossRef]
  19. Niino, H.; Emery, K.O. Sediments of shallow portions of East China Sea and South China Sea. Geol. Soc. Am. Bull. 1961, 72, 731–762. [Google Scholar] [CrossRef]
  20. Cukur, D.; Horozal, S.; Kim, D.C.; Han, H.C. Seismic stratigraphy and structural analysis of the northern East China Sea Shelf Basin interpreted from multi-channel seismic reflection data and cross-section restoration. Mar. Pet. Geol. 2011, 28, 1003–1022. [Google Scholar] [CrossRef]
  21. Lee, G.H.; Kim, B.; Shin, K.S.; Sunwoo, D. Geologic evolution and aspects of the petroleum geology of the northern East China Sea shelf basin. AAPG Bull. 2006, 90, 237–260. [Google Scholar] [CrossRef]
  22. Lee, C.; Shinn, Y.J.; Han, H.-C. Structural evolution of two-stage rifting in the northern East China Sea Shelf Basin. Geol. J. 2019, 54, 2229–2240. [Google Scholar] [CrossRef] [Green Version]
  23. Korea Institute of Geoscience and Mineral Resources. Hydrocarbon Potential of the Northern East China Shelf Basin, I; KIGAM Report; KIGAM: Daejeon, Korea, 1997; (written in Korean with English abstract). [Google Scholar]
  24. Shin, S.Y.; Kang, M.; Shinn, Y.J.; Cheong, S. Assessment of CO2 geological storage capacity for basalt flow structure around PZ-1 exploration well in the Southern Continental Shelf of Korea. Econ. Environ. Geol. 2020, 53, 33–43, (written in Korean with English abstract). [Google Scholar]
  25. Dix, C.H. Seismic velocities from surface measurements. Geophysics 1955, 20, 68–86. [Google Scholar] [CrossRef]
  26. Vidale, J. Finite-difference calculation of traveltimes in three dimensions. Geophysics 1990, 55, 521–526. [Google Scholar] [CrossRef] [Green Version]
  27. Gray, S.H.; May, W.P. Kirchhoff migration using eikonal equation traveltimes. Geophysics 1994, 59, 810–817. [Google Scholar] [CrossRef]
  28. Yilmaz, O. Seismic Data Analysis: Processing, Inversion, and Interpretation of Seismic Data, 2nd ed.; SEG: Tulsa, OK, USA, 2001. [Google Scholar]
  29. Virieux, J.; Operto, S. An overview of full-waveform inversion in exploration geophysics. Geophysics 2009, 74, WCC127–WCC152. [Google Scholar] [CrossRef]
  30. Son, W.; Pyun, S.; Shin, C.; Kim, H. Laplace-domain wave-equation modeling and full waveform inversion in 3D isotropic elastic media. J. Appl. Geophys. 2014, 105, 120–132. [Google Scholar] [CrossRef]
  31. Zhou, H.; Pham, D.; Gray, S. Tomographic velocity analysis in strongly anisotropic TTI media. In Proceedings of the 74th Annual International Meeting of the SEG, Expanded Abstracts, Denver, CO, USA, 10–15 October 2004; pp. 2347–2350. [Google Scholar]
  32. Li, Y.; Biondi, B. Migration velocity analysis for anisotropic models. In Proceedings of the 81st Annual International Meeting of the SEG, Expanded Abstracts, San Antonio, TX, USA, 18–23 September 2011; pp. 201–206. [Google Scholar]
  33. Wessel, P.; Smith, W.H.F.; Scharroo, R.; Luis, J.; Wobbe, F. Generic mapping tools: Improved version released. EOS Trans. AGU 2013, 94, 409–410. [Google Scholar] [CrossRef] [Green Version]
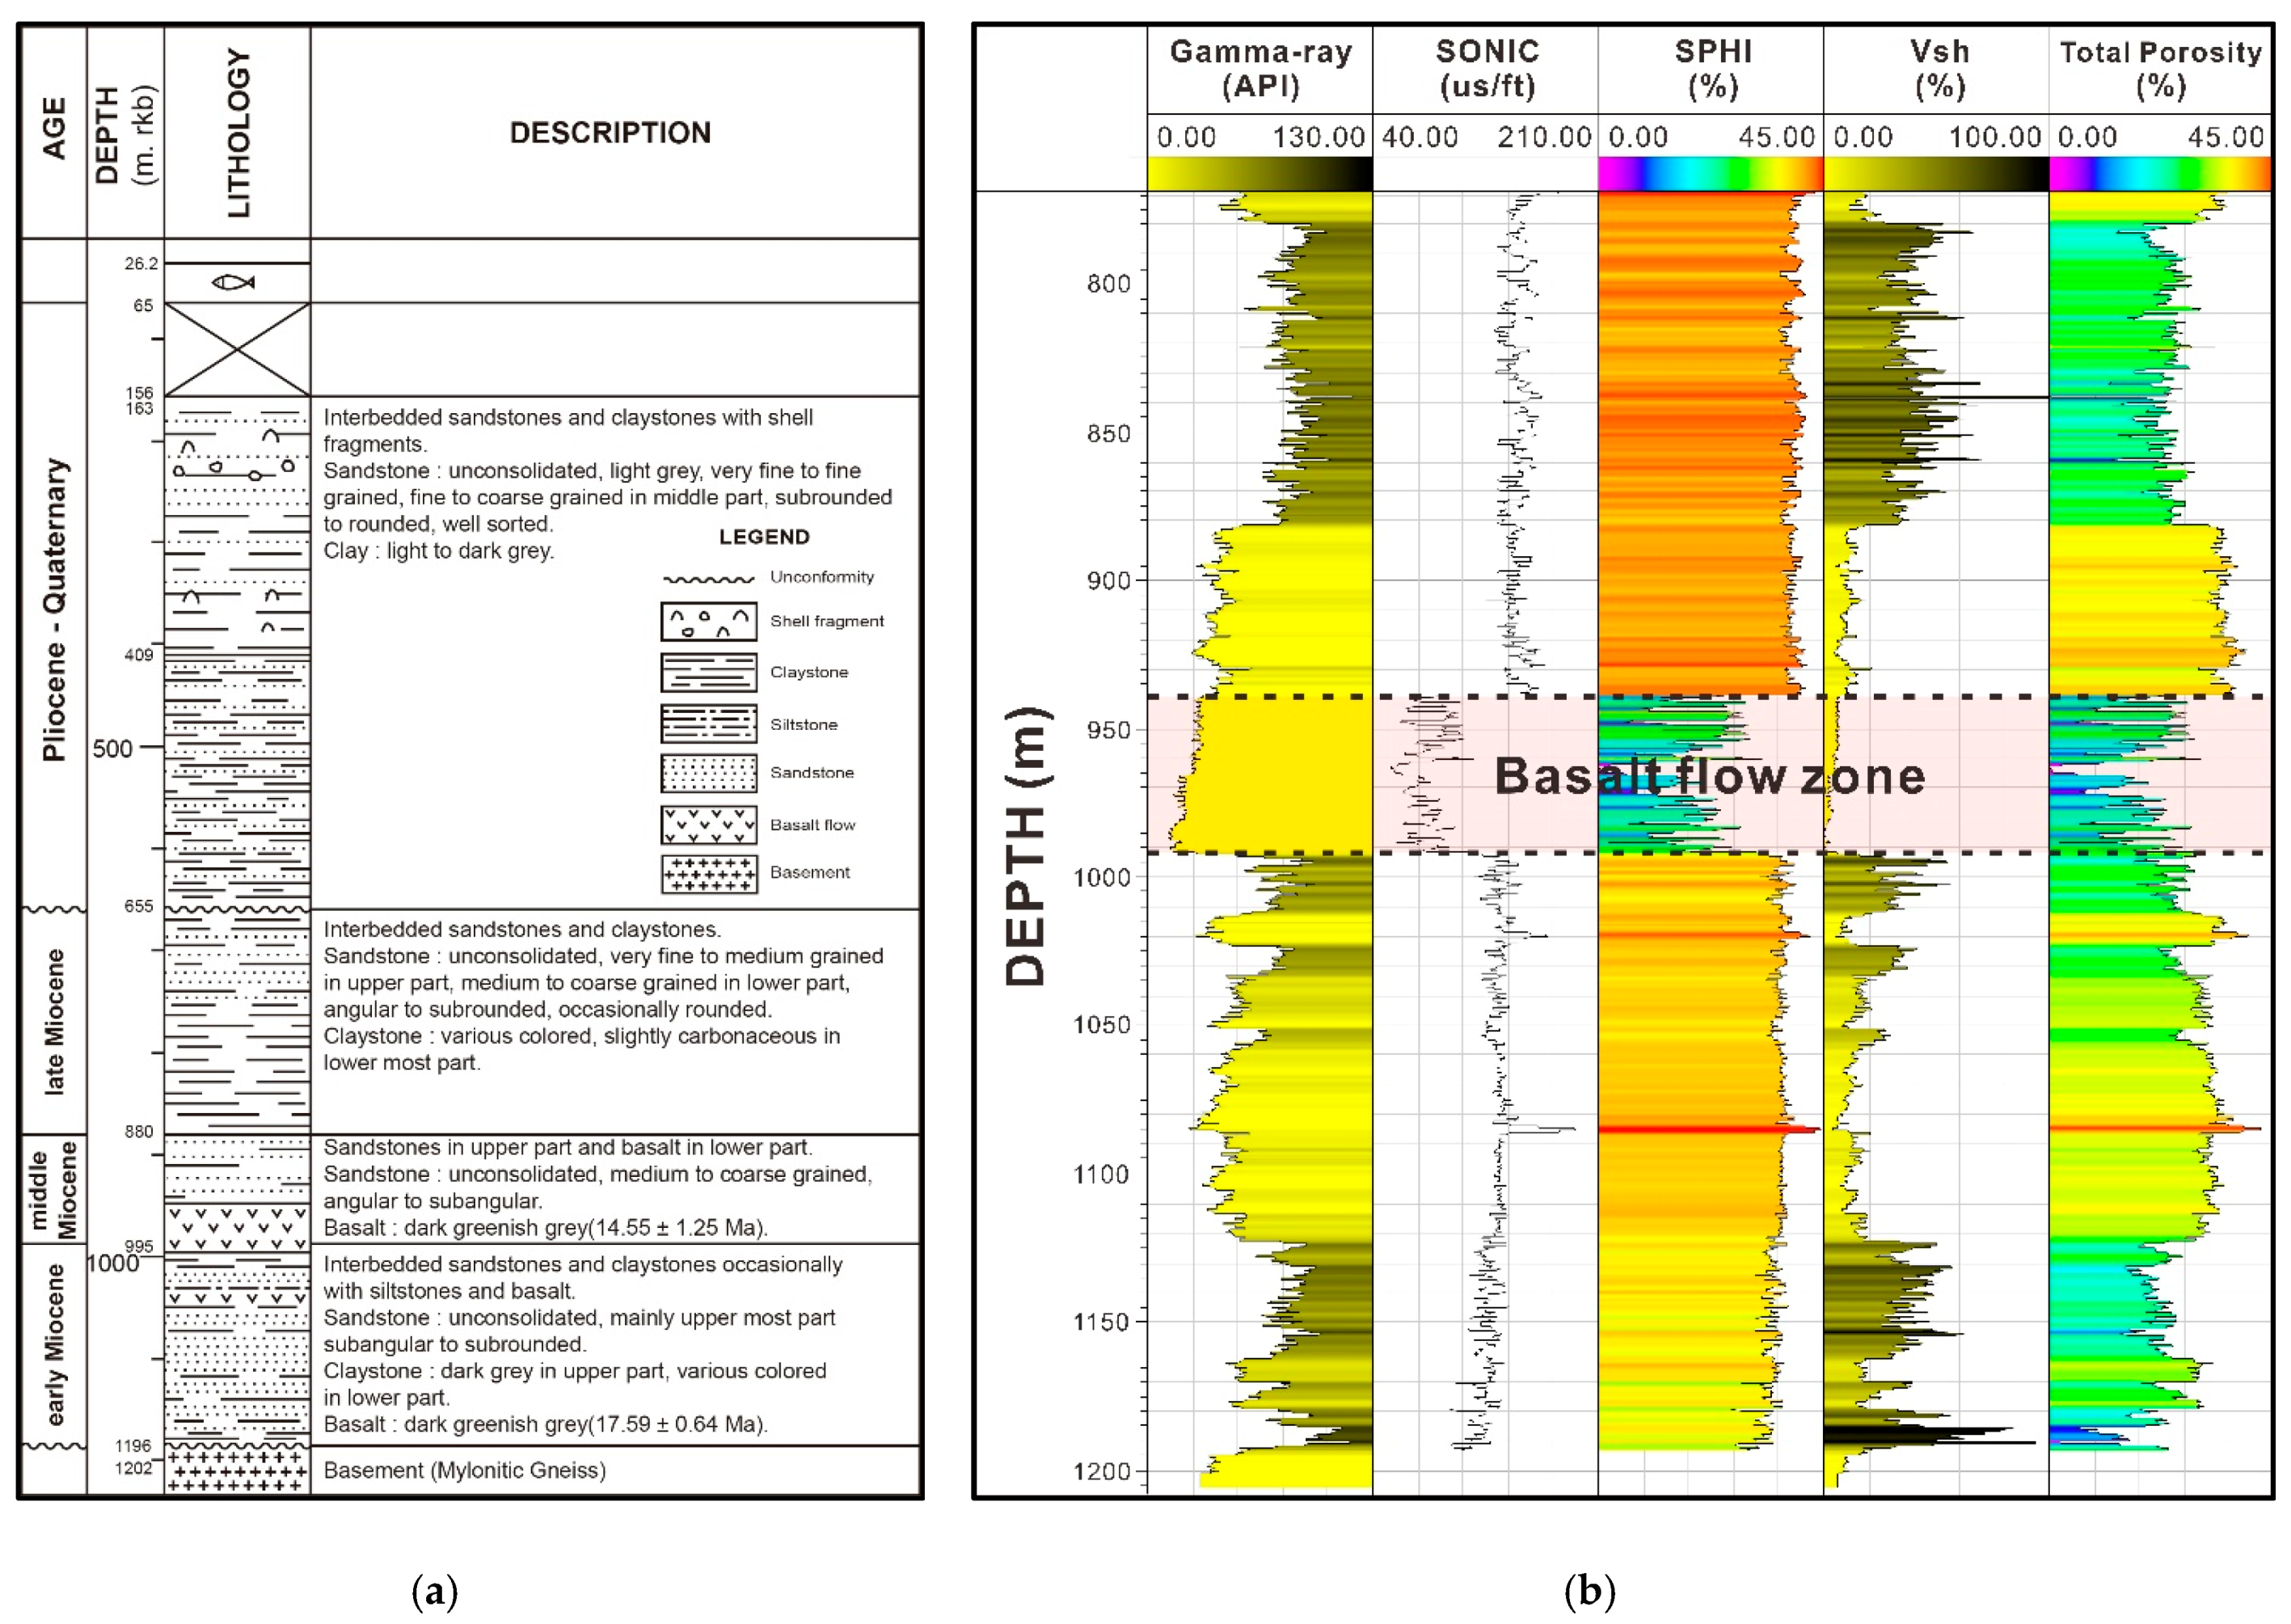
Figure 2. (a) Geological summary of previous well-log of an adjacent study area (modified from [23]) and (b) well-log analysis of (a) with storage potential zone. SPHI: sonic-derived porosity. Vsh: shale volume.
Applsci 11 04244 g002
Figure 3. Seismic data processing workflows in the (a) time and (b) depth domains.
Applsci 11 04244 g003
Figure 4. Shot gathers (a) before and (b) after the signal processing. (c) Amplitude spectra before (black line) and after (red line) the signal processing.
Applsci 11 04244 g004
Figure 5. (a) Stack section after applying only the preliminary processing in time-processing workflow. (b) Stack section after applying the entire time-processing workflow (Figure 3a).
Applsci 11 04244 g005
Figure 6. (a) Initial depth-domain interval velocity for MVA obtained by converting the time-domain RMS velocity. (b) Final updated depth-domain interval velocity after MVA at the 3rd iteration. (c) Difference between (a) and (b).
Applsci 11 04244 g006aApplsci 11 04244 g006b
Figure 7. (a) CRP gather before MVA and (b) CRP gather after MVA at the third iteration.
Applsci 11 04244 g007
Figure 8. Velocity error curve at a depth of 960 m in the 2705th CRP gather.
Applsci 11 04244 g008
Figure 9. (a) Depth-domain stack section obtained by converting the time-domain result (Figure 5b). (b) Depth-domain stack section after applying MVA at the 3rd iteration. The red and green lines represent the top of the basalt before and after applying MVA, respectively. The difference in depth between the two basalt tops ranges from 32.5 to 60 m.
Applsci 11 04244 g009
Figure 10. 3D depth-domain stack sections after applying MVA at the 3rd iteration. The green and blue lines represent the top of the basalt before and after applying MVA, respectively.
Applsci 11 04244 g010
Figure 11. Contour maps of the strong reflector and RMS attributes. Geologically interpreted tops of the volcanic mounds (a) before and (b) after depth processing. RMS amplitude attributes (c) before and (d) after depth processing showing volcanic mounds’ anomalous region.
Applsci 11 04244 g011
Figure 12. (a) Overlapping tops of the volcanic mounds before (Figure 11a) and after (Figure 11b) the depth processing. (b) The contour map represents vertical differences between Figure 11a,b.
Applsci 11 04244 g012
Table 1. Seismic data acquisition parameters.
ParameterDescriptionValue
StreamerStreamer length (m)1200
No. of channels96
Group interval (m)12.5
Offset ranges (m)125~1325
Streamer depth (m)7 ± 1
RecordingRecording length (s)5
Sampling rate (ms)1
SourceSource typeBolt long-life air guns
Source volume (cu. in.)1254
Source depth (m)5
Source interval (m)25
Publisher’s Note: MDPI stays neutral with regard to jurisdictional claims in published maps and institutional affiliations.