1. Introduction
Many studies on coating formation methods were carried out in the past century. The development of a coating on a metal surface can change the workpiece properties in order to satisfy the features required by the application. In particular, the evolution of attractive finishing is increasingly important. The formation of colored patinas on metal surfaces is widely studied to combine utility with aesthetic properties, and functional and mechanical aspects with decorative and beautiful effects [
1]. Many studies are carried out on conversion coatings, which modify the chemical composition of metal surface with the formation of oxides [
2,
3,
4]. Both chemical and electrochemical processes can provide the formation or deposition of conversion coatings. In chemical processes, the oxide coatings are obtained by simple immersion of the component in oxidizing solution, whereas in electrochemical processes, it is essential to use an electrical current, which is the major factor in process control and has an anodic role [
5]. Anodizing or anodic oxidation is an important industrial electrochemical process used on aluminum and its alloys. In fact, anodized aluminum products find application in very different fields: outdoor architectural components, furniture, appliances, and airplane, boat and automotive components. The oxide layer enhances the corrosion and wear resistance and aesthetic finishing features. Another benefit deriving from anodizing is the possibility to obtain a colored coating. The process is generally performed in an acid solution (electrolyte) in which are dipped the metal that has to be anodized (anode) and another metal (cathode). The most common electrolyte is sulfuric acid, but oxalic, chromic, and phosphoric acids are also used. If the oxide is not soluble in an electrolyte bath, the resultant layer is thin, nonporous and nonconductive. If the oxide is partially soluble in the bath, the coating appears porous. The porosity of the coating allows coloring of the oxides using organic dyes, inorganic pigments or electrolytic deposition of different metals onto the pores of the film. After the first anodizing step, the components are immersed in specific baths. Electrolytic coloring treatment use alternate current in a bath containing metal salts such as nickel, tin, and cobalt. The resulting layer can be blue, black, golden, or green. The major factors linked to the final color are potential application and treatment time [
6,
7].
Multicolor anodizing has gained importance, especially for the production of instruments panels, nameplates, and in the automotive and appliances fields. This technique provides the formation of two or more different colors on the parts of the surface. The process is divided into two possible configurations: single and multiple anodizing. After a previous complete cycle of anodizing, coloring and sealing, multiple anodizing involves covering of selected areas, stripping of the anodic coating from the uncovered areas and repeating the entire procedure to obtain different colors. Single anodizing is used to achieve a dark shade; a resist is applied and the dye discharges or becomes lighter while the anodic film remains intact. The resist is removed and the operation is repeated to reach each desired shade [
8,
9].
Besides anodizing, many solutions have been developed to color aluminum by a single-step chemical coloring process.
Sharma et al. [
10] used aqueous solution with cobaltous nitrate, in which the articles are dipped. The piece was heated and the color appeared. The color depends on the degree of heat: at low temperature a grey superficial film is obtained, at higher temperature the coating appears dark black.
Black coatings are obtained also by immersion of aluminum in a hot solution containing molybdates or antimony chloride [
4].
John et al. [
4] achieved color ranging from grey to black, yellow, and brown using an alkaline ammoniacal solution containing triethanolamine and metallic carbonates at operating temperature of 353–363 K.
Rungta et al. [
11] studied a way to form a black film on aluminum alloys using a chemical process without first requiring anodizing. The aqueous solution tested contained chlorides, sulfates, and bicarbonates of sodium salts and the operative temperature of the bath was 353–363 K [
11].
In order to have an alternative to anodizing and to reduce energy costs in term of temperature and current, the purpose of this work is to create a colored coating on an aluminum surface with aqueous solutions operating at room temperature or warm temperature using an electroless process. The resulting coated samples were characterized using stereo microscope, SEM, and XRD to evaluate their performance. Moreover, potentiodynamic polarization and EIS tests were performed to study the corrosion behavior of the coatings.
2. Materials and Methods
Samples of aluminum alloy AA6060 (sheets of 1.5 mm of thickness) were used as substrate for obtaining a black coating with electroless treatments. The composition of the alloy, obtained with GDOES (Horiba Jobin Yvon RJ RF-GD profiler, Horiba, Palaiseau, France), is reported in
Table 1. The initial state of the untreated aluminum sample is shown in
Figure 1.
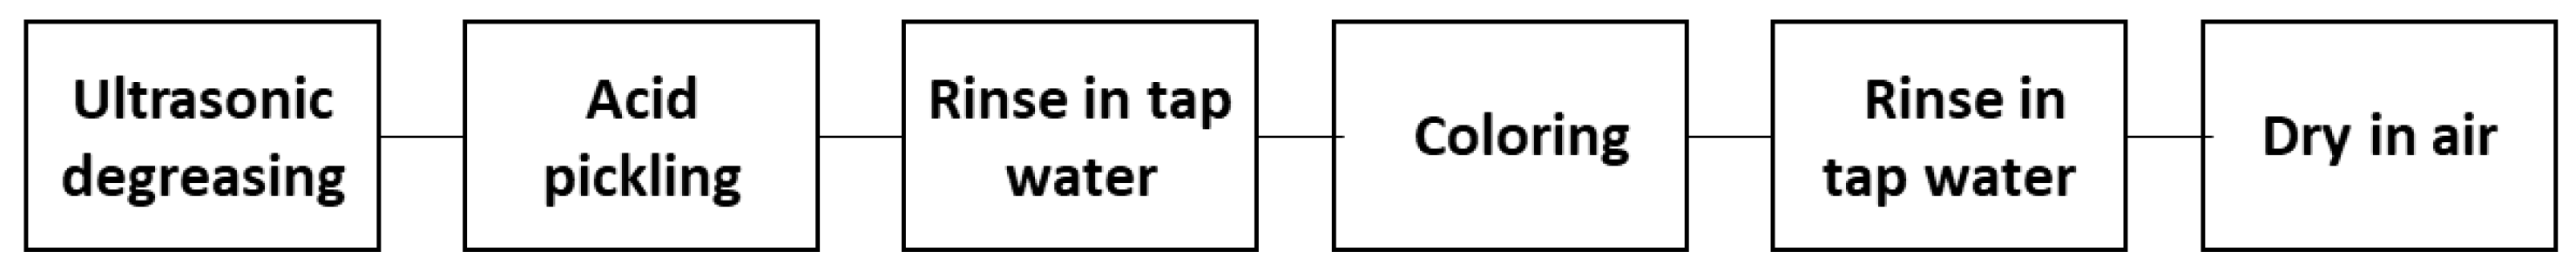
The whole process for obtaining black coatings is better summarized in
Figure 2.
Metal samples were carefully degreased with ethanol by ultrasound for 5 min in order to remove dust, grease, and oil interfering with the coloring process. Because of the passive nature of aluminum, the second step was a strong pickling in a hydrofluoric/nitric acid solution with a ratio 1:99, for a pickling time of 30 s, to activate the surface and remove the protective oxide [
12]. After a tap water rinse, two different solutions were tested to perform the process (coloring step in the flow chart in
Figure 2). The two solutions contained the same chemical compounds but with different amounts. Moreover, the two solutions were employed at different temperatures: solution 1 was used at 50 °C, in order to accelerate the reaction, whereas solution 2 was employed at ambient temperature and the reaction was accelerated, increasing the concentration of the chemical elements up to the solubility limit. Chemical composition is given in
Table 2 for solution 1 and in
Table 3 for solution 2 [
13].
The tested immersion times were 15, 30, 50, 75, and 90 min for solution 1, and 30, 60, and 100 min for solution 2. After the coloring step, the samples were rinsed in tap water and then dried in air. Three samples were produced for each condition and then tested.
The surfaces of the samples were observed with a Zeiss Stemi 2000-C stereo microscope (Carl Zeiss AG, Oberkochen, Germany) in order to obtain information on the aesthetic appearance and the surface morphology. A Cambridge Stereoscan 440 scanning electron microscope (Leica Cambridge Ltd., Cambridge, UK) was used to analyze the surface of the samples in order to identify the coating porosities and other features of the surface. X-ray diffraction (XRD) measurements were conducted to characterize the phase composition of the obtained coating by means of a Siemens D500 X-ray diffractometer (Munich, Germany) using Cu Kα radiation with 2θ ranging from 20° to 80° (0.05° step and 5 s counting time per step) operating in thin-film mode with a grazing angle of 0.5°. Two different electrochemical methods were used to evaluate corrosion behavior of the obtained black layer: potentiodynamic polarization and electrochemical impedance spectroscopy (EIS) tests. In the potentiodynamic polarization and EIS tests we used as an electrolyte a commercial solution that simulates cleaning products (indicative composition: phosphonates, surfactants, phenoxyethanol, and citronellol, Madel Sp.a., Spinea, Italy) for all surfaces. In this way, it was possible to extrapolate corrosion behavior in a specific environment where the coated surface will operate, such as cooking tables. For the potentiodynamic polarization tests an AMEL 2549 potentiostat (Amel S.r. l., Milano, Italy) was employed. A saturated calomel electrode (SCE) was used as a reference electrode, while a platinum cage was employed as a counter electrode. The tests were performed with a scan rate of 0.5 mV/s. The impedance measurements were performed with a Materials Instrument spectrometer (Amel S.r. l., Milano, Italy) connected with the AMEL 2549 potentiostat working at open circuit voltage (OCV), using a range of frequencies between 105 Hz and 10−2 Hz and a perturbation amplitude of 10 mV. The EIS data obtained at the end of the tests were fitted with the software Z-View (v. 3.2.2).
3. Results
3.1. Characterization
The first observation was the qualitative macroscopical investigation of the color of the obtained samples.
Figure 1 and
Figure 2 underline that, besides the employed solution, samples with higher immersion time were characterized by a darker color; that is, the more desirable one during the blackening process. From a macroscopical point of view, the color intensity seemed to be related to the immersion time: by increasing blackening time, the intensity of the black color increased. This result could be observed both with solution 1 at 50 °C (
Figure 3) and with solution 2 at ambient temperature (
Figure 4).
To have more information on the surface from a qualitative point of view, a stereomicroscope analysis was carried out (
Figure 5 and
Figure 6).
From the stereomicroscope study, the remarkable role of time in the coloring of treated metal samples was clearly observable; in fact, for both solutions, the samples blackened with higher treatment time, showing a darker color. To get a deeper analysis of the coating surface, not only in terms of intensity of color but observing the presence of defects, aluminum samples were observed with SEM and the results are reported in
Figure 7 and
Figure 8.
Considering firstly the samples obtained with solution 1,
Figure 7 shows very different features of the layer depending on the immersion time. It is possible to observe that the sample with immersion time of 15 min is more homogeneous than the other samples. In fact, with the increasing of immersion time it was possible to verify the presence of increasing numbers of cracks and porosities.
In particular, in the sample with 50 min of treatment the surface exhibits a lot of cracks due to a non-homogeneous growth of the coating. Some cracks can be observed also for the samples with 75 and 90 immersion times. For those with 30 min of immersion time, the SEM analysis shows a little porosity. The best conditions in terms of uniformity and absence of defects in the dark layer appear to be with immersion times of 15 and 30 min for solution 1 at 50 °C.
For solution 2, (
Figure 8) at room temperature it is possible to verify the absence of cracks in all the samples, but the sample treated over a higher immersion time reveals a smoother and more uniform layer. For low immersion time, there are some zones partially not covered by the black film; this condition can be ascribed to the low immersion time of the treatment and the low temperature [
3,
14].
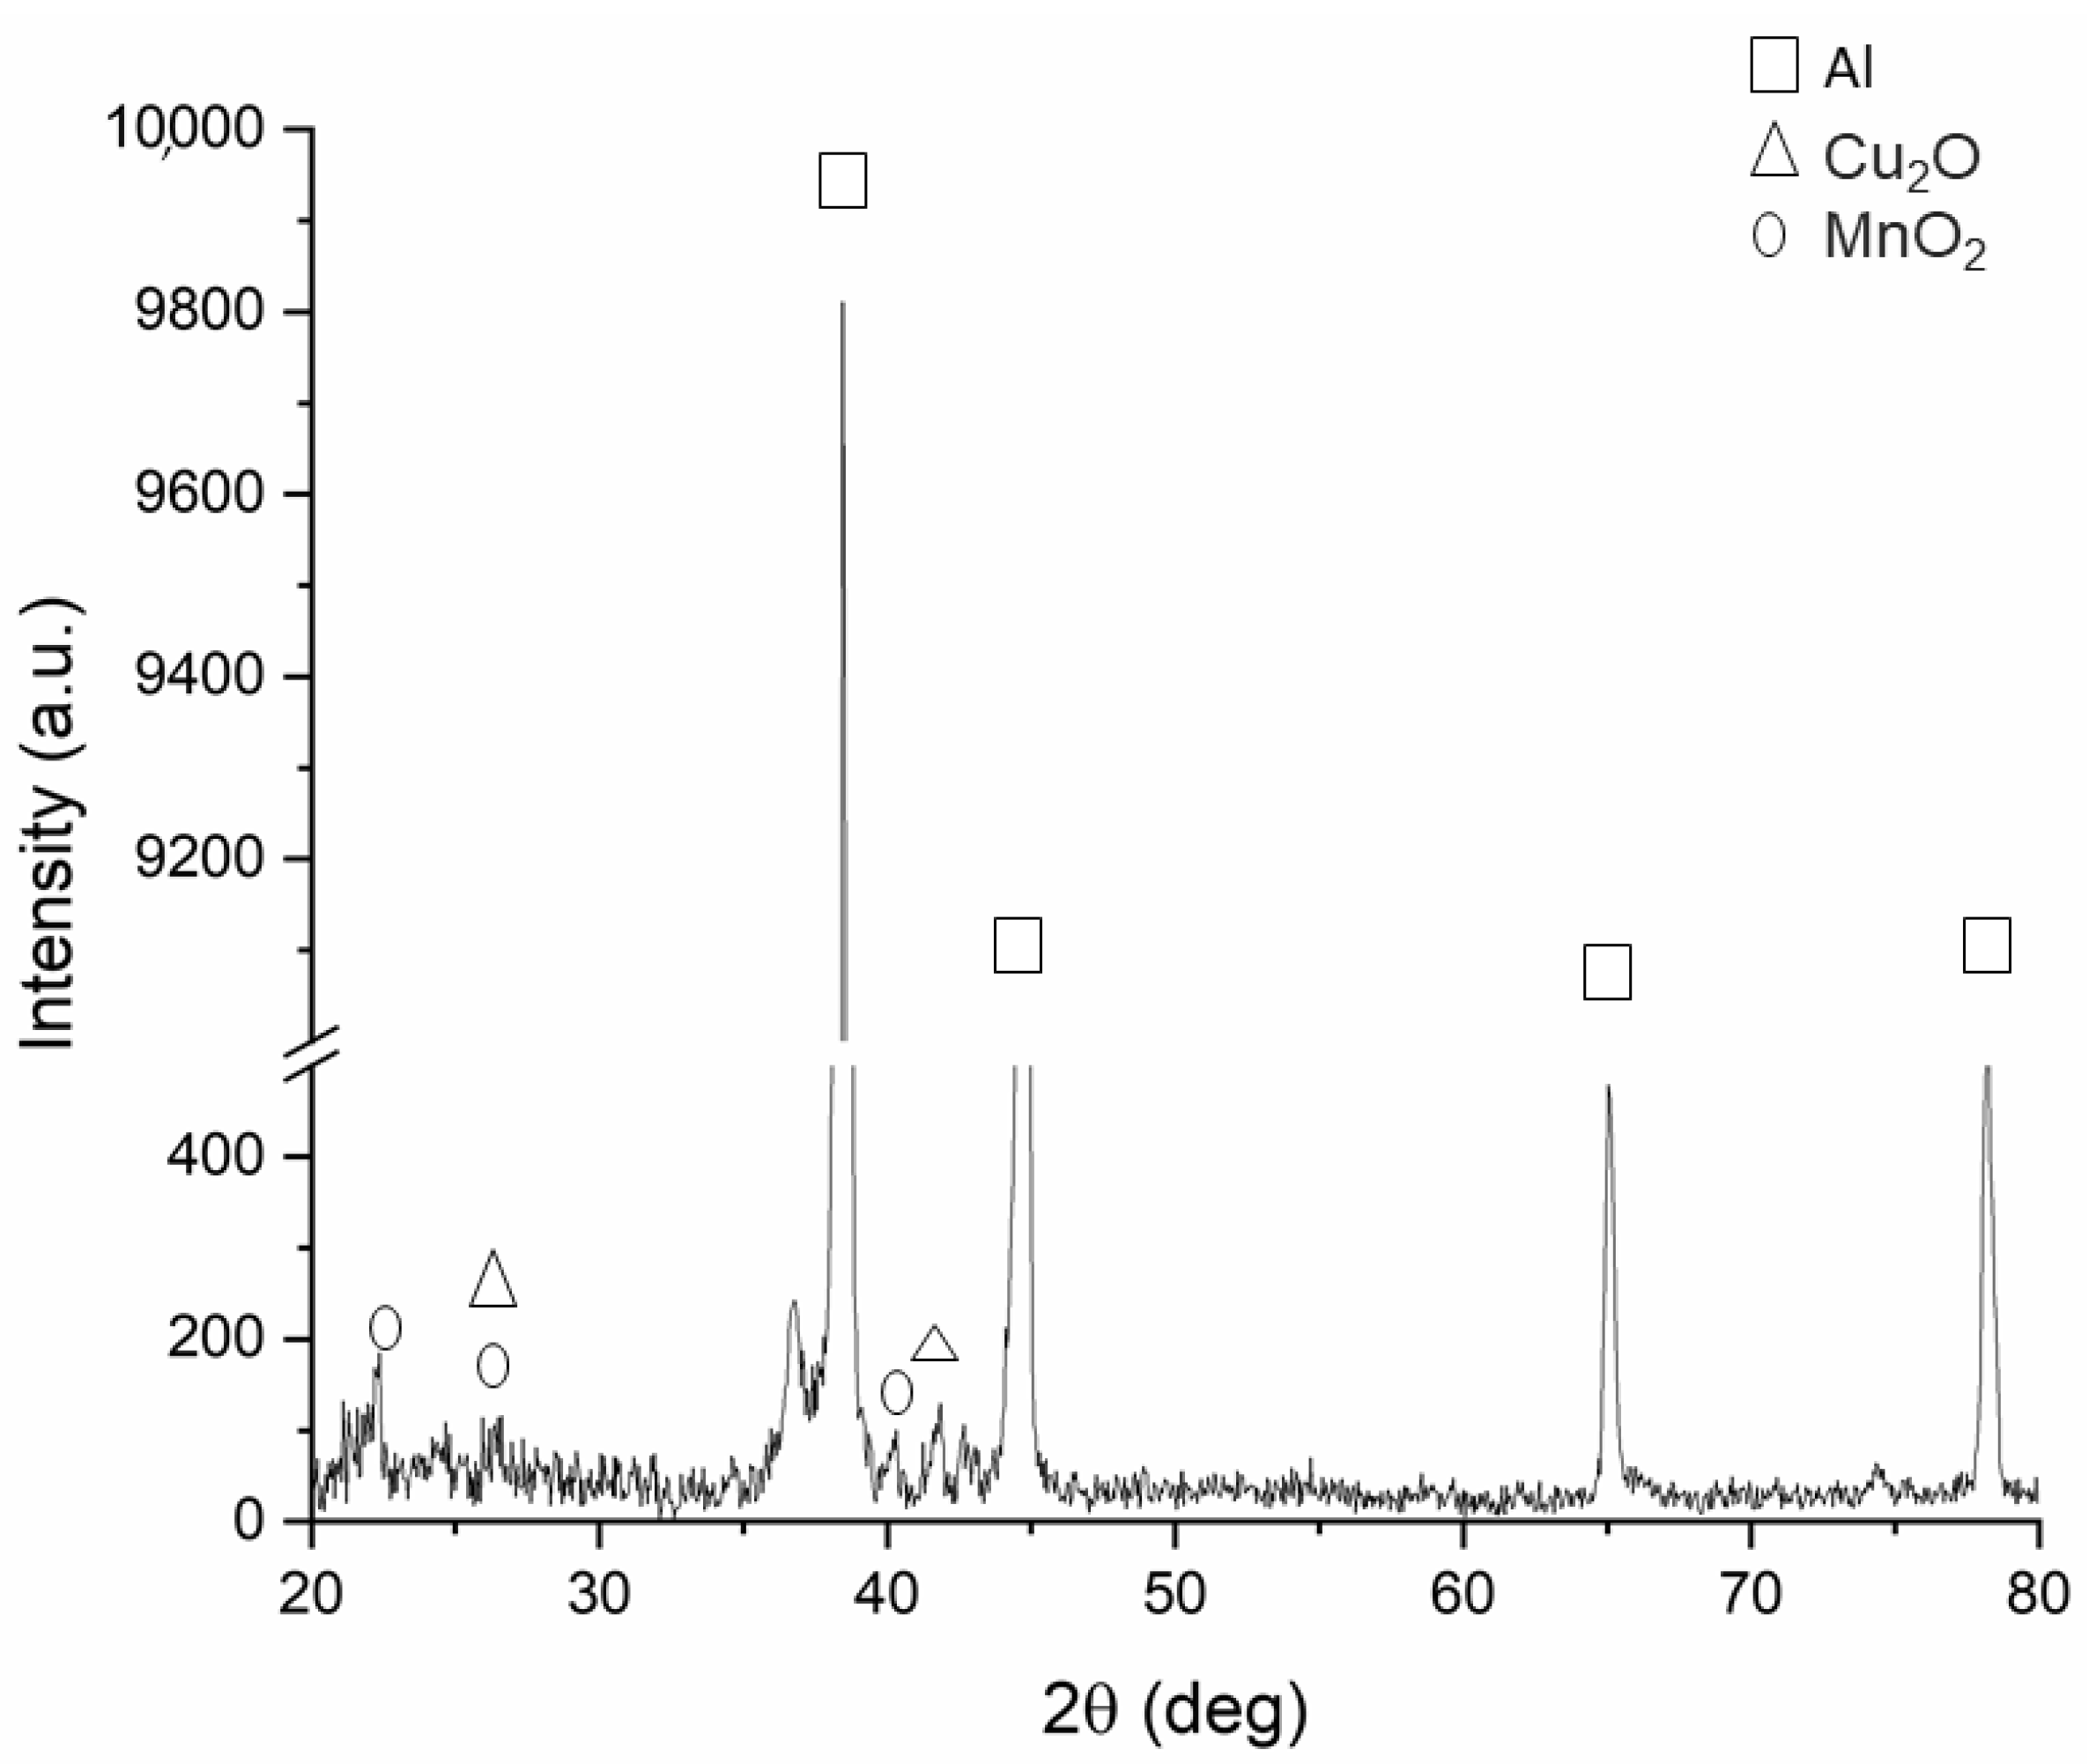
Figure 9 shows an example of the XRD pattern of the black samples. The reported phase analysis was performed on the sample treated with solution 2 for 100 min, which appears as the most promising from SEM observation. Only the results for this sample are reported because for the other samples the results were the same. This is in accordance with the fact that the two solutions have the same chemical composition, and so the chemical reaction between the dissolved salts in the bath and metal ions is the same.
From the analysis of the XRD pattern, the formation of manganese oxide, due to the dissolution of potassium permanganate, can be observed. In fact, according to Equation (1) the dissolution of potassium permanganate provides the formation of the permanganate anion that reacts with the oxygen in the solution to form the manganese oxide, the main constituent of the black oxide [
3,
14].
The sample blackened with solution 2 for 100 min was also studied in cross section with SEM to investigate the thickness of the black coating (
Figure 10).
SEM analysis showed that the coating on the best sample was characterized by a thickness between 0.7 and 1 µm. The coatings adhered to the substrate.
In literature, other processes are also employed to obtain oxide layers on metal surfaces: anodizing in sulfuric acid on aluminum substrate leads to the formation of a coating based on diaspore and alumina [
15], while a layer of alpha alumina and diaspore is developed applying a heat treatment at 883 K on aluminum for 4 h [
16].
In contrast to these processes, the formation of manganese oxide in blackening processes is linked to the chemical reaction and in particular to the reduction of chemical compounds in the oxidizing solution. In this way, diaspore and alumina are not formed during the process and a typical black coating (with the color given by manganese compounds) is formed on the surface.
3.2. Corrosion Test
Potentiodynamic polarization test and electrochemical impedance spectroscopy tests were carried out in an alkaline electrolyte solution containing phosphonates, non-ionic surfactants, and anionic surfactants with pH 11 that simulate the behavior of a commercial cleaning solution.
3.2.1. Potentiodynamic Polarization Tests
Potentiodynamic curves of the samples treated at room temperature and at 50 °C are shown in
Figure 11. The corrosion potential Ecorr and corrosion current density icorr, graphically extrapolated from the curves according to Tafel’s law, are reported in
Table 4 and
Table 5.
Considering the results obtained with solution 1 (
Figure 11a and
Table 4) the formed black layer was characterized by a corrosion current density with the same order of magnitude as that of the samples obtained with 15, 30, 75, and 90 min of treatment time. The same order of magnitude of the current was also observed for the untreated sample (as received AR). The black coating obtained with a blackening immersion time of 50 min presented a corrosion current density an order of magnitude higher than that of the other samples. This result shows that the corrosion rate, directly linked to the corrosion current density, was higher for the sample treated with 50 min immersion time than the other samples. Furthermore, for solution 1, the sample obtained with an immersion time of 50 min exhibited lower corrosion resistance.
Considering the samples obtained with solution 2 (
Figure 11b and
Table 5), it is possible to observe that the corrosion current density for all the samples (treated and untreated) had the same order of magnitude. The same result appeared for the corrosion potential. So it can be concluded that potentiodynamic polarization tests in the alkaline commercial solution did not show a significant difference in terms of corrosion resistance for the samples blackened at room temperature.
Comparing the two blackening solutions, is possible to observe that the corrosion current density had the same order of magnitude for all the samples, except for the one treated at 50 °C for 50 min. To get more significant results in terms of corrosion behavior of the burnished layer with the two baths, EIS measurements were employed.
3.2.2. Electrochemical Impedance Spectroscopy
In order to better understand the corrosion performance of the black coating, electrochemical impedance spectroscopy tests were also performed and the results in terms of Nyquist plot are reported in
Figure 12 for solution 1 and solution 2. The employed electrolyte was the same as the one used for potentiodynamic polarization tests.
Graphical evaluation of the corrosion resistance given by the coating can be considered as the real part of the impedance at low frequencies (intercept with the
x-axis) in the Nyquist plots. For the blackening process at 50 °C with solution 1 (
Figure 12a), the curves show a higher corrosion resistance for the samples immersed in the bath for 15 and 30 min. The corrosion resistance for the samples with 75 and 90 min of immersion time was quite similar. In general, a decrease of the corrosion performance of the top layer with the increasing of immersion time was observed. However, also from EIS tests, the sample with 50 min of immersion time presented the lowest corrosion resistance. This result is in accordance with the ones coming from PDP tests previously reported.
The Nyquist plot for the samples obtained with solution 2 at room temperature show a remarkably higher corrosion resistance of the top layer for immersion time of 100 min. The corrosion performance of the black layer, considering the amplitude of the curve, decreased with lower immersion time in the oxidizing solution.
The data were also fitted with software Z-view. The equivalent circuit used to fit the experimental data is reported in
Figure 13 and is in accordance with present literature regarding protective oxide coatings [
17,
18,
19]. The results of the fitting are reported in
Table 6 for solution 1 and
Table 7 for solution 2.
From the fitting of the experimental data, it was possible to estimate the total polarization resistance of the black coating of the different samples and its evolution with the treating immersion time.
Concerning the parameters of the equivalent circuit, R
1 represents the resistance of the electrolyte, R
2 is the resistance of the black layer, CPE is a constant phase element, which is used in the equivalent circuit instead of a perfect capacitor to more accurately fit the data, because often the measured capacitance is not ideal, while the coefficient n is often described as the frequency dispersion due to the surface condition, such as roughness and inhomogeneity [
20,
21,
22].
The results of the fitting of the experimental data confirm the consideration reported from qualitative analysis of the Nyquist plots. For solution 1, an increasing in immersion time did not provide an improvement in corrosion resistance that was higher than in the samples obtained at 15 and 30 min. This result agrees with other studies on permanganate-based solutions that describe the production of conversion coating on metals varying hot bath operating temperatures. However, from a quantitative point of view the difference in R
2 values among all the samples was not so big. For solution 2, instead, an increasing immersion time led to more uniform and homogeneous coating [
3,
23]. The most promising sample was, in fact, the sample obtained with 100 min of immersion time; that is, the one characterized by the higher value of R
2. Comparing the values of R
2 for the samples obtained with the two different baths, there was a clearly observable increase in the corrosion properties of the black layer for solution 2 blackening. In fact, for solution 1 the maximum value of R
2 was 163.4 Ω cm
2 for the sample obtained with 15 min of immersion time, whereas for solution 2 the sample with the best corrosion performances (100 min of immersion time) was characterized by an R
2 value of 484.2 Ω cm
2.
As is shown in
Table 6 and
Table 7, the resistance of all blackened samples was higher than that of the untreated sample. Therefore, the blackening process offered an improvement in corrosion resistance of the samples. In particular, the sample burnished with solution 2 for 100 min showed a value of resistance R
2 four times higher than that of the untreated sample.
4. Discussion
Corrosion behavior is closely linked to morphology and surface properties of the black layer. This makes necessary a comparison between coating morphology, studied with SEM analysis, and the results of EIS tests.
For hot blackening in solution 1, EIS tests showed that the sample with 50 min of immersion was the worst in terms of corrosion resistance; this fact was confirmed by SEM observation, which showed a lot of cracks detrimental for corrosion behavior. The same situation was observed for the samples with blackening time of 75 and 90 min: in fact, they were characterized by a similar corrosion resistance and a similar morphology, in terms of presence of cracks. Stress relief cracks may be developed because of a difference in thermal expansion coefficient between the substrate and the coating. In case of blackening of solution 1 with a process temperature of 50 °C, the cooling from this specific operating temperature and tap water rinse temperature (room temperature) provided large stress that can cause the formation of cracks on the oxide layer [
24,
25]. In fact, cracks were formed on the surface of almost all the samples obtained at 50 °C, as can be observed in
Figure 7.
A higher corrosion resistance could be observed for lower immersion times of 15 and 30 min. The SEM images confirmed this fact, evidencing a more uniform and more homogeneous surface; only for 30 min of immersion time, it was possible to observe in a little zone some porosity. The SEM analysis confirmed that an increase of immersion time for blackening in solution 1 at 50 °C did not lead to an improvement in terms of corrosion resistance and surface quality of the layer.
The results for room temperature blackening were quite different: EIS measurements showed higher corrosion resistance with increasing immersion time. In fact, the more corrosion resistant samples were characterized by immersion time of 60 and 100 min. SEM analysis confirmed the EIS results: increasing blackening time led to a more uniform and homogenous layer without any cracks or porosities.
For solution 2, the blackening reaction was slower; this was due to the lower temperature of the process. Increasing immersion time, the growth mechanism of the layer ensured the formation of a higher quality surface and thicker layer. In this case, in fact, the reaction was not accelerated by the temperature as higher immersion times are required [
26,
27,
28].
For both solutions 1 and 2, all black coatings were characterized by a higher corrosion resistance in comparison to the untreated sample. The best sample in terms of corrosion performances was the one treated with solution 2 for 100 min. This sample was characterized by a uniform and defect-free coating about one micron thick. The increased corrosion performance, compared to the ones of the other samples, can be ascribed to the surface morphology and in particular to the absence of defects.
5. Conclusions
In this study, the blackening process of aluminum alloy 6060 was investigated with two different solutions: solution 1 operating at 50 °C and solution 2 at room temperature. The baths had the same chemical composition but different amounts of the compounds: solution 2 had a double concentration of chemical compounds. For Solution 1, all the corrosion tests underlined that low immersion time provides good corrosion properties. In fact, 15 and 30 min of treatment at 50 °C were enough to provide a good surface quality and a good corrosion resistance. In particular, the sample obtained with 15 min of immersion time was, among the ones obtained with solution 1, the one with the best corrosion properties, in addition to a good black color of the surface. Black layers obtained with longer immersion times showed a lot of cracks, due to increase in the thickness of the coating and stress relief during cooling from 50 °C; and were consequently characterized by lower corrosion properties.
On the other hand, for room temperature blackening, the samples showed the absence of cracks and porosities regardless of immersion time. The PDP and EIS tests proved that the sample with the best corrosion properties was the one obtained with 100 min of immersion time, which was also the one with the best aesthetical black appearance. Considering the results of the two solutions, it was found that the best layer properties, in terms of corrosion performance and surface quality, were obtained employing solution 2 for 100 min of blackening at room temperature. This could produce other important advantages in terms of technological applications; in fact, lower process temperature ensures lower energy costs and safer condition for workers.
Author Contributions
Conceptualization, D.L. and L.P.; methodology, D.L., D.H. and A.G.S.; software, D.H.; validation, D.H., L.P. and A.G.S.; formal analysis, D.L.; investigation, D.L., D.H. and A.G.S.; resources, M.D.; data curation, D.L.; writing—original draft preparation, D.L.; writing—review and editing, D.L. and L.P.; visualization, D.L.; supervision, M.D.; project administration, M.D.; funding acquisition, M.D. All authors have read and agreed to the published version of the manuscript.
Funding
The present work was performed in the frame of the project POR FESR Veneto 2014-2020, DGR n. 805/2019, Azione 1.1.1., ID domanda 10235223.
Institutional Review Board Statement
Not applicable.
Informed Consent Statement
Not applicable.
Data Availability Statement
The raw/processed data required to reproduce these findings cannot be shared at this time as the data also form part of an ongoing study.
Acknowledgments
The authors want to thank Ni.Va s.r.l. company for providing the metal samples and for financing the research project according to the Veneto POR FESR call.
Conflicts of Interest
The authors declare no conflict of interest.
References
- Matthew, R. Patina: 300+ Coloration Effects for Jewelers & Metalsmiths; Interweave Press LLC.: Loveland, CO, USA, 2014; ISBN 9781620331392. [Google Scholar]
- Ravenscroft, K.N.; William, V.B. Composition and Method for Metal Coloring Process. U.S. Patent 6,309,476, 30 October 2001. [Google Scholar]
- Rani, R.U.; Sharma, A.K.; Mayanna, S.M.; Bhojraj, H.; Bhandari, D.R. Black permanganate conversion coatings on aluminium alloys for thermal control of spacecraft. Surf. Eng. 2005, 21, 198–203. [Google Scholar] [CrossRef]
- John, S.; Perumal, A.; Shenoi, B.A. Chemical colouring of aluminium. Surf. Technol. 1984, 22, 15–20. [Google Scholar] [CrossRef]
- Harris, C. Modern Metal Colouring. Trans. IMF 1939, 15, 97–108. [Google Scholar] [CrossRef]
- Grubbs, C.A. Anodizing of aluminum. Met. Finish. 1999, 97, 476–493. [Google Scholar] [CrossRef]
- Donahue, C.J.; Exline, J.A. Anodizing and coloring aluminum alloys. J. Chem. Educ. 2014, 91, 711–715. [Google Scholar] [CrossRef]
- Dunning, E. Multicolor Anodizing of Aluminum. U.S. Patent No. 3,290,232, 6 December 1966. [Google Scholar]
- Grubbs, C.A. Decorative and architectural anodizing. Met. Finish. 1995, 93, 449–459. [Google Scholar] [CrossRef]
- Sharma, A.K.; Bhojraj, H.; Kaila, V.K.; Narayanamurthy, H. Anodizing and inorganic black coloring of aluminum alloys for space applications. Met. Finish. 1997, 95, 14–20. [Google Scholar] [CrossRef]
- Rungta, R.; Ahrens, R.R.; Zhu, M. Process for Forming a Black Oxide on Aluminum Alloys and a Solution Therefor. U.S. Patent 5,601,663, 22 February 1996. [Google Scholar]
- Paracchini, P. Manuale di Trattamenti e Finiture; Tecniche Nuove: Milano, Italy, 2003; ISBN 9788848114059. [Google Scholar]
- Budija, G. Collection of Formulas for the Chemical, Electrochemical and Heat Colouring of Metals, the Cyanide Free Immersion Plating and Electroplating. 2011. Available online: https://www.finishing.com/library/budija/budija.pdf (accessed on 1 December 2020).
- Oki, M.; Adediran, A.A.; Ogunsemi, B.; Agboola, O.O.; Olayinka, S.; Ogunsola, O. Improvement in corrosion resistance of aluminium alloy by permanganate-based conversion coating. J. Phys. Sci. 2018, 29, 13–24. [Google Scholar] [CrossRef]
- Huang, Y.S.; Shih, T.S.; Wu, C.E. Electrochemical behaviour of anodized AA6063-T6 alloys affected by matrix structures. App. Surf. Sci. 2012, 264, 410–418. [Google Scholar] [CrossRef]
- Shih, T.S.; Liu, Z.B. Thermally formed oxides on Aluminum and Magnesium. Mater. Trans. 2006, 47, 1347–1353. [Google Scholar] [CrossRef]
- Pezzato, L.; Coelho, L.B.; Bertolini, R.; Settimi, A.G.; Brunelli, K.; Olivier, M.; Dabalà, M. Corrosion and mechanical properties of plasma electrolytic oxidation-coated AZ80 magnesium alloy. Mater. Corros. 2019, 70, 2103–2112. [Google Scholar] [CrossRef]
- Pezzato, L.; Babbolin, R.; Cerchier, P.; Marigo, M.; Dolcet, P.; Dabalà, M.; Brunelli, K. Sealing of PEO coated AZ91magnesium alloy using solutions containing neodymium. Corros. Sci. 2020, 173, 108741. [Google Scholar] [CrossRef]
- Kendig, M. Electrochemical Impedance Analysis and Interpretation. ASTM Spec. Tech. Publ. 1993, 45, 582. [Google Scholar]
- Venugopal, A.; Panda, R.; Manwatkar, S.; Sreekumar, K.; Krishna, L.R.; Sundararajan, G. Effect of micro arc oxidation treatment on localized corrosion behaviour of AA7075 aluminum alloy in 3.5 NaCl solution. Trans. Nonferrous Met. Soc. China 2012, 22, 700–710. [Google Scholar] [CrossRef]
- Ezuber, H.; El-Houd, A.; El-Shawesh, F. A study on the corrosion behavior of aluminum alloys in seawater. Mater. Des. 2008, 29, 801–805. [Google Scholar] [CrossRef]
- Grilli, R.; Baker, M.A.; Castle, J.E.; Dunn, B.; Watts, J.F. Corrosion behaviour of a 2219 aluminium alloy treated with a chromate conversion coating exposed to a 3.5% NaCl solution. Corros. Sci. 2011, 53, 1214–1223. [Google Scholar] [CrossRef]
- Jinlong, L.; Hongyun, L. Effect of surface burnishing on texture and corrosion behavior of 2024 aluminum alloy. Surf. Coat. Technol. 2013, 235, 513–520. [Google Scholar] [CrossRef]
- Xu, Y.P.; Zhao, S.X.; Liu, F.; Li, X.-C.; Zhao, M.-Z.; Wang, J.; Lu, T.; Hong, H.-S.; Luo, G.-N. Studies on oxidation and deuterium permeation behaviour of a low temperature α-Al2O3- forming Fe-Cr-Al ferritic steel. J. Nucl. Mater. 2016, 477, 257–262. [Google Scholar] [CrossRef]
- Ooi, S.W.; Yan, P.; Vegter, R.H. Black oxide coating and its effectiveness on prevention of hydrogen uptake. Mater. Sci. Technol. 2019, 35, 12–25. [Google Scholar] [CrossRef]
- Hughes, A.E.; Gorman, J.D.; Harvey, T.G.; Galassi, A.; McAdam, G. Development of permanganate-based coatings on aluminum alloy 2024-T3. Corrosion 2006, 62, 773–780. [Google Scholar] [CrossRef]
- Oki, M.; Oki, T.K.; Charles, E. Chromate and Chromate-Phosphate Conversion Coatings on Aluminium. Arab. J. Sci. Eng. 2012, 37, 59–64. [Google Scholar] [CrossRef]
- Tanguri, J.M.; Janjua, M.; Cooper, W. Development of superior colored finishes for copper and copper alloys. Electrodepos. Surf. Treat. 1972, 1, 77–102. [Google Scholar] [CrossRef]
Figure 1.
Stereomicroscope image of untreated aluminum surface.
Figure 1.
Stereomicroscope image of untreated aluminum surface.
Figure 2.
Flow chart of the whole process.
Figure 2.
Flow chart of the whole process.
Figure 3.
Image of samples treated with solution 1 with different immersion times: (a) 15 min, (b) 30 min, (c) 50 min, (d) 75 min, (e) 90 min.
Figure 3.
Image of samples treated with solution 1 with different immersion times: (a) 15 min, (b) 30 min, (c) 50 min, (d) 75 min, (e) 90 min.
Figure 4.
Image of samples treated with solution 2 with different immersion times: (a) 30 min, (b) 60 min, (c) 100 min.
Figure 4.
Image of samples treated with solution 2 with different immersion times: (a) 30 min, (b) 60 min, (c) 100 min.
Figure 5.
Stereomicroscope images of samples treated with solution 1 at 50 °C with different immersion times: (a) 15 min, (b) 30 min, (c) 50 min, (d) 75 min, (e) 90 min.
Figure 5.
Stereomicroscope images of samples treated with solution 1 at 50 °C with different immersion times: (a) 15 min, (b) 30 min, (c) 50 min, (d) 75 min, (e) 90 min.
Figure 6.
Stereomicroscope images of the samples treated with solution 2 at ambient temperature with different immersion times: (a) 30 min, (b) 60 min, (c) 100 min.
Figure 6.
Stereomicroscope images of the samples treated with solution 2 at ambient temperature with different immersion times: (a) 30 min, (b) 60 min, (c) 100 min.
Figure 7.
SEM images of the samples obtained with solution 1 at 50 °C with different soaking times: (a) 15 min, (b) 30 min, (c) 50 min, (d) 75 min, (e) 90 min.
Figure 7.
SEM images of the samples obtained with solution 1 at 50 °C with different soaking times: (a) 15 min, (b) 30 min, (c) 50 min, (d) 75 min, (e) 90 min.
Figure 8.
SEM images of the samples obtained with solution 2 at ambient temperature with different soaking times: (a) 30 min, (b) 60 min, (c) 100 min.
Figure 8.
SEM images of the samples obtained with solution 2 at ambient temperature with different soaking times: (a) 30 min, (b) 60 min, (c) 100 min.
Figure 9.
XRD pattern of the sample blackened at room temperature with solution 2 and 100 min of treatment time.
Figure 9.
XRD pattern of the sample blackened at room temperature with solution 2 and 100 min of treatment time.
Figure 10.
SEM analysis of sample section blackened with solution 2 for 100 min.
Figure 10.
SEM analysis of sample section blackened with solution 2 for 100 min.
Figure 11.
Potentiodynamic polarization curves for the samples treated in solution 1 at 50 °C (a) and for the samples treated in solution 2 at ambient temperature (b). Test electrolyte: commercial solution that simulates cleaning product •.
Figure 11.
Potentiodynamic polarization curves for the samples treated in solution 1 at 50 °C (a) and for the samples treated in solution 2 at ambient temperature (b). Test electrolyte: commercial solution that simulates cleaning product •.
Figure 12.
Nyquist plots of electrochemical impedance spectroscopy (EIS) measurements performed for the samples treated in solution 1 at 50 °C (a) and for the samples treated in solution 2 at ambient temperature (b). Test electrolyte: commercial solution that simulates cleaning product. Dots represent experimental data and lines show the result of the fitting.
Figure 13.
EIS equivalent circuit for fitting of the experimental data coming from EIS tests.
Figure 13.
EIS equivalent circuit for fitting of the experimental data coming from EIS tests.
Table 1.
Composition of AA6060 alloy employed (wt.%).
Table 1.
Composition of AA6060 alloy employed (wt.%).
| | Si | Fe | Cu | Mn | Mg | Cr | Zn | Ti |
|---|
| AA6060 | 0.50 | 0.20 | 0.10 | 0.10 | 0.45 | 0.05 | 0.15 | 0.10 |
Table 2.
Composition of blackening solution 1.
Table 2.
Composition of blackening solution 1.
| Solution 1 | Quantity |
|---|
| H2O | 250 mL |
| KMnO4 | 8 g/L |
| CuNO3 | 26 g/L |
| HNO3 | 4 g/L |
Table 3.
Composition of blackening solution 2.
Table 3.
Composition of blackening solution 2.
| Solution 2 | Quantity |
|---|
| H2O | 250 mL |
| KMnO4 | 16 g/L |
| CuNO3 | 52 g/L |
| HNO3 | 7 g/L |
Table 4.
Corrosion potential and corrosion current densities extrapolated from the potentiodynamic polarization plots reported in
Figure 11a for the samples obtained with solution 1 at 50 °C.
Table 4.
Corrosion potential and corrosion current densities extrapolated from the potentiodynamic polarization plots reported in
Figure 11a for the samples obtained with solution 1 at 50 °C.
| Solution 1 | Ecorr SCE [V] | Icorr [A/cm2] |
|---|
| AR | −1.70 | 2.0 × 10⁻⁵ |
| 15 min | −1.57 | 1.0 × 10⁻⁵ |
| 30 min | −1.38 | 1.1 × 10⁻⁵ |
| 50 min | −1.50 | 4.0 × 10⁻⁴ |
| 75 min | −1.47 | 1.2 × 10⁻⁵ |
| 90 min | −1.20 | 1.1 × 10⁻⁵ |
Table 5.
Corrosion potential and corrosion current densities extrapolated from the potentiodynamic polarization plots reported in
Figure 11b for the samples obtained with solution 2 at ambient temperature.
Table 5.
Corrosion potential and corrosion current densities extrapolated from the potentiodynamic polarization plots reported in
Figure 11b for the samples obtained with solution 2 at ambient temperature.
| Solution 2 | Ecorr SCE [V] | Icorr [A/cm2] |
|---|
| AR | −1.70 | 2.0 × 10⁻⁵ |
| 30 min | −1.72 | 3.0 × 10⁻⁵ |
| 60 min | −1.65 | 1.0 × 10⁻⁵ |
| 100 min | −1.67 | 1.6 × 10⁻⁵ |
Table 6.
Results of the fitting of the experimental data for the samples obtained with solution 1 at 50 °C.
Table 6.
Results of the fitting of the experimental data for the samples obtained with solution 1 at 50 °C.
Solution 1
Immersion Times | R1 [Ω cm2] | R2 [Ω cm2] | Q [F cm−2 Hz1−n] | n | χ2 |
|---|
| AR | 18 | 105 | 1.38 × 10⁻⁵ | 0.8 | 0.03 |
| 15 min | 18 | 163.4 | 2.80 × 10⁻⁵ | 0.83 | 0.09 |
| 30 min | 18 | 153 | 2.84 × 10⁻⁵ | 0.99 | 0.01 |
| 50 min | 18 | 110.2 | 1.38 × 10⁻⁵ | 0.80 | 0.01 |
| 75 min | 18 | 114.7 | 2.41 × 10⁻⁶ | 0.81 | 0.011 |
| 90 min | 18 | 129 | 2.22 × 10⁻⁵ | 0.89 | 0.035 |
Table 7.
Results of the fitting of the experimental data for the samples obtained with solution 2 at ambient temperature.
Table 7.
Results of the fitting of the experimental data for the samples obtained with solution 2 at ambient temperature.
Solution 2
Immersion Times | R1 [Ω cm2] | R2 [Ω cm2] | Q [F cm−2 Hz1−n] | n | χ2 |
|---|
| AR | 18 | 105 | 1.38 × 10⁻⁵ | 0.8 | 0.03 |
| 30 min | 18 | 174.2 | 1.91 × 10⁻⁵ | 0.974 | 0.09 |
| 60 min | 18 | 208.2 | 9.83 × 10⁻⁶ | 0.966 | 0.094 |
| 100 min | 18 | 484.2 | 1.15 × 10⁻⁵ | 0.928 | 0.083 |
| Publisher’s Note: MDPI stays neutral with regard to jurisdictional claims in published maps and institutional affiliations. |
© 2021 by the authors. Licensee MDPI, Basel, Switzerland. This article is an open access article distributed under the terms and conditions of the Creative Commons Attribution (CC BY) license (https://creativecommons.org/licenses/by/4.0/).


 ,
, 


