1. Introduction
Studies on human or robot motor performance pertain to an interdisciplinary field of research with several applications ranging from robotics to biomechanics to ergonomics. This performance is typically measured in human or robot agents by analyzing a trajectory executed during a motor task. Reaching motor tasks (i.e., a movement in which the end-effector aims at a reaching target starting from a given position) are widely studied when assessing human motor performance and control [
1,
2]. These motor tasks are subject to external constraints imposed by the environment which include, for example, the spatial constraints as well as the geometrical features of the object to be moved by the agent. Factors, such as age, sex, and other physical features of a human agent affect the physical status and, in turn, the resulting trajectories that can be executed during a motor task.
Reaching tasks typically consist of repetitive movements that the agent performs by executing a set of possible trajectories, from initial point to target, each of them being characterized by different features (e.g., path length and shape, energy consumption and speed of execution). The set of possible trajectories are limited by the agent’s internal constraints, as well as environmental constraints. Internal constraints are of different nature and include the number of degrees of freedom available to control the musculoskeletal system of a human or bio-inspired robot agent, its available physical strength to move objects at a specific speed, and its experience and skill in executing the task. The higher the agent’s motor abilities, the higher the possibilities for action that the agent perceives for a given movement and environment, also known as affordances [
3].
The concept of “affordance” has been firstly theorized in [
4]. Information-based affordance measures have been proposed for various tasks of both robot and human agents. The “Labelling entropy” measure or “binary cross entropy” loss function have been adopted to investigate the affordance of a robot in object recognition tasks [
5,
6]. Information-based measures have been also proposed for motor tasks [
7,
8,
9] to investigate the affordance of human climbing with assigned environment constraints. In climbing tasks, external constraints include the width of the path, the wall inclination, and the shape and orientation of the handles, which determine the climber’s selection of the sequence of poses and resulting path. An expert climber tends to travel straighter paths, which are less complex and more affordable trajectories; on the contrary, when a novice climber faces with a challenging route that force him to reach the affordance boundaries of his abilities, he tends to perform more complex trajectories [
10,
11].
A complexity measure of a general motion path is proposed in [
12]; here, the entropy of a curve (i.e., a spatial trajectory) is defined as:
where
is the length of the curve,
is the convex hull (perimeter) of the curve, and
is the average number of intersections between the curve and a straight line [
13]. The
H formulation, measured in bit, is also known as the Geometric Index of Entropy:
It has been applied in human climbing [
8,
9]. The GIE can measure the difficulty of a trajectory observed during general reaching tasks. Since the GIE is sensitive to external and internal constraints of an agent [
14], it has been adopted as an affordance-related measure of the agent [
8,
9]. However, the GIE shows limits in capturing the complexity of a trajectory as it refers to the overall trajectory neglecting local criticalities that a trajectory could show and that could be of interest to identify which internal or external constraints limit his action. Moreover, the GIE does not consider the accuracy the subject shows in executing a trajectory. Finally, the GIE is a deterministic measure, whereas possible trajectories can vary stochastically due to the limited repeatability of human actions.
A different approach for evaluating the complexity of a motor task is the formulation of the Index of Difficulty (
ID) originally proposed by Fitts [
15], which quantifies the difficulty of a simple reaching motor task required to reach a target of width
W placed at distance
D from a starting point. The
ID has been derived by analogy with the Shannon theorem n° 17 [
16], theorized within the information theory. Accordingly, a successive formulation of the
ID is proposed in [
17] as:
ID is measured in [bit] and the above formulation has demonstrated a better fit with the Fitts’ empirical data [
17]. The various formulations of the
ID [
15,
17,
18], and field studies [
19,
20,
21,
22,
23,
24] refer to simple “point-to-point” reaching motor tasks without considering the travelled path. In such experiences, subjects can fail in meeting the final target and accuracy issues are addressed. The error rate of subjects in meeting the final target at different speed has been put into relation to the standard deviation of the position of the endpoint; to this purpose, the “Speed-Accuracy” model was discussed in [
17].
The Index of Difficulty of a general trajectory (
IDt) spatially constrained along a path of any shape, defined in a two-dimensional plane, is proposed in [
25]. Starting from the general
IDt formulation, the “Speed-ID-Accuracy” model, which shows the effects of speed and difficulty of task on the accuracy, is proposed in [
26].
In spite of a wide scientific literature on
ID formulations and experimental testing [
19,
20,
21,
22,
23,
24], these experiences refer to motor tasks with negligible dynamics, i.e., they refer to reaching motor tasks at a slow speed or manipulating light objects (e.g., a computer device, stylus pen on a tablet, etc.). On the contrary, in many practical cases referable to reaching tasks in work environment or in biomechanics, the dynamics of the phenomenon cannot be neglected since mass and acceleration are not negligible. The ability of an agent to meet internal and external constraints is dependent on the dynamics that governs the motor task execution [
27]. As often observed in work environments, an agent is required to execute spatially constrained complex trajectories. Perceived affordance in complex trajectories is affected by agent’s features like geometry, mass distribution, force of the actuators (or physical strength), speed of execution. Modeling the dynamics of the phenomenon reveals a quite complex issue not yet addressed by research, also due to the stochastic variability of internal constraints of a human agent.
In this study, a novel Index of Difficulty is proposed in order to overcome the abovementioned limits. The model quantifies the Index of Difficulty as a probabilistic affordance-related measure of a generalized reaching task, based on the observed variability of the repeated trajectories executed by a given agent. The execution of a trajectory is considered as the reaching of a series of consecutive targets orthogonally distributed along a nominal path (i.e., the average trajectory). The current formulation is derived under the assumption of two-dimensional paths. Furthermore, the hits on targets are assumed as normally distributed. A major novelty of the proposed stochastic model relies in its intrinsic ability to take into account all the agent-specific features affecting the dynamics of the motor task under internal (agent) and external (task) constraints. Therefore, the model is effective in performing reliable affordance analysis of a specific individual or groups of individuals of given features accomplishing a reaching task for statistical analyses.
The paper is organized as follows. In
Section 2, the stochastic model to calculate the Index of Difficulty is proposed. In
Section 3, the model is applied to field data on young and elderly human subjects performing walking motor tasks (available in public dataset) in order to show the use and capabilities of the model proposed to discriminate agent-specific performances. A statistical analysis of the Index of Difficulty results on subjects with different age and speed conditions is presented in
Section 4. The evaluated dataset is used to determine a regression model for the Index of Difficulty with dependency on age and speed values. Finally, conclusions and further research are outlined in
Section 5.
2. Stochastic Index of Difficulty for a Generalized Reaching Task
The Index of Difficulty of a general trajectory realized within given spatial constraints has been defined by [
25] as follows:
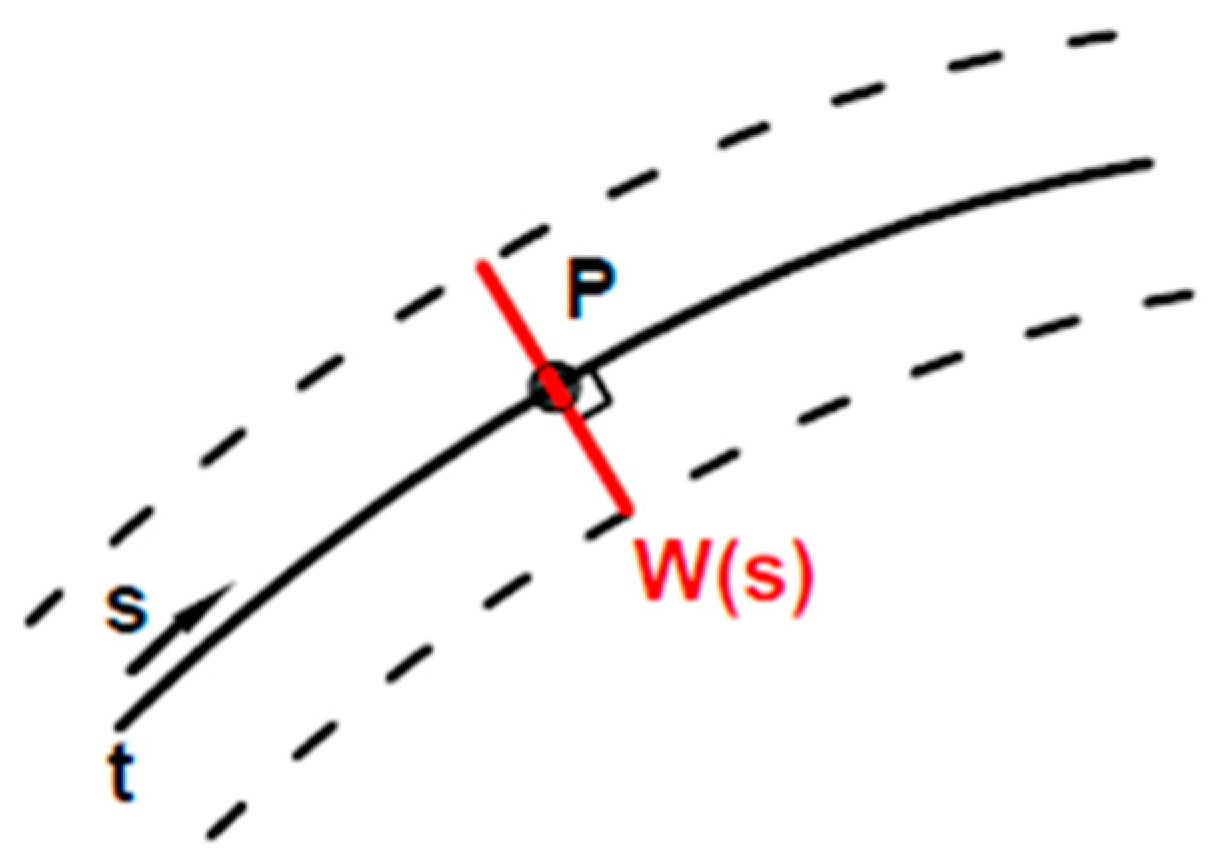
where, the spatial trajectory (i.e., path)
t is constrained within a given width
W(
s) along the curvilinear abscissa
s (
Figure 1). This result is derived from the Mackenzie formulation of the Index of Difficulty for simple reaching tasks with straight hand path [
17], by considering a generic curved path to be an infinite sequence of simple reaching tasks with targets (constraints) of variable width
W(
s).
The above Index of Difficulty (IDt) is a purely geometric measure derived from information theory and is uniquely dependent on the prescribed spatial trajectory and relative constraints. It can be applied to any nominal trajectory that travels within a tunnel of variable width, W(s), during a generic motor task. A narrow tunnel width leads to increased trajectory difficulty. However, this geometric model does not include specific information on the agent (e.g., human, robot) and its end-effector (e.g., hand, finger, foot) employed in the motor task. Therefore, Equation (4) does not capture important differences in agents’ dynamics and motor control ability that may affect the perceived difficulty (hence affordance) of a certain constrained motor task.
In this study, the geometrical
IDt (Equation (4)) is adopted to formulate a novel information-based stochastic model of generalized reaching task difficulty for a specific agent. A generalized reaching task is defined herein as the movement of a given end-effector of a specific agent, with desired initial and final end-effector positions. When a given agent performs multiple trials of a generalized reaching motor task, the observed trajectories of the end-effector will vary stochastically, due to motor noise [
28,
29]. In particular, the observed trajectories at given speed and environmental conditions will be enclosed within spatial limits
W(
s) that are governed by a combination of factors: in the case of a human agent, for example, the subject’s internal model of motor control (including its dynamics features, such as mass distribution, geometry, joint and actuation limits), the given task requirements, and the constrained environment will synergistically affect the spatial limits
W(
s) observed during the actual trials. As opposed to Equation (4), the spatial limits
W(
s) in the stochastic model are not assigned a priori; they will be the result of both internal and external constraints to the motor task and are indicated in this study as “affordance limits” of the combined agent-environment system.
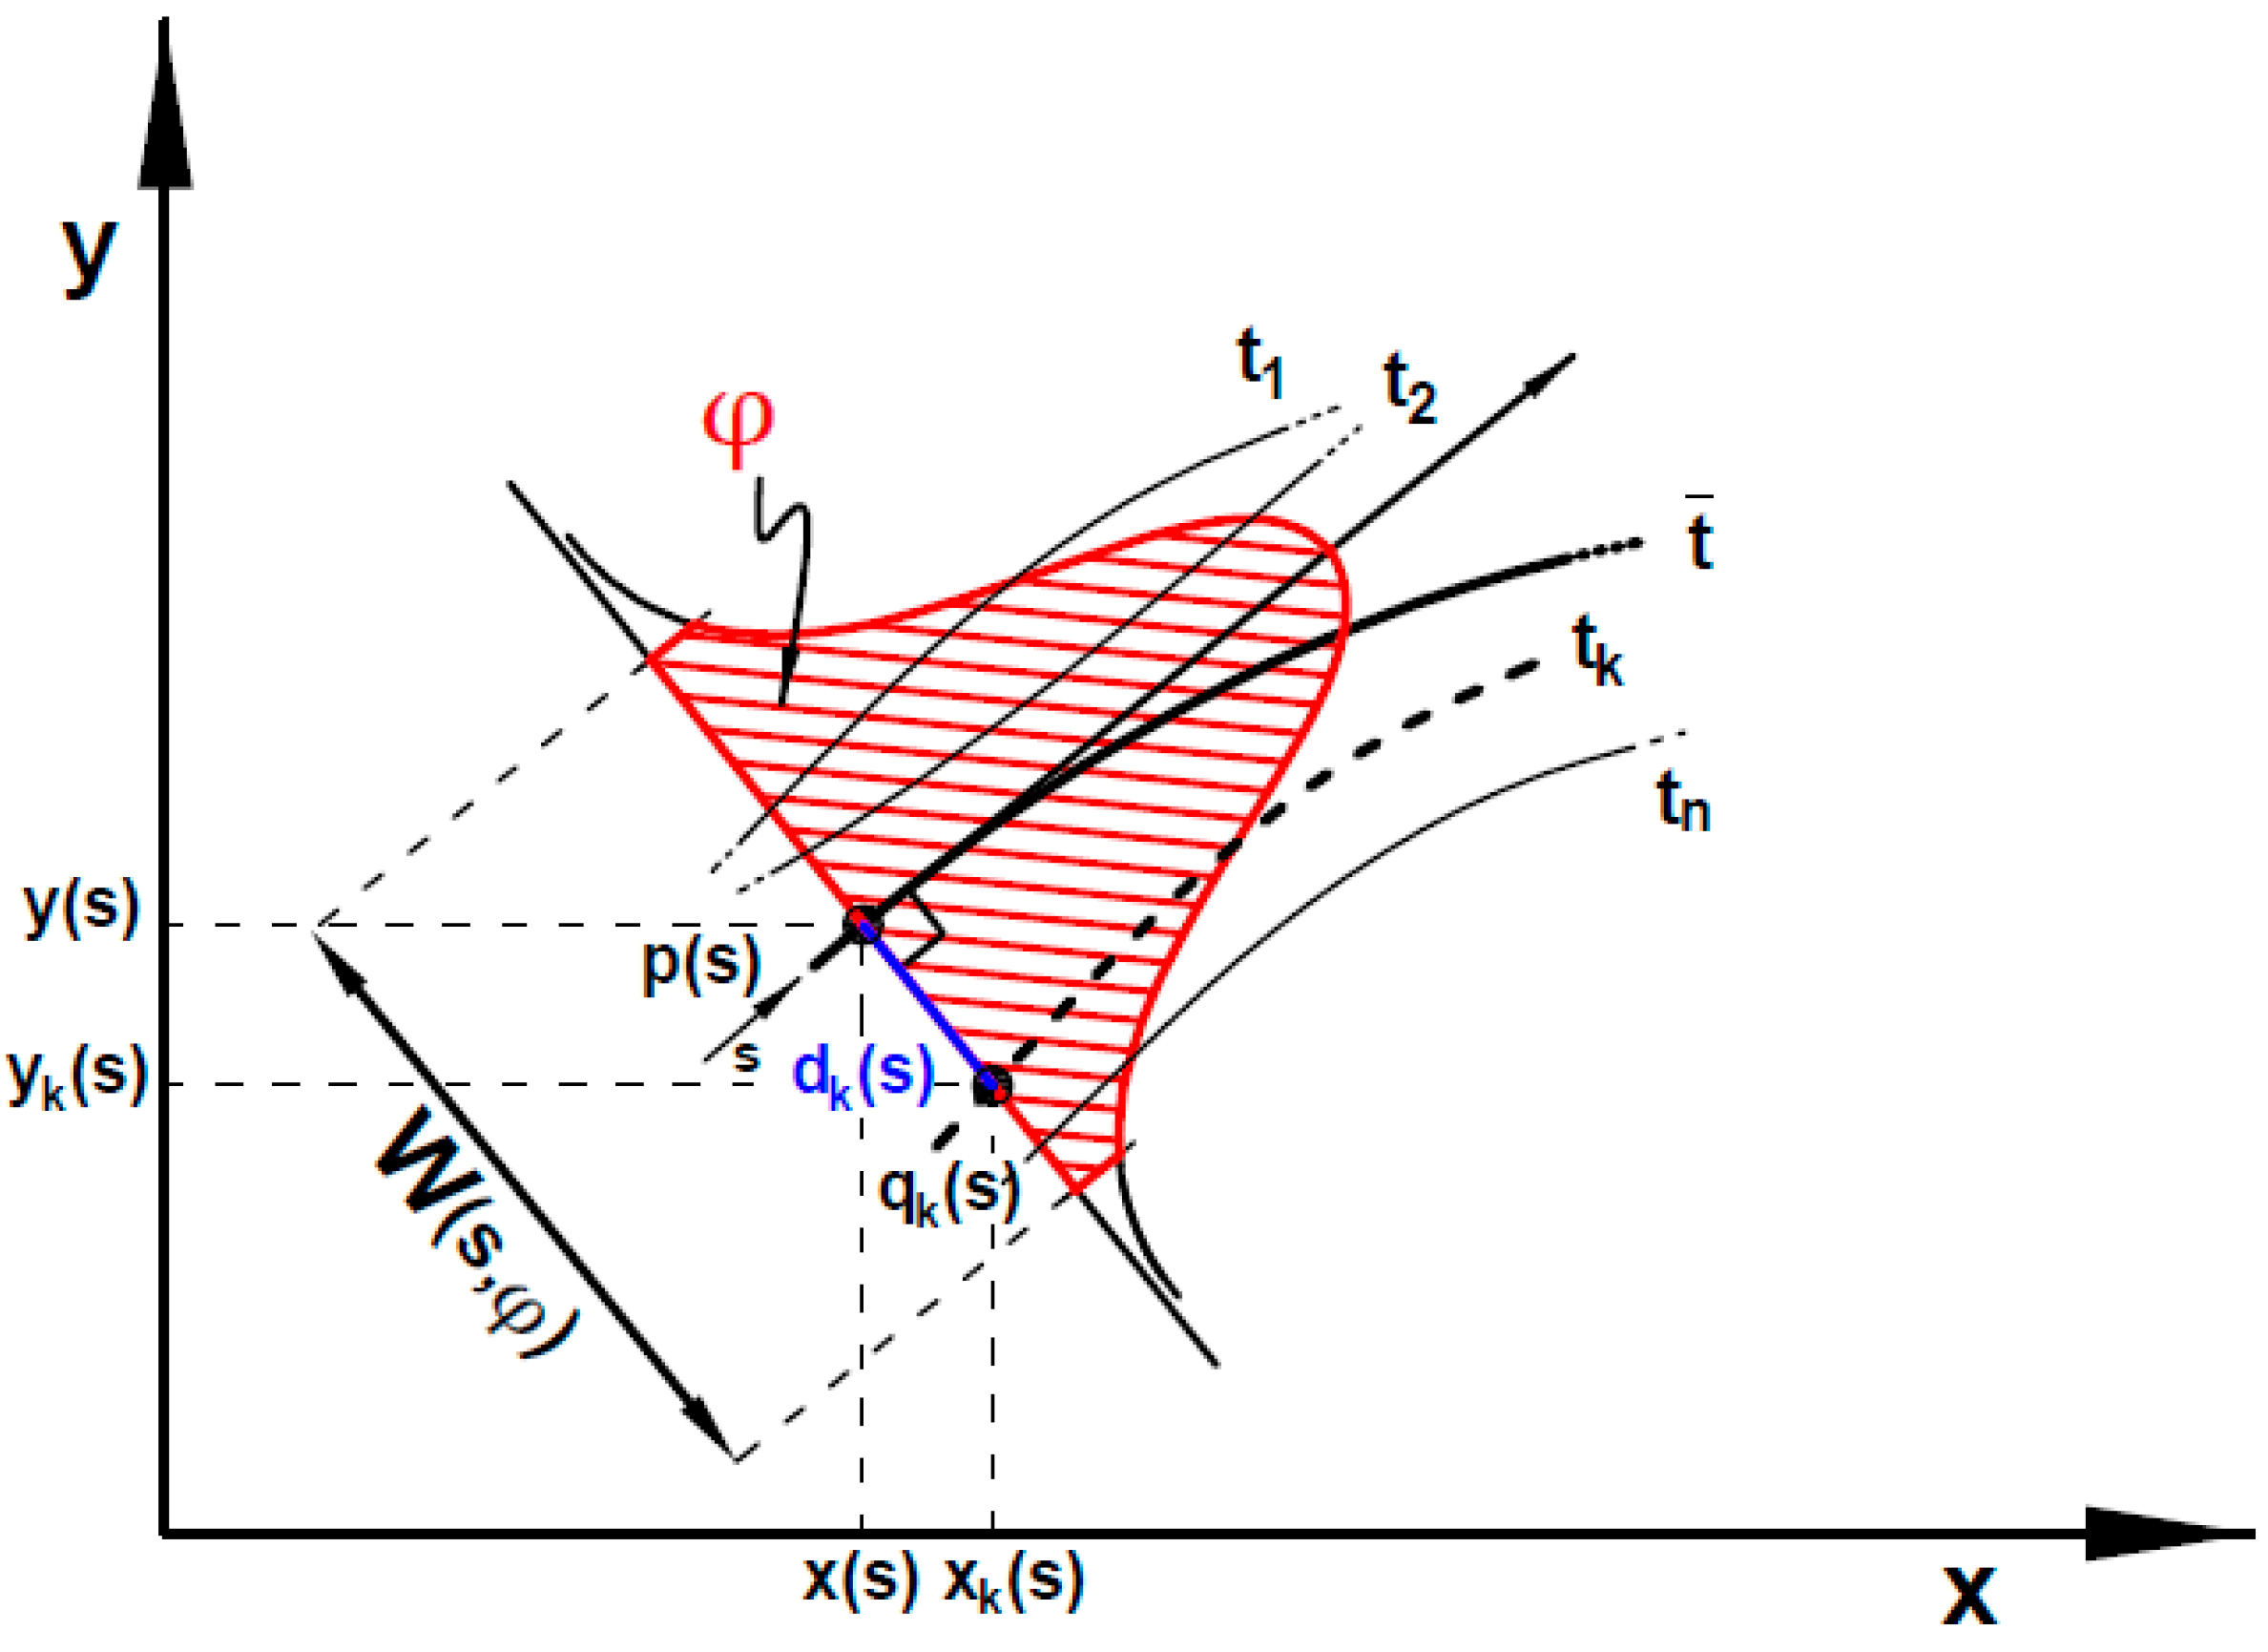
Let us consider a series of spatial trajectories
,
, with average
, observed for a given agent in
n trials of a generalized reaching motor task under the same average speed and environmental conditions (
Figure 2). Without loss of generality, a two-dimensional task is considered, with the end-effector moving in the (
x,
y) plane.
Let
be the point of
at the curvilinear abscissa
. The segment orthogonal to the tangent line at
p(
s) intersects the
k-th trajectory at
and identifies the distance
between the two points (
Figure 2). For a given
p(
s), the stochastic variable
representing the local distance between the observed and average trajectory, is distributed according to a probability density function. The local affordance limits observed at point
due to the variability of the agent’s behavior are modeled by
, which is the variability range of
at a probability
(
Figure 3). Within the limits of
the generalized reaching movement is considered affordable for the agent, at the given probability level. When
is normally distributed with zero mean value, i.e.,
, the sample standard deviation calculated on
n trial trajectories observed is:
Under this hypothesis, the range of variability of
identified as the affordance limits of the agent-environment system
results as follows:
where the
scores of the unit-normal curve depend on the
value (
= 1 for
= 0.6827;
= 2 for
= 0.9545;
= 2.066 for
= 0.9600;
= 3 for
= 0.9973).
Under the assumptions made, and based on Equation (4), the Index of Difficulty
of an agent with observed average trajectory
is defined for a given probability value
, as follows:
where,
is given by Equation (6) and
is the infinitesimal length of the average spatial trajectory
. This cumulative index captures, in a probabilistic way, the agent-specific difficulty of the overall generalized reaching task, from initial to final position. The stochastic Index of Difficulty can also be calculated at the generic point of the curved path
, as follows:
where the infinitesimal length of the curved path has been rewritten as
and
is the
x coordinate of
for
. This second formulation (Equation (8)) captures the agent-specific level of difficulty “locally”, i.e., for a given portion of interest of the motor task.
It should be noted that the hypothesis of normality of does not limit the general validity of the model; different probability density functions at each point of the average trajectory can be assumed. For example, when follows a uniform probability density function, it can be easily demonstrated that the affordance limits in the model can be identified by the variability range .
Due to its high number of degrees of freedom, the motor-control system of an agent has the possibility to exploit motor redundancies at the end-effector when performing repetitive movements, which can result in an increased variability observed during repeated trials of the same motor task [
30]. A reduced level of redundancy in a generalized reaching task can be representative of a reduced affordance resulting from the interactions between the agent’s dynamics and the constrained environment. In the proposed model, a reduced affordance is mainly captured by smaller limits
, which are associated with a higher Index of Difficulty. Conversely, the agent-specific difficulty of a generalized reaching task (or a portion of it) is small when the combined agent-environment system shows increased affordance, by taking advantage of the motor redundancies. The variability–difficulty relationship given by the model and its proposed redundancy-affordance interpretation is in line with the alternative view on motor redundancy, called the principle of abundance, which considers the redundant degrees-of-freedom to be useful and even vital for many aspects of motor behavior [
31].
3. Application of the Stochastic Model to an Example Motor Task
The general model proposed is valid for any generalized reaching motor task observed at a generic end-effector (e.g., foot, hand) of a moving agent (e.g., human, robot). In this study, the stochastic difficulty model is demonstrated for the gait of healthy human subjects of different age groups, where the rhythmic stride movement is considered as an example of a generalized reaching motor task. In this example, the ankle of the swing foot is considered as the agent’s end-effector that during each stride of the gait cycle follows a repetitive spatial trajectory, traveling a distance equal to the stride length along the direction of forward progression [
32]. The experimental dataset, publicly available in [
33], consists of the subjects’ kinematics captured during multiple overground walking trials at three speed levels: slow, comfortable, and fast. The dataset also provides information about sex and age of subjects and their anthropometric features (mass, height, and legs’ length).
Numerical Evaluation of the Index of Difficulty for a Single Elderly Subject
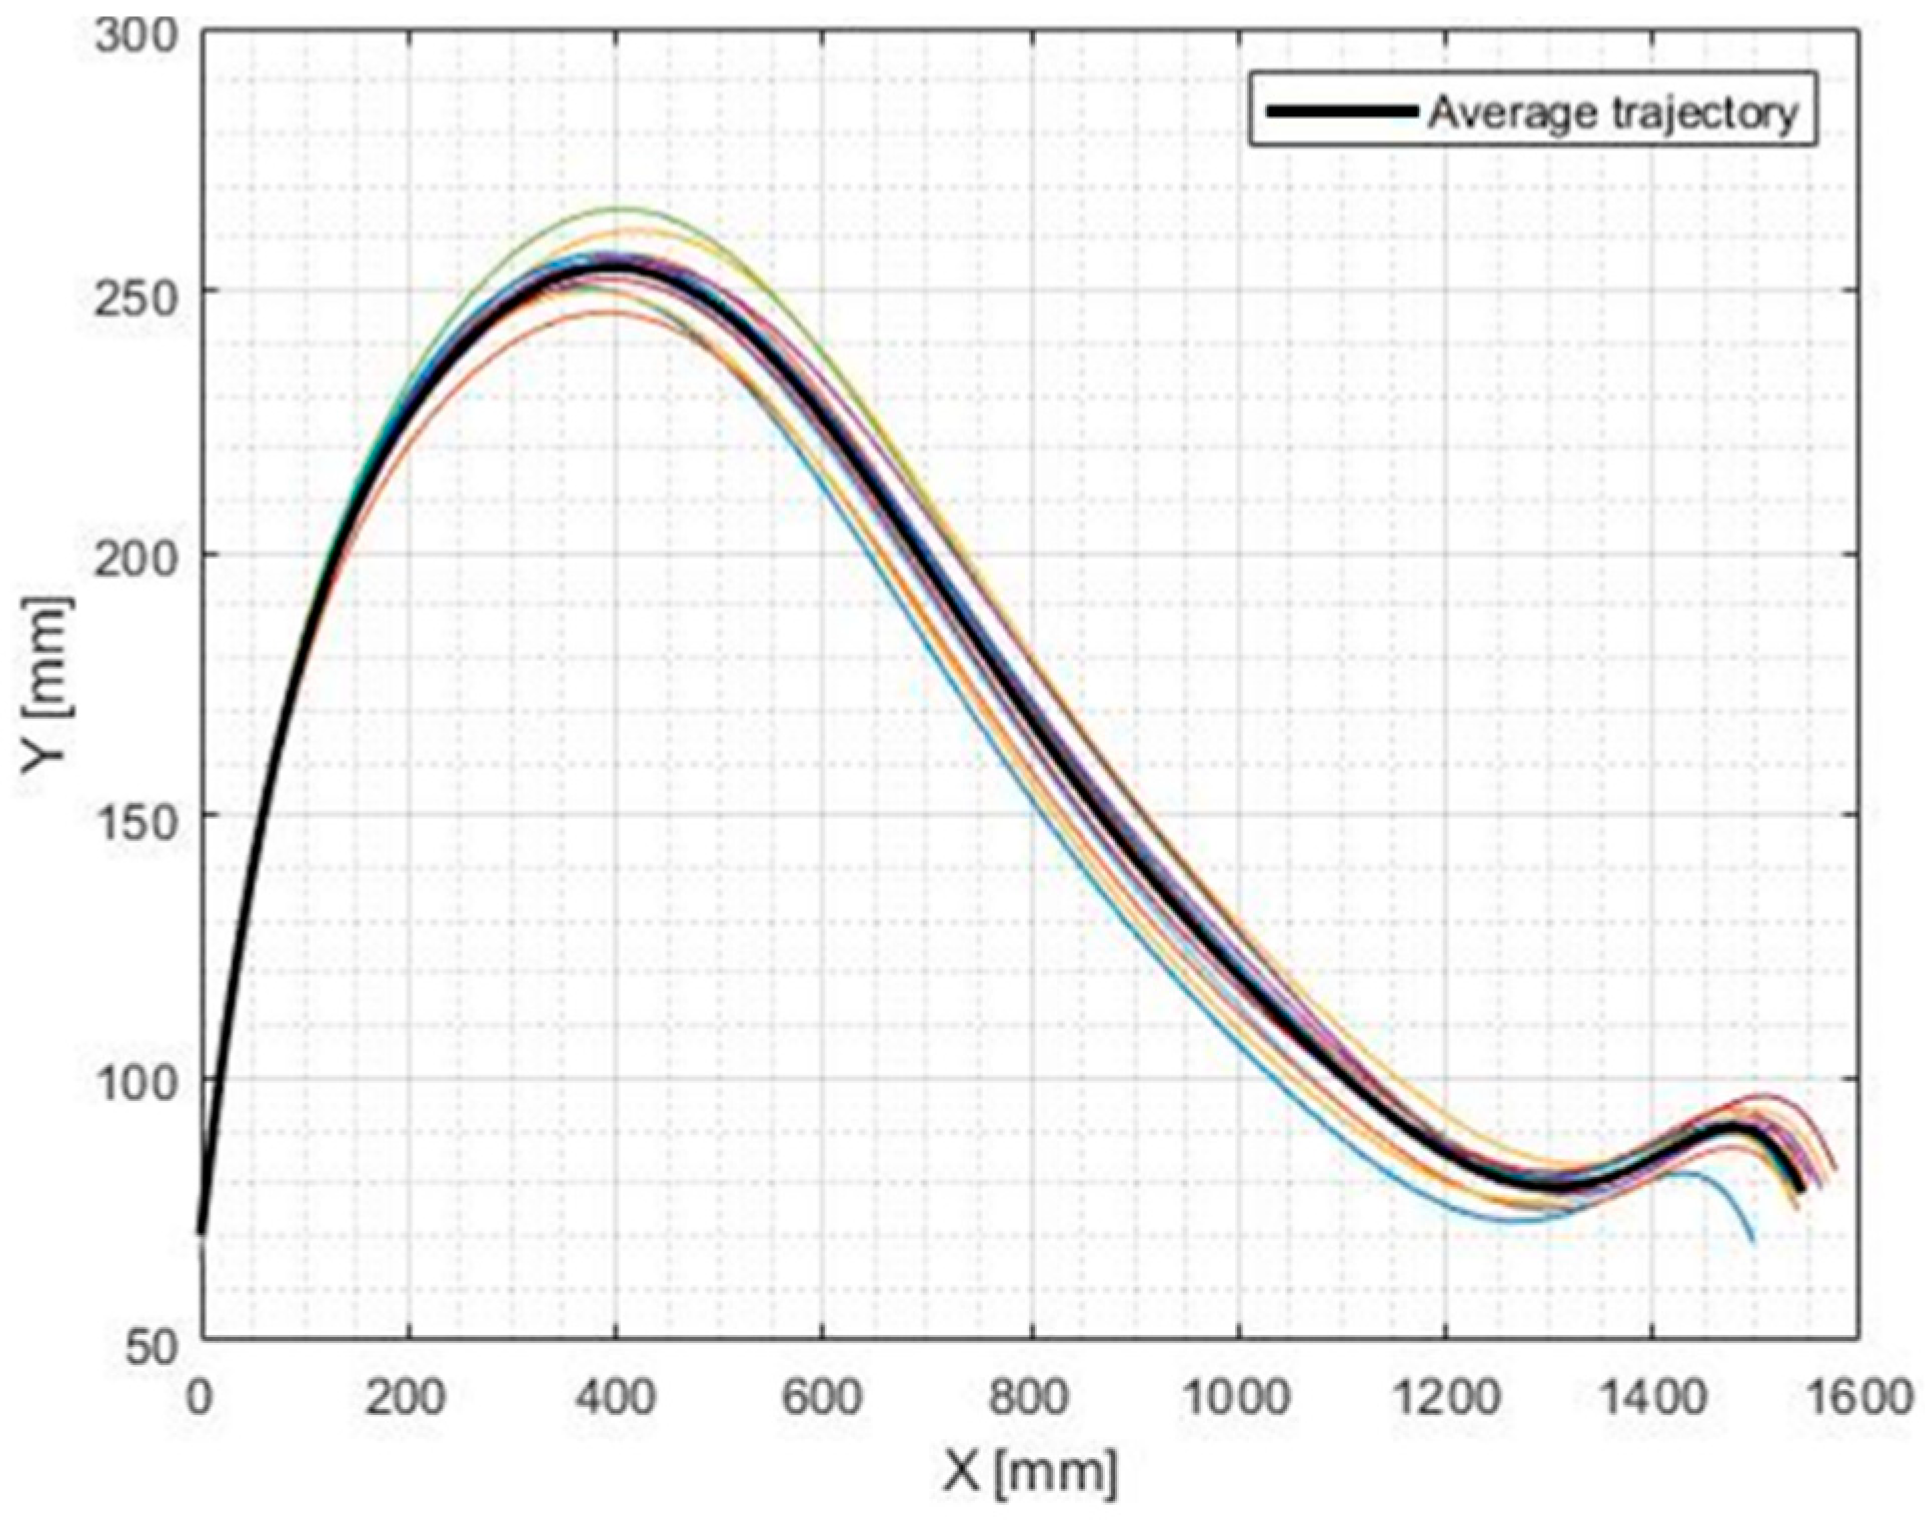
The proposed model of agent-specific Index of Difficulty is tested on one human subject (male, 61 years old) walking at fast speed level (average speed of 1.584 m/s). The spatial trajectories of the swing foot’s ankle are recorded over 11 walking trials and projected onto the anatomical sagittal plane (
x,
y), where the
x coordinate indicates the direction of the forward gait progression and the
y coordinate indicates the direction normal to the ground. The trajectory followed by the ankle during the second stride of each
k-th walking trial (
k = 1–11) is sampled and averaged for the analysis of task difficulty (
Figure 4). The stride motor task of a given leg is modelled as a generalized reaching task starting from the instant of “flat foot” (i.e., the foot is still in full contact with the ground, right before the swing phase) and terminating at the instant of “heel strike” (i.e., when the same foot makes the new contact with the ground, terminating the swing phase). Each trajectory is observed from a local reference frame located at the ankle of the foot at the initial time (i.e., at the flat foot condition). This allows for the quantification of the trajectory variability’s effect on the net increase of affordance limits in the direction of forward progression, which leads to the variability in the reaching target x-position (i.e., stride length variability).
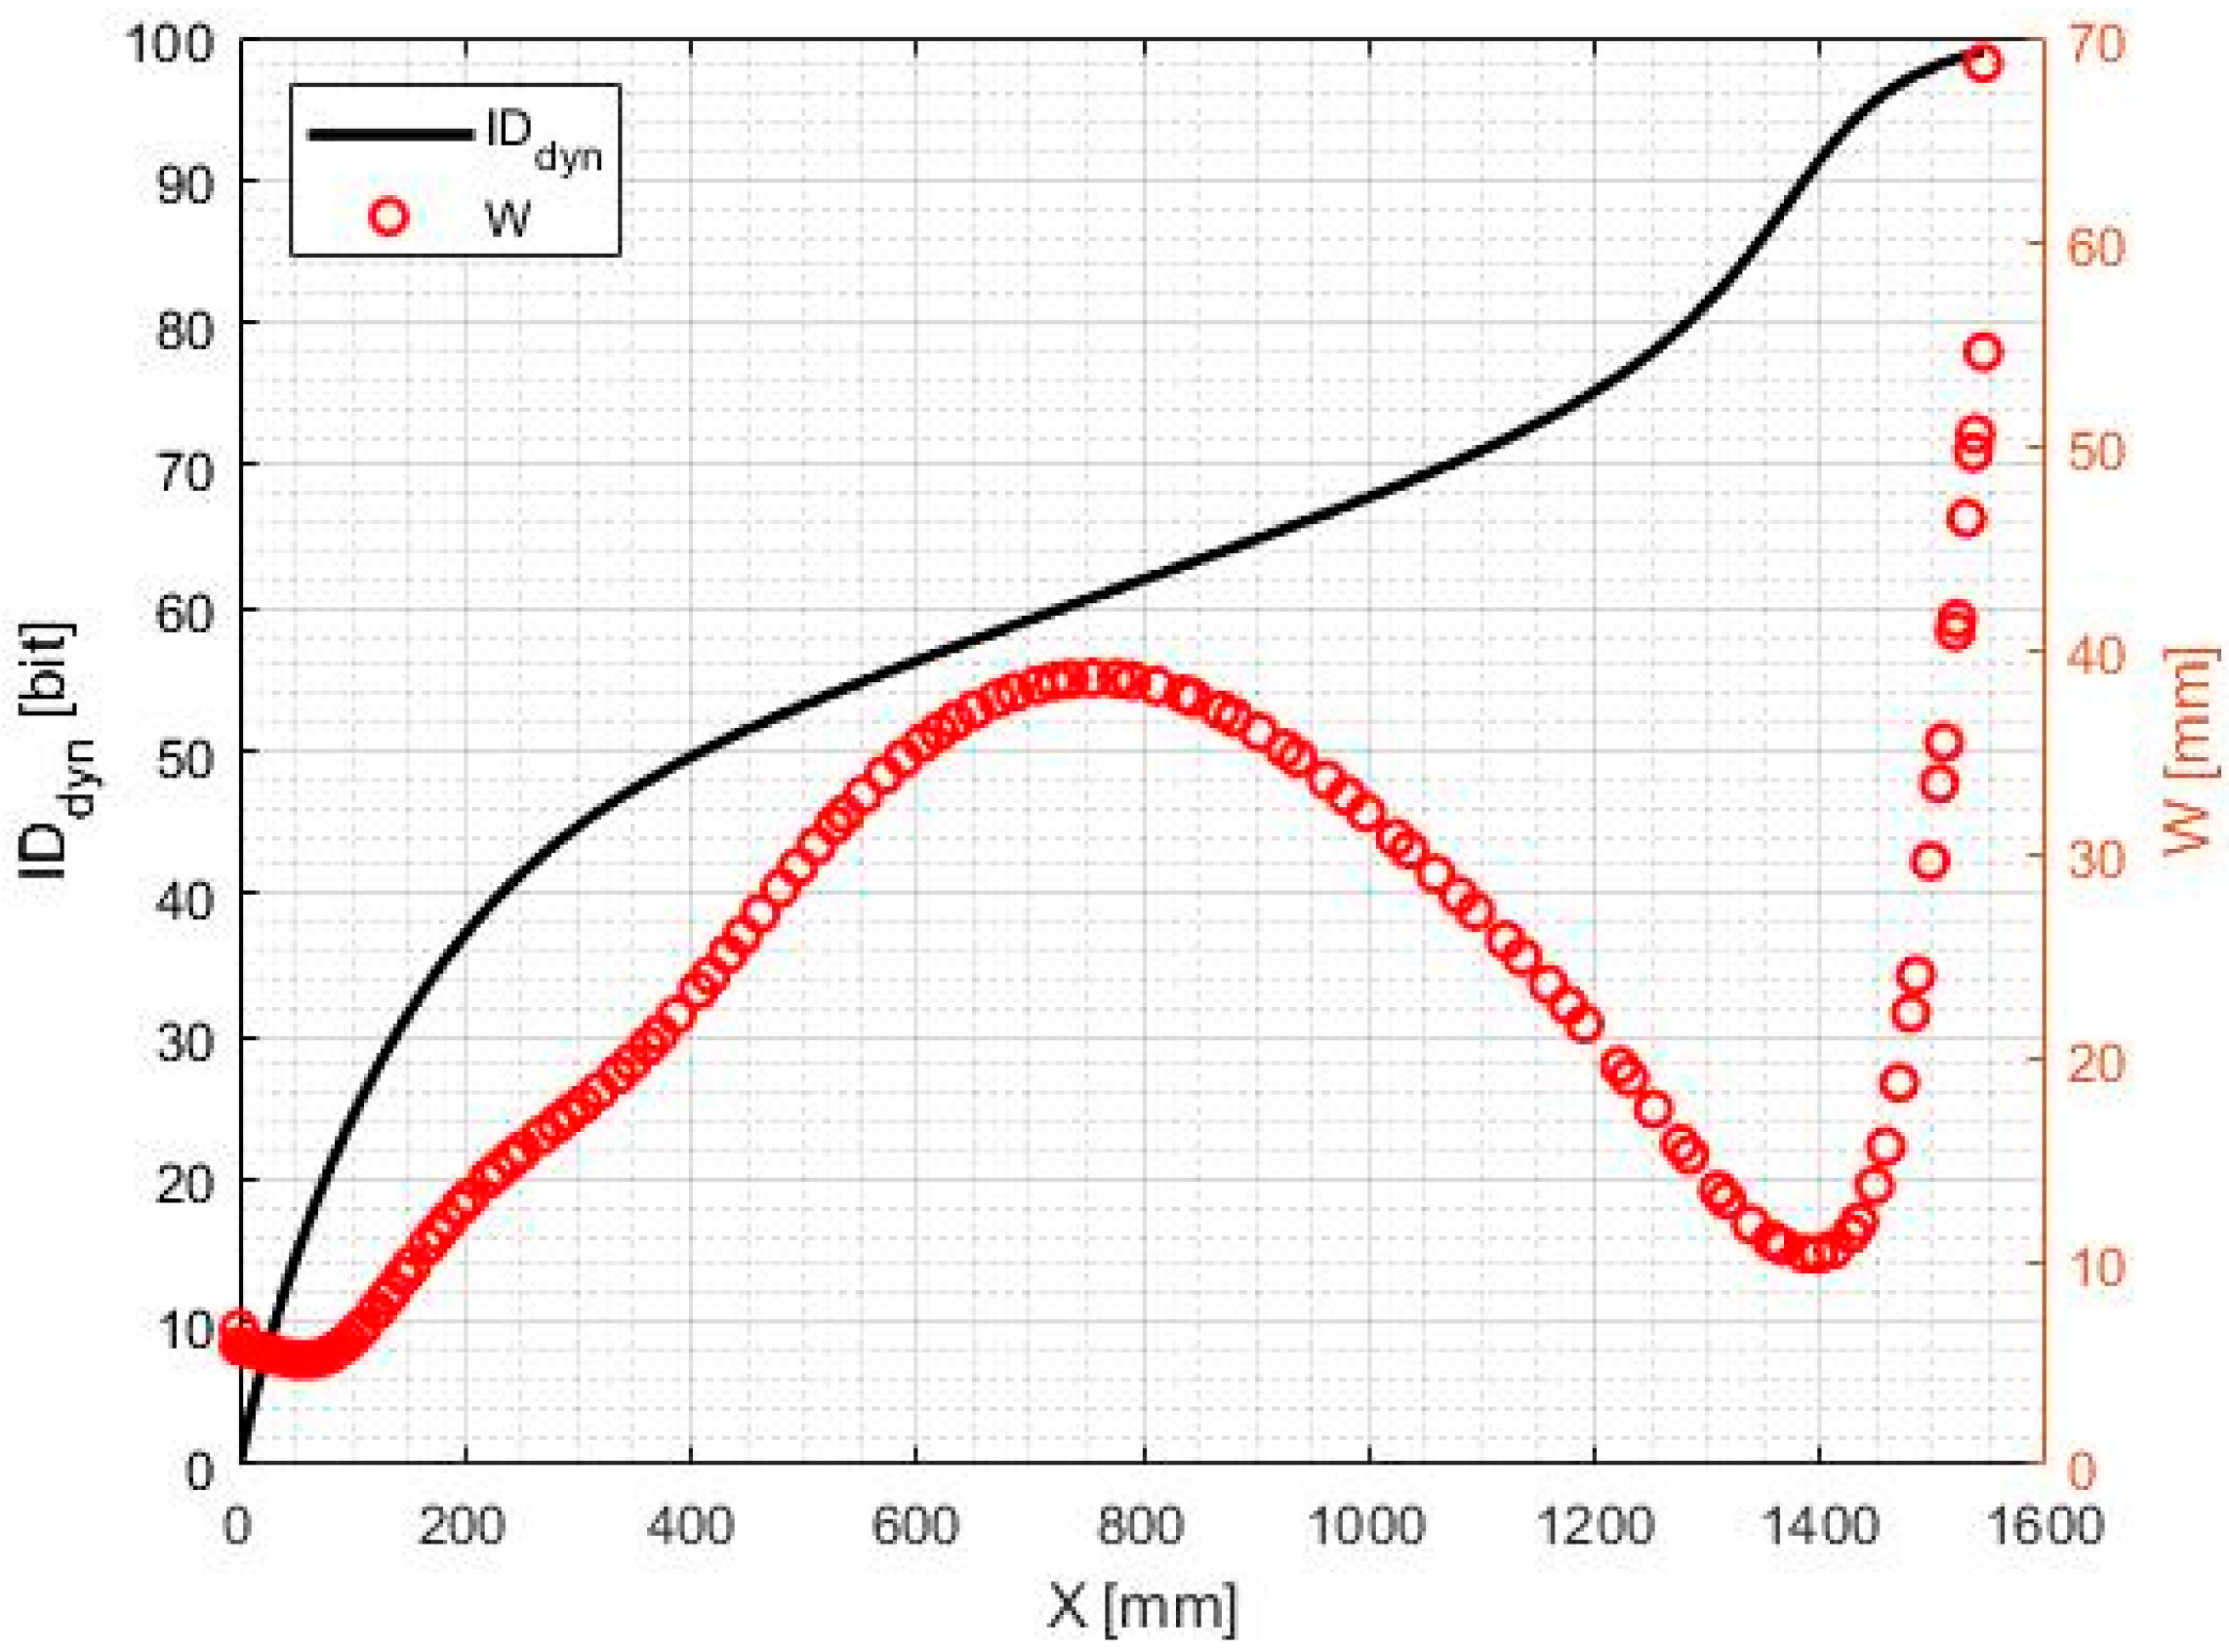
The subject’s Index of Difficulty at his swing foot during the walking motor task,
, is calculated at every point of the stride, discretized over the
x coordinate, at a probability level set at
(
Figure 5). The local affordance limits
demonstrate that the small variability observed during the initial phase of the stride and right before the heel strike is associated with a reduced end-effector affordance and, therefore, a higher rate of increase of task difficulty.
By analyzing the trend of
, three phases of the stride are identified. In the first phase (0 <
x < 400 (mm)), the end-effector (swing foot) is lifted from the ground and follows a trajectory with high difficulty: it can be observed that 50% of the total task difficulty is allocated in the first quarter of the trajectory, from flat foot to the point of maximum swing foot height (
Figure 4). Towards the end of this phase, the end-effector affordance of the subject improves, as shown by the decreasing derivative of
.
In the second phase (400 < x < 1200 (mm)), 25% of the total task difficulty is realized during the central portion of the trajectory, in which the swing foot is moving from a point of maximum to minimum height, while traveling about 50% of the total stride length. In this phase, the rate of increase of is approximately constant, with affordance limits ) first increasing, reaching a maximum at about half of the stride, and then decreasing. In this phase, the subject’s affordance in motor task execution is on average constant, demonstrating his potential to control his movements in a more flexible (redundant) way. The combination of the variability range of trajectories ()), that is constant on average, and the linear increase in the forward path () results in an effectively constant task difficulty.
Finally, in the last quarter of the stride (1200 < x < 1600 (mm)), i.e., the last 25% of the travelled distance, the subject is employing 25% of the total task difficulty. The shows first a high rate of increase, due to the rapid decrease of trajectories variability and affordance while the foot prepares for the upcoming contact with the ground; then, as the end-effector approaches the trajectory endpoint (x 1600 [mm]), the derivative decreases due to a higher variability of trajectories.
Evaluating the ratio between the percent increase of the ID and the percent increase of distance travelled in each of the three phases of the task (2, 0.5, and 1, respectively), it can be noted that the stride movement of the given subject is characterized by consecutive phases at high, low, and intermediate level of difficulty, respectively. The overall trajectory variability range, from initial to final point, leads to a stride length variability of 7 cm observed for this subject at the given walking speed.
The example results presented above are the proof-of-concept demonstration of the stochastic model proposed for task difficulty and its ability to describe the level of affordance and difficulty of a given agent during different phases of the task. This application represents an example of how the model can be used for benchmarking important subject-specific motor performances (i.e., affordance and difficulty) during a generalized reaching motor task and for quantifying the variations of such performances when the agent–environment conditions are altered (e.g., reduced subject’s strength, variable task speed, etc).
4. Statistical Analysis on the Index of Difficulty for Differently Aged Subjects
The walking trajectories of 34 subjects have been analyzed at the slow, comfortable, and fast speed levels. The subjects are grouped into “Young” (21–37 years, N = 20) and “Old” (50–73 years, N = 14) age groups. Each subject performs an average of nine walking trials per speed level. The second stride of each trial is sampled to avoid non-steady gait effects and averaged for each subject and each speed condition. The stochastic model of task difficulty has been evaluated for the considered motor task, demonstrating the proposed agent-specific index’s capability of capturing statistical differences in compared populations.
The cumulative index
profiles for each subject are shown for the “Young” and “Old” groups at perceived walking speed levels “Slow” and “Fast” (
Figure 6). Values refer to probability level
(i.e.,
z = 2.133).
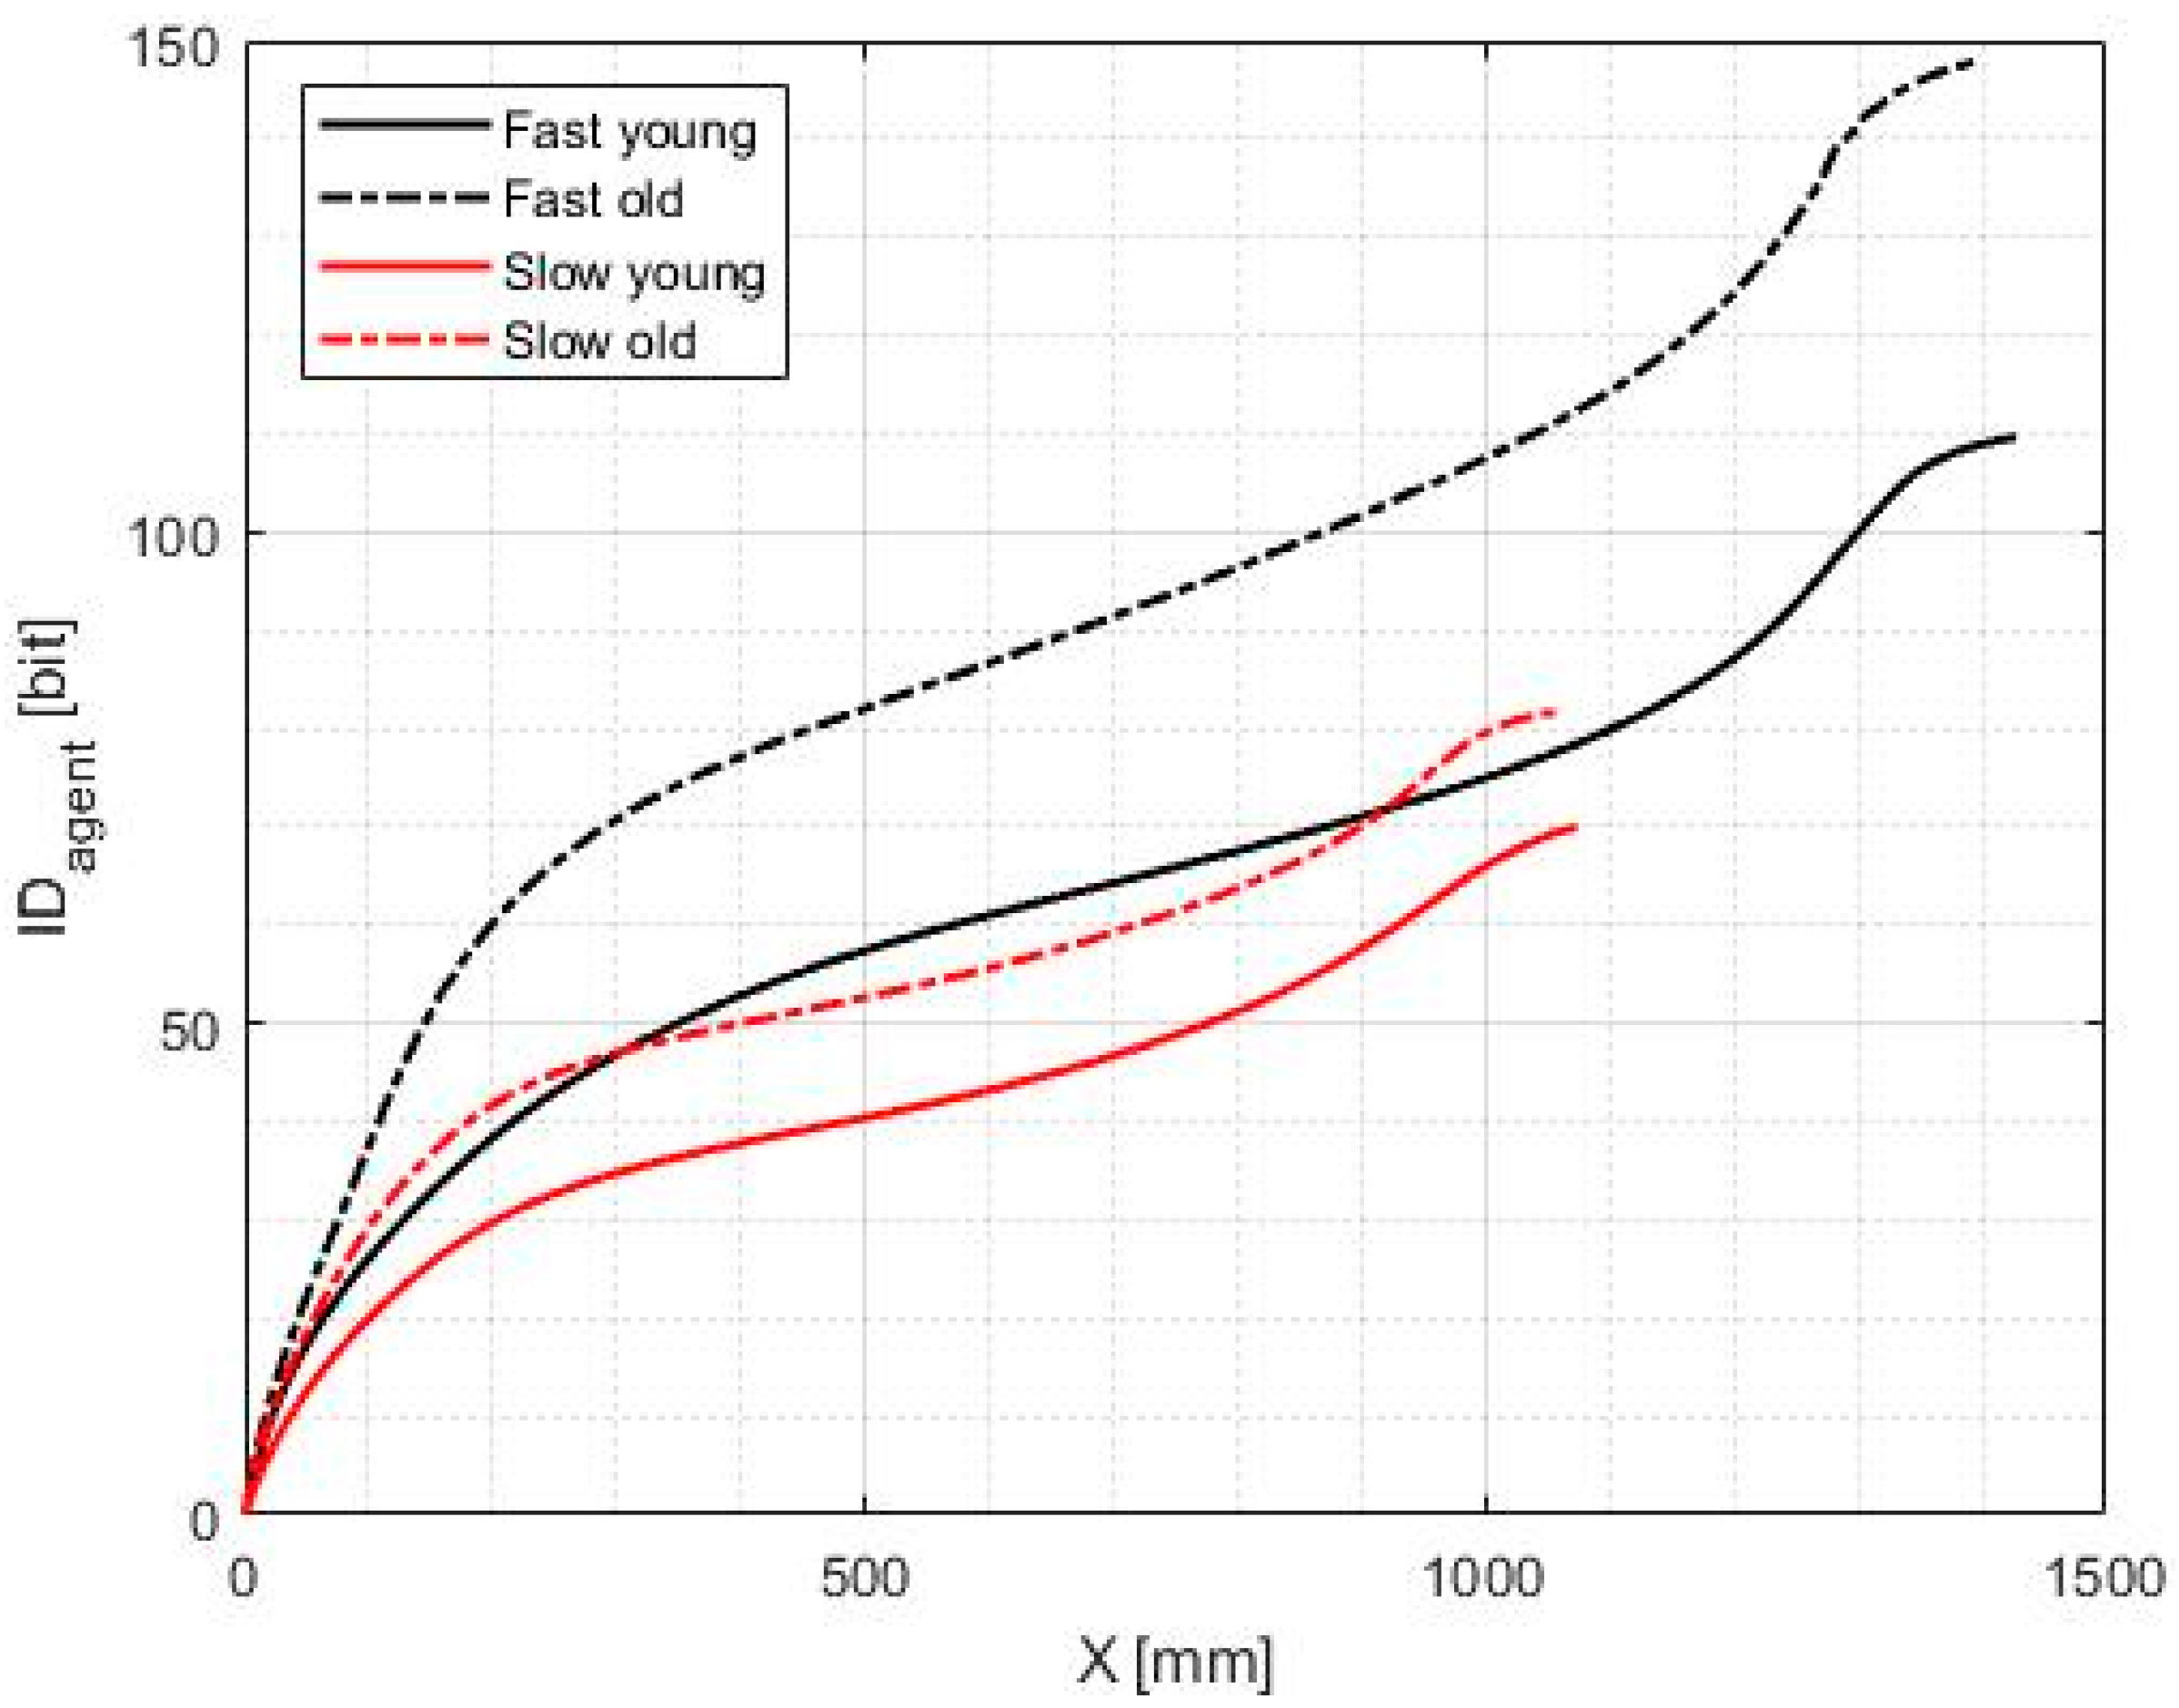
In both speed conditions, the elderly population shows a steeper increase in the Index of Difficulty during the first part of the trajectory, compared to the young population; this is a consequence of lower values of W for old subjects, who show a smaller adaptation capability and, therefore, a lower affordance during the pre-swing phase of the trajectory. Similarly, greater values for the overall trajectory are obtained for the elderly subjects.
The average
profiles have been calculated for the categories “Young” and “Old”, at “Slow” and “Fast” speed levels (
Figure 7). At each
x value, a higher speed leads to higher
average values for both young and old subjects; higher speed values also lead to greater stride length.
A mixed-design analysis of variance (ANOVA) is conducted to assess the effects of age and speed on the Index of Difficulty of each trajectory . The age group is defined as the “between-subjects” factor and the speed condition is defined as the “within-subjects” factor.
Prior to the ANOVA, both between-subjects and within-subjects assumptions are checked. All subjects are independent from each other. The Shapiro–Wilk test is used to determine whether each subset of data (according to the categorization from
Table 1) is approximately normal; the older subjects within the slow condition did not meet this assumption (
p = 0.018). Aside from this subset, the remainder of the dataset is approximately normally distributed. The ANOVA is typically robust to violations of normality, and therefore the analysis was pursued even though one subset of the data did not meet the assumption. The variances are tested using the Levene’s test, where it is confirmed that the variances among both age groups for each speed condition are approximately similar (Slow vs. Age:
p = 0.789 > 0.05; Fast vs. Age:
p = 0.701 > 0.05). The within-subjects assumptions are also met: each subject participated in both the slow and fast speed conditions, the total number of subjects (
N = 34) is large enough to assume normality, and sphericity can be assumed since there are only two conditions.
The mixed-design ANOVA reveals a significant within-subjects effect of speed (F(1,32) = 73.71,
p < 0.001) and between-subjects effect of age (F(1,32) = 14.70,
p < 0.001) on
. An interaction between both factors (F(1,32) = 4.38,
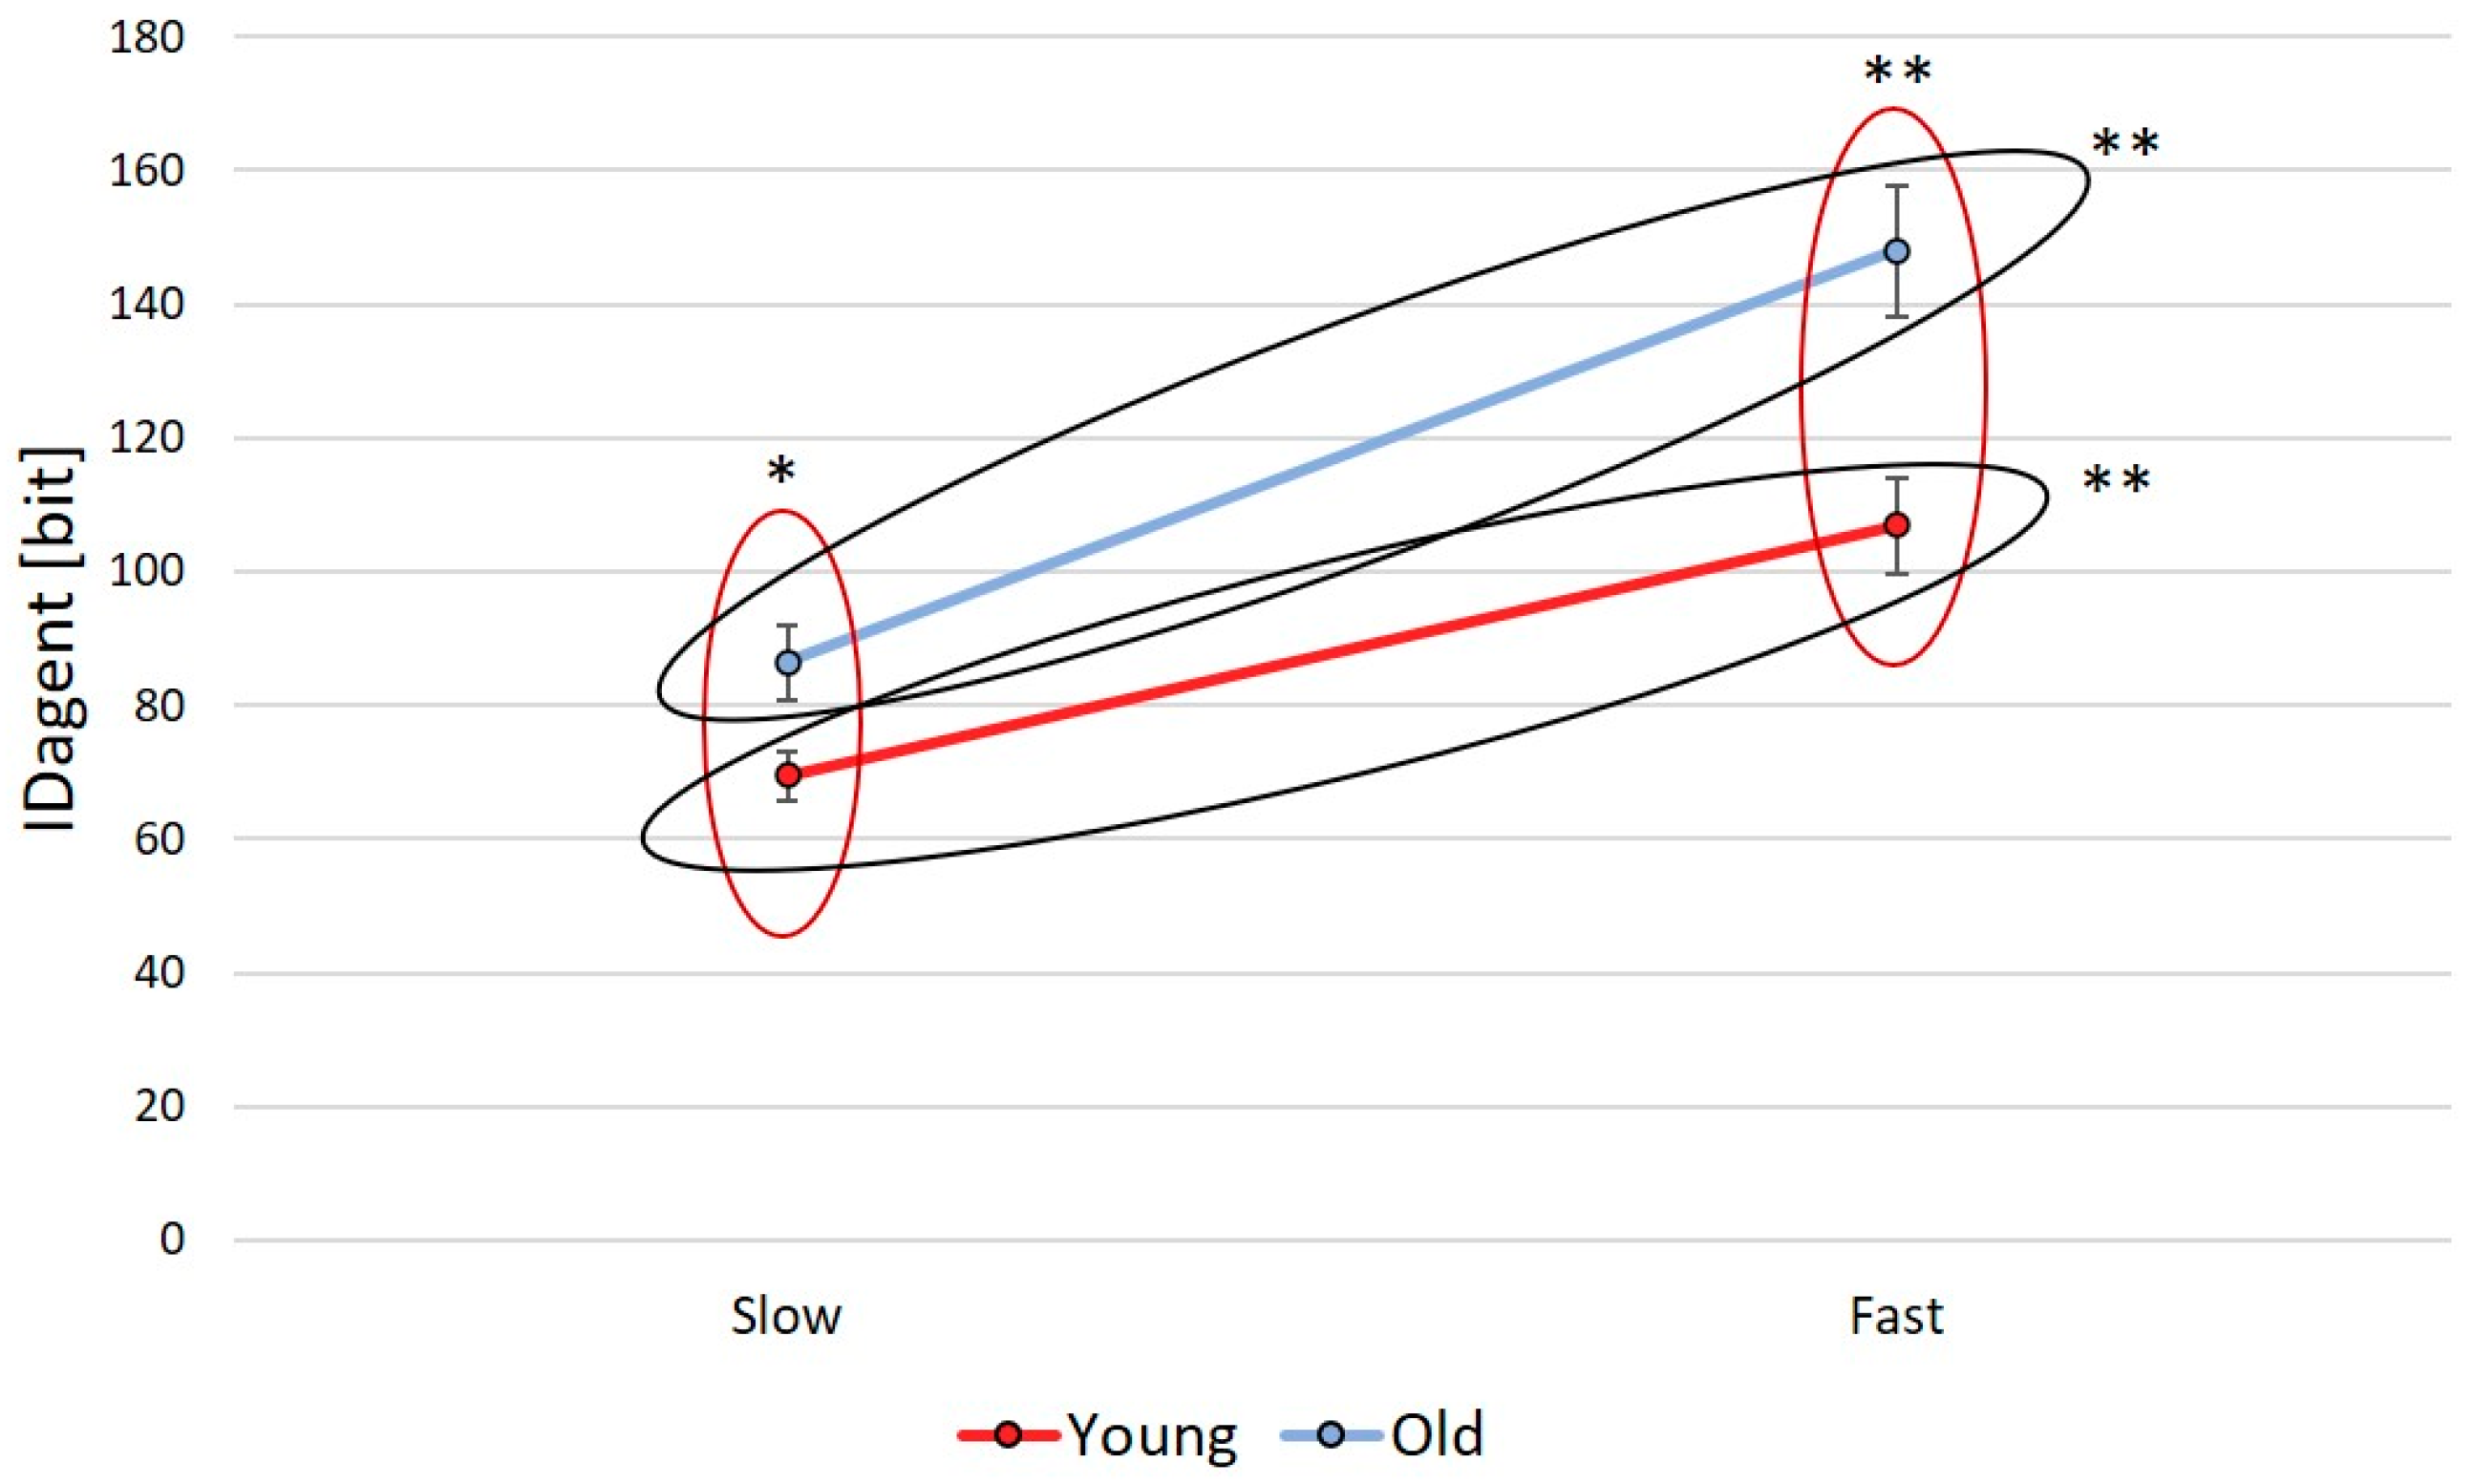
p < 0.05) is also observed. To further examine the significance, four post-hoc tests are conducted, where two independent-samples t-tests are used to determine the between-subjects significance of age and two paired-samples t-tests are used to determine the within-subjects significance of speed conditions (
Figure 8). Post-hoc independent-samples t-tests, using the Bonferroni correction (α = 0.05/4 = 0.0125), confirmed that the
of the two age groups did differ during the slow condition (t(32) = 2.65,
p = 0.01248) and during the fast condition (t(32) = 3.47,
p < 0.002), with higher
values in the older subjects. Post-hoc paired t-tests, using the Bonferroni correction (α = 0.05/4 = 0.0125), confirmed that the
of each age group did differ significantly (young: t(19) = −4.94,
p < 0.001; old: t(13) = −7.23,
p < 0.001) across the two within-subjects conditions (slow vs. fast).
In
Table 2, the age and average speed of each subject walking at different speed levels obtained by the publicly available dataset [
33] are shown.
At given probability
, the
) values have been calculated for each subject of given age in all speed conditions obtaining the following regression model:
with:
“Age” = age of the subject;
“Speed” = average speed of the subject in performing a trajectory at a given speed condition;
where:
(are the regression parameters obtained for a probability value of ;
the generic z-score of a unit normal distribution corresponding to a generic probability value of ;
is the reference z-score of a unit normal distribution corresponding to a probability value of : the k-th trajectory of a subject meets, with probability , the spatial constraint of width at the i-th point . is a reference probability value; we set (i.e., = 1);
are the regression parameters which proved, in the dataset considered, not varying with probability values.
The regression parameters obtained are shown in
Table 3.
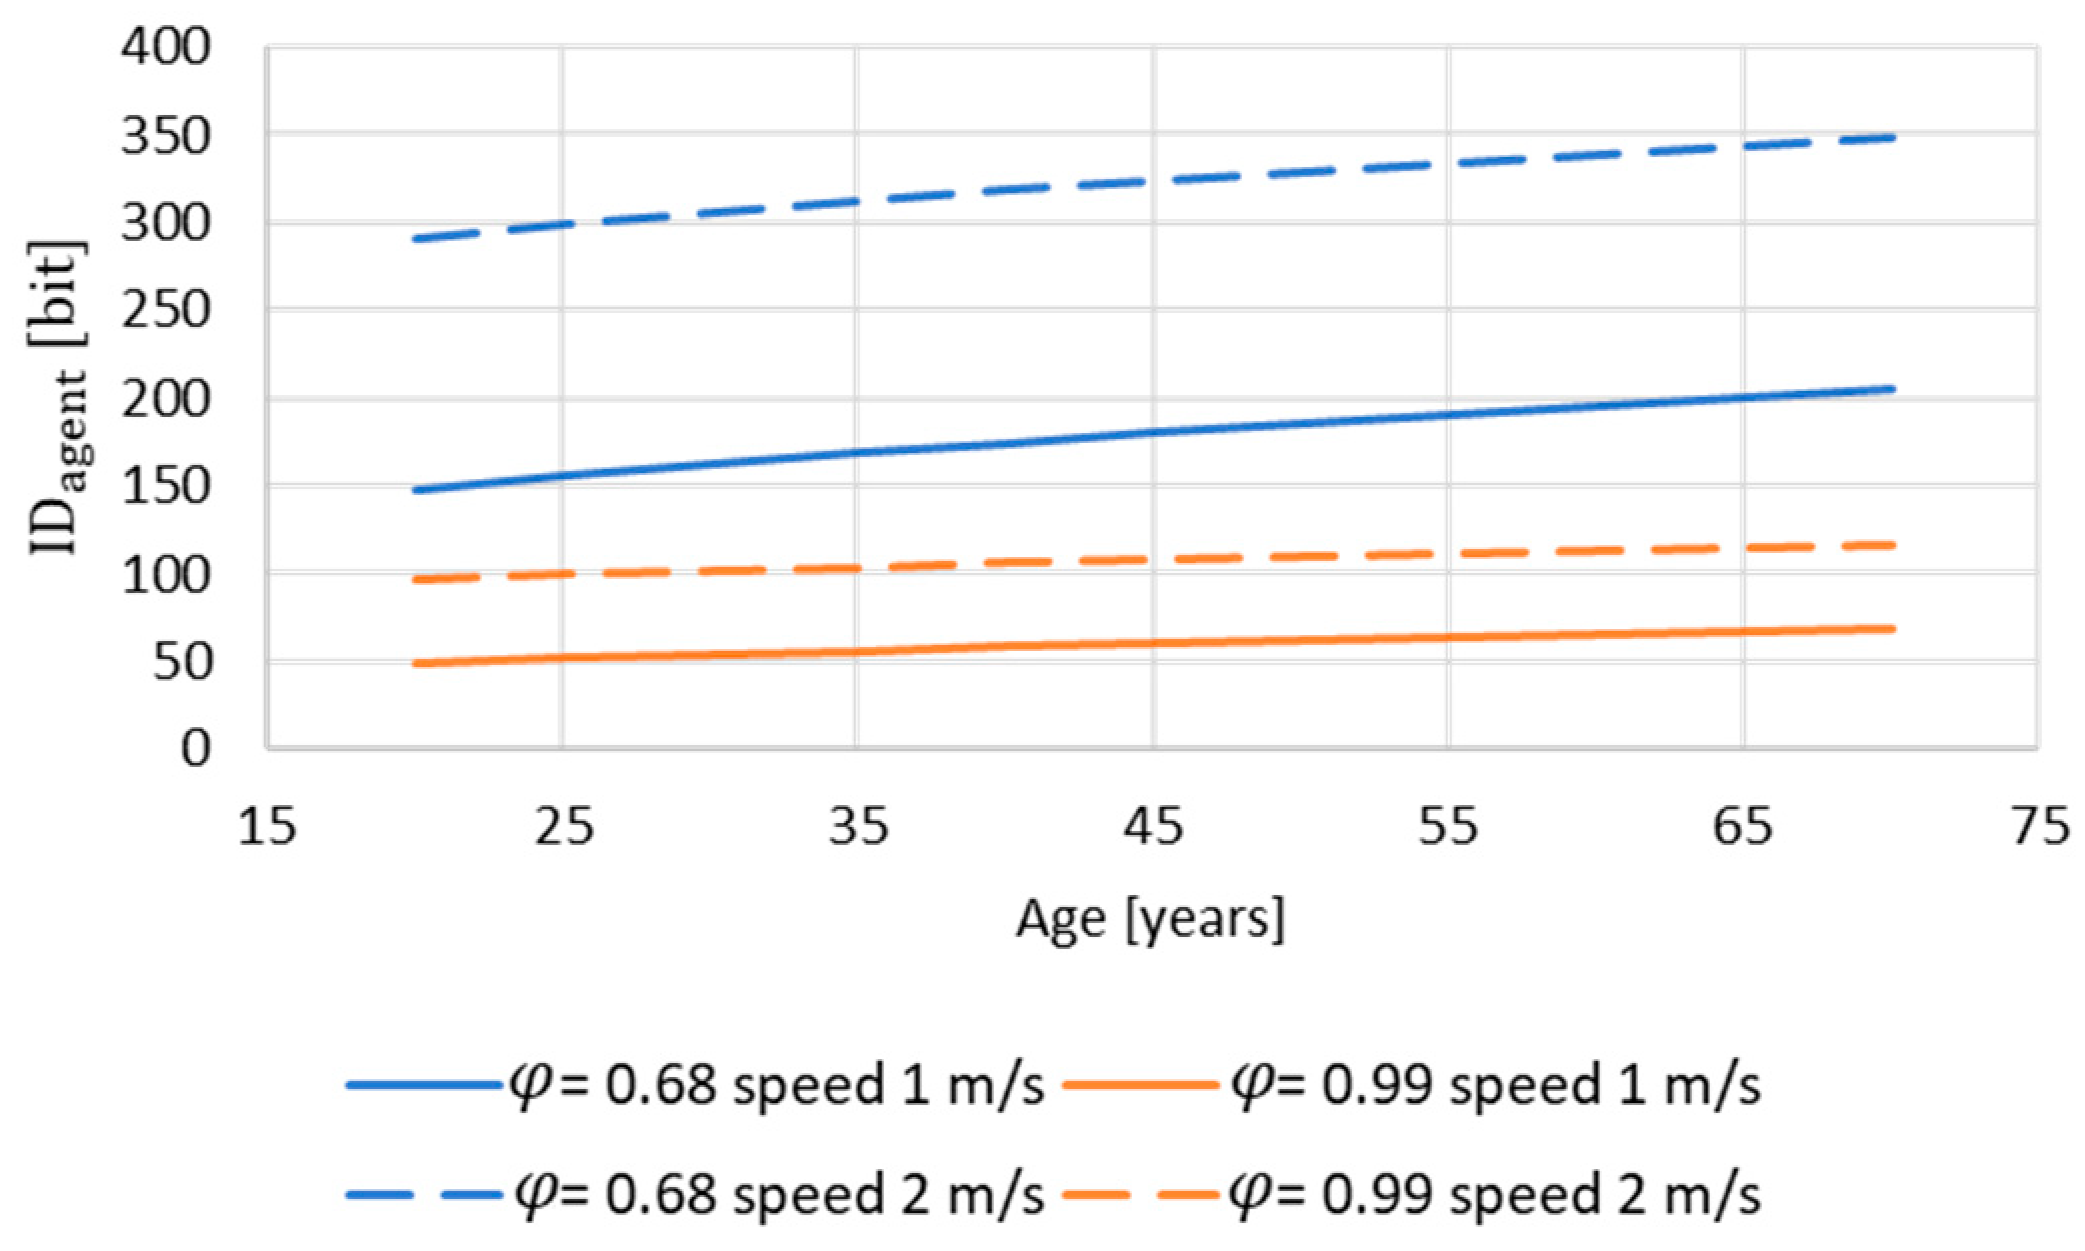
In
Figure 9,
is plotted against the age of the subjects for different speed and
values.
As previously noted, for a given probability , increases with the age and speed. Higher values are observed for higher speed and lower probability values, indicating that the subject has less redundancy in executing trajectories. This proves the effectiveness of the regression models in capturing ’s major dependency on age and average speed, as already observed in the previous statistical analysis. Such a result is strictly referable to the dataset adopted. However, the approach proposed is of general validity and could be applied to different motor tasks.
The model (Equation (8)) shows to be effective in describing the complexity of trajectories observed and can be adopted as an affordance measure of a subject executing trajectories. Such a conclusion is confirmed by comparing the with the Geometric Index of Entropy (GIE) proposed in the literature (Equation (2)).
The comparison between the
and the GIE is carried out. By adopting the same dataset of relation (9), GIE values are calculated, and the following regression model is obtained:
with
= 34.22% and
p-value > 0.2. The poor statistical significance of the regression expresses a significantly lower capability of GIE, in comparison with
, in catching statistical affordance of differently aged subjects in executing a motor task along a trajectory at different average speed. This is due to the different nature of the compared affordance indexes. On the one hand, the GIE refers to the length and to the convex hull of the trajectory neglecting its shape: differently shaped trajectories having the same length and convex hull can have the same GIE. On the other hand, the peculiarity of the
definition refers to specific trajectory’s shape and length. Furthermore,
also considers the stochastic variability range at each point of the trajectory which is an essential information for affordance evaluations we carried out by the proposed model.
5. Conclusions and Further Research
This study deals with affordance measures of observed reaching motor tasks executed by subjects. The issue is of great scientific and industrial interest as it pertains the ability of a human agent with given dynamic features to accomplish different trajectories constrained by the environment (external constraints) and by internal constraints (features of the agent). To this purpose, the authors propose an analytical stochastic model to calculate a new Index of Difficulty
extending the deterministic formulation of the Index of Difficulty,
IDt, proposed in the literature [
25];
IDt was originally defined as being dependent on only the geometry of a spatially constrained trajectory. On the contrary, stochasticity of the phenomenon has to be considered for taking into account of the natural variability of subjects in following different trajectories for an assigned reaching motor task in a given environment.
The model proposed has been applied to an available dataset of differently aged subjects, each of them having known features such as mass and leg length, executing a trajectory in a given environment. We proved the proposed Index of Difficulty, being an effective measure to capture the stochastic complexity of a general spatially constrained trajectory or parts of it. The model revealed a strong statistical dependency of on age and average execution speed of the subjects.
A statistical analysis (mixed design ANOVA and post hoc tests) provided significant differences in the average for “Young” vs. “Old” subjects, and, for each age class, for “Slow” vs. “Fast” average speed. A regression model confirms the significant dependency of of a subject on age and speed execution. The results obtained are strictly referable to the dataset considered. However, the approach and model proposed are of general applicability.
A current limitation of the proposed model (Equations (7) and (8)) is the assumption of two-dimensional trajectories. This assumption is valid in many practical cases, such as walking, where the foot end-effector movement is mostly contained in the sagittal plane [
34], or in object manipulation for industrial settings where the hands of the operator move in the horizontal plane (like the positioning of a component or a fixture on a horizontal work surface area). Future research will focus on extending the model to a three-dimensional trajectory. The extension will further enable the applicability of the model to real cases.
In biomechanics, the model proposed could be adopted to appreciate differences in motion affordance of observed trajectories for different parts of the human body. Clinically, the model can provide quantitative estimations in affordance improvements of a subject participating in a rehabilitation program by executing the same reaching motor task, allowing for the analysis of the subject’s improvement after the program.
During a general task, humans are able to demonstrate variability while maintaining robust control over their motion due to redundancies that exist within these tasks [
35]. In this regard, the Index of Difficulty suggests a novel additional perspective to understand the nature and effects of trajectory variability, which cannot only predict motor impairment as it is usually considered, but it can also be a measure of redundancy exploitation and be an indicator of optimal motor control. Within the working environment, the model could be usefully applied to investigate affordance of subjects in executing reaching motor tasks by upper limbs. The model proposed can provide quantitative affordance evaluations on capability of workers in carrying out working tasks and related improvements due to workers’ training.
