Article

A Study on the Flow Characteristics of Copper Heavy Metal Microfluidics with Hydrophobic Coating and pH Change

1
School of Civil and Environmental Engineering, Urban Design and Study, Chung-Ang University, Seoul 06974, Korea
2
Department of Intelligent Energy and Industry, Chung-Ang University, Seoul 06974, Korea
3
Department of Civil Engineering, Chung-Ang University, Seoul 06974, Korea
4
Department of Infrastructure Safety Research, Korea Institute of Civil Engineering and Buldign Technology, Goyang-si 10223, Korea
5
Department of Civil and Disaster Prevention Engineering, Halla University, Wonju-si 26404, Korea
*
Authors to whom correspondence should be addressed.
Appl. Sci. 2021, 11(10), 4328; https://doi.org/10.3390/app11104328
Submission received: 8 April 2021 / Revised: 2 May 2021 / Accepted: 7 May 2021 / Published: 11 May 2021
(This article belongs to the Special Issue Environmental Restoration of Metal-Contaminated Soils)

Abstract

:
The present study purpose was to identify the flow characteristics of the drainage filter considering the characteristics of the landfill site, and to study the basic technology for efficient remediation of heavy metals. To this end, copper heavy metal was selected in consideration of landfill characteristics, and a study on flow characteristics was conducted using hydrophobic coated capillary tubes and microparticles. It was confirmed that the flow rate decreased as the pH increased at the hydrophobic surface, and pH 4, 6, and 8 flowed similarly in the center of the capillary tube, but decreased at pH 10. In the bottom part, it moved at the slowest speed of 1~4 μm/s and middle of center moved 17~25 μm/s. There was little change in flow in the CFD (Computational Fluid Dynamics) numerical analysis considering the surface contact angle, which is a hydrophobic characteristic, and the velocity coefficient was presented by regression analysis through the experimental results. In this way, the current study will be a basic examination of the selective remediation process of pH on hydrophobic coated surfaces.

1. Introduction

Recently, the importance of soil environment has been recognized, primarily because the seriousness of soil and groundwater pollution has been heightened due to waste and harmful chemicals generated by population growth and industrial development worldwide [1,2,3]. Pollution of the ground and groundwater by pollutants occurs through various routes. If pollutants generated from landfill leachate, factory wastewater, pesticides, and abandoned mines are discharged without going through the treatment process, it can cause serious problems [4,5,6]. In addition, soil has a very large buffering capacity for pollutants, but its limited capacity varies depending on the characteristics of the soil and environmental factors [7]. In particular, soil pollution caused by chemical spills from chemical substance handling facilities is difficult to manage efficiently and adversely affects human health compared to water and air pollution [8,9,10,11].
On the other hand, the technology for removing and restoring pollutants in the soil has been developed and is practical in application. Among them, soil cleaning, soil steam extraction, water treatment, and bio-venting are mainly used as field restoration technologies in contaminated areas [12,13,14]. However, the above restoration techniques are mainly applied to coarse and unsaturated ground, and their applicability and efficiency are inevitably reduced to grounds with low permeability due to the large amount of fines contained in areas such as landfill industrial complexes. Further, in the past landfilling process, various household wastes were buried, so a detailed investigation and soil management in these areas is urgently required [15,16,17,18,19].
As an example of a remediation technology that can solve this problem, an example is a remediation technology using drainage materials consisting of filters and cores, which has been under a lot of research recently. This has the disadvantage of reducing the permeability of the drainage filter material due to various chemical reactions caused by the composition of complex pollutants in the soil, which can lead to inefficient results in decontamination. Although treatment techniques are needed to satisfy the flow characteristics of pollutants in the soil, there is little research on the flow characteristics of pollutants at this time. Therefore, it is necessary to identify the flow characteristics of complex pollutants contained in soil and groundwater when passing through the transmission membrane in the filter to remove pollutants, and development to purify complex pollutants based on them.
The study aimed to evaluate the application of the separation of various particles such as biomolecules and gas filters to the remediation of contaminants in the nanoporous permeable membrane, which is applied as a filter material [20,21]. Based on the fact that there are permeability coefficients which are the main variables of pollutant flow and are different because the ground is composed of various types of strata and soil, it is necessary to study the flow characteristics of heavy metal complex pollutants for complex pollutant flow control.
In this study, most industrial complexes are built in landfills, and the main purpose is to study soil pollution remediation techniques considering the location characteristics of landfills where various heavy metal complex pollutants exist. However, little research has been done on selective remediation in contaminated ground at the same time as improving soft ground using drainage materials. The purpose of this study is to investigate the flow characteristics of high concentration heavy metal contaminated soil and groundwater passing through the permeable membrane in the filter for removing contaminants. This paper is composed of the materials used in the experiment, the method, and the conditions of CFD analysis. In addition, the tube for simulating the pores passing through the drainage filter was subjected to hydrophobic treatment, and the moving velocity of copper contaminants was confirmed through microparticles. This paper was composed by drawing conclusions based on the experimental results.

2. Materials and Methods

2.1. Materials

Industrial complexes, such as landfills, were contaminated with a variety of heavy metals, and copper was chosen to account for a large portion of them. As heavy metal copper contaminants, copper sulfate Cu(SO4) was dissolved in distilled water and a silage pump was used for constant injection. Capillary tubes were used to simulate drainage filters, and optical microscopes were used to monitor the movement of microparticles. Microparticles were used to check the flow rate on the Capillary tube. The capillary tube used in the study was square, the inner diameter was 400 μm, and an optical microscope (Keyence, Osaka, Japan, VHX-1000) capable of 5000 times magnification was used. Polystyrene microparticles having a size of 2 μm were used. Microparticles have 5.4 × 10⁹ particles per 1 mL, with a weight of 1.05 g/cm3.

2.2. Methods

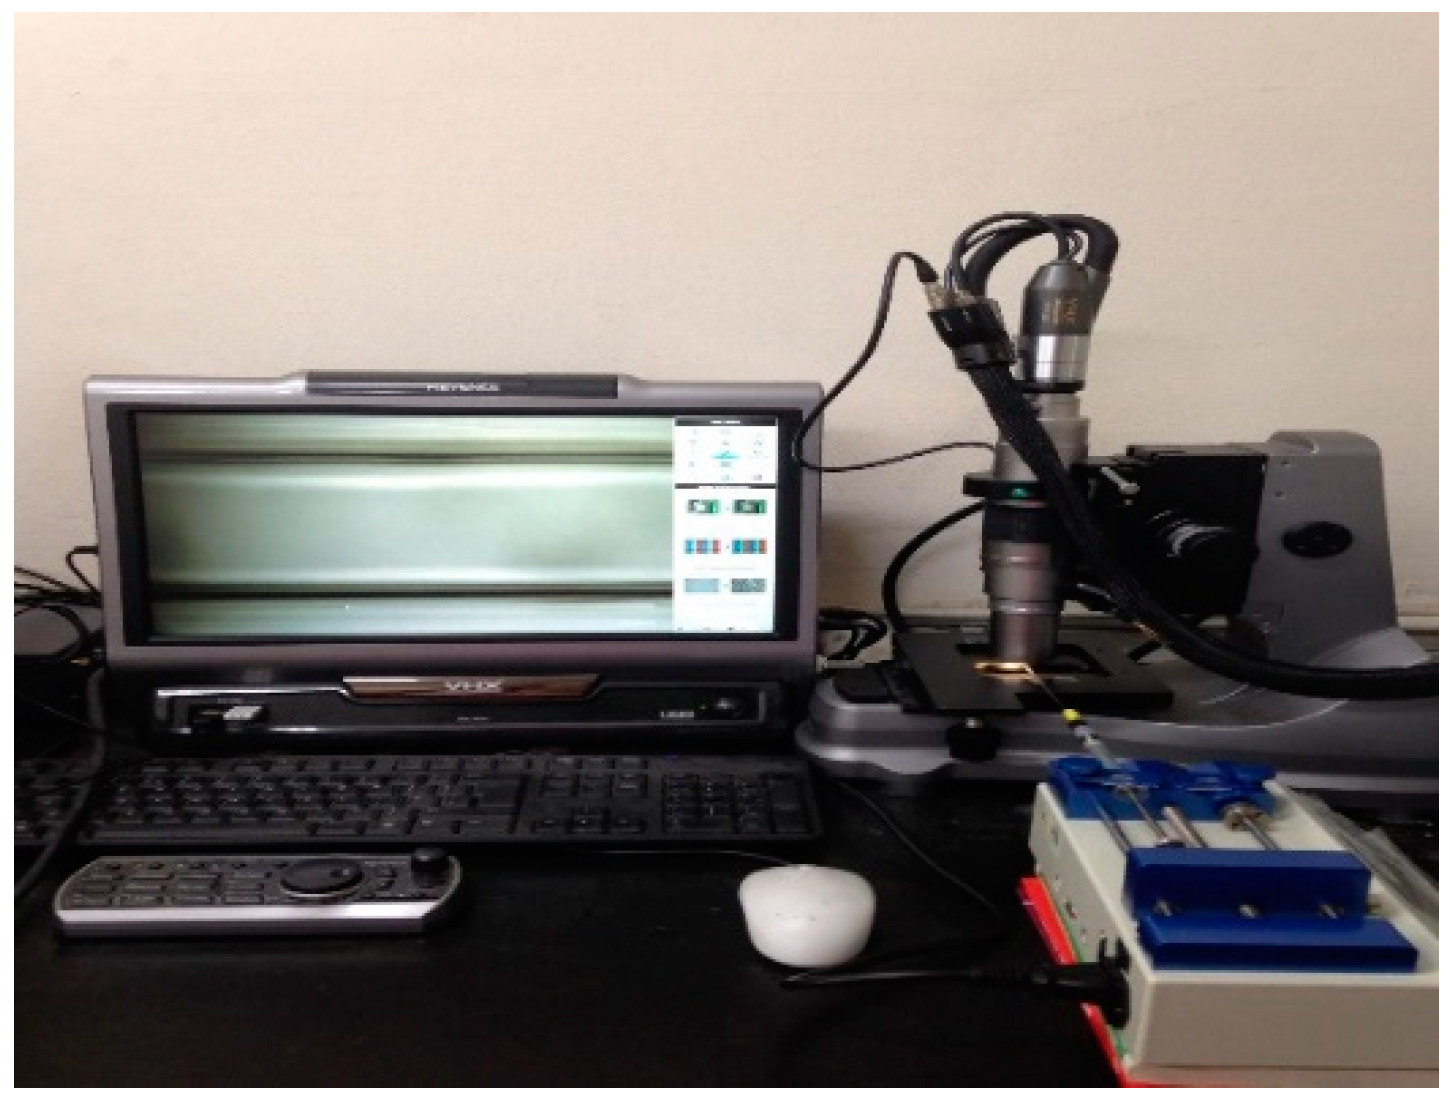
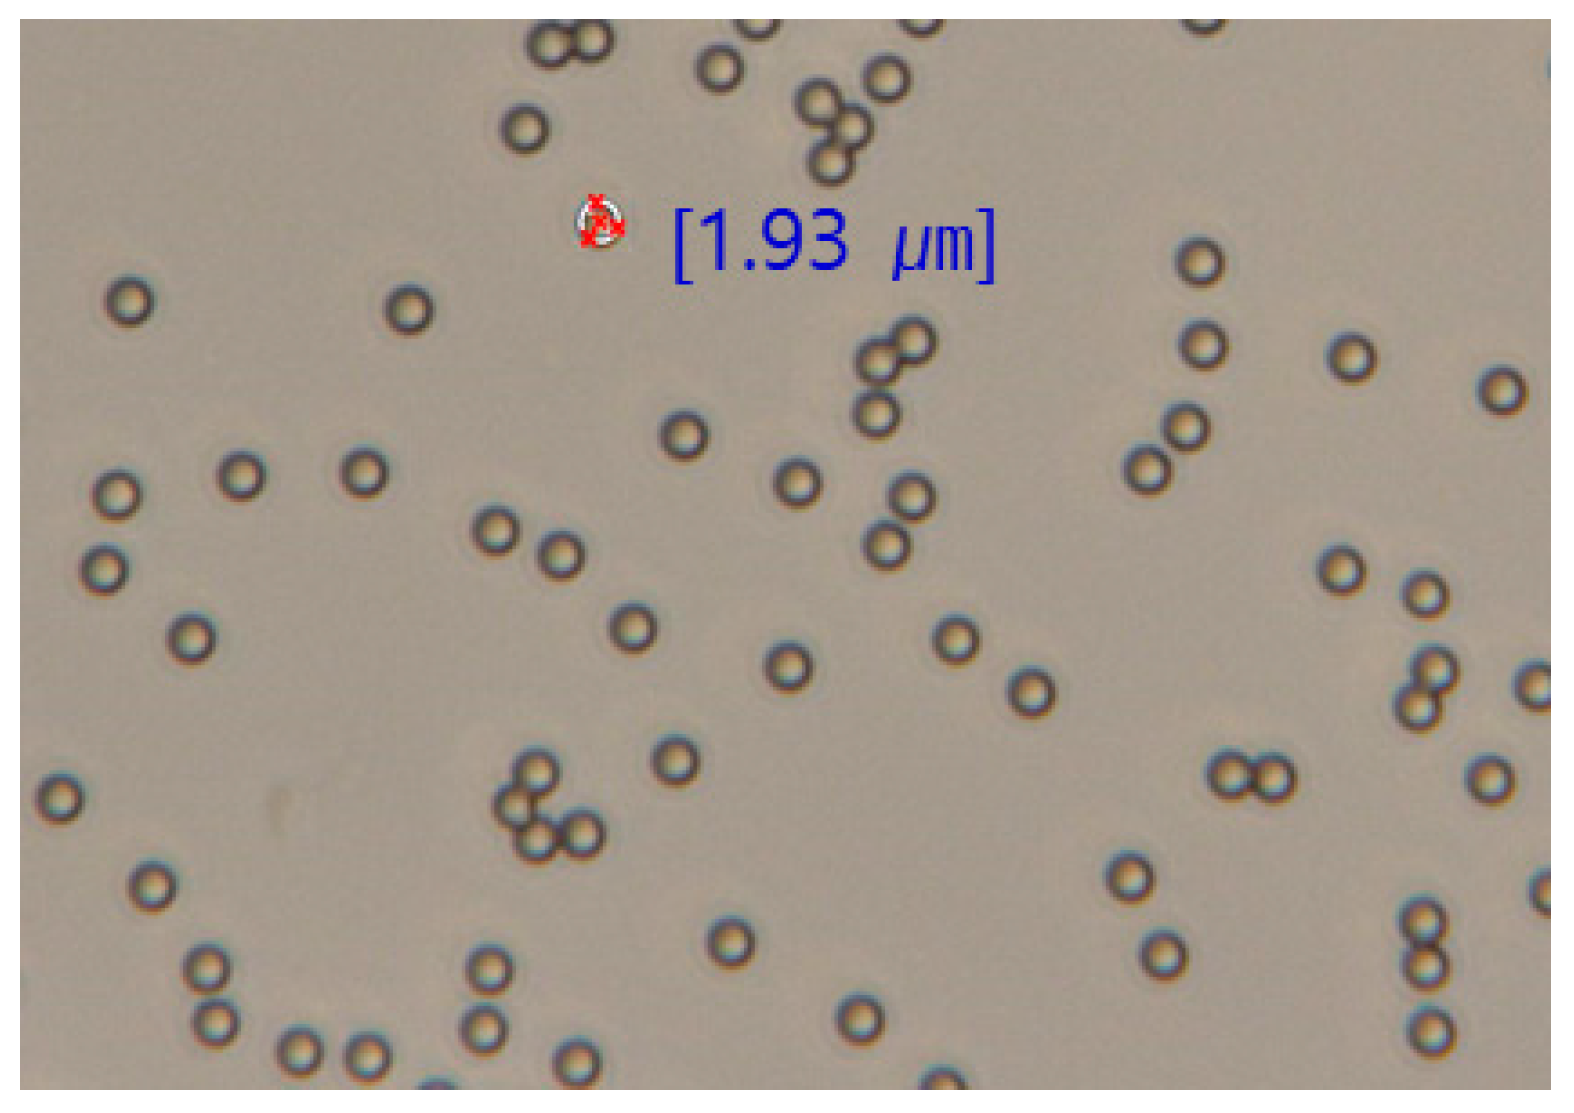
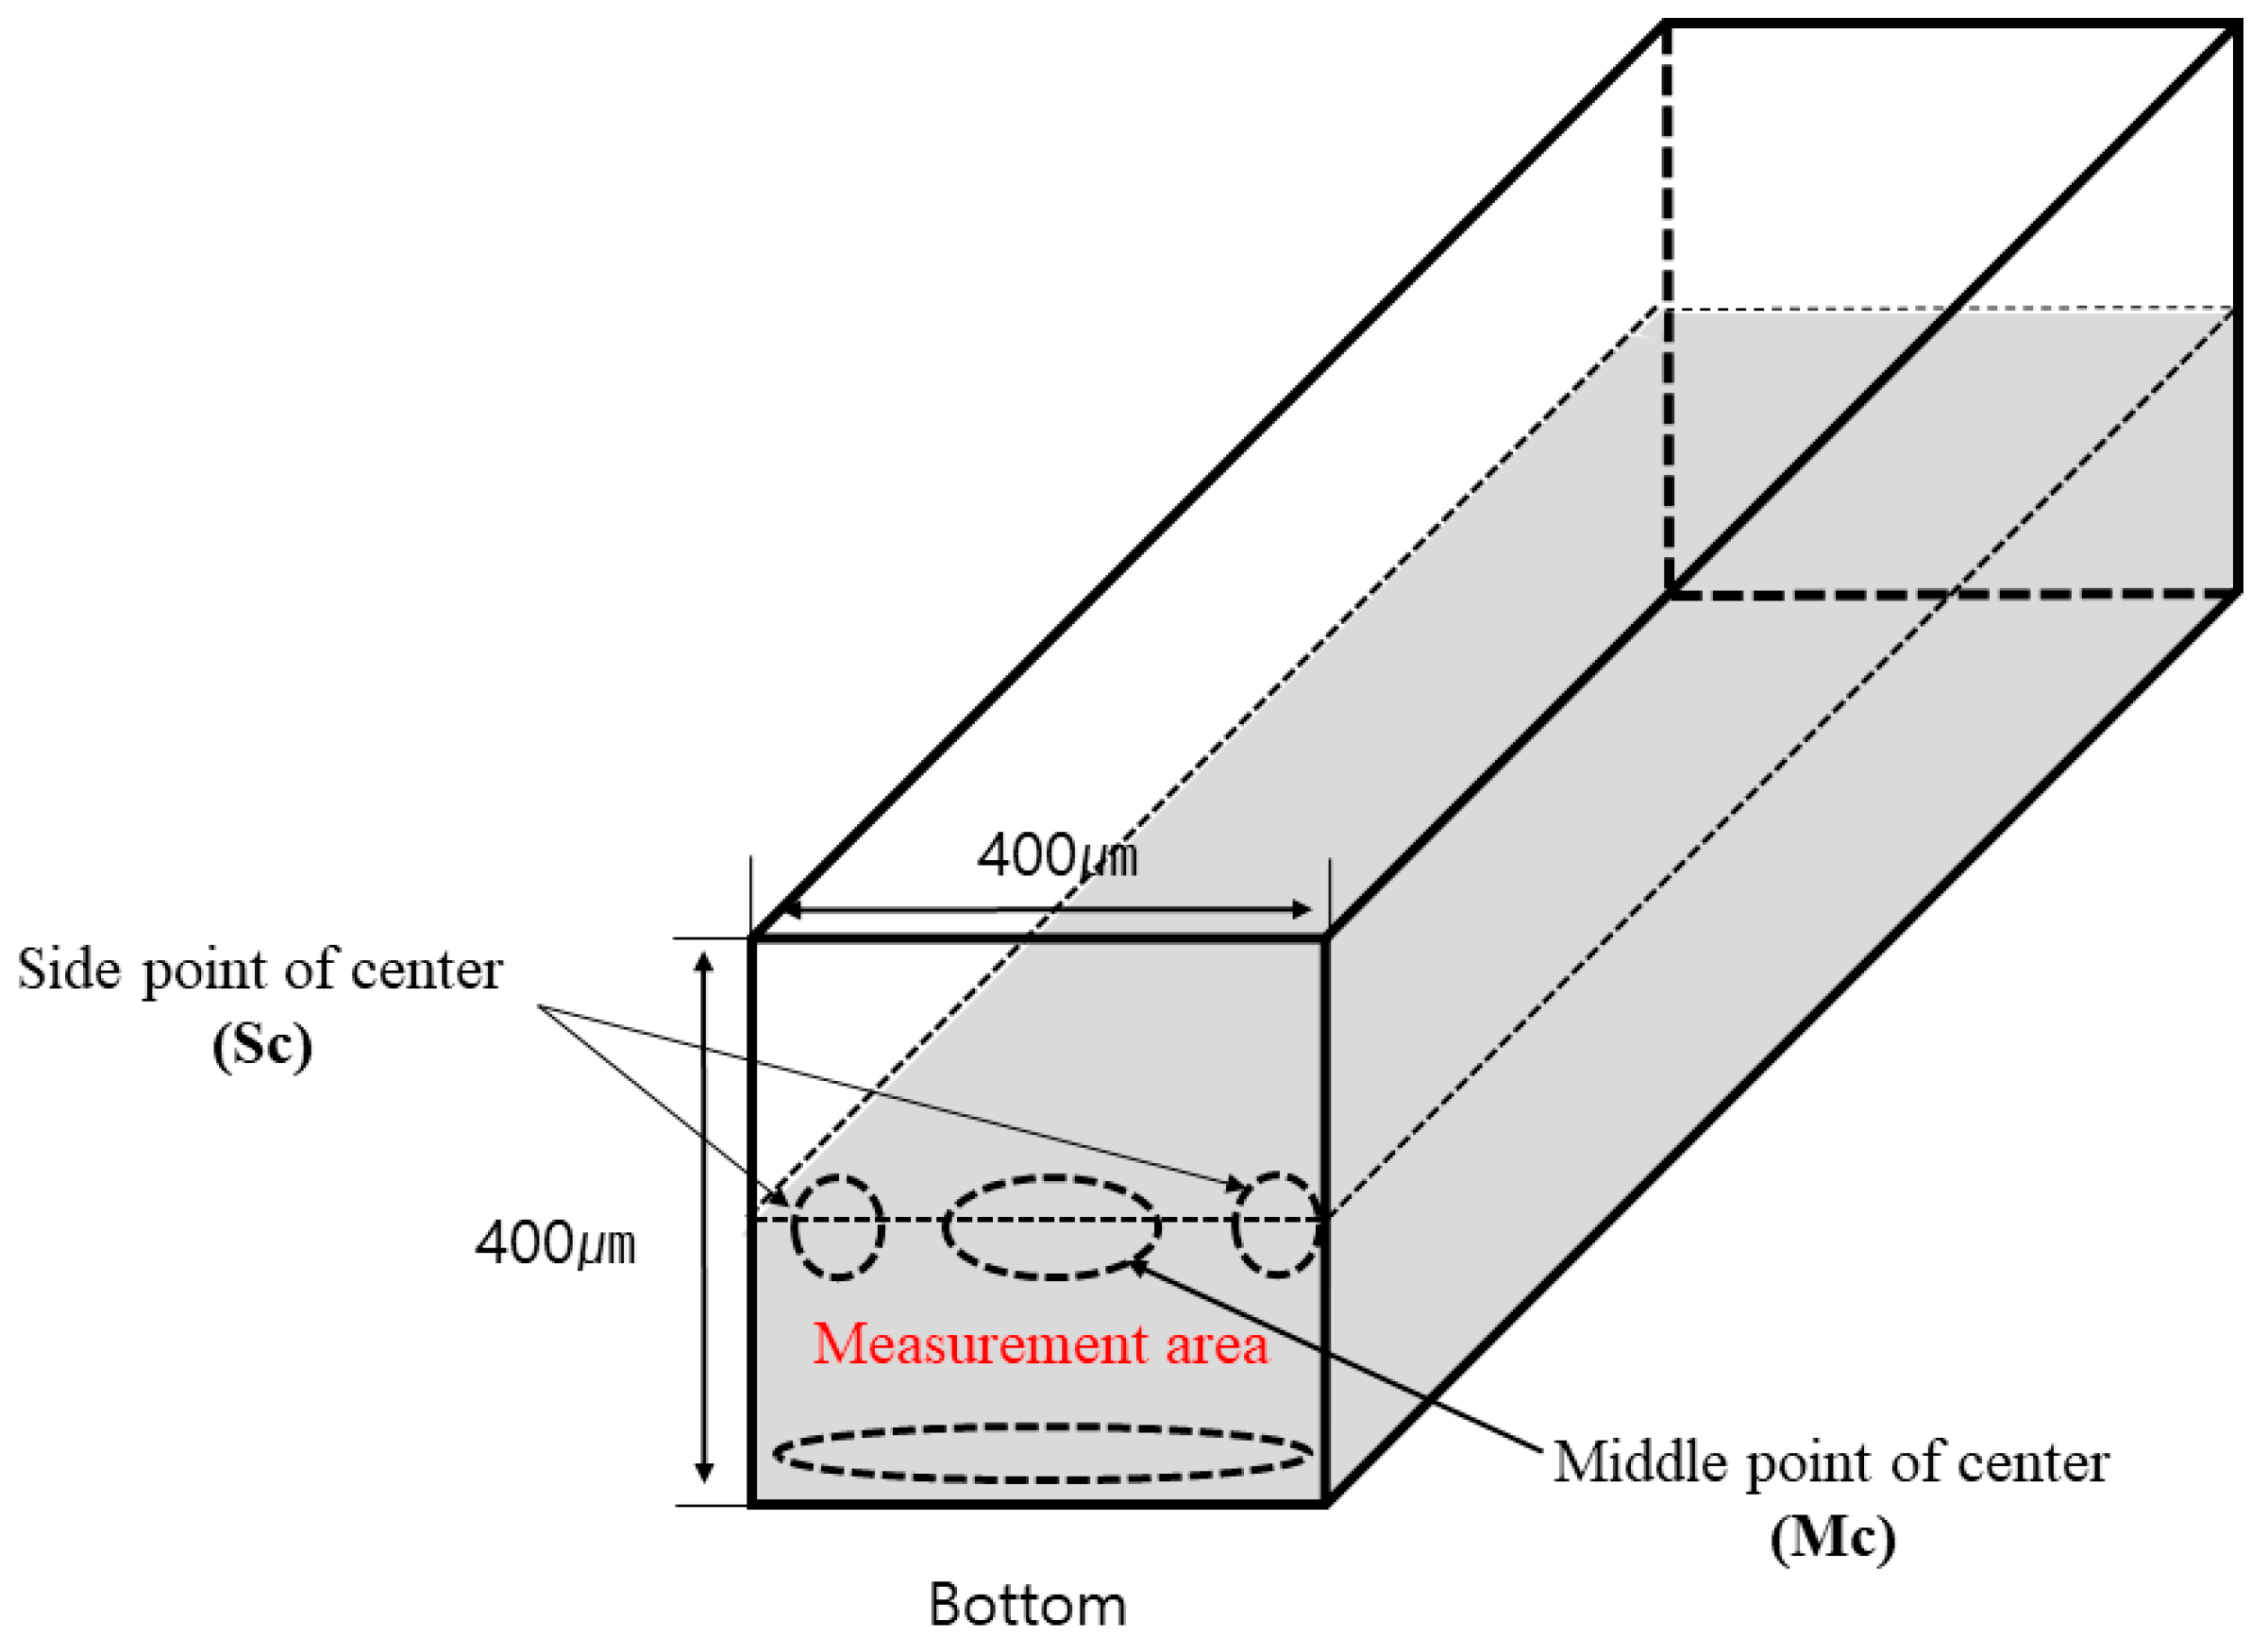
2.2.1. Microfluidic Flow Test

Contaminants were made based on the soil pollution standard of 6000 ppm indicated in the Environmental White Paper [22] for heavy copper metal contaminants, and the pH was divided into 4, 6, 8, and 10 for acid and basic conditions. The inflow velocity was injected consistently using a silage pump. The inflow velocity into the capillary tube was applied 1.0 × 10⁻³ cm/s considering the pH conditions, and 0.1 M of HCl and 0.1 M of NaOH were used for pH control. The conditions for each experiment are shown in Table 1, and the experimental equipment and microparticles are shown in Figure 1 and Figure 2. The tube was injected with a mixture of copper and particles, and the flow velocity was measured. A square capillary tube was used to analyze flow characteristics, and a square capillary tube was observed in half as shown in Figure 3. Since the square capillary tube was used, it was symmetrical up and down. The half-section area was observed, and the flow of microfluids was measured using microparticles by observing 3 parts for the bottom and center of the side and central part of the capillary tube. Three microparticles were selected using a video taken with an optical microscope. Using the video program, the moving distance of the microparticles was calculated after a certain period of time.

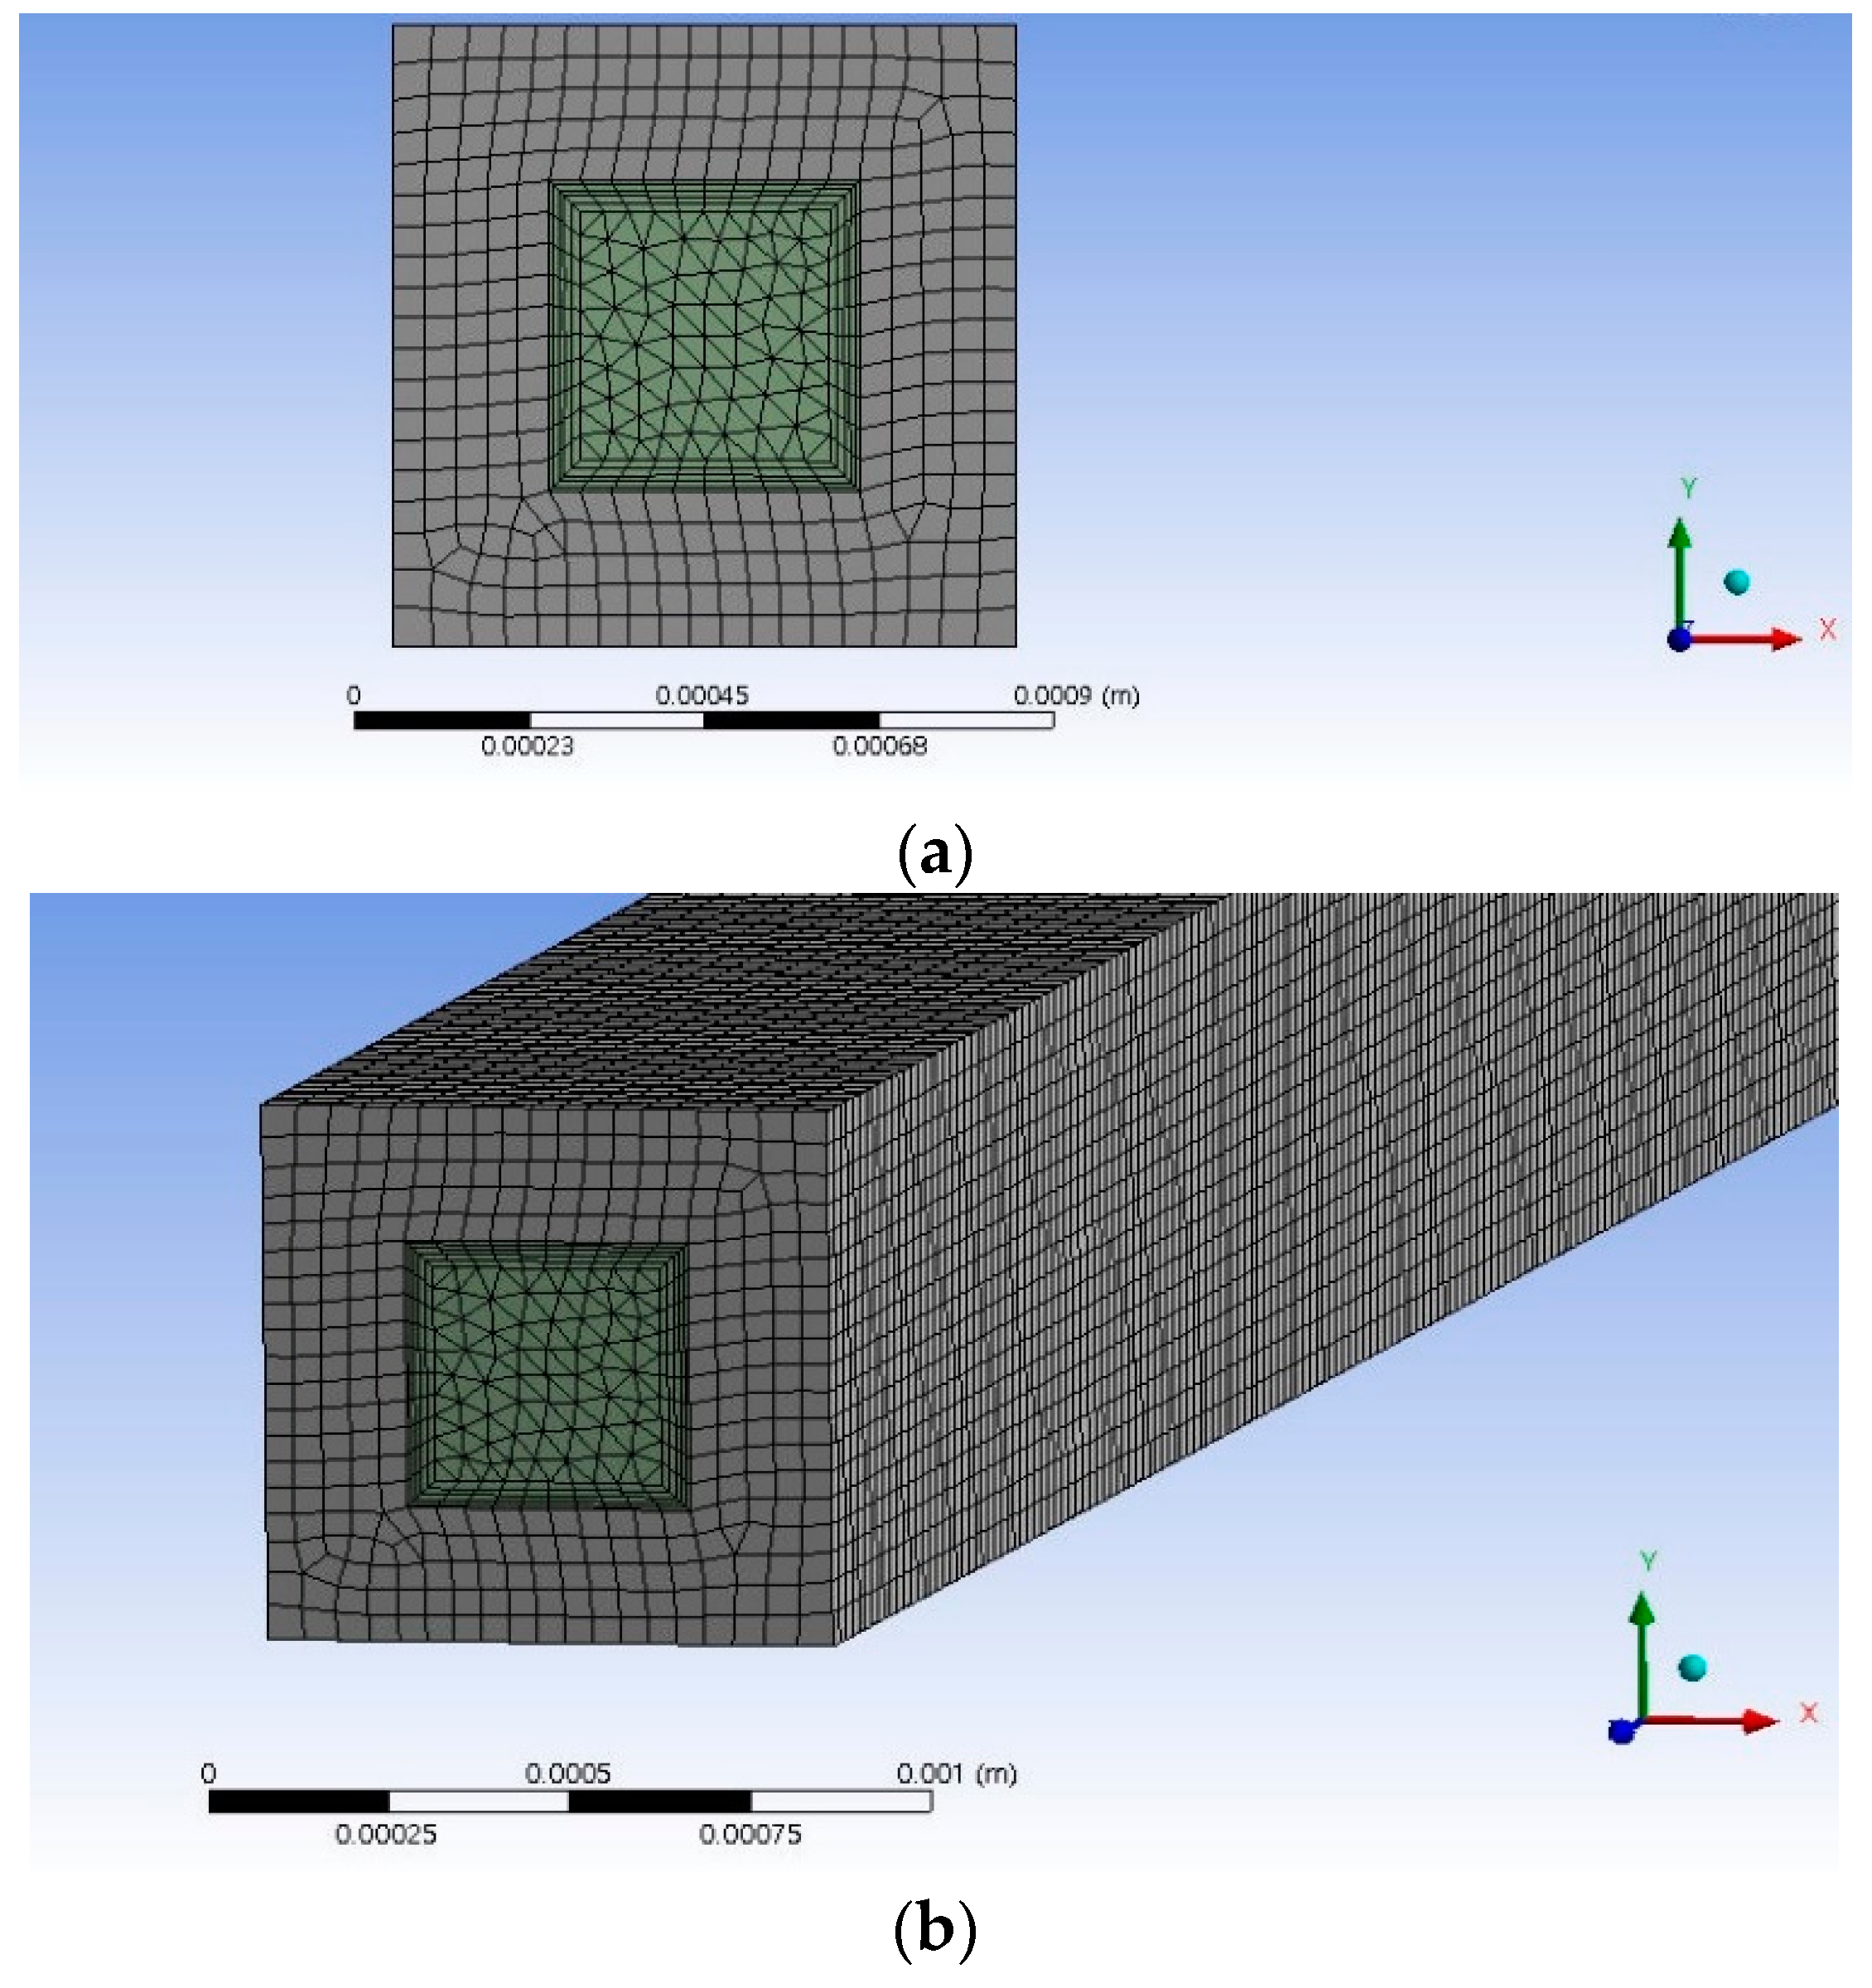
2.2.2. CFD Numerical Analysis

To check the microfluidic flow velocity in the square capillary tube according to the pH of heavy metals, CFD numerical analysis was conducted using Ansys. After hydrophobic treatment of the square capillary tube, the experimental value of the contact angle was applied to confirm the hydrophobic state, and the experimental value according to the pH was applied as the contact angle. In addition, glass-made square capillary tubes were applied for this microfluidic flow experiment, and heavy metal copper contaminants of 6000 ppm were applied. The properties used in the numerical analysis are shown in Table 2 below. Microfluidic flow test values applied with hydrophobic coating were applied.
Capillary tube has a hydrophilic surface property of glass material, and the solvent used to prepare heavy metal solutions is also distilled water and is a hydrophilic aqueous solution. The hydrophobic coating was applied with an organic solution, and the hydrophobic coating was used to check the flow characteristics of the hydrophobic surface in the capillary tube. The contact angle was confirmed for heavy metal contaminants according to distilled water and pH conditions. The surface contact angle—when passing through heavy metal contaminants after hydrophobic coating—produced some interesting results, such as the contact angle becoming decreased with basicity. Table 2 below shows the contact angle of the capillary tube identified through the previous study and the properties applied to the numerical analysis.
In order to confirm the flow of microfluids in the hydrophobic coated capillary tube, the numerical analysis model was modeled on the square capillary tube. The following Figure 4 is a modeling of a square capillary tube, which is modeled with an inner diameter of 400 μm and an outer diameter of 800 μm and a length of 3 cm.

3. Results and Analysis

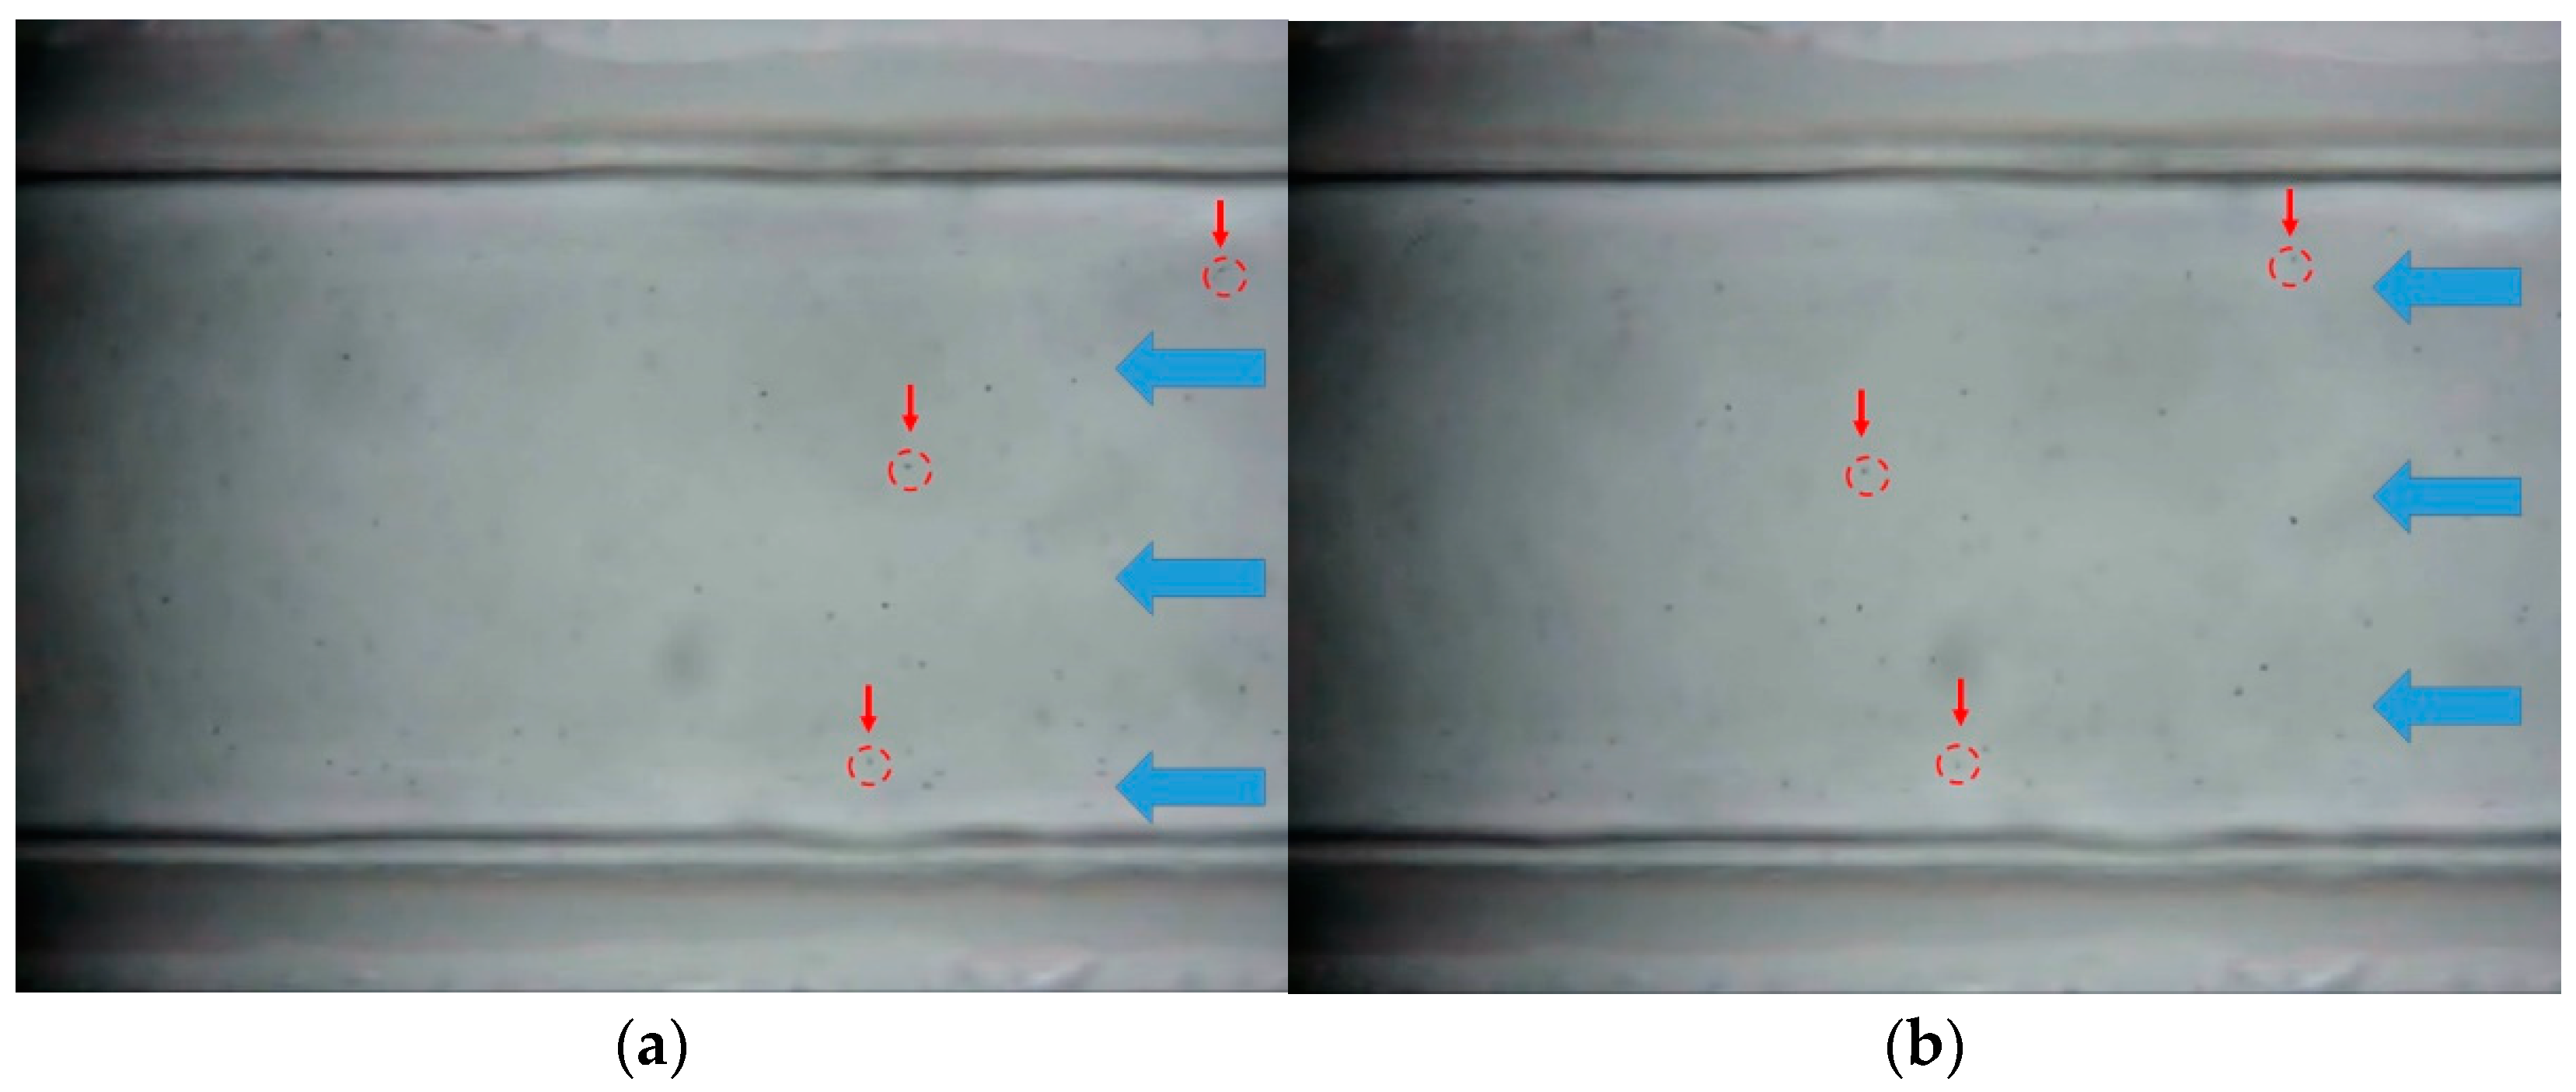
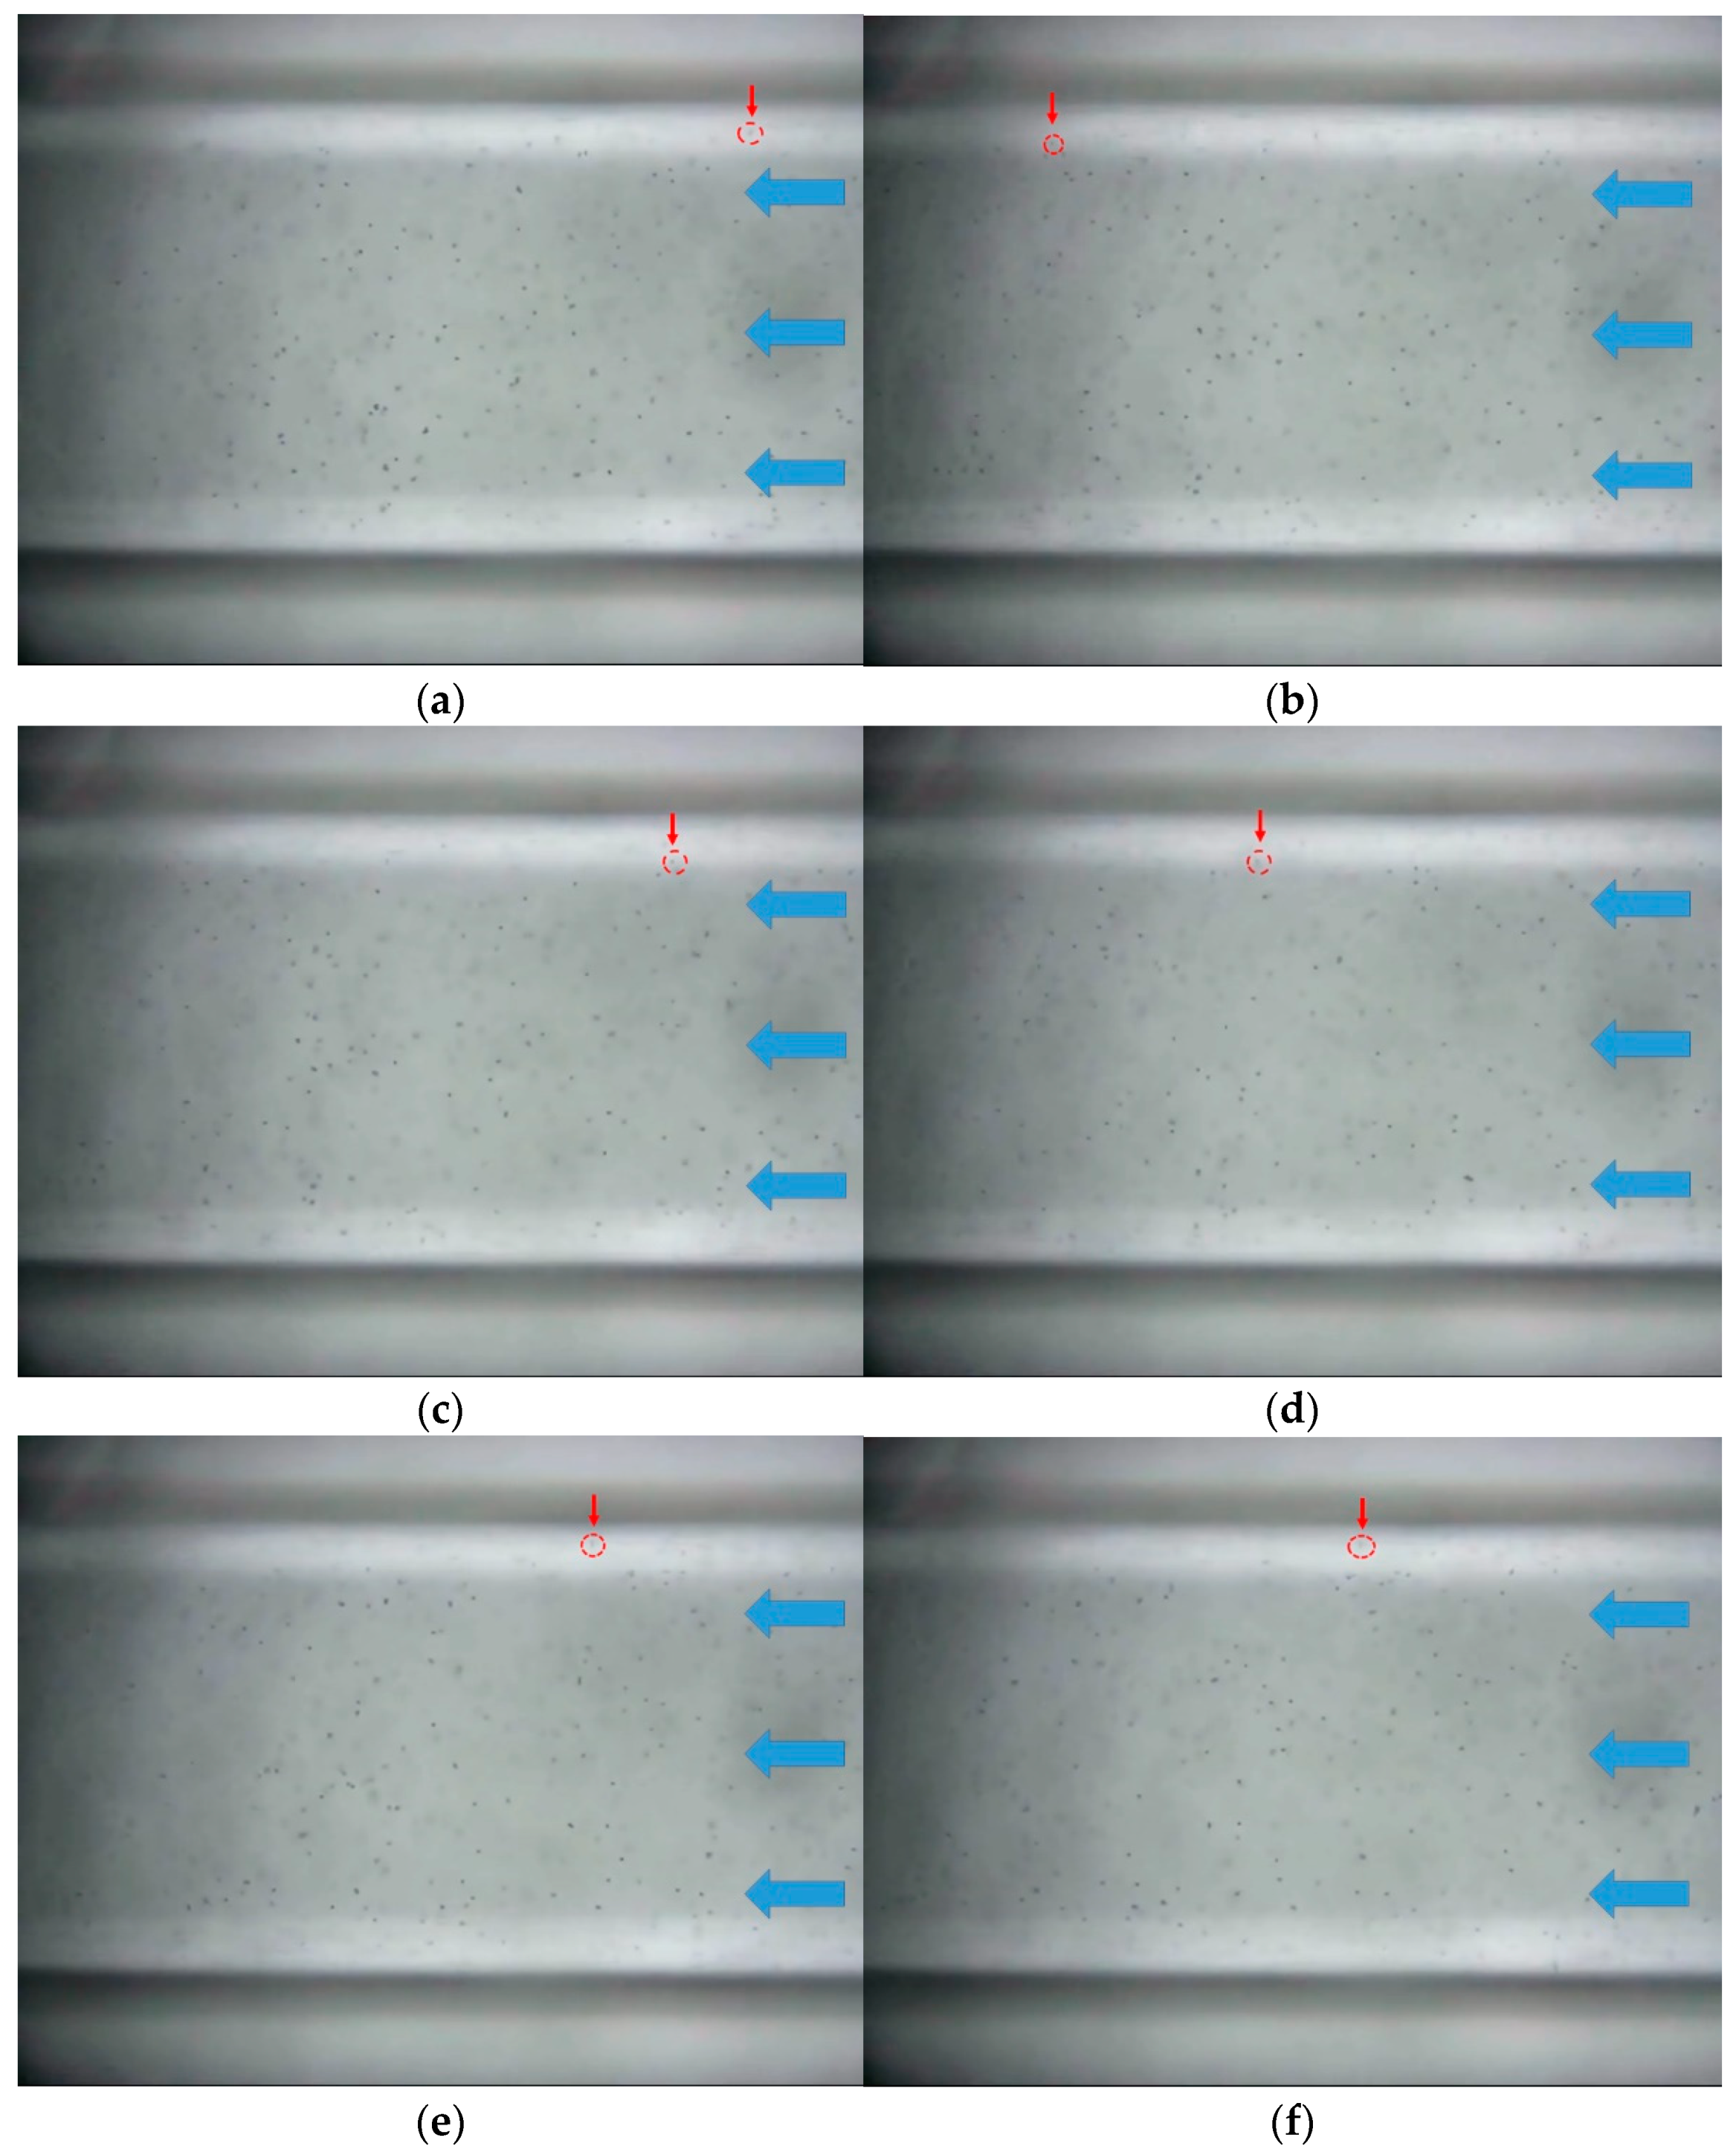
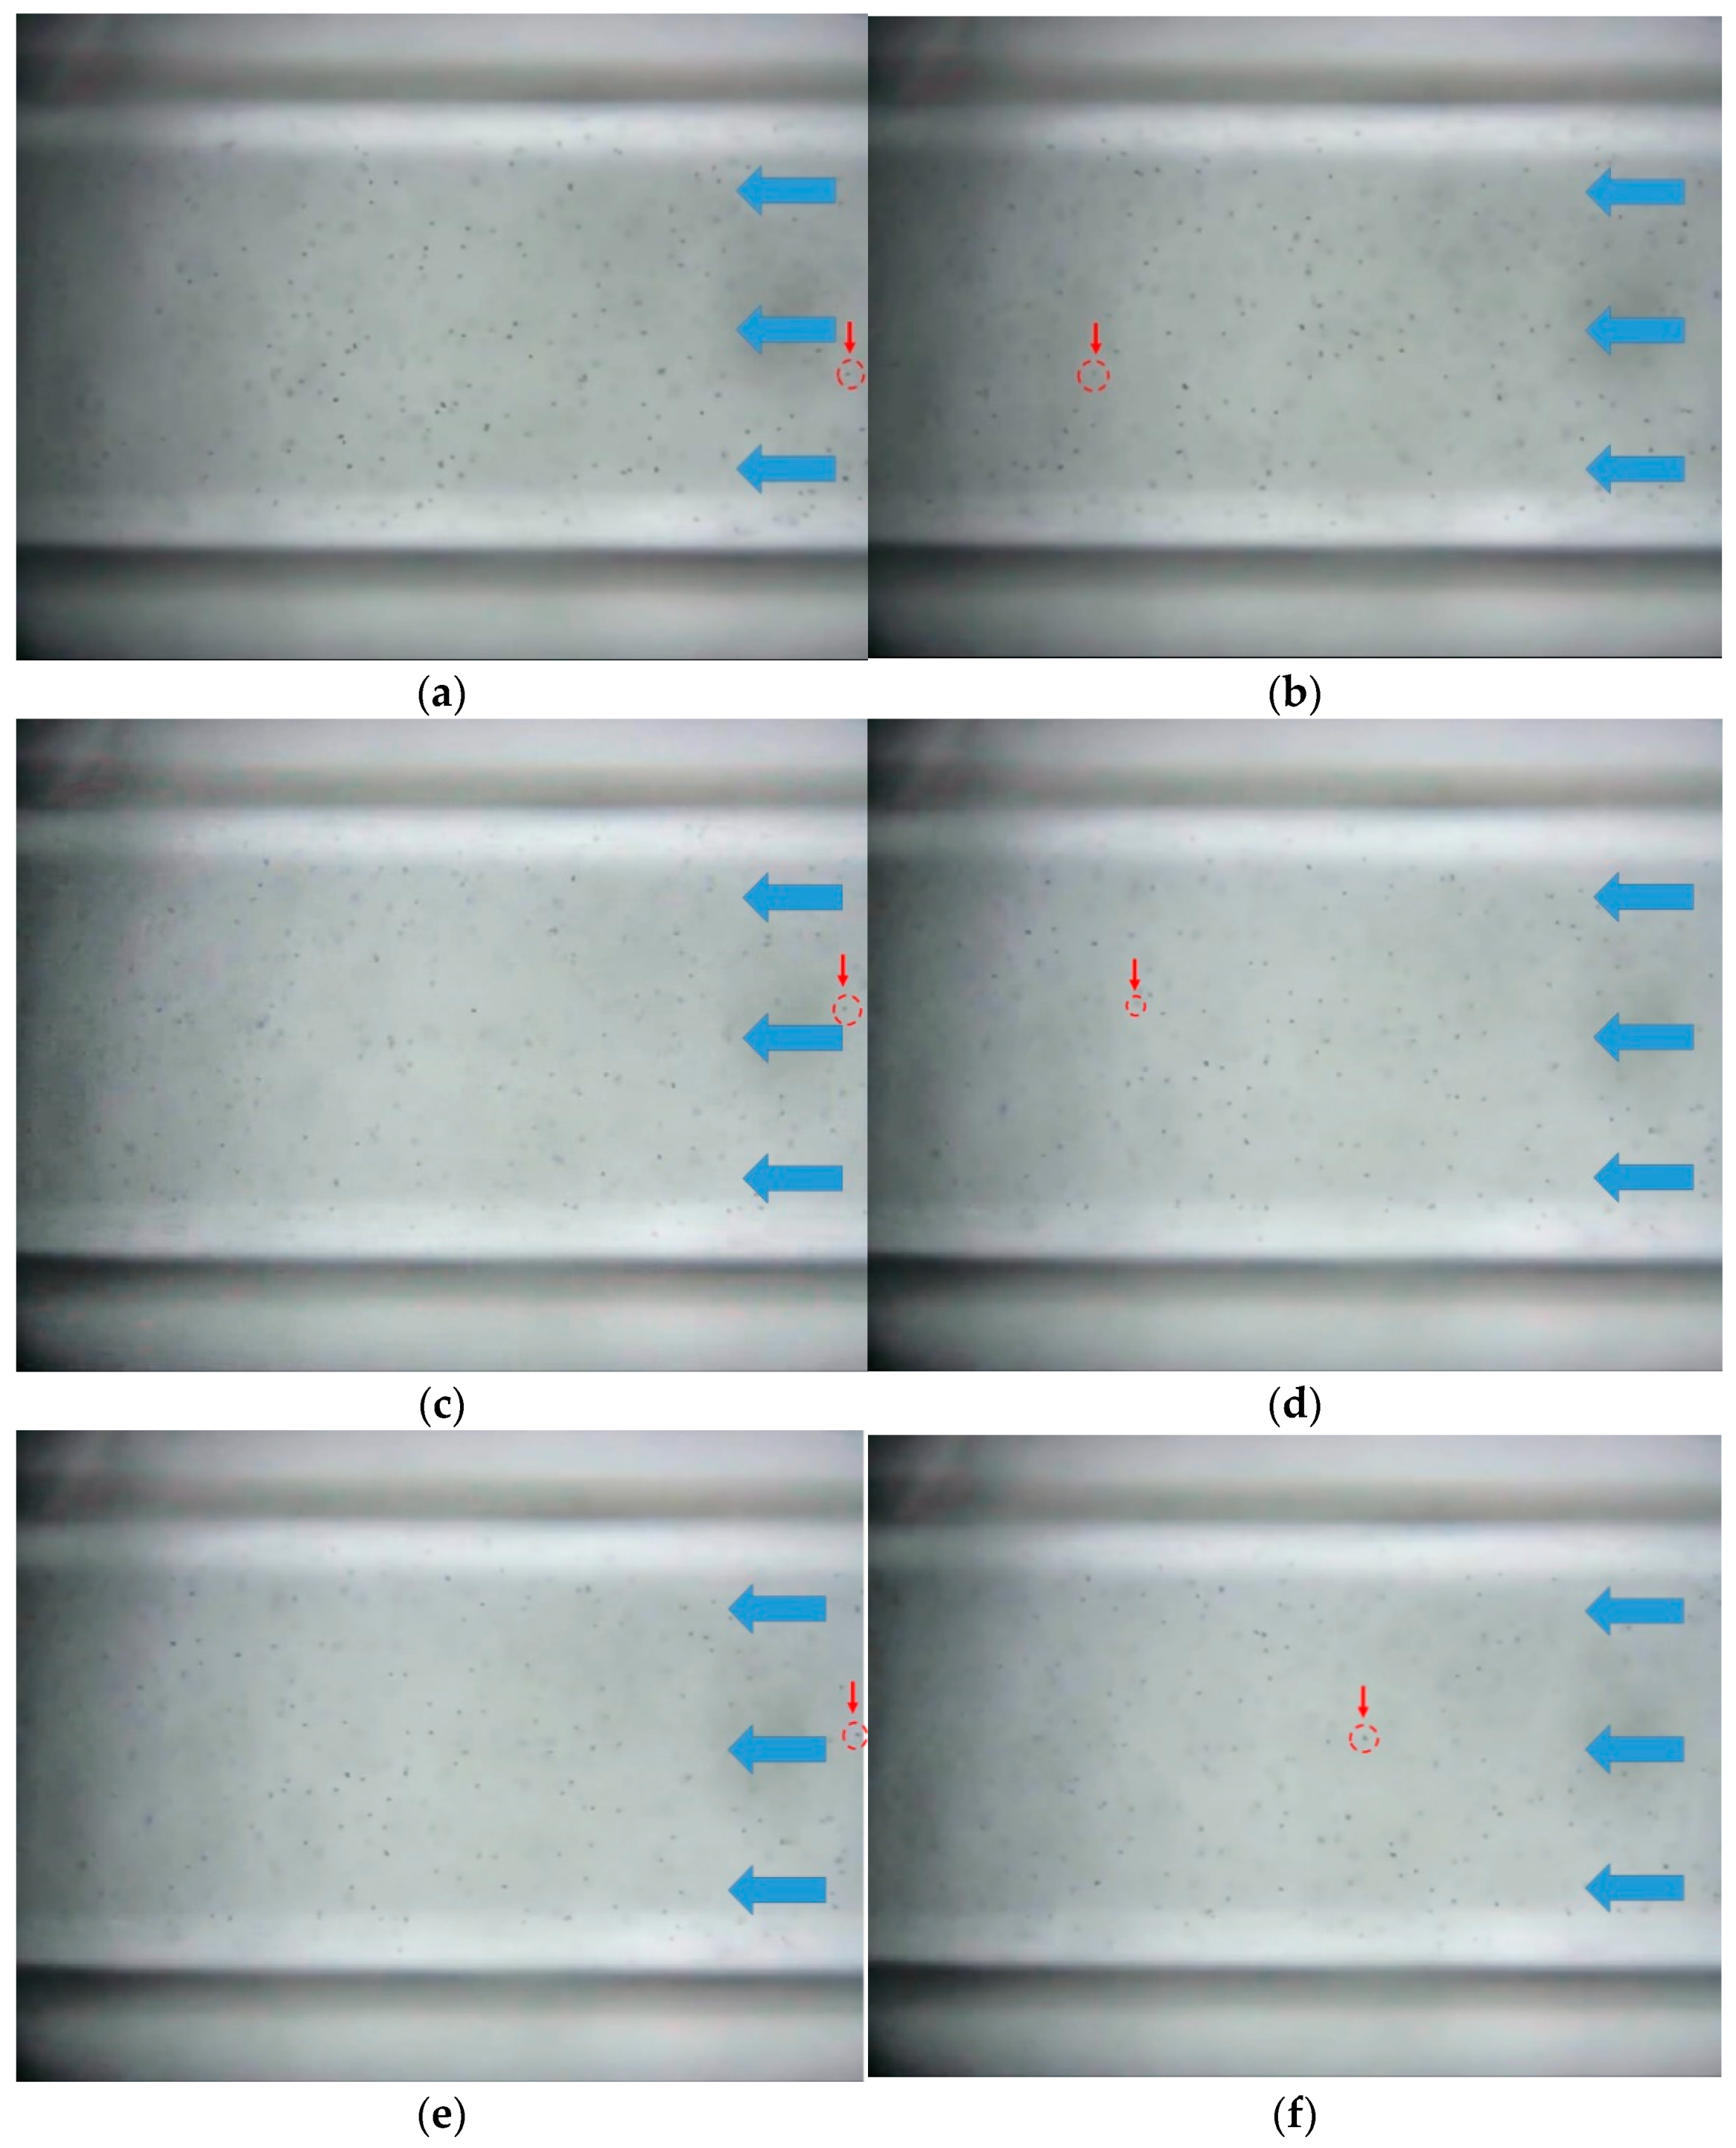
3.1. Microfluidic Flow Characteristic

This test observed microfluidic flow characteristics for heavy metal copper contaminants.

3.1.1. pH 4

Figure 5 is the result of observation of the flow characteristics of copper contaminants under the condition of pH 4. After the start of the experiment, movement over time was observed based on the microparticles (red circle) at the far right of the screen. As a result of observing the moving distance by selecting three microparticles, it was confirmed that the microparticles moved to an average of 4 μm/s. Figure 6 and Figure 7 represent the moving distances of the side and center at the middle position in the capillary tube, and it was confirmed that the side surface was about 11 μm/s and the center was about 25 μm/s. In other words, it was found that the central center of the capillary tube moved rapidly.

3.1.2. pH 6

The flow velocity was measured in the same way as pH 4 in Section 3.1.1. As a result of observing the movement of three particles over time after the start of the experiment, it was found that the movement distance of the microparticles slightly decreased compared to the case of pH 4. In the capillary tube side of center and middle of center, the travel distance of the central side of the capillary tube is about 10 μm/s and the center is about 21 μm/s, which is slower than pH 4. In addition, the capillary tube bottom confirmed that the movement distance of microparticles at the bottom was about 3 μm/s.

3.1.3. pH 8

The flow velocity was measured in the same way as pH 4 in Section 3.1.1. The moving distance of the microparticles at the bottom was confirmed to be about 2 μm/s, and the side and center of the central part in the capillary tube were about 11μm/s and about 25 μm/s.

3.1.4. pH 10

The flow velocity was measured in the same way as pH 4 in Section 3.1.1. The moving distance of microparticles at the bottom was confirmed to be about 1 μm/s, and the side and center of the central part in the capillary tube were about 9 μm/s and about 17 μm/s. These results indicate a tendency for the distance traveled to decrease as pH increases.

3.2. Microfluid Flow Moving Distance

The following Figure 8 shows the moving distance over time according to pH for microparticles on the capillary tube. In the bottom part, it moved at the slowest speed of 1~4 μm/s, and it was confirmed that the influence on the microfluid flow was small at the rest of the pH except for pH 10 in the center part. There was little effect at pH 4–8, and it was confirmed that the flow rate decreased at pH 10. As a result, it is confirmed that if the hydrophobic coating is applied under high pH conditions, the flow rate of heavy metal contaminants can be controlled.

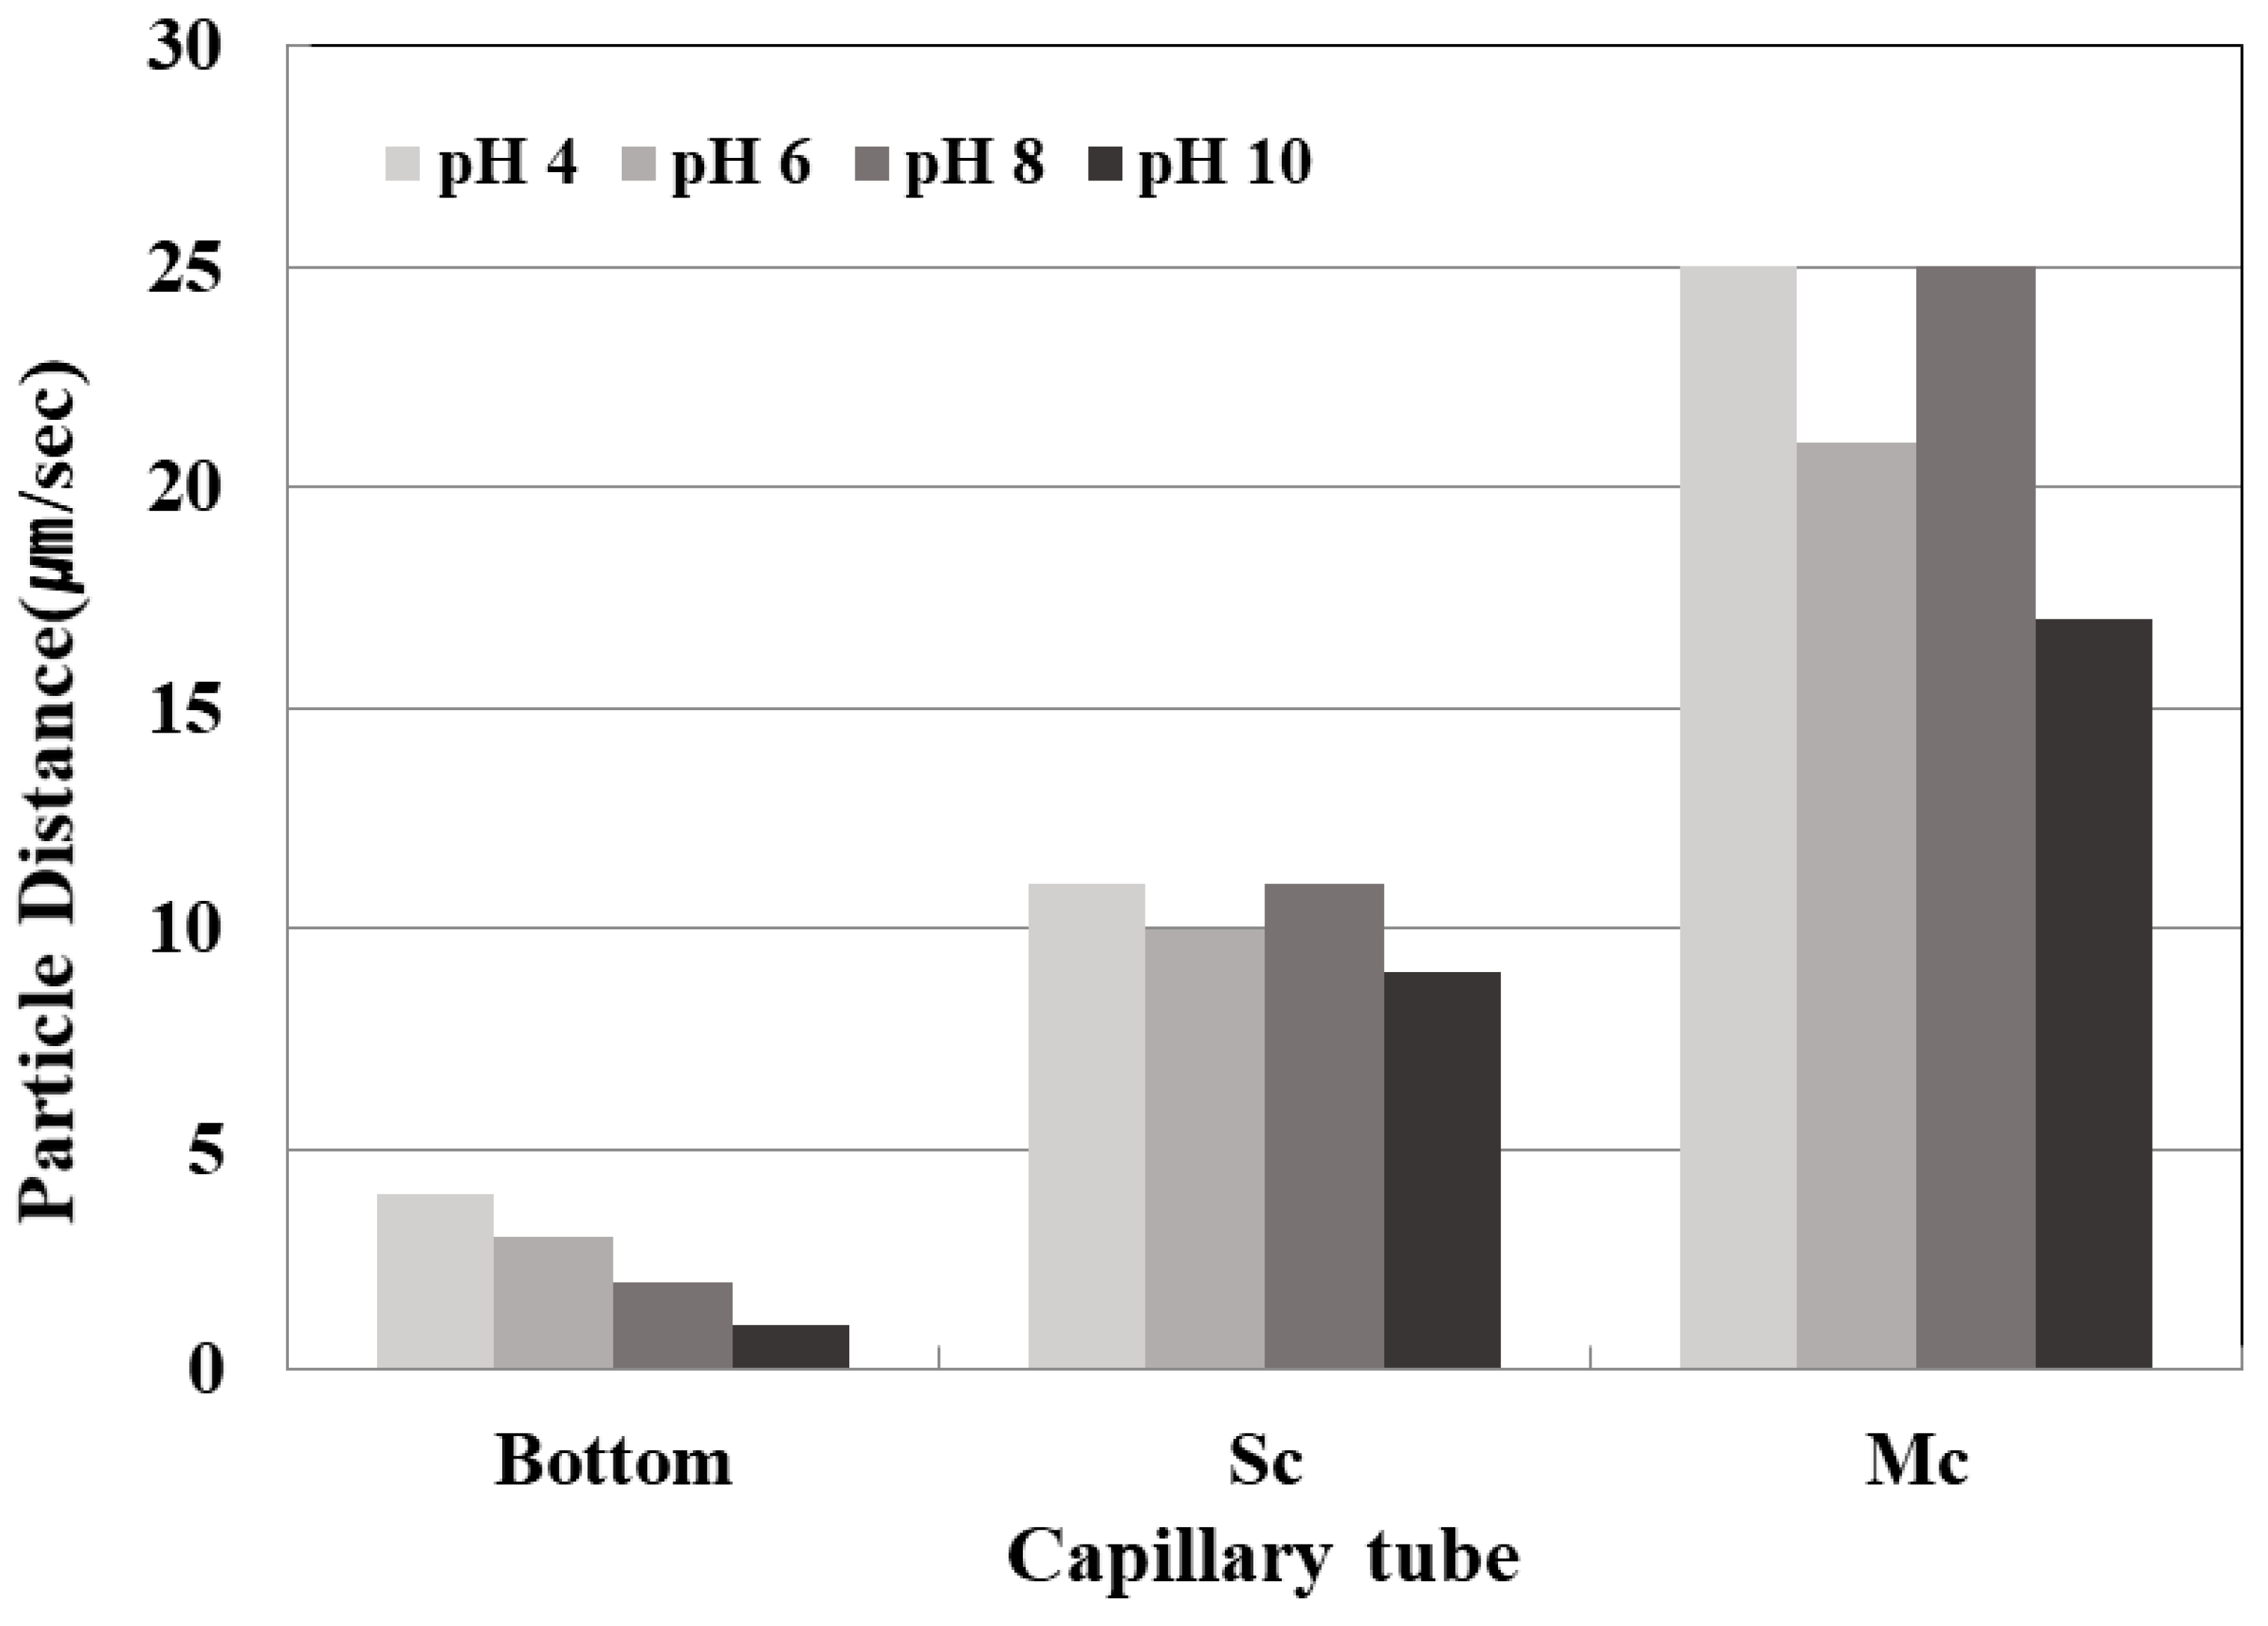
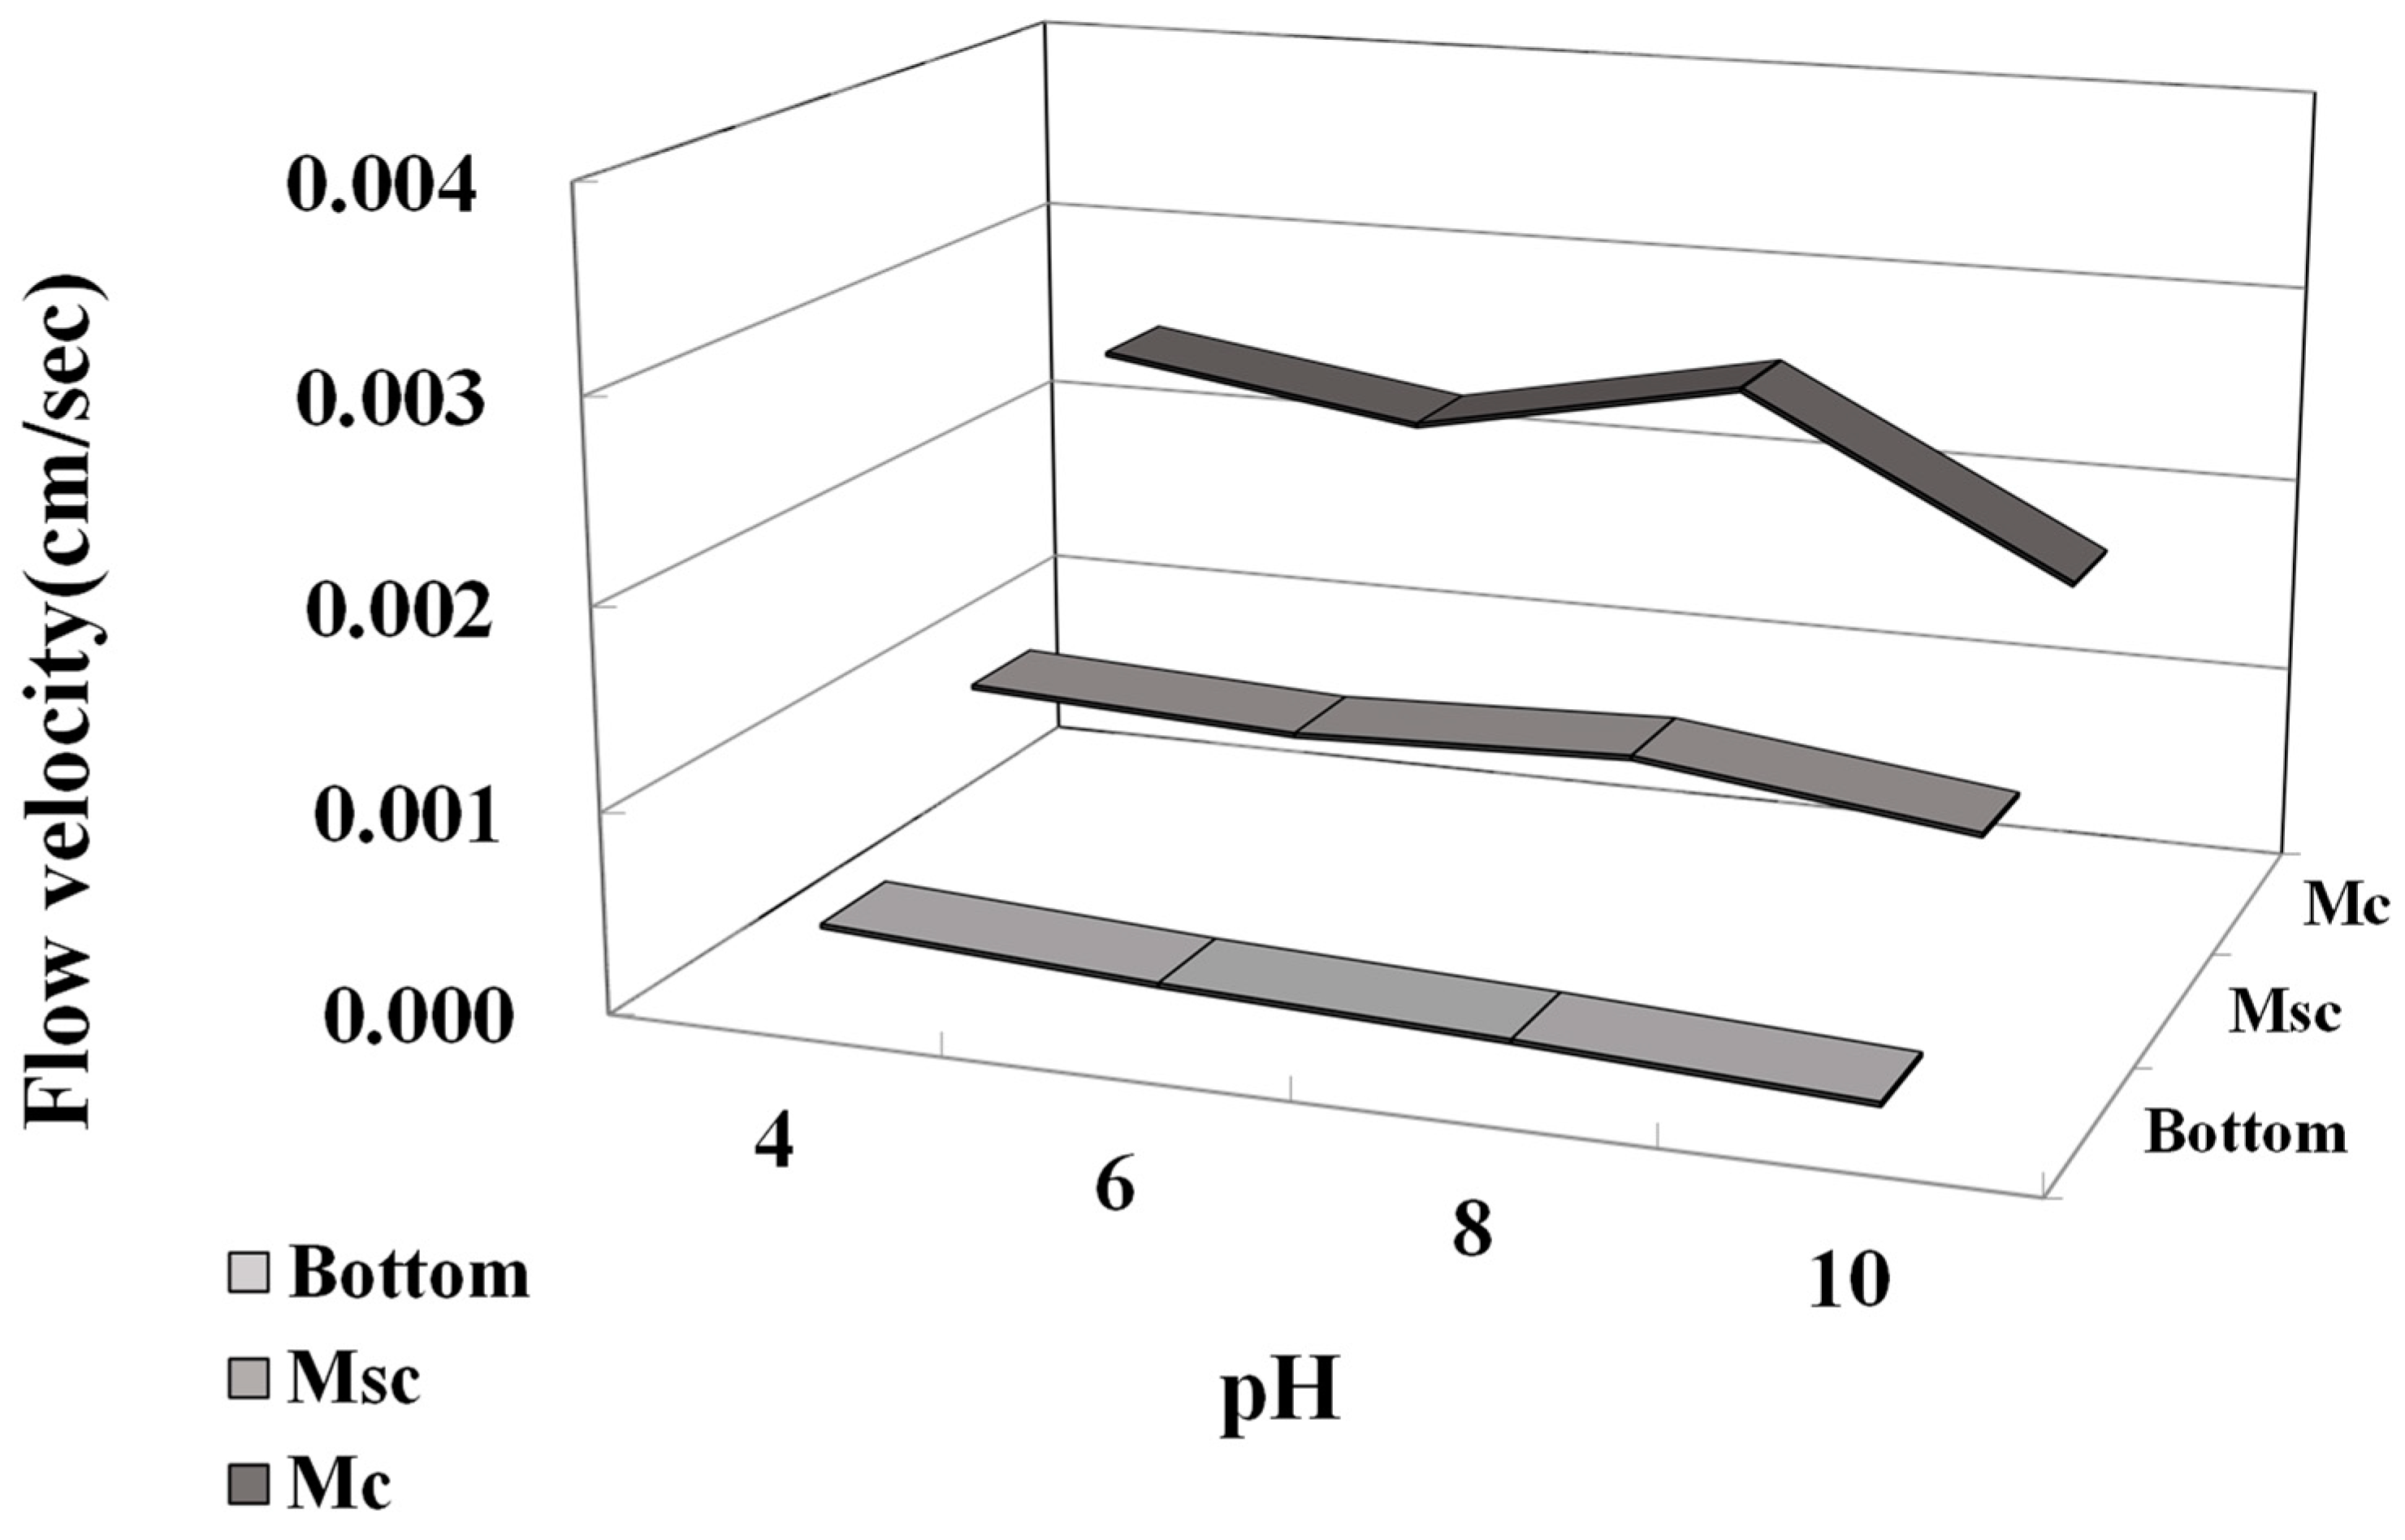
3.3. Microparticle Flow Velocity

The results of the analysis of flow characteristics for the bottom and central sides/centers of Capillary tubes for copper contaminants are shown in Figure 9. The flow rate at the bottom of the capillary tube was about 1.0 × 10⁻⁴ cm/s, which is slower than the inflow rate of 1.0 × 10⁻³ cm/s, and the flow rate at the center was analyzed to be 1.0 × 10⁻³ cm/s similar to the inflow rate. In addition, it was analyzed that the flow rate from the center to the center appeared somewhat faster than the side. When copper contaminants pass through the filter, it was revealed that the inflow of contaminants could be controlled depending on whether the surface’s hydrophobic properties persist.

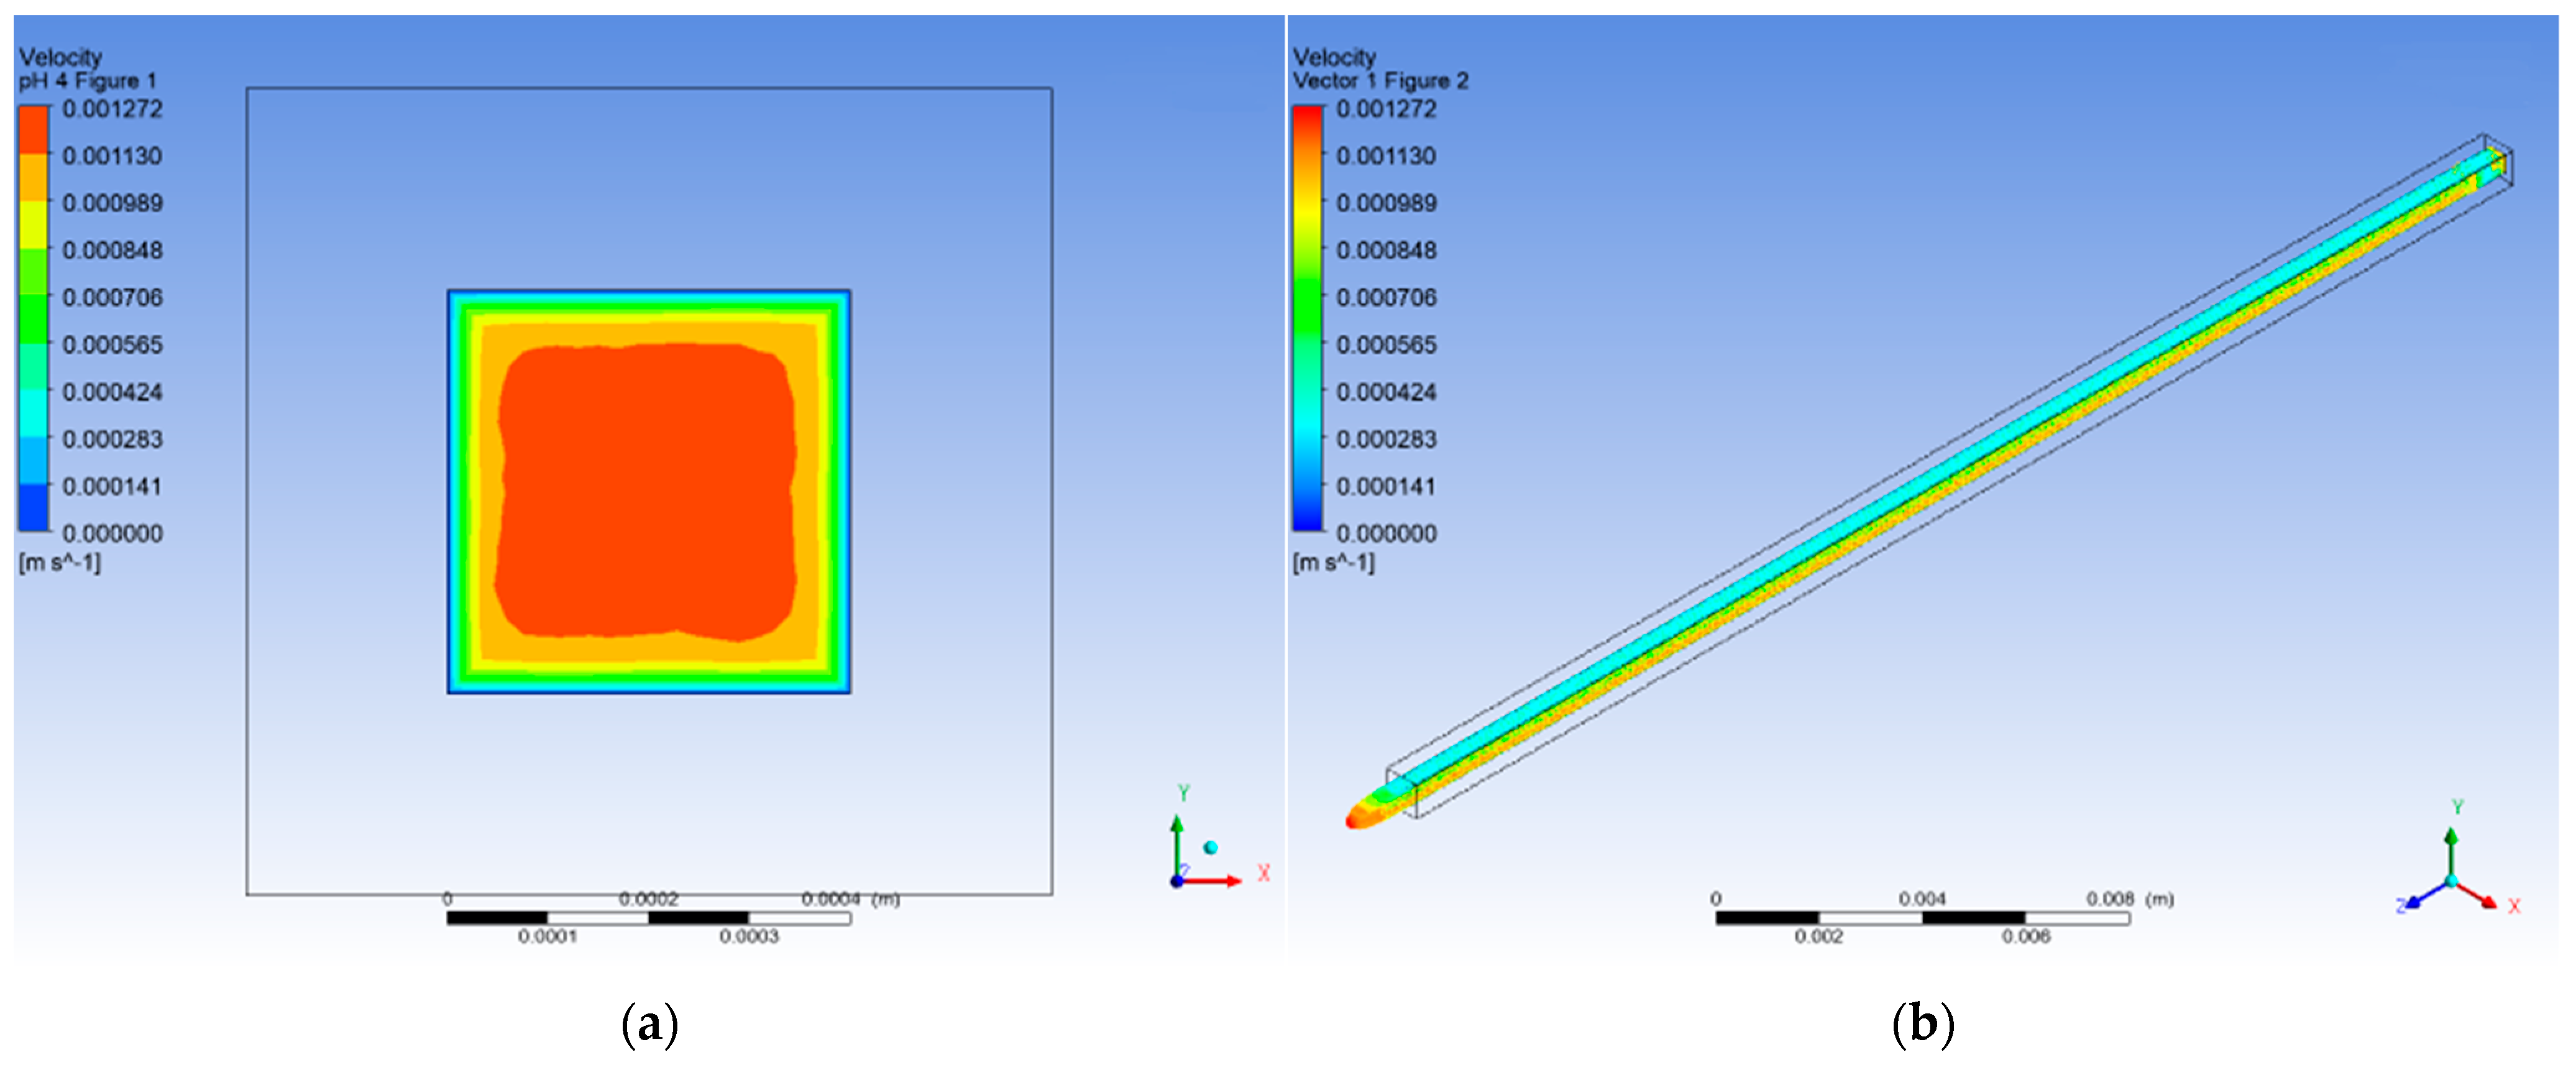
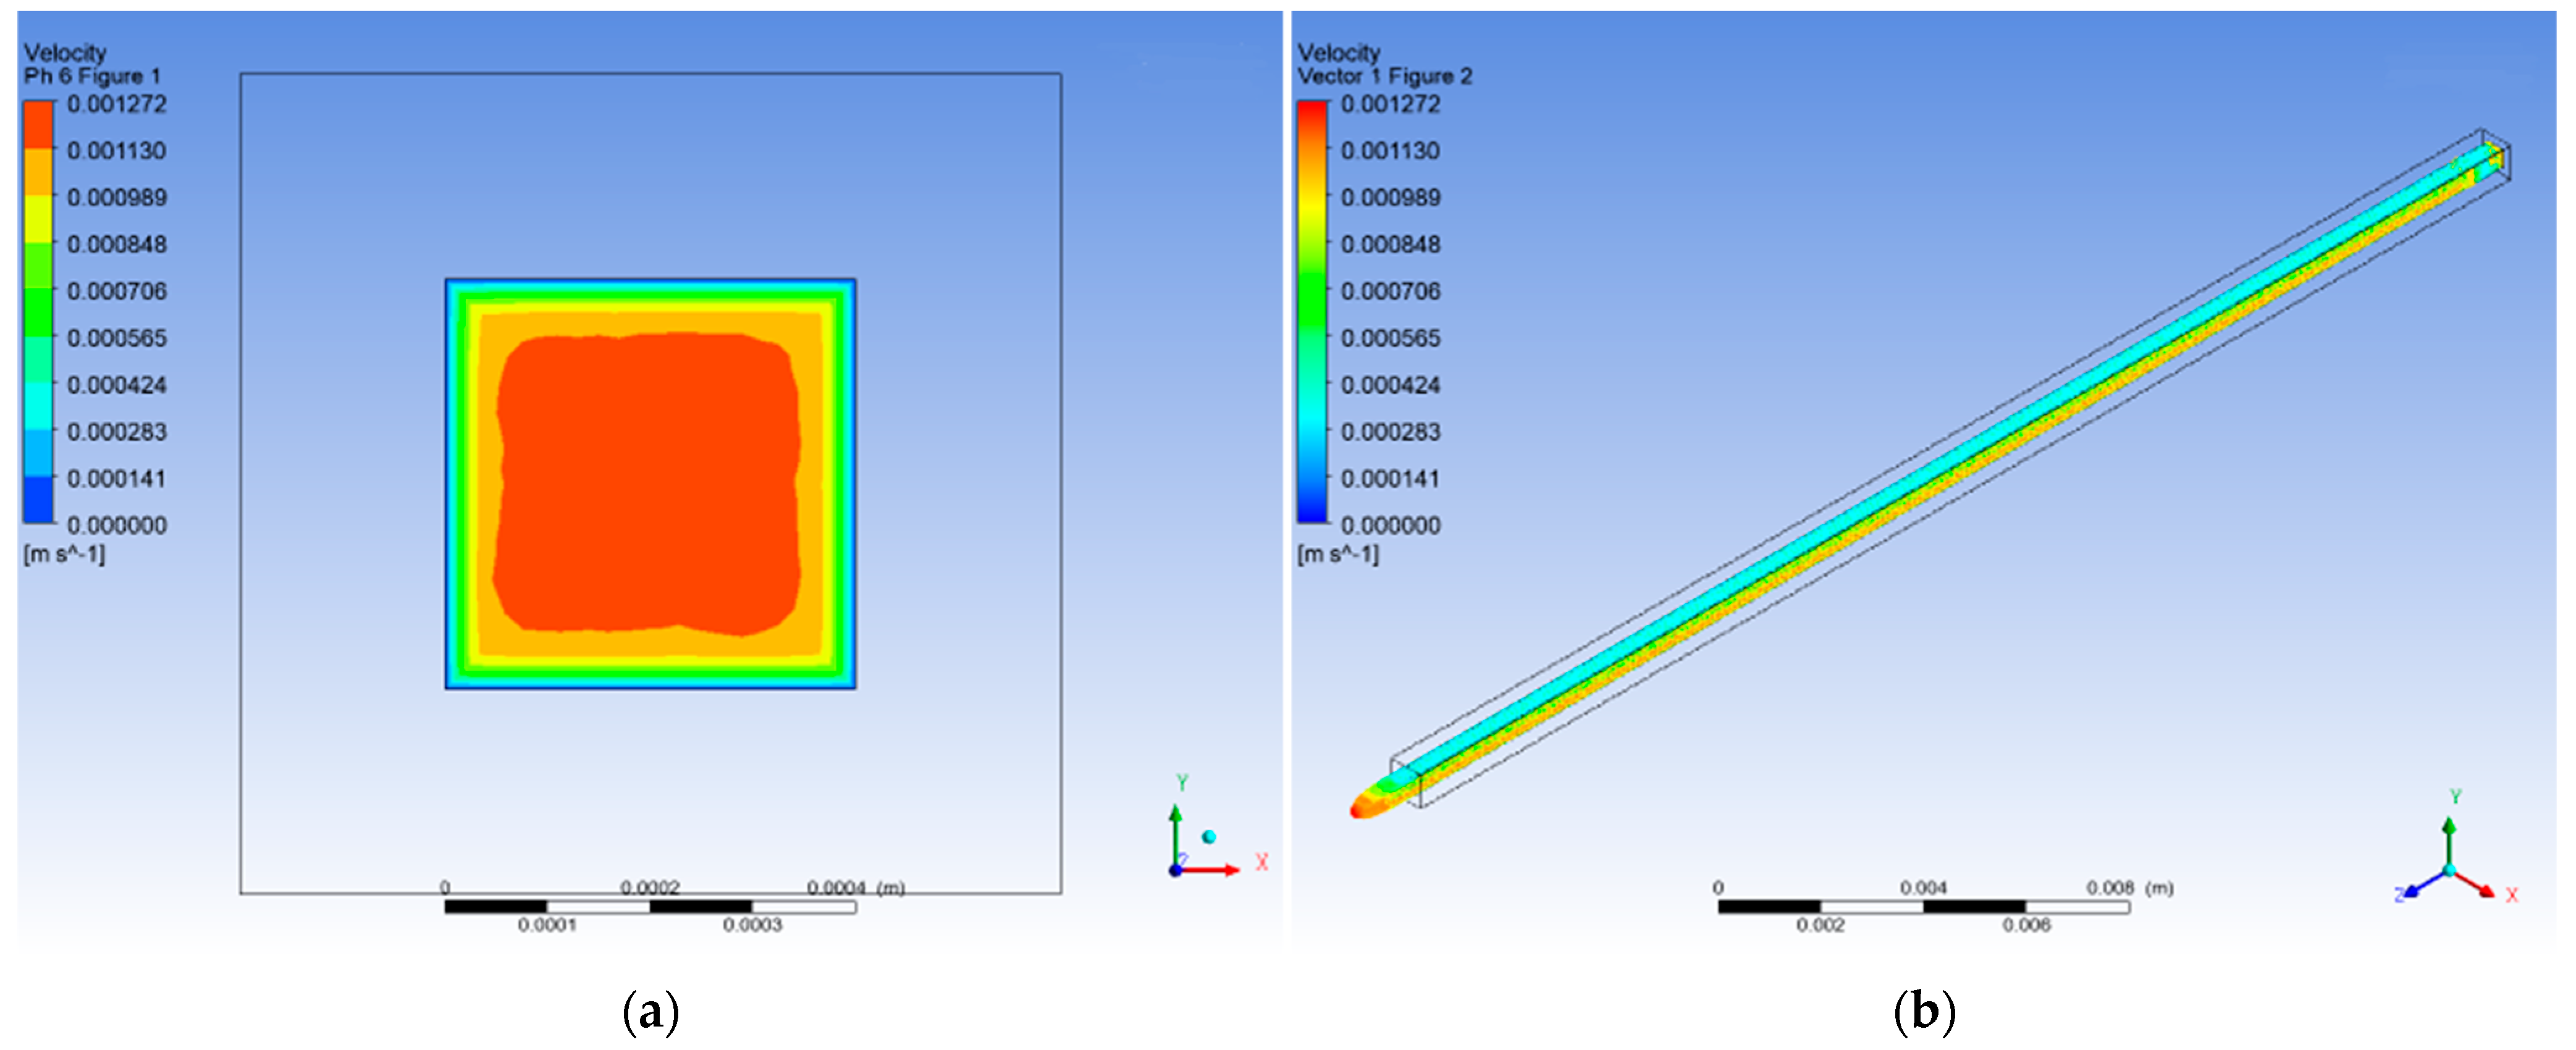
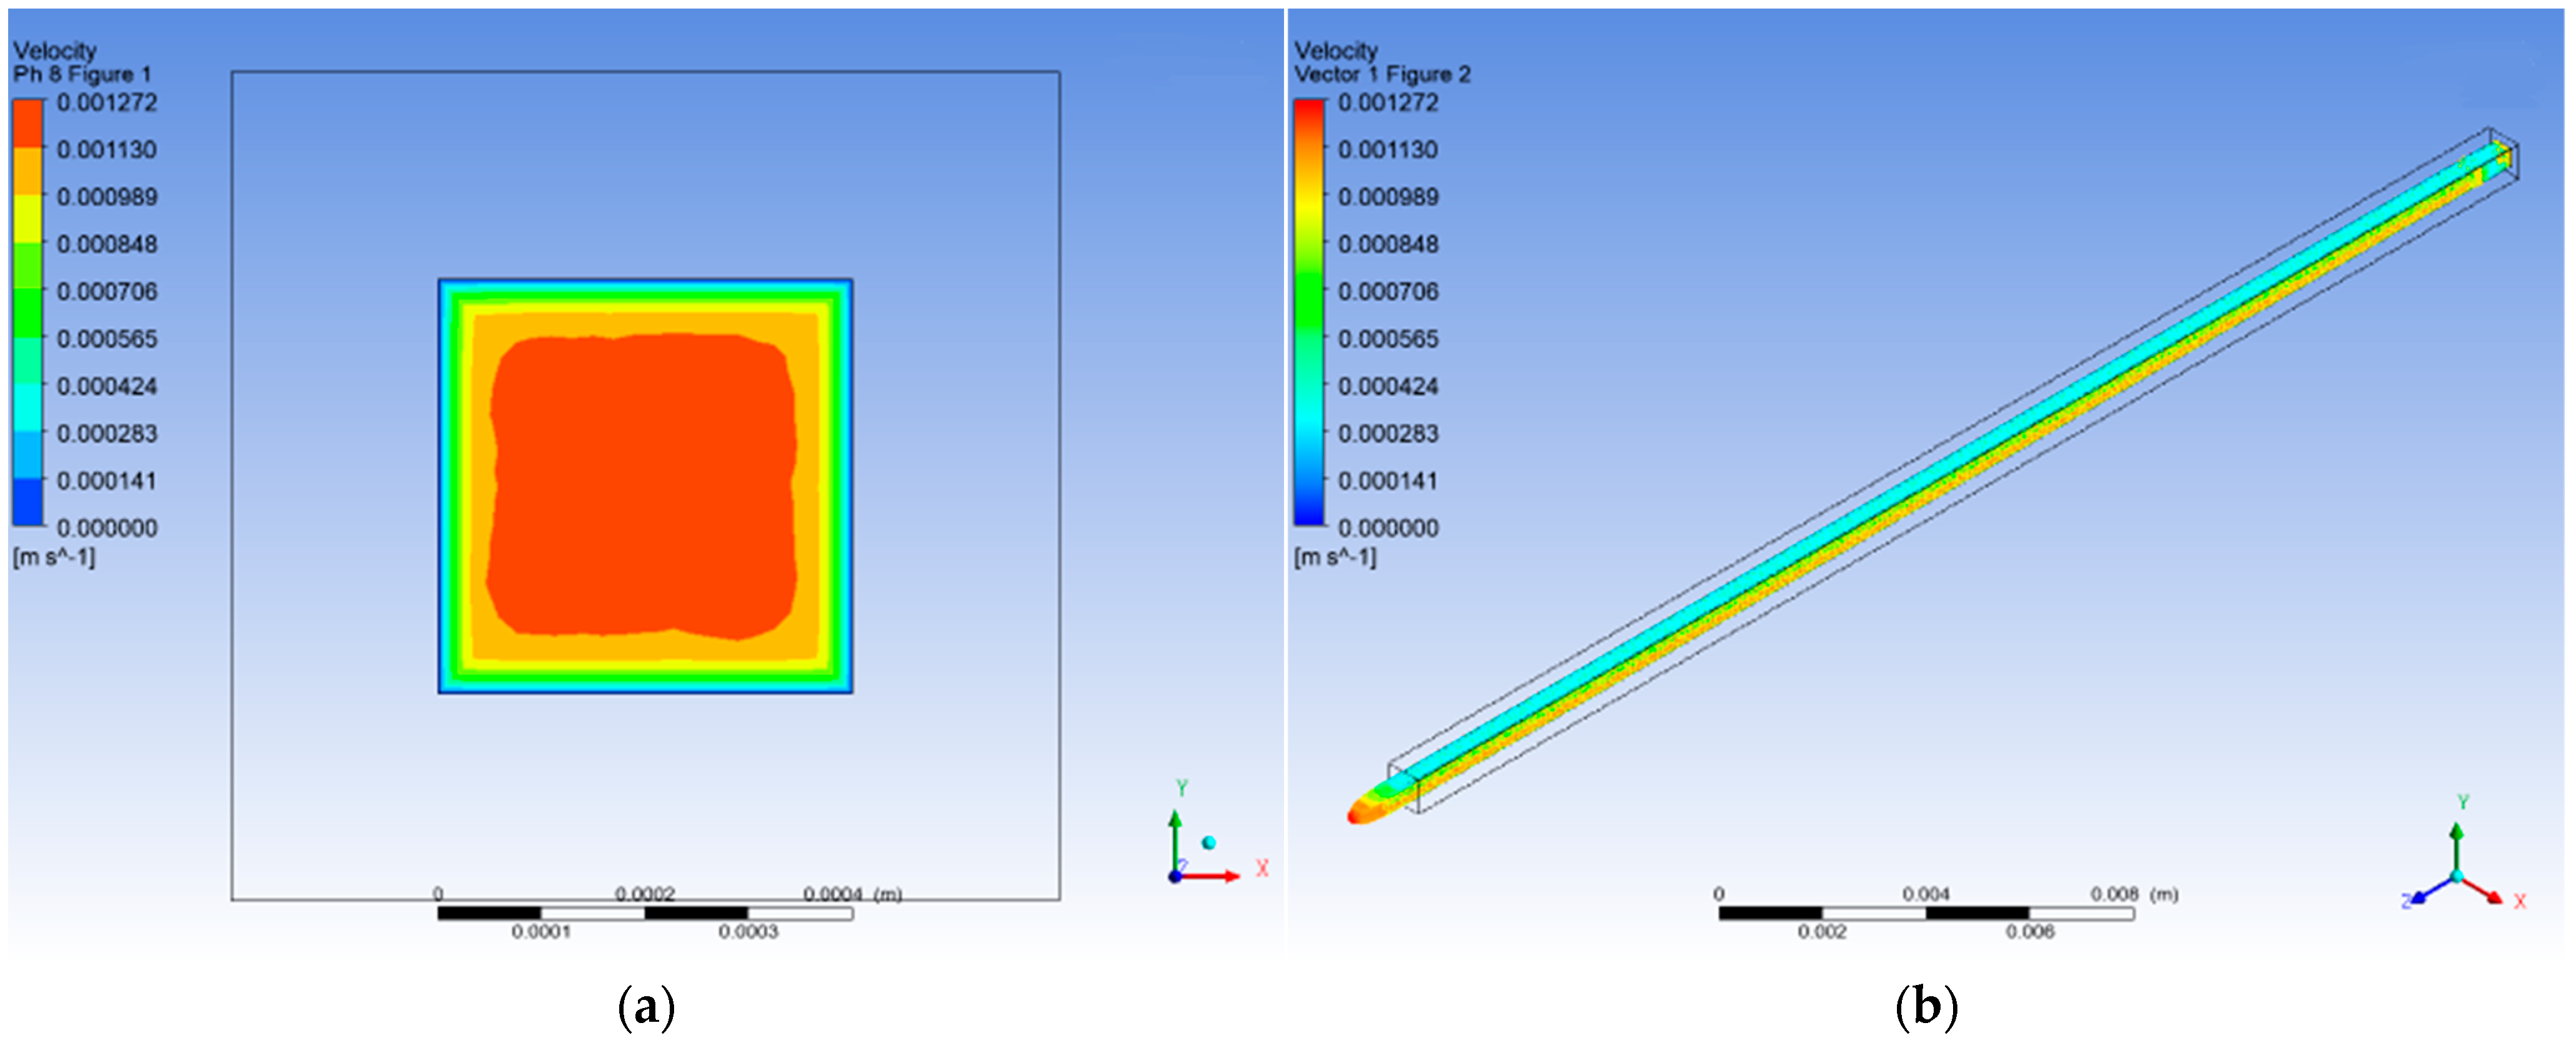
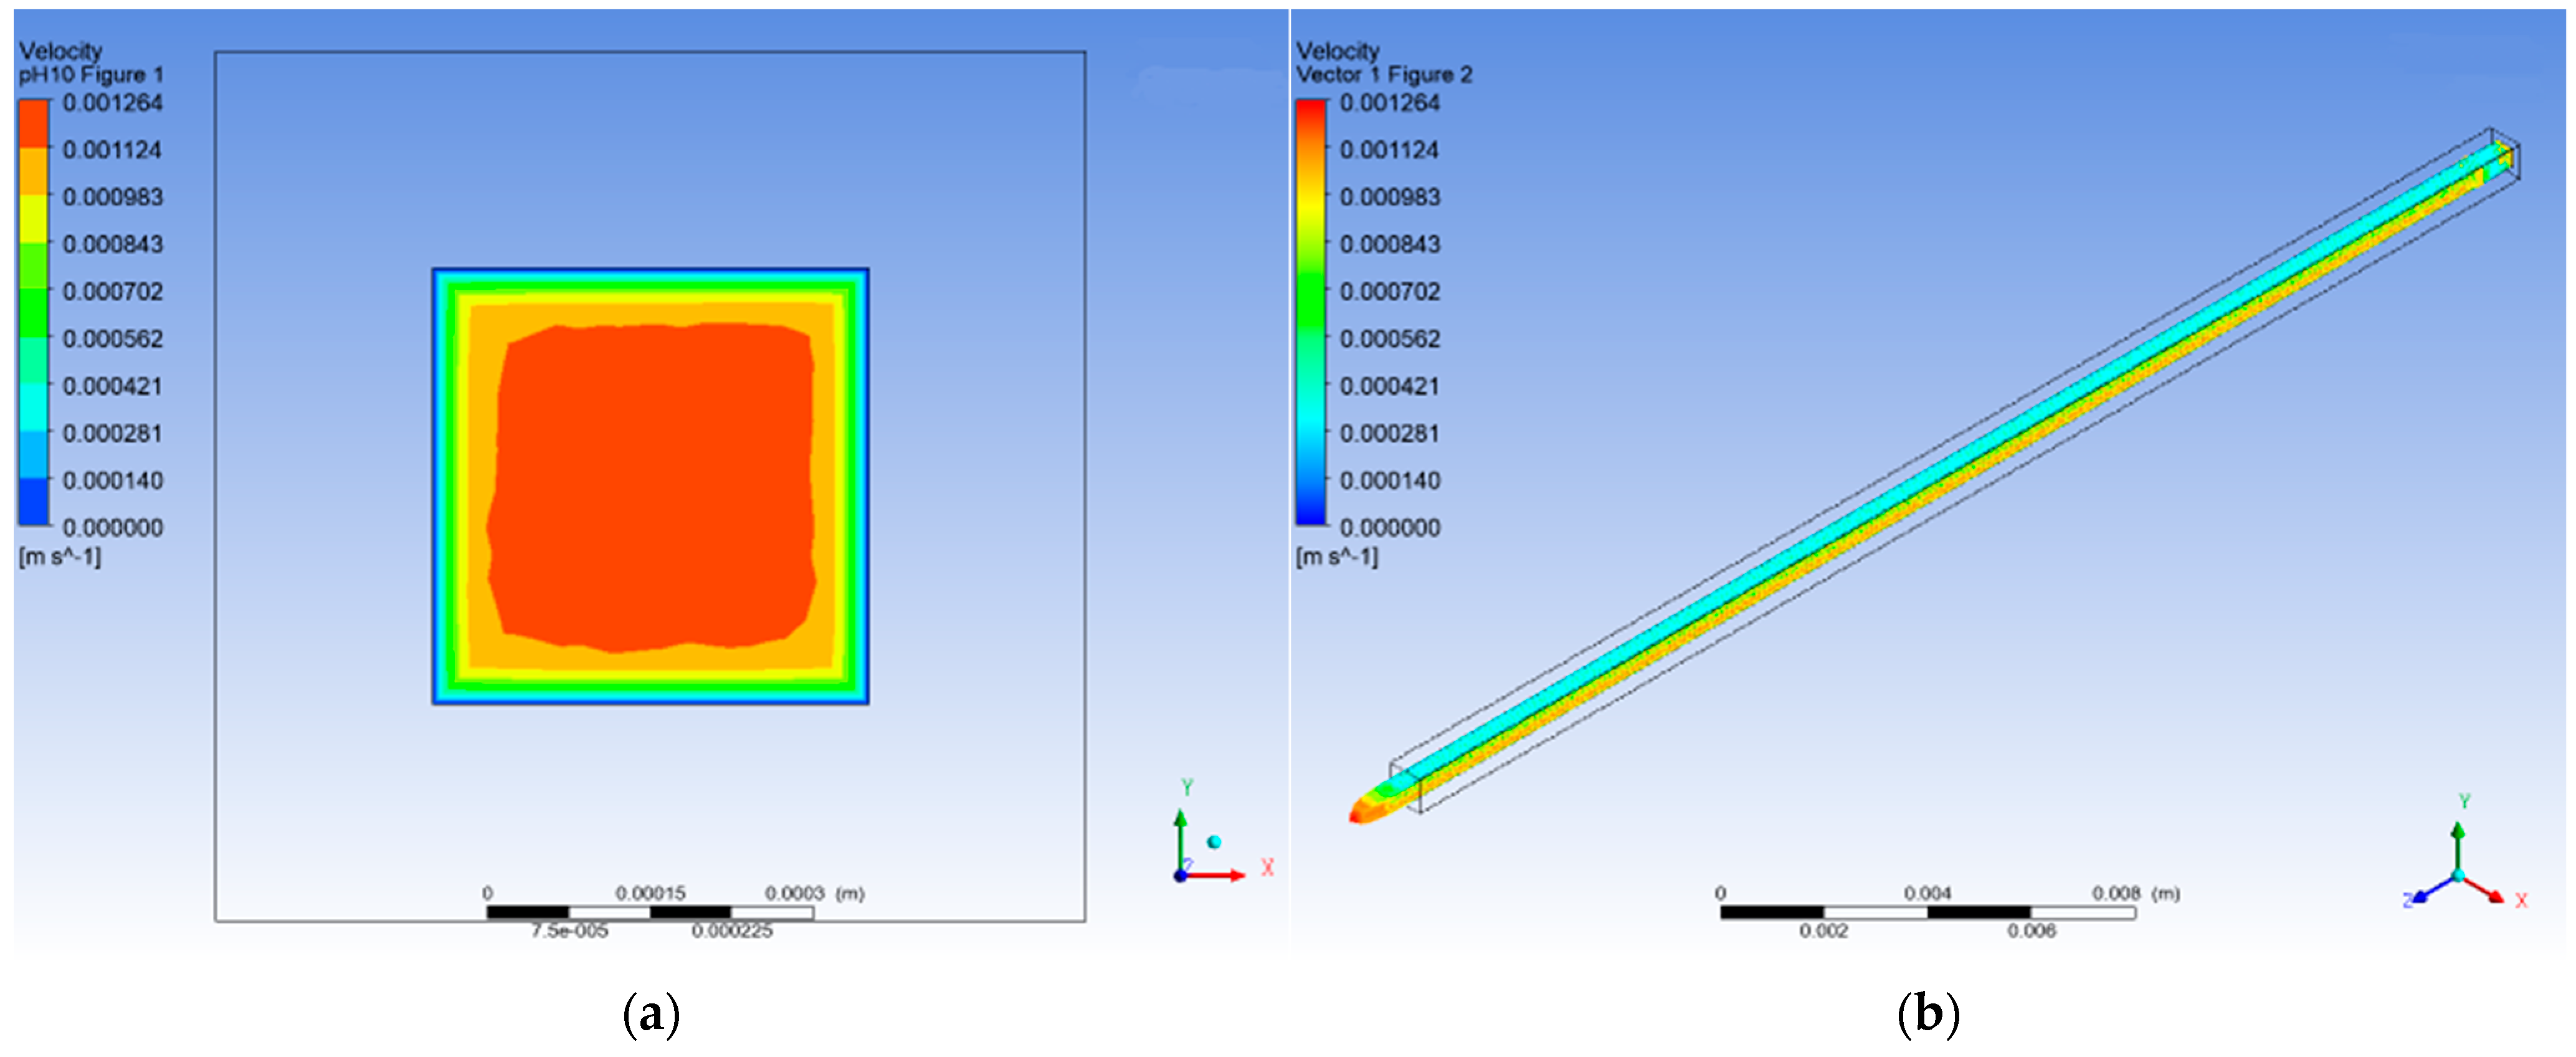
3.4. CFD Numerical Analysis

In the hydrophobic coated square capillary tube, the microfluidic flow according to the pH did not change at pH 4, pH 6 and pH 8, and it was confirmed that the speed decreased slightly at pH 10. Table 3 shows the flow rate at the center, which is the fastest among the speeds in the capillary tube among numerical analysis results, and it is possible to confirm the flow rate slower than the experimental results. The following Figure 10, Figure 11, Figure 12 and Figure 13 show the result of numerical analysis of flow velocity and vector of square capillary tube through numerical analysis.
The numerical analysis shows that there was no change in velocity at pH 4, pH 6 and pH 8, and that there was a small decrease in velocity at pH 10, but the difference between the actual flow rate and the actual flow rate was confirmed to be caused by pH. Based on the experimental results, the velocity coefficient was presented. At this time, the diffusion coefficient was calculated by regression analysis of the flow rate measured for the copper contaminant and expressed in the rate coefficient Equations 1 to 3 according to the pH.
v b = 0.0005 e 0.335 p H
v s c = 0.0013 e 0.115 p H
v m c = 0.0031 e 0.192 p H
Here, v b : velocity coefficient at the bottom of the capillary tube, v s c : velocity coefficient at the central side of the capillary tube, v m c : speed factor at the center of the capillary tube, and pH: pH of heavy metal contaminants are shown.

4. Conclusions

In this study, a microfluidic flow experiment was performed to apply a hydrophilic hydrophobic filter for selective remediation of heavy metal copper contaminated ground. Accordingly, the summary of the results of this study is as follows.
(1)
As a result of microfluidic flow experiments for heavy copper metal contaminants, it was confirmed that the movement of contaminants was small in locations where the influence of hydrophobic properties was large. This means that hydrophobic surfaces can slow down the flow of hydrophilic heavy metal contaminants.
(2)
The analysis of the flow rate according to each experimental condition confirmed that the change in flow rate of pH conditions was an influential factor. It was confirmed that the flow rate increased as the pH was more basic, and it was confirmed that the hydrophobic properties slightly decreased under basic conditions.
(3)
Numerical analysis was performed by applying the contact angle, which is a hydrophobic characteristic, however, it was difficult to compare and analyze through CFD analysis. Based on the flow rate according to pH as a result of the experiment, the velocity coefficient was proposed through regression analysis. Using the velocity coefficient, it is determined that the flow rate according to pH on a hydrophobic coated surface can be determined.
In this study, it was confirmed that heavy metal contaminants were slowed down through hydrophobic coating. Through additional laboratory and filed tests, selective remediation is possible in the ground contaminated with heavy metals and organic.

Author Contributions

Conceptualization, J.-G.H. and G.H.; methodology, J.-G.H. and G.H.; validation, J.-G.H., J.-Y.L. and G.H.; formal analysis, D.J. and D.K.; investigation, D.J., J.-Y.L. and D.K.; resources, J.-G.H., J.-Y.L. and G.H.; data curation, D.J. and D.K.; writing—original draft preparation, D.J. and D.K.; writing—review and editing, J.-G.H., D.J., J.-Y.L., D.K. and G.H.; visualization, J.-G.H., D.J., D.K. and G.H.; supervision, J.-G.H., J.-Y.L. and G.H.; project administration, D.J. and D.K. All authors have read and agreed to the published version of the manuscript.

Funding

This research was supported by the Chung-Ang University Research Scholarship Grants in 2011 and a grant from the National Research Foundation (NRF) of Korea, funded by the Korea government (MSIP) (NRF-2019R1A2C2088962).

Institutional Review Board Statement

Not applicable.

Informed Consent Statement

Not applicable.

Data Availability Statement

Data presented in this study are available on request from the corresponding author. The data are not publicly available due to data that are also part of an ongoing study.

Acknowledgments

This research was supported by the Chung-Ang University Research Scholarship Grants in 2011 and a grant from the National Research Foundation (NRF) of Korea, funded by the Korea government (MSIP) (NRF-2019R1A2C2088962).

Conflicts of Interest

The authors declare no conflict of interest.

References

  1. Foley, J.A.; Ramankutty, N.; Brauman, K.A.; Cassidy, E.S.; Gerber, J.S.; Johnston, M.; Mueller, N.D.; O’Connell, C.; Ray, D.K.; West, P.C.; et al. Solutions for a cultivated planet. Nature 2011, 478, 337–342. [Google Scholar] [CrossRef] [PubMed] [Green Version]
  2. Xu, J.; Liu, C.; Hsu, P.C.; Zhao, J.; Wu, T.; Tang, J.; Liu, K.; Cui, Y. Remediation of heavy metal contaminated soil by asymmetrical alternating current electrochemistry. Nat. Commun. 2019, 10, 1–8. [Google Scholar] [CrossRef] [PubMed] [Green Version]
  3. Bo, S.; Luo, J.; An, Q.; Xiao, Z.; Wang, H.; Cai, W.; Zhai, S.; Li, Z. Efficiently se-lective adsorption of Pb(II) with functionalized alginate-based adsorbent inbatch/column systems: Mechanism and application simulation. J. Clean. Prod. 2020, 250, 119585. [Google Scholar] [CrossRef]
  4. Adriano, D.C.; Wenzel, W.W.; Vangronsveld, J.; Bolan, N.S. Role of assisted natural remediation in environmental cleanup. Geoderma 2004, 112, 121–142. [Google Scholar] [CrossRef]
  5. Amundson, R.; Berhe, A.A.; Hopmans, J.W.; Olson, C.; Sztein, A.E.; Sparks, D.L. Soil and human security in the 21st century. Science 2015, 348, 1261071. [Google Scholar] [CrossRef] [PubMed] [Green Version]
  6. Liu, L.; Li, W.; Song, W.; Guo, M. Remediation techniques for heavy metal-contaminated soils: Principles and applicability. Sci. Total Environ. 2018, 633, 206–219. [Google Scholar] [CrossRef] [PubMed]
  7. Park, K.O. A Study on Soil Washing Efficiency of Copper(Cu) Contaminated Soil in Military Rifle Range Site. Master’s Thesis, Kyungpook National University Graduate School of Industry, Daegu, Korea, 2013. [Google Scholar]
  8. Chen, R.; Sherbinin, A.D.E.; Ye, C.; Shi, G. China’s soil pollution: Farms on the frontline. Science 2014, 344, 691. [Google Scholar] [CrossRef] [PubMed]
  9. Yang, H. China’s soil plan needs strong support. Nature 2016, 536, 375. [Google Scholar] [CrossRef] [PubMed] [Green Version]
  10. Liu, B.L.; Ai, S.W.; Zhang, W.Y.; Huang, D.J.; Zhang, Y.M. Assessment of the bioavailability, bioaccessibility and transfer of heavy metals in the soil-grain-human systems near a mining and smelting area in NW China. Sci. Total Environ. 2017, 609, 52–60. [Google Scholar] [CrossRef] [PubMed]
  11. Fei, X.F.; Christakos, G.; Xiao, R.; Ren, Z.Q.; Liu, Y.; Lv, X.N. Improved heavy metal mapping and pollution source apportionment in Shanghai City soils using auxiliary information. Sci. Total Environ. 2019, 661, 168–177. [Google Scholar] [CrossRef] [PubMed]
  12. Rui, D.; Wu, Z.; Ji, M.; Liu, J.; Wang, S.; Ito, Y. Remediation of Cd- and Pbcontaminated clay soils through combined freeze-thaw and soil washing. J. Hazard. Mater. 2019, 369, 87–95. [Google Scholar] [CrossRef] [PubMed] [Green Version]
  13. Tao, Y.; Huang, H.; Zhang, H. Remediation of Cu-phenanthrene co-contaminated soil by soil washing and subsequent photoelectrochemical process in presence of persulfate. J. Hazard. Mater. 2020, 400, 123111. [Google Scholar] [CrossRef] [PubMed]
  14. Trellu, C.; Pechaud, Y.; Oturan, N.; Mousset, E.; van Hullebusch, E.D.; Huguenot, D.; Oturan, M.A. Remediation of soils contaminated by hydrophobic organic compounds: How to recover extracting agents from soil washing solutions? J. Hazard. Mater. 2021, 404, 124137. [Google Scholar] [CrossRef] [PubMed]
  15. Shin, E.C.; Lee, M.S.; Park, J.J. A Study on the Numerical Analysis for Soil Contamination Prediction in Incheon Area. J. Korea Geosynth. Soc. 2012, 11, 21–30. [Google Scholar] [CrossRef]
  16. Song, B.; Zeng, G.; Gong, J.; Liang, J.; Xu, P.; Liu, Z.; Zhang, Y.; Zhang, C.; Cheng, M.; Liu, Y.; et al. Evaluation methods for assessing effectiveness of in situ remediation of soil and sediment contaminated with organic pollutants and heavy metals. Environ. Int. 2017, 105, 43–55. [Google Scholar] [CrossRef] [PubMed]
  17. Kjeldsen, P.; Barlaz, M.A.; Rooker, A.P.; Baun, A.; Ledin, A.; Christensen, T.H. Present and long-term composition of MSW landfill leachate: A review. Crit. Rev. Environ. Sci. Technol. 2002, 32, 297–336. [Google Scholar] [CrossRef]
  18. Han, W.J.; Fu, F.L.; Cheng, Z.H.; Tang, B.; Wu, S.J. Studies on the optimum conditions using acid-washed zero-valent iron/aluminum mixtures in permeable reactive barriers for the removal of different heavy metal ions from wastewater. J. Hazard. Mater. 2016, 302, 437–446. [Google Scholar] [CrossRef] [PubMed]
  19. Han, Z.Y.; Ma, H.N.; Shi, G.Z.; He, L.; Wei, L.Y.; Shi, Q.Q. A review of groundwater contamination near municipal solid waste landfill sites in China. Sci. Total Environ. 2016, 569, 1255–1264. [Google Scholar] [CrossRef] [PubMed]
  20. You, J.H. Bio-Molecula Separation Using Nano Porous Membrane On-Chip. Master’s Thesis, Seoul National University Graduate School, Seoul, Korea, 2009. [Google Scholar]
  21. Kim, N.H. Fabrication and characterization of porous membrane foe high precision gas filter by in-situ reduction/sintering process. Ph.D. Thesis, Hanyang University, Seoul, Korea, 2010. [Google Scholar]
  22. Ministry of Environment. White Paper of Environment 2018; Ministry of Environment: Sejong-si, Korea, 2018.
Figure 1. Test equipment.
Applsci 11 04328 g001
Figure 2. Microparticles (×3000).
Applsci 11 04328 g002
Figure 3. Square capillary tube schematic and observation position.
Applsci 11 04328 g003
Figure 4. Capillary tube mesh: (a) Section 1; (b) Section 2.
Applsci 11 04328 g004
Figure 5. Experimental results of flow characteristics of copper contaminants–capillary tube bottom: (a) particle position before moving; (b) particle position after moving.
Applsci 11 04328 g005
Figure 6. Experimental results of flow characteristics of copper contaminants–capillary tube side of center: (a) Particle position before moving 1; (b) particle position after moving 1; (c) particle position before moving 2; (d) particle position after moving 2; (e) particle position before moving 3; (f) particle position after moving 3.
Applsci 11 04328 g006
Figure 7. Experimental results of flow characteristics of copper contaminants–capillary tube middle of center: (a) Particle position before moving 1; (b) particle position after moving 1; (c) particle position before moving 2; (d) particle position after moving 2; (e) particle position before moving 3; (f) particle position after moving 3.
Applsci 11 04328 g007
Figure 8. Micro particles distance (μm/s).
Applsci 11 04328 g008
Figure 9. Microparticle flow velocity (μm/s).
Applsci 11 04328 g009
Figure 10. CFD numerical analysis results (pH 4): (a) contour; (b) vector.
Applsci 11 04328 g010
Figure 11. CFD numerical analysis results (pH 6): (a) contour; (b) vector.
Applsci 11 04328 g011
Figure 12. CFD numerical analysis results (pH 8): (a) contour; (b) vector.
Applsci 11 04328 g012
Figure 13. CFD numerical analysis results (pH 10): (a) contour; (b) vector.
Applsci 11 04328 g013
Table 1. Microfluidic Flow Test Condition.
ClassificationTest Condition
PollutantsConcentration (ppm)Flow Velocity (cm/s)pH
Flow characteristic of pollutantsCopper60001.0 × 10−34, 6, 8, 10
Table 2. CFD properties.
Flow Rate
(cm/s)
Contract Angle
pH 4pH 6pH 8pH 10
1.0 × 10−3124°125°119°116°
Table 3. CFD analysis result.
pH
46810
Flow rate (cm/s)1.272 × 10−31.272 × 10−31.272 × 10−31.264 × 10−3
Publisher’s Note: MDPI stays neutral with regard to jurisdictional claims in published maps and institutional affiliations.

