Article

Long-Term Numerical Analysis of Subsurface Delamination Detection in Concrete Slabs via Infrared Thermography

by
Sandra Pozzer
1,*,
Francisco Dalla Rosa
2,
Zacarias Martin Chamberlain Pravia
2,
Ehsan Rezazadeh Azar
3 and
Xavier Maldague
1
1
Department of Electrical and Computer Engineering, Laval University, 1065, Av., de la Médecine, Quebec, QC G1V 0A6, Canada
2
Department of Civil Engineering, University of Passo Fundo, BR 285, Passo Fundo 99052-900, Rio Grande do Sul, Brazil
3
Department of Civil Engineering, Lakehead University, 955, Oliver Road, Thunder Bay, ON P7B 5E1, Canada
*
Author to whom correspondence should be addressed.
Appl. Sci. 2021, 11(10), 4323; https://doi.org/10.3390/app11104323
Submission received: 12 March 2021 / Revised: 26 March 2021 / Accepted: 31 March 2021 / Published: 11 May 2021
(This article belongs to the Special Issue Structural Health Monitoring & Nondestructive Testing)

Abstract

:
One of the concerns about the use of passive Infrared Thermography (IRT) for structural health monitoring (SHM) is the determination of a favorable period to conduct the inspections. This paper investigates the use of numerical simulations to find appropriate periods for IRT-based detection of subsurface damages in concrete bridge slabs under passive heating along a 1 year of time span. A model was built using the Finite Element Method (FEM) and calibrated using the results of a set of thermographic field inspections on a concrete slab sample. The results showed that the numerical simulation properly reproduced the experimental thermographic measurements of the concrete structure under passive heating, allowing the analysis to be extended for a longer testing period. The long-term FEM results demonstrated that the months of spring and summer are the most suitable for passive IRT inspections in this study, with around 17% more detections compared to the autumn and winter periods in Brazil. By enhancing the possibility of using FEM beyond the design stage, we demonstrate that this computation tool can provide support to long-term SHM.

1. Introduction

The aging of the transportation infrastructure raises questions about the safety and serviceability of the existing bridges worldwide. The 2020 Bridge report by the American Road and Transportation Builders Association [1] announced that nearly 231,000 of the bridges in the United Stated need repair interventions. The European Transport Research and Innovation Monitoring and Information System [2] reported that there is a concern about a large portion of bridges constructed after 1945, with a stipulated life span between 50 and 100 years. Although most of these bridges are still in service, the safety condition of some could be unknown at times. The structural deterioration is accelerated by severe environmental events and the increase of the active loads, which are caused by the change in the traffic codes over the years, car accidents, and global climate change. In Brazil, the last report from the Federal Brazilian Department of Transportation [3] mentioned that 42% of the bridges under federal jurisdiction needed maintenance. Some bridges do not have a record about their age; however, for the structures having their ages documented, the evaluation condition worsens when the age increases. Therefore, pertinent planning of maintenance is needed to address the management of these infrastructure assets in a cost-efficient way [4].
Inspections have a fundamental role in bridge management, allowing diagnoses and prognoses based on the existing state of the structural elements. By gathering information related to the design and construction of new bridges and assessing the condition of existing structures, the inspections provide chronological data about the identification and characterization of potential defects and their evolution [5]. As the performance of a structure depends on the integrity of the elements that compose it, the number of interventions in an operating structure must be set to a minimum. Therefore, the use of non-destructive tests (NDT) has become attractive, representing a fast, harmless, and accurate approach to monitor the structure without impairing its operation [6,7].
Infrared vision (IR) has gained interest as an NDT method due to its capability of examination beyond the visible spectrum [8]. Infrared thermography (IRT) is one of the IR applications, comprising the measurements performed in the thermal mid-wave (MWIR) and longwave (LWIR) infrared bands [9]. The inspection is based on the thermal contrast between different materials, given a heat flux variation. Undamaged elements normally present uniform heat distribution on their surface, while internal or surface defects change the heat propagation by providing resistance or increasing the heat dissipation through the element. As a result, the inspection reveals defective areas with high or low-temperature patterns in the surface thermograms [10]. Moreover, the IRT approach is being constantly improved by the combination with other NDT methods and the use of computational techniques to advance the collection, storage, visualization, and analysis of the thermographic data [11,12,13,14,15,16,17,18].
Finite Element Method (FEM) constitutes one method of numerical simulation, where the domain of a complex problem is divided into sub-regions of simple geometry, i.e., finite elements [19]. This method could provide similar outputs to the realistic infrared thermography inspection, including the information about the temperature over time and the thermal map of the inspected surfaces [20,21]. Thus, this tool offers the possibility of reducing the time and cost required to make test samples and the need for numerous tests in the target structures. FEM has been used in the NDT studies and practice to predict test results, to examine experimental configurations, to perform parametric and optimization studies, and to develop the field of inspections [22]. In addition, it could be a useful method for predicting favorable time windows for inspection [23,24].
Numerical analysis and IRT have been integrated to detect or examine damages in concrete structures [25,26,27,28,29,30,31]. However, only a few researchers have studied the combination of passive IRT and FEM to improve inspection of concrete bridges. Rumbayan and Washer [32] used FEM to perform a 3D nonlinear transient heat transfer analysis for subsurface delamination detection in bridge elements. Their 6-month analyses were performed and simulated using a large vertical concrete block, investigating the effects of the environmental conditions on the thermal gradient detection. Güray and Birgül [33] investigated the favorable time window for passive IRT inspections of one reinforced concrete bridge deck during one day using only numerical modeling. Hiasa et al. [23,34] investigated experimentally and numerically the preferable conditions for thermographic analysis in concrete bridge decks during a 24 h timespan. The researchers [24,35] also studied the effect of depth, shape, and thickness of delamination on bridge decks, as well as ambient temperature and solar radiation conditions (one typical day in each different season), for subsurface damage detection using thermographic cameras. Those studies have shown that FEM is a potential tool to support passive IRT inspections in concrete bridge components.
However, there is no study exploring the use of FEM for the simulation of continuous and extended periods of passive ITR inspections of concrete components. In addition, most of the countries still do not have standards that regulate the use of IRT for inspection of infrastructure components, with a lack of studies [36] that orientate the planning of inspections for a long period in different locations and weather conditions. In this way, this research presents a computational model that can be useful to find windows of opportunity for planning inspections with the potential to detect subsurface damages in existing concrete bridges. Construction of test samples that represent bridge elements with diverse damage levels and environmental conditions is difficult, as the specimens normally have a large size and the monitoring of the IRT performance in a wide range of meteorological scenarios takes a considerable amount of time [24,32]. Therefore, if the integration of IRT and FEM is used, different structure locations and weather conditions can be added to the model to estimate the thermal gradient expected for target defects in the simulated concrete components. The modeling in the long term can be useful to identify periods during the day and/or during different seasons when the thermographic inspection technique would have acceptable performance in damage detection, with a possible reduction of the cost and time spent in field tests.
Therefore, the main contribution of this study is the development of a FEM model to support long-term inspection plans in concrete bridges using solar loading thermography. A thermal camera was used to inspect a sample of concrete bridge slab with artificial subsurface delamination during different seasons and weather conditions. A numerical model was developed to simulate the experimental concrete specimen, radiation source, and IRT inspection. To validate the model, a comparison between the experimental and numerical surface temperatures and thermal gradients was performed. Then, the calibrated model was used to predict the most favorable periods to detect the subsurface delamination in a concrete structure during one year of inspection.

2. Experimental Section

2.1. Concrete Sample

A set of IRT experiments were previously performed by Pozzer et al. [37] to collect thermographic data, which were used to develop the numerical model in this research. Three samples of bridge slabs were built with subsurface delamination simulated with Styrofoam, which has a thermal conductivity (0.027 W/m°C) close to the air (0.024 W/m°C) and can represent real subsurface delamination [23]. These thermographic inspections were conducted once a month in November 2018, February, April, June, and July 2019, at an hourly interval from 7:00 a.m. to 9:00 p.m. One of these concrete samples was destructed after the end of the IRT experiments to obtain the exact position of the subsurface damages, which allowed to improve the numerical modeling of the present study. Each specimen had 9 Styrofoam square-shaped defects of different lateral sizes (5.0, 10.0, and 15.0 cm) and located at different depths (2.0 ≤ z ≤ 5.0 cm). Figure 1 shows the details of the inspected concrete sample with delamination.

2.2. Infrared Thermography Measurements

The experiment was conducted outside of the Infrastructure Laboratory at the University of Passo Fundo, located in Passo Fundo, Rio Grande do Sul, Brazil (Lat. 28°13′36.28″ S, Long. 52°23′10.92″ W). Figure 2 shows a concrete sample after construction and the location of inspections.
Several studies demonstrated that the sensitivity of passive IRT inspections was associated with the variation of the environmental conditions [23,33,35,37,38,39,40]. This research study carried out the thermographic imagery at different times of the day and months to capture the effects of different seasons on the outcomes of inspections. All the experimental tests were performed under passive heating using a TESTO 881-1 (160 × 120 FPA, 50 mK, 8–14 μm, 33 Hz) infrared camera. The inspections were performed in the reflection mode, with the camera positioned in vertical support at 2.5 m from the inspected sample, considering a 90° angle from the slab top surface. The variables of ambient temperature, wind speed, and solar radiation were monitored during the test periods. A digital J Prolab Thermometer was used to register the air temperature, and a portable DAVIS Turbo Meter Anemometer was used to measure the wind speed. The solar radiation values were obtained from the meteorological station existing near the study site, which was linked with the Brazilian Meteorology Institute [41] database. The detection of the damages was based on the thermal gradients, which represented the temperature difference between the concrete surface on top of the delaminated area and the concrete surface without delamination. Table 1 shows the information about the environmental conditions measured during the field test days. The solar radiation value in each day was set according to the average of the positive irradiation values registered by the database [41].

3. Finite Element Method (FEM)

Heat transfer problems that include solar radiation are difficult to solve analytically, as they require transient solutions of complex nonlinear partial differential equations [19]. Thereby, FEM has become attractive for these iterative processes. This numerical modeling method includes reproducing the tested geometry, dividing it into finite elements (mesh), and exposing the sample to the heat source and boundary conditions through the time of interest. Then, the governing differential equation of the heat transfer problem is replaced by finite algebraic equations at the finite points created in the element at the given time.

3.1. Heat Transfer Theory

The COMSOL Multiphysics, Graphical User Interface Version 5.2 from COMSOL Inc., was used for the 3-dimensional and transient heat transfer analysis using the FEM. The temperature difference between the concrete sample and the environment presupposed a spontaneous transmission of energy in search of a thermal balance. The heat transfer process occurs externally to the concrete sample by means of radiation and convection and spreads through the material via conduction.
The rate of heat transfer by conduction inside the concrete can be calculated by Fourier’ law as:
Qcond = −k ∇T
where k is the thermal conductivity of the material and ∇T is the temperature gradient in the region that the rate of heat transfer by conduction is investigated. The negative sign in the equation stands for the second law of thermodynamics, which says that heat always flows in the direction of the decreasing temperature [19].
The rate of heat transfer by convection considers the interaction between a solid and fluid in motion, when they are at different temperatures, and is expressed by Newton’s law of cooling as:
Qconv = h (Ts − Tf)
In which h is the convective heat transfer coefficient, Ts is the temperature of the surface and Tf represents the temperature of the fluid (air temperature). The thermal energy transferred by convection represents a complex mechanism of heat transfer as it depends on the type of fluid flow, fluid proprieties, and solid surface characteristics, such as geometry and roughness [19].
The solar radiation heat flux received by the external surface of the concrete sample can be expressed by:
Qsol = α Isol
where α is the absorption coefficient of the concrete surface, which depends on the color and texture of the concrete surface, and Isol is the total solar radiation on the sample surface. The total solar radiation depends on the geographic location of the sample and the Sun orientation (zenith angle and solar elevation), where the latter varies throughout the day and the year [32]. The Heat Transfer with the Surface-to-Surface Radiation module was used in the COMSOL software due to its ability to model the solar radiation as an external radiation source and the Sun orientation in the course of the analysis length.

3.2. Material Properties

The thermal properties of the materials were determined according to the concrete and Styrofoam used in the experimental program, complemented by technical references presented in previous studies [18,23]. The values are presented in Table 2.

3.3. Boundary Conditions

Solar radiation, convection, and ambient temperature were set as boundary conditions for the simulated model. The main heat source was the incident solar radiation over time, which varied according to the geographic location of the sample and the Sun orientation (zenith angle and solar elevation). This parameter was included using the External Radiation Source feature in the software, which was configured based on the latitude (28°13′36.28″ S), longitude (52°23′10.92″ W), and time zone (−3) of the test location.
The next boundary condition was the heat transfer by convection. Since Sharples and Charlesworth [42] established an approximate correlation between the wind speed (Vr) and convective heat transfer coefficient (h), their study was used to determine a daily wind-induced convective heat transfer in the present study, using the following equation:
h = 6.5 + 3.3Vr (W/m².K) Vr ≤ 6 m/s
Hiasa et al. [23,24,35] used a similar approach to calculate the convection coefficient for their numerical thermographic simulation. However, they performed a 1-day test and stipulated a constant heat transfer coefficient based on the maximum wind speed data. In this study, the daily average of wind speed was used to find the daily convective heat transfer coefficients.
The hourly ambient temperature variation was also used as a boundary condition. The diurnal variation of the ambient temperature (Tamb) follows a simple sinusoidal periodic distribution of 24 h, depending on the average daily temperature (Tavg) [43]:
T amb = T avg + Δ T * cos ( 2 π t 14 24 )
where Tavg and ΔT are parameters corresponding to the average daily temperature and half of the daytime temperature variation, respectively. The variable t represents the time and was expressed in hours [43].

3.4. Development of the FEM Model

The modeling started with the definition of the physical model and the study type, which in this case was the Heat Transfer with Surface-to-Surface Radiation and time-dependent, respectively. Sequentially, the development of the model was divided into 2 main steps: global definitions and component creation. The global definitions included the parameters settings, where all the variables from Table 1 and the information about the dates and coordinates were defined. In addition, the ambient temperature was defined using a function (Equation (5)).
The second step included several sub-steps. First, the geometry of the concrete samples and damages was imported from a 3D CAD file. The 3D model represented the concrete sample and its damages at the identical position and dimensions as the experimental sample. Next, all the material proprieties (Table 2) were assigned to each corresponding element. Then, the Heat Transfer with Surface-to-Surface Radiation module was configured by linking the parameters and adding the boundary conditions. In this step, the external radiation source was configured as the solar radiation, with the source location defined by the coordinates of the case study, where the x-axis represents the North/South direction. The time of analysis was also defined according to the experiment (date, month, and year). The initial temperature values on the concrete surface were defined as the ambient temperature. In addition, the concrete surface was assumed to be opaque and diffuse. Next, the heat flux by convection was added (Equation (4)) as a boundary condition acting in all the concrete surfaces, except in the bottom of the sample (placed on the ground).
Finally, the mesh was configurated. The slab sample was divided into a mesh of 22,593 tetrahedral elements and 3606 triangular elements, in an adaptive refinement, i.e., changing according to the size and position of each solid. It used an element size named “Finer”, the third thinnest level among 9 options available in COMSOL software. The dimensions of the mesh elements varied between 4.0 mm and 5.5 cm, with the minimum element quality of 0.137. The quality of the elements can vary between 0 and 1, where 1 represents an optimal element and 0 indicates a degenerated component. There was no predetermined value for what the element’s quality should be since it depends on the analyst’s judgment and the required precision of the model. For most applications, however, elements with a quality below 0.1 are considered limited [44]. In this case, the “Finer” option represented a balance between the element’s quality and the computational time. The model geometry and mesh are shown in Figure 3.
The FEM simulation of the field test was carried out for the dates and duration presented in Table 1 on an hourly basis. After the model was computed, the results of surface temperature for both health and target delaminated area, as well as the thermal gradient, can be plotted automatically on an hourly basis. Then, the thermal results can be visualized in the COMSOL graphical interface and saved as images or plotted through 2D/3D plots and exported as a spreadsheet.

4. Results and Discussion

The results of one of the inserted delamination are presented to perform the comparison between the experimental and numerical surface temperatures and thermal gradients. Other studies showed that different internal defect characteristics (size, thickness, and depth) have distinct thermal responses through the day [24,34,35,38], affecting the favorable period to detect the damages using IRT. In the present study, both experimental and simulated results for the upper-right (2 cm deep) delamination will be shown next, followed by the yearly analysis performed using the finite element method.

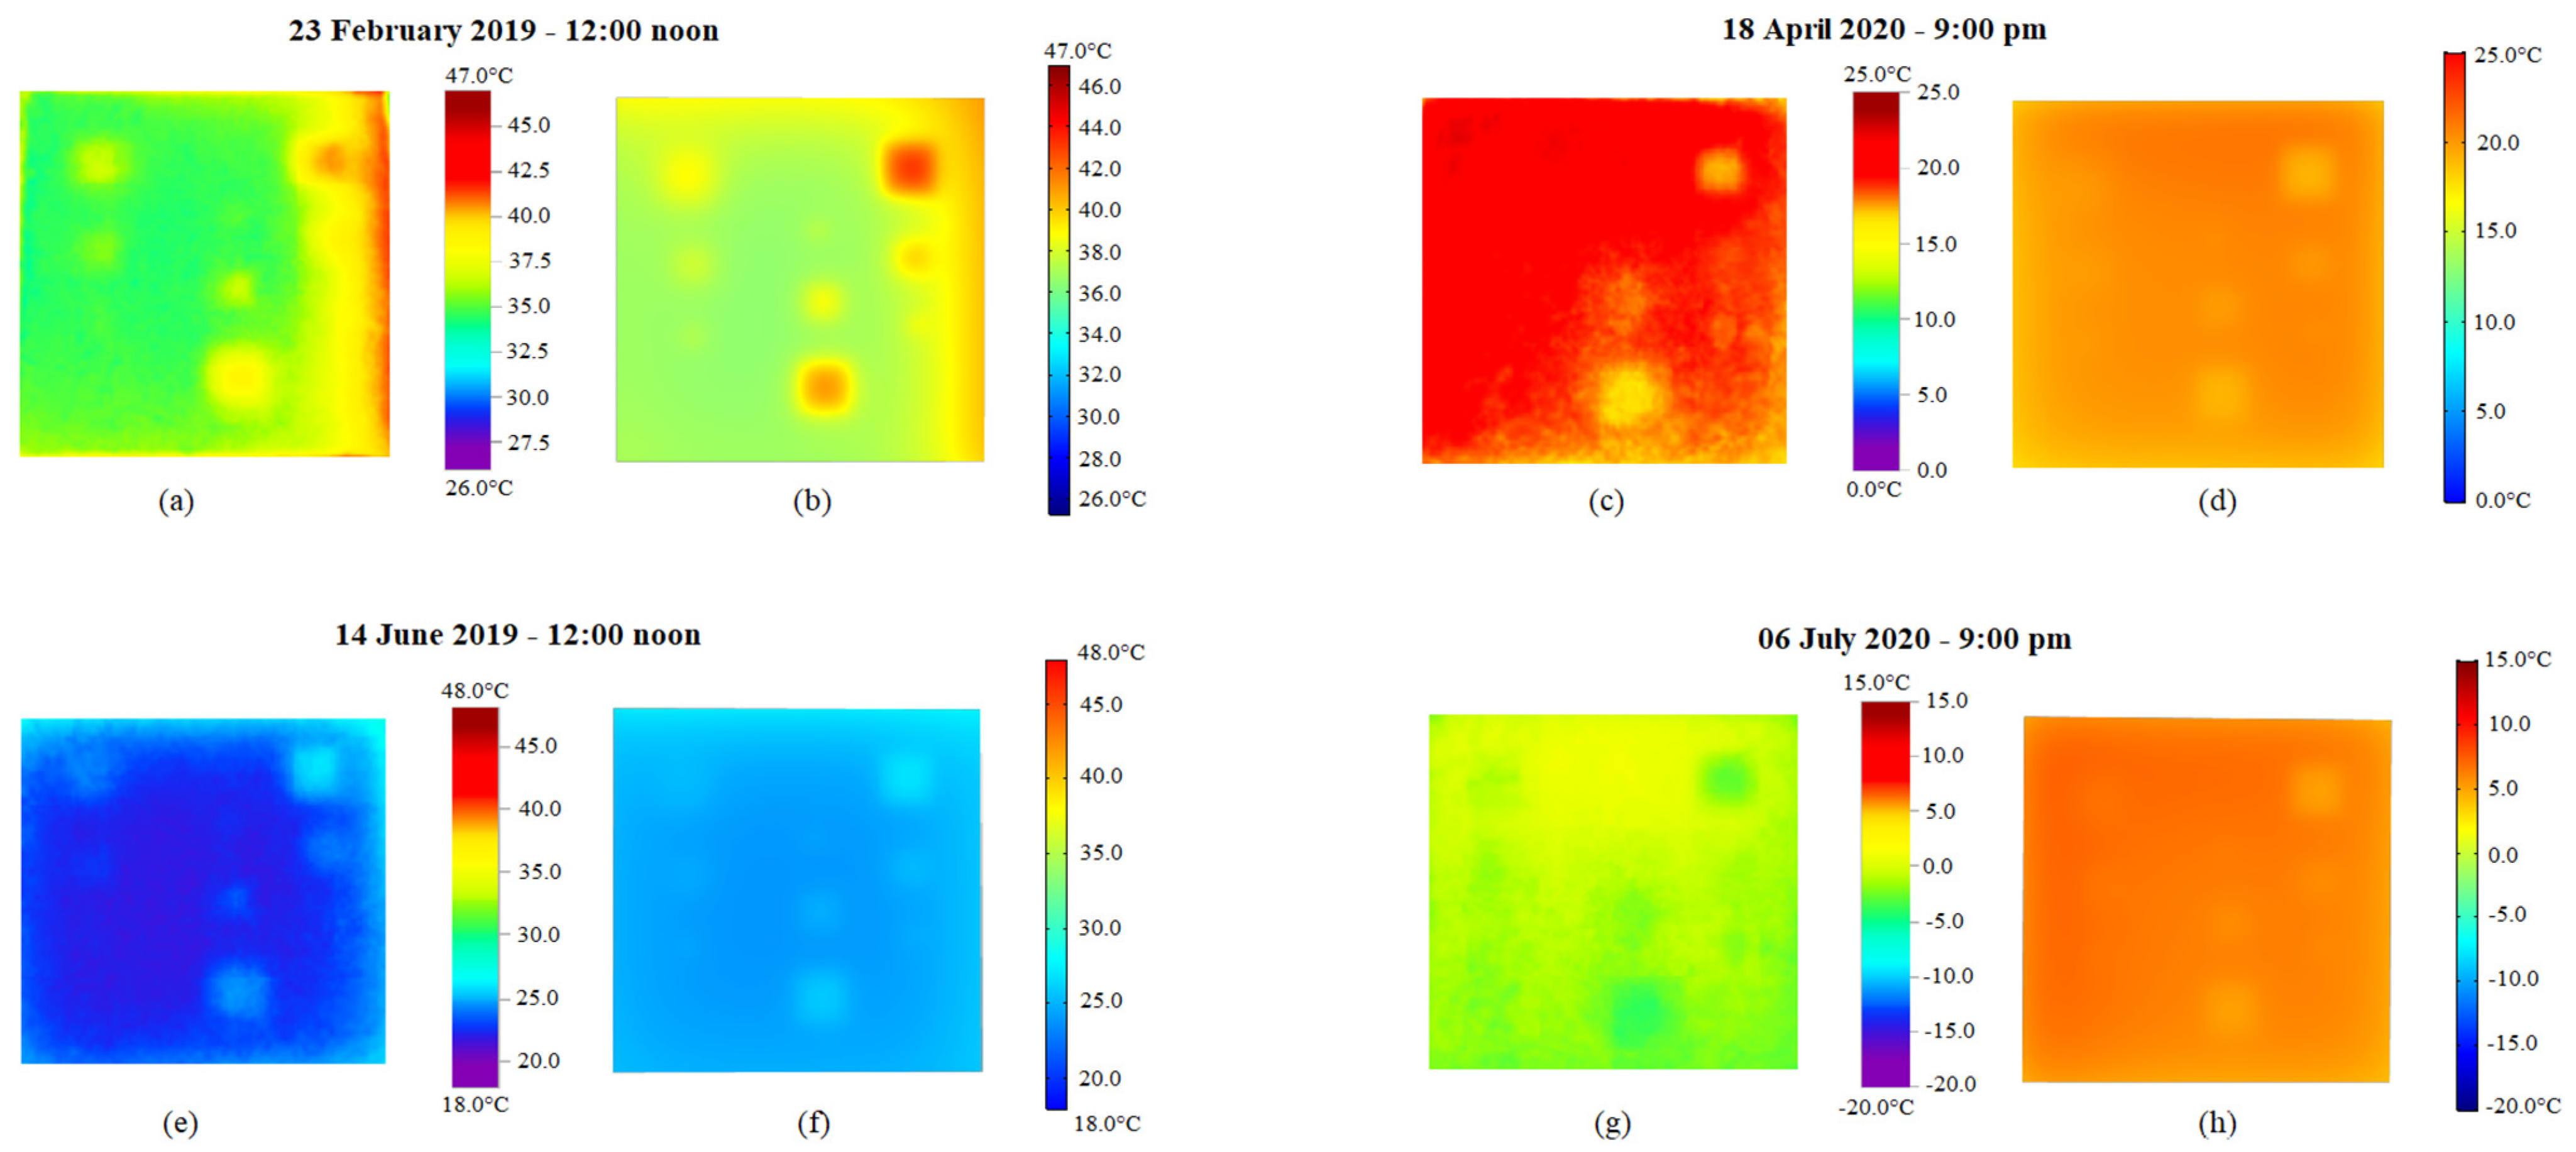
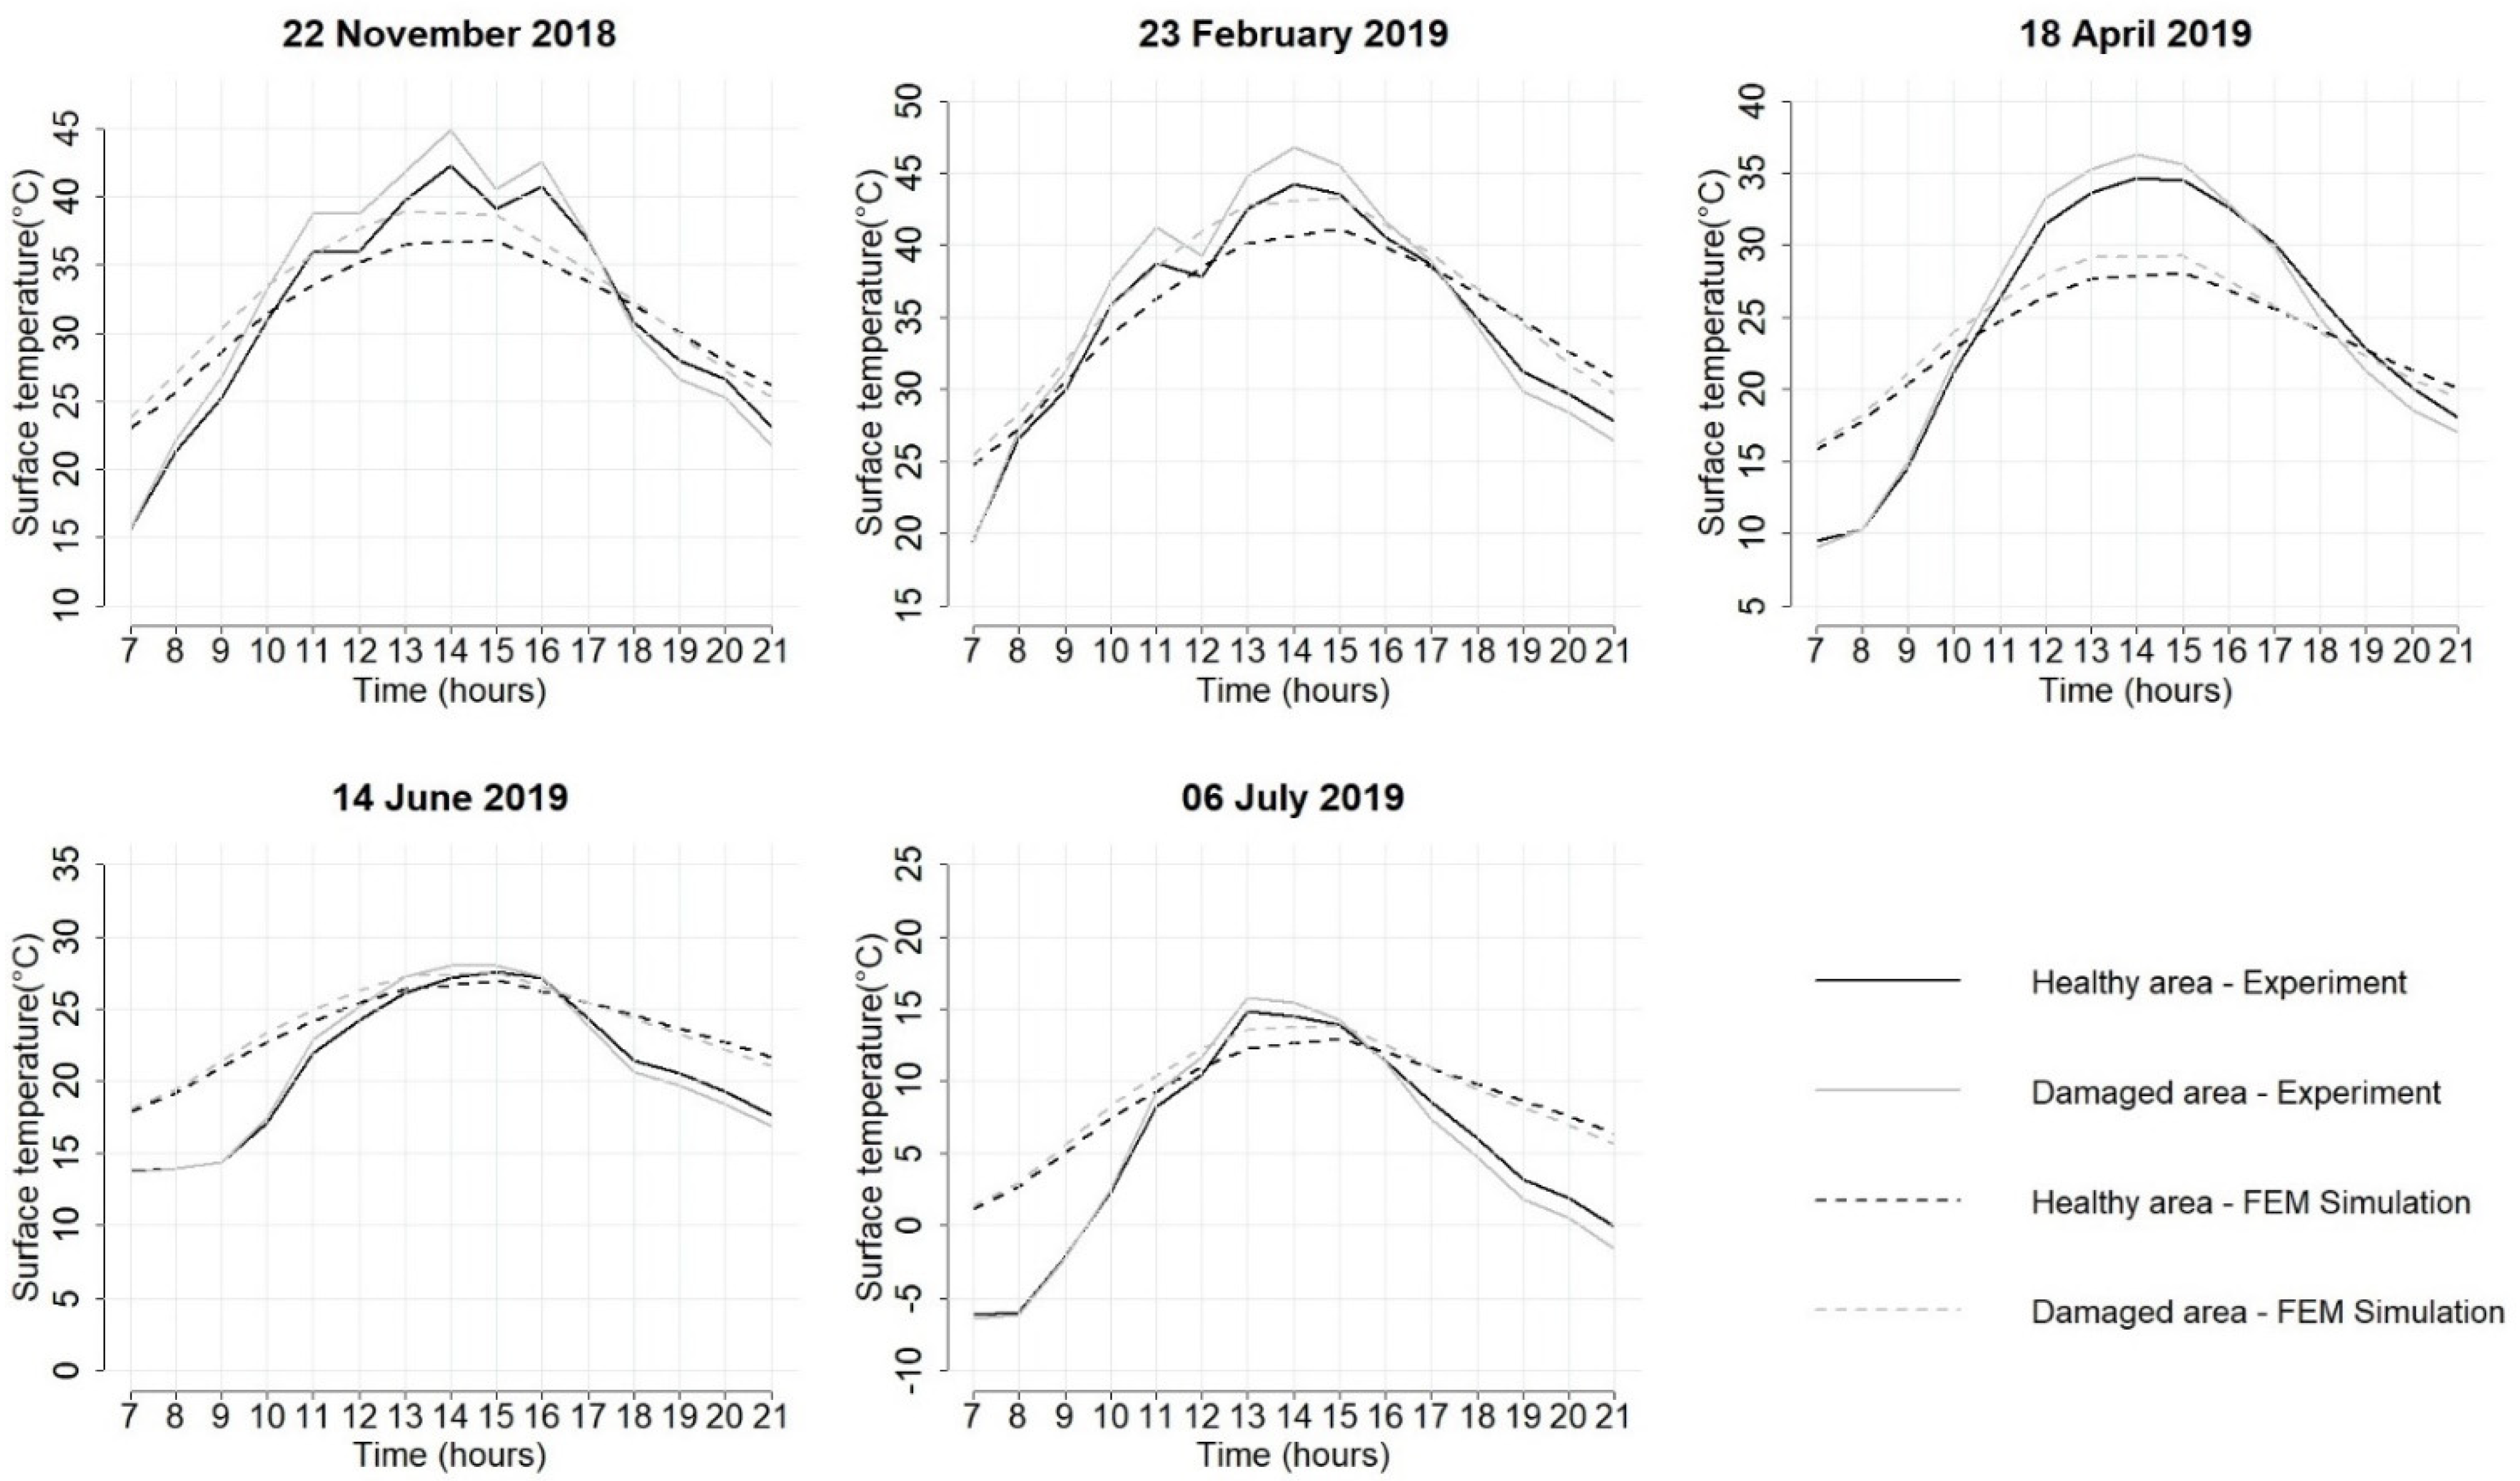
4.1. Comparison of Experimental and Simulated Results

Figure 4 shows four pairs of thermograms obtained from the experiment and FEM simulation. The temperature range of the thermograms was unified to facilitate the surface temperature comparison, and the color pallet was adjusted to improve the visualization of the damages in each experiment. The chosen palette has one scale where the red color represents the highest surface temperatures, and the blue color is associated with the lowest surface temperatures. The presented thermograms are from 12:00 (noon) and 9:00 p.m., representing heating up and cooling down phases registered in the passive IRT inspection, respectively.
In Figure 4 it is possible to observe non-uniform heating in the experiment, where the heating and cooling processes follow the solar movement, which varies through the day and the months. Figure 4b confirms the work of Hiasa et al. [23] by showing that the numerical model can reproduce the heating of the sample edge according to the solar orientation. In general, the surface temperatures are convergent. However, the experimental thermograms present a high level of non-uniform heating when compared to the FEM simulations, which were possibly caused by the environmental conditions on the field. Relative humidity, presence of clouds, and surroundings elements were not considered in the numerical simulation, which could have led to the inconsistencies observed between the actual temperature measurements and simulation [23]. A higher discrepancy exists between Figure 4g and Figure 4h, where the difference in the surface temperature reached 7 °C. One possible explanation for this difference could be the presence of humidity and fog in the experiment environment, which is a common situation during the winter mornings and nights, causing a lower temperature in the concrete surface in the experimental sample. However, the comparison of the thermograms illustrates the applicability of the FEM model in predicting the IRT images with reasonable accordance with the field inspection using the actual information about the structure and environmental conditions [32]. A complete quantitative temperature comparison for the surface temperature values for the upper-right (2 cm deep) delamination is provided in Figure 5.
The differences between simulated and experimental surface temperatures were observed mainly during the morning and evening times. As reported in the thermograms analysis, these differences are probably due to the boundary conditions assumed in the model, which only considered the sample orientation related to the Sun, solar radiation, coefficient of convection based on the wind speed, and ambient temperature at the study site. In addition, several susceptible errors in the technique could have contributed to the observed differences, including errors in the accuracy of the thermal camera, in the instrumentation used to measure the environmental conditions, or by the local weather station. However, the purpose of this study was to verify the competence of the proposed computer-based technique to detect subsurface damages and identify a convergence with the thermal gradients’ detections in the IRT practical application under different boundary conditions. Further works will address the FEM updating to optimize the parameters used in the proposed model.
The thermal gradient between the healthy and damaged surface temperatures is the main parameter for detecting subsurface damages in infrared thermographic inspections. In this context, Figure 6 shows the difference between the measured and simulated contrast values during the days of experimentation, calculated using the surface temperatures from Figure 5. The contrast values obtained by the numerical simulation are aligned to those calculated from the measurements performed by the IRT thermal camera, even with the temperature differences reported in the previous figure.
The amplitude of the simulated contrast followed the periodic variation of the gradients through the days that the experiments were carried out, where gradients were small for the autumn and winter months (April, June, and July) compared to the spring and summer months (November and February). The Pearson Correlation (R), the Mean Bias Error (MBE), and the Mean Absolute Error (MAE) were calculated to assess the covariability and the deviation among the simulated results from the FEM model and the observed results from the IRT experiments (Table 3).
The MBE measures the overall bias of the model, and MAE measures the absolute extent of the errors without considering their directions [45]. Table 3 shows that in most cases, the MBE produced positive values for the surface temperatures and thermal gradient, indicating that the model has a trend to overestimate the experimental results. An exception is seen in April, where MBE showed that the model underestimates the surface temperatures. However, thermal gradients were constantly overestimated. These trends can be confirmed by looking at the curves in Figure 5 and Figure 6. The MAE is greater for the surface temperatures simulations, with averages differences ranging from 2.17 °C to 4.38 °C. However, the absolute error is under 0.6 °C in all thermal gradient tests, which indicates that the contrast between healthy and damaged areas is convergent, despite the surface temperature differences. Therefore, these results are aligned with the findings of previous studies [23,24,32,33,34,35], where the numerical simulation presented the capability of reproducing the thermal gradients measured in the thermographic inspections using passive heating. Rumbayan and Washer [32] reported the deviation measurements for the thermal contrast between their model and the experimental results. The correlation indices (R) were between 0.70 and 0.92, and the contrast differences (MBE) and absolute error (MAE) were below 1 °C. Hiasa et al. [24] also calculated the correlation coefficient (R) between FEM simulation results and IRT measurements of the concrete surface temperature using three different thermal cameras, obtaining results above 0.97 in all cases. In this sense, we confirm the authors’ conclusion that the FEM can represent a tool to predict the concrete surface temperatures and support practical IRT inspections.
The computational modeling proposed in this study showed the possibility of identifying subsurface damages in reinforced concrete bridge slabs at different times of the year and under different environmental conditions, including temperature, wind speed, and solar radiation. Although the simulated thermal gradient results present an average difference of 0.39 °C compared to the experimental inspection, the correlation between the model results and the experimental study was equal or above 0.96 in all the thermographic tests. Consequently, the reasonable accuracy of the simulation supports the extrapolation of the model analyses to a long period.

4.2. Discussion on Appropriate Periods for IRT Inspection of Concrete Bridge Slabs Based on Long-Term Fem Analysis

Numerical simulation of 1 year of the inspection was performed using the FEM model of the concrete slab with fabricated delaminations and the weather conditions data available in the Brazilian meteorological database [41] near the study site. All the information about the environmental conditions used in the long-term simulation is available anytime in the referred database, for open consultation or download. In addition, all the modeling data are available for interested readers through email requests.
The results of the long-term simulation are presented in Figure 7. The period of simulations started on 1 November 2018, the same month that the experimental program started, and ended on 31 October 2019. The analysis was performed 24 h per day, with hourly time steps. Each daily simulation took an average time of 152 s, which reduced an entire year’s analysis to approximately 16 h. The simulations were performed using a desktop computer with 16 GB RAM, 2.3 GHz Intel Core i7 CPU, and an NVIDIA GeForce MX250 GPU. The daily varying input parameters of the model were presented in Table 1. Conventionally, the year was divided into the local seasons: Autumn (March, April, and May), winter (June, July, and August), spring (September, October, and November), and summer (December, January, and February).
The incidence of the rain was plotted in Figure 7, and the numerical model correctly simulated the low thermal gradients values in these events, mainly between the ±0.5 °C thresholds. The solar radiation parameter allows this prediction, as rainy days usually have low solar radiation levels, generating a model outcome that correctly shows these days as not favorable for inspections. ASTM D 4788-03 [46], which is the American standard that regulates the thermographic inspections in bridge decks, recommends that the bridge deck should remain dry for at least 24 h hours before an IRT inspection. In addition, the regulation prescribes a minimum thermal gradient of 0.5 °C between healthy areas and areas with suspected delamination to identify subsurface damage.
The direct observation from Figure 7 allows us to percept the difference in the thermal gradient behavior along the seasons, where months with warmer weather have greater thermal gradient values and a larger number of simulations with reliable thermal gradients (out of the ASTM D4788-03 boundaries). The greater thermal gradient between damaged and undamaged areas facilitates subsurface damage identification [9,10,24,37] because the contrast in the thermogram colors becomes more noticeable with the increase of the temperature difference. Table 4 presents the number and percentage of IRT simulations that exceed the ASTM D4788-03 recommendation of a minimum thermal gradient, according to the different seasons considered in the simulation. The detection percentage was calculated by dividing the number of hourly detections by the number of hourly simulations. The damage was considered as detected by the IRT technique if, after the hourly simulation, the temperature difference between the concrete surface on top of the delaminated area and the concrete surface without delamination was equal or greater than 0.5 °C.
In a monthly analysis, December presented a larger percentage of contrast results exceeding the 0.5 °C thresholds. This month represents the beginning of the summer in Brazil and, together with January and February, compose the summer season in the southern hemisphere. This season had a higher quantity of simulations of thermal gradient values exceeding the ASTM D 4788-03 [46] recommendation. The warmer weather in the summer facilitates the heating propagation by solar radiation, the main heating source for passive IRT inspection, which increases the heating of the concrete sample and, therefore, the identification of the damages [24,37,38,39,40]. Winter and autumn months also present a high incidence of solar radiation; however, the air temperatures usually are lower than summer and spring, and the presence of humidity and fog are more frequent, which makes heat propagation difficult. In general, it can be observed that the summer and spring represent favorable periods to perform infrared thermographic inspections under passive heating in this case of study, with 17.42% more reliable detections than the autumn and winter period. These findings challenge the observation of Hiasa et al. [24], which reported no significant effect of seasonal environment on the simulated thermal gradient in Orlando, Florida. One explanation could be the extent of the simulation, where they simulated one sunny day in each season, while this study performed an extended and continuous simulation of the entire seasons. Moreover, the study location probably has a different weather condition, which naturally produces different results. On the other hand, our data support the Al Gharawi et al. [47] work by showing that the thermograms captured in warmer months tend to have higher contrast results compared to colder months.
The heatmap in Figure 8 displays the hourly contrast values resulted from the FEM long-term analysis. The black color indicates the higher negative thermal gradients values (where the delaminated concrete area had lower surface temperature than the surrounding concrete), and yellow means the higher positive thermal gradients values (where the delaminated area presented higher surface temperature than the healthy concrete area). The inappropriate periods for inspection are illustrated in the purple color, when the thermal gradients were between −0.5 °C and 0.5 °C, i.e., insufficient, according to the ASTM D 4788-03 recommendation. The values of the x-axis start in November following the experimental program. From the top to the bottom of the y-axis, the heatmap shows the daily hours of the simulated inspection.
The thermal gradient values had a pattern through the days, evolving from negative values at midnight, showing higher positive intensity during the day, and returning to negative values during the night. Although all the months present favorable periods for inspections, the heatmap shows that the valid thermal gradients were more frequent in the warmer months (summer and spring). Several days in October, November, December, January, and February presented temperature differences between the delaminated and healthy areas close to 3 °C. The colder seasons presented modest temperature differences through the months, probably because of the winter and autumn weather conditions, such as small days and lower air temperatures [37,47]. Therefore, the heatmap in Figure 8 reasserts the conclusion that the warmer months appear to provide better conditions for inspections than colder months.
The results of this research imply that by having the geographic information of the location (coordinates and global zone), a reliable meteorological database, and the characteristics of the damaged structure, the inspector may simulate the daily thermal oscillation at the inspected structure. Thus, by evaluating the results of the finite element simulation, the inspector would be able to assess the most favorable time window to carry out the thermographic inspection of subsurface defects in reinforced concrete bridge slabs, avoiding excessive visits to the bridge field and/or experimental tests, as was previously introduced by previous studies [23,24,32,33]. Furthermore, long-lasting thermographic inspections in real structures would provide information that can be processed using lock-in thermography based on passive thermography, and thermal modeling can help in understanding the data from the inspection, as was the case study of the Old Kingdom constructions of Egypt [48]. An open research opportunity would also be the study of the relation between the concrete temperature strains and the concrete strength proprieties using FEM. Once the temperature variation can cause dangerous temperature strains in concrete elements, the strength of the concrete structure could be improved by varying the characteristics of concrete materials. As the analysis can consider a number of environmental and concrete material scenarios, the numerical simulation can reduce the intense labor work of visiting different structures or construct several concrete samples. Furthermore, the analysis of the steel reinforcement effect in the heat flow through reinforced concrete structures inspected by IRT can also be performed.
To the best knowledge of the authors, the studies present in the literature did not simulate a passive IRT numerical analysis of delamination detection in a concrete structure during an entire year. The complete simulation of a long period allows us to assess the effects of the seasonal variations in the IRT inspections without excessive tests, showing that spring and summer seasons are favorable periods to use the IRT technique. The use of numerical simulation to support the temperature-based inspections highlights an application for the finite element method in infrastructure health monitoring. The proposed simulation approach also meets the premises of sustainability since it intends to help the maintenance of the structures to allow their use by the next generations. Although the presented model was developed based on a static damage area and the results depend on the characteristics of the sample, and the study location, the general concept of the model can be considered for further analysis of other concrete structures and in other locations with different environmental conditions. Moreover, the model can be improved by adding a greater number of experimental tests and more precise physical parameters. In addition, an agenda of the practical tests must be maintained since the thermal proprieties of the structural materials may change along the lifetime of structures and the FEM model requires calibration [49].

5. Conclusions

We proposed a numerical simulation for supporting long-term inspection plans using a passive IRT method for the detection of subsurface damages in concrete bridge decks. The model was developed using FEM, which showed promising agreement with the surface temperatures and thermal gradients measured in the experimental tests, supporting the extrapolation to long-term analysis to find favorable windows for inspections. The results verified that IRT inspections performed during warmer months (spring and summer) enable more reliable identification of the subsurface damage in the concrete structure compared to colder months (autumn and winter) in the case of the study.
The presented research contributes to the field of thermographic inspection of subsurface defects in reinforced concrete bridge slabs in two different ways. First, the computational simulation can support the practical planning of passive IRT inspections in concrete elements for a long period, considering different locations and weather conditions. Second, the use of the developed model can save the time, effort, and resources spent in the construction of the samples and the visits to the structures to find the best times to perform the measurements.
The number of factors that influence passive IRT inspections can limit this approach and can lead to discrepancies in the surface temperatures obtained in the simulations and onsite measurements. In addition, the research was developed based on a static damage area in this case study, and the specific prediction results are linked to the configuration of the analyzed damage. However, if a user decides to use the model to test the detection of another type or size of defects, the damage configuration can be changed in the geometry of the model prior to the analysis, and the results will be generated according to the new damage configuration. This procedure can also be followed when the user experiences other material (concrete) parameters, geographical localization, or environmental conditions. Further research efforts could use the finite element model updating technique to improve the accuracy of the results and explore the use of long-lasting inspections in real concrete structures using passive thermography to enable advanced image processing techniques. Studies regarding the possible improvement of characteristics of concrete material to face thermal concrete strains using FEM is also a research opportunity in this field, together with the analysis of the steel reinforcement effect in the heat flow through reinforced concrete structures.

Author Contributions

Conceptualization, S.P., F.D.R. and Z.M.C.P.; methodology, S.P.; validation, S.P., F.D.R. and Z.M.C.P.; investigation, S.P.; writing—original draft preparation, S.P.; writing—review and editing, F.D.R., Z.M.C.P., E.R.A. and X.M.; supervision, F.D.R.; funding acquisition, F.D.R. All authors have read and agreed to the published version of the manuscript.

Funding

This research was partly funded by the National Council for Scientific and Technological Development -CNPq, grant number 427757/2016-9.

Institutional Review Board Statement

Not applicable.

Informed Consent Statement

Not applicable.

Data Availability Statement

The data that support the findings of this study are available from the corresponding author upon reasonable request.

Acknowledgments

The authors are grateful for the financial support from Fundação Universidade de Passo Fundo (FUPF).

Conflicts of Interest

The authors declare no conflict of interest.

References

  1. American Road and Transportation Builders Association (ARTBA). “Bridge Report. 2020”. 2020. Available online: https://artbabridgereport.org/ (accessed on 14 October 2020).
  2. HAQ, G.; Ortega Hortelano, A.; Tsakalidis, A.; Gkoumas, K.; Pekár, F.; Balen, M.; Grosso, M.; Marques Dos Santos, F.L. Research and Innovation in Bridge. Maintenance, Inspection and Monitoring: A European Perspective Based on the Transport. Research and Innovation Monitoring and Information System (TRIMIS); EUR 29650 EN.; Publications Office of the European Union: Luxembourg, 2019. [Google Scholar]
  3. Oliveira, C.B.L.; Greco, M.; Bittencourt, T.N. Analysis of the brazilian federal bridge inventory. Rev. IBRACON Estrut. Mater. 2019, 12, 1–3. [Google Scholar] [CrossRef]
  4. European Commission. “Discussion Paper-State of Infrastructure Maintenance”. 2019. Available online: https://ec.europa.eu/growth/sectors/construction/observatory (accessed on 4 October 2020).
  5. Garrido, I.; Lagüela, S.; Otero, R.; Arias, P. Thermographic methodologies used in infrastructure inspection: A review—data acquisition procedures. Infrared Phys. Technol. 2020, 111, 103481. [Google Scholar] [CrossRef]
  6. Chang, P.C.; Liu, S.C. Recent Research in Nondestructive Evaluation of Civil Infrastructures. J. Mater. Civ. Eng. 2003, 15, 298–304. [Google Scholar] [CrossRef]
  7. Zinno, R.; Artese, S.; Clausi, G.; Magarò, F.; Meduri, S.; Miceli, A.; Venneri, A. Structural Health Monitoring (SHM). In The Internet of Things for Smart Urban Ecosystems; Cicirelli, F., Guerrieri, A., Mastroianni, C., Spezzano, G., Vinci, A., Eds.; Springer International Publishing: Cham, Switzerland, 2019; pp. 225–249. [Google Scholar]
  8. Ibarra-Castanedo, C.; Sfarra, S.; Genest, M.; Maldague, X. Infrared Vision: Visual Inspection beyond the Visible Spectrum. In Integrated Imaging and Vision Techniques for Industrial Inspection: Advances and Applications; Liu, Z., Ukida, H., Ramuhalli, P., Niel, K., Eds.; Springer: Berlin, Germany, 2015; Volume 11, pp. 42–57. [Google Scholar]
  9. Maldague, X. Theory and Practice of Infrared Technology for Nondestructive Testing; Wiley: Hoboken, NJ, USA, 2001. [Google Scholar]
  10. Maldague, X. Nondestructive Evaluation of Materials by Infrared Thermography, 1st ed.; Springer: London, UK, 1993. [Google Scholar]
  11. Gucunski, N.; Romero, R.; Kruschwitz, S.; Feldmann, R.; Parvardeh, H. Comprehensive Bridge Deck Deterioration Mapping of Nine Bridges by Nondestructive Evaluation Technologies; Final Report; Iowa Department of Transportation: Ames, IA, USA, 2011.
  12. Aggelis, D.; Kordatos, E.; Soulioti, D.; Matikas, T. Combined use of thermography and ultrasound for the characterization of subsurface cracks in concrete. Constr. Build. Mater. 2010, 24, 1888–1897. [Google Scholar] [CrossRef]
  13. Khan, F.; Bartoli, I. Detection of delamination in concrete slabs combining infrared thermography and impact echo techniques: A comparative experimental study. Struct. Health Monit. Insp. Adv. Mater. Aerosp. Civ. Infrastruct. 2015, 9437, 94370I. [Google Scholar] [CrossRef]
  14. Omar, T.; Nehdi, M.L. Remote sensing of concrete bridge decks using unmanned aerial vehicle infrared thermography. Autom. Constr. 2017, 83, 360–371. [Google Scholar] [CrossRef]
  15. Vaghefi, K.; Ahlborn, T.T.; Harris, D.K.; Brooks, C.N. Combined Imaging Technologies for Concrete Bridge Deck Condition Assessment. J. Perform. Constr. Facil. 2015, 29, 04014102. [Google Scholar] [CrossRef]
  16. Pozzer, S.; Azar, E.R.; Rosa, F.D.; Pravia, Z.M.C. Semantic Segmentation of Defects in Infrared Thermographic Images of Highly Damaged Concrete Structures. J. Perform. Constr. Facil. 2021, 35, 04020131. [Google Scholar] [CrossRef]
  17. McLaughlin, E.; Charron, N.; Narasimhan, S. Automated Defect Quantification in Concrete Bridges Using Robotics and Deep Learning. J. Comput. Civ. Eng. 2020, 34, 04020029. [Google Scholar] [CrossRef]
  18. Ibarra-Castanedo, C.; Sfarra, S.; Klein, M.; Maldague, X. Solar loading thermography: Time-lapsed thermographic survey and advanced thermographic signal processing for the inspection of civil engineering and cultural heritage structures. Infrared Phys. Technol. 2017, 82, 56–74. [Google Scholar] [CrossRef]
  19. Yçengel, A.; Ghajar, A.J. Heat and Mass Transfer: Fundamentals & Applications, 5th ed.; McGraw Hill Education: New York, NY, USA, 2015. [Google Scholar]
  20. Kleinfeld, J.M. Applying FEA to Perform Heat Transfer Calculations to Increase the Utility of IR Thermography. In IR INFO; Kleinfeld Technical Services, Inc.: Bronx, NY, USA, 2002. [Google Scholar]
  21. Rodríguez, F.L.; Nicolau, V.D.P. Inverse heat transfer approach for IR image reconstruction: Application to thermal non-destructive evaluation. Appl. Therm. Eng. 2012, 33–34, 109–118. [Google Scholar] [CrossRef]
  22. Chowdhury, R.; Attanayaka, A.M.U.B.; Aktan, H.M. Heat Transfer Fundamentals Applicable to Infrared Thermography of Concrete Structures. AIP Conf. Proc. 2004, 700, 1042–1049. [Google Scholar] [CrossRef]
  23. Hiasa, S.; Birgul, R.; Matsumoto, M.; Catbas, F.N. Experimental and numerical studies for suitable infrared thermography implementation on concrete bridge decks. Measurement 2018, 121, 144–159. [Google Scholar] [CrossRef]
  24. Hiasa, S.; Birgul, R.; Catbas, F.N. Investigation of effective utilization of infrared thermography (IRT) through advanced finite element modeling. Constr. Build. Mater. 2017, 150, 295–309. [Google Scholar] [CrossRef]
  25. Cheng, T.-Y.; Sakagami, T.; Kubo, S. Determination of delamination depth in concrete structure based on inverse analysis of thermography data. SPIE Def. Secur. Sens. 2010, 7661, 76610E. [Google Scholar] [CrossRef]
  26. Belattar, S.; Rhazi, J.; El Ballouti, A. Non-destructive testing by infrared thermography of the void and honeycomb type defect in the concrete. Int. J. Microstruct. Mater. Prop. 2012, 7, 235. [Google Scholar] [CrossRef]
  27. Khan, F.; Bolhassani, M.; Kontsos, A.; Hamid, A.; Bartoli, I. Modeling and experimental implementation of infrared thermography on concrete masonry structures. Infrared Phys. Technol. 2015, 69, 228–237. [Google Scholar] [CrossRef]
  28. Belattar, S. The Finite Element Method and Infrared Thermography Applied to the Characterization of Defects in a Chimney Structure. Quant. Infrared Thermogr. Asia 2015. [Google Scholar] [CrossRef]
  29. Dragan, R.G.; Roșca, I.C.; Cazangiu, D.; Leonte, A.S. Thermal Response for a Reinforced Concrete Slab Analyzed with Active Infrared Thermography and Comsol Multiphysics. Appl. Mech. Mater. 2015, 760, 627–632. [Google Scholar] [CrossRef]
  30. Cotič, P.; Kolarič, D.; Bosiljkov, V.B.; Bosiljkov, V.; Jagličić, Z. Determination of the applicability and limits of void and delamination detection in concrete structures using infrared thermography. NDT E Int. 2015, 74, 87–93. [Google Scholar] [CrossRef]
  31. Naik, M.; Hegde, G.; Giri, L.I. Optimization of Infrared Thermography for Damage Detection in Concrete Structures Using Finite Element Modelling. In Recent Trends in Civil Engineering; Springer: Singapore, 2021; pp. 177–188. [Google Scholar]
  32. Rumbayan, R.; Washer, G.A. Modeling of Environmental Effects on Thermal Detection of Subsurface Damage in Concrete. Res. Nondestruct. Eval. 2014, 25, 235–252. [Google Scholar] [CrossRef]
  33. Güray, E.; Birgül, R. Determination of Favorable Time Window for Infrared Inspection by Numerical Simulation of Heat Propagation in Concrete. In Proceedings of the 3rd International Sustainable Buildings Symposium (ISBS 2017), Dubai, United Arab Emirates, 15–17 March 2017; Fırat, S., Kinuthia, J., Abu-Tair, A., Eds.; Springer International Publishing: Cham, Switzerland, 2018; Volume 7, pp. 577–591. [Google Scholar]
  34. Hiasa, S.; Birgul, R.; Catbas, F.N. A data processing methodology for infrared thermography images of concrete bridges. Comput. Struct. 2017, 190, 205–218. [Google Scholar] [CrossRef]
  35. Hiasa, S.; Birgul, R.; Catbas, F.N. Effect of Defect Size on Subsurface Defect Detectability and Defect Depth Estimation for Concrete Structures by Infrared Thermography. J. Nondestruct. Eval. 2017, 36, 57. [Google Scholar] [CrossRef]
  36. Vitório, J.A.P. Uma Contribuição ao Estudo da Avaliação da Segurança de Pontes Existentes. J. Nondestruct. Eval. 2017, 36, 1–21. [Google Scholar]
  37. Pozzer, S.; Pravia, Z.M.C.; Azar, E.R.; Rosa, F.D. Statistical analysis of favorable conditions for thermographic inspection of concrete slabs. J. Civ. Struct. Health Monit. 2020, 10, 609–626. [Google Scholar] [CrossRef]
  38. Watase, A.; Birgul, R.; Hiasa, S.; Matsumoto, M.; Mitani, K.; Catbas, F.N. Practical identification of favorable time windows for infrared thermography for concrete bridge evaluation. Constr. Build. Mater. 2015, 101, 1016–1030. [Google Scholar] [CrossRef]
  39. Raja, B.N.K.; Miramini, S.; Duffield, C.; Sofi, M.; Mendis, P.; Zhang, L. The influence of ambient environmental conditions in detecting bridge concrete deck delamination using infrared thermography (IRT). Struct. Control Health Monit. 2020, 27. [Google Scholar] [CrossRef]
  40. Washer, G.; Fenwick, R.; Bolleni, N. Effects of Solar Loading on Infrared Imaging of Subsurface Features in Concrete. J. Bridg. Eng. 2010, 15, 384–390. [Google Scholar] [CrossRef]
  41. INMET. Estação Meteorológica de Observação de Superfície Automática. Available online: https://tempo.inmet.gov.br/TabelaEstacoes/83914# (accessed on 14 August 2020).
  42. Sharples, S.; Charlesworth, P. Full-scale measurements of wind-induced convective heat transfer from a roof-mounted flat plate solar collector. Sol. Energy 1998, 62, 69–77. [Google Scholar] [CrossRef]
  43. COMSOL. Parasol and Solar Irradiation. 2019. Available online: https://www.comsol.com/model/sun-s-radiation-effect-on-two-coolers-placed-under-a-parasol-12825 (accessed on 10 October 2020).
  44. Gothäll, H. How to Inspect Your Mesh in COMSOL Multiphysics. COMSOL 2017. Available online: https://www.comsol.com/blogs/how-to-inspect-your-mesh-in-comsol-multiphysics/ (accessed on 21 September 2020).
  45. Urquhart, B.; Ghonima, M.; Nguyen, D.; Kurtz, B.; Chow, C.W.; Kleissl, J. Chapter 9-Sky-Imaging Systems for Short-Term Forecasting. In Solar Energy Forecasting and Resource Assessment; Kleissl, J., Ed.; Academic Press: Boston, MA, USA, 2013; pp. 195–232. [Google Scholar]
  46. American Society for Testing and Materials. ASTM D4788–03: Standard Test Method for Detecting Delaminations in Bridge Decks Using Infrared Thermography; American Society for Testing and Materials: West Conshohocken, PA, USA, 2013. [Google Scholar]
  47. Al Gharawi, M.; Adu-Gyamfi, Y.; Washer, G. A framework for automated time-lapse thermography data processing. Constr. Build. Mater. 2019, 227, 116507. [Google Scholar] [CrossRef]
  48. Ibarra-Castanedo, C.; Khodayar, F.; Klein, M.; Sfarra, S.; Maldague, X.; Helal, H.; Tayoubi, M.; Marini, B.; Barré, J.C. Infrared vision for artwork and cultural heritage NDE studies: Principles and case studies. Insight Non-Destr. Test. Cond. Monit. 2017, 59, 243–248. [Google Scholar] [CrossRef] [Green Version]
  49. Omar, T.; Nehdi, M.L. Condition Assessment of Reinforced Concrete Bridges: Current Practice and Research Challenges. Infrastructures 2018, 3, 36. [Google Scholar] [CrossRef] [Green Version]
Figure 1. Concrete sample with artificial subsurface delamination: (a) 3D view; (b) coordinates of the fabricated damages.
Applsci 11 04323 g001
Figure 2. Experiment details: (a) Concrete sample after curing; (b) location of the samples in the university site.
Applsci 11 04323 g002
Figure 3. Geometry and mesh for: (a) Concrete sample; (b) simulated delaminations.
Applsci 11 04323 g003
Figure 4. Comparison between: (a,c,e,g) Thermograms obtained from the IRT experiment; (b,d,f,h) Thermograms obtained from the FEM numerical model.
Applsci 11 04323 g004
Figure 5. Comparison of surface temperatures measured in the IRT experiment and simulated by the FEM.
Applsci 11 04323 g005
Figure 6. Comparison between thermal gradients obtained from the IRT experiment and simulated by the FEM.
Applsci 11 04323 g006
Figure 7. Thermal gradient results from the FEM simulation of one year of IRT inspection.
Applsci 11 04323 g007
Figure 8. Heatmap of contrast values (C°) through the entire year of FEM simulation to visualize the favorable periods for inspection at the latitude of interest.
Applsci 11 04323 g008
Table 1. Inspection and meteorological data used in the numerical simulation of the field tests.
MonthDay of InspectionDuration of the InspectionSolar Radiation (W/m²·s)Wind Speed (m/s)Average Temperature (°C)Half Diurnal Temperature Variation (°C)
November22 November 20187 h to 21 h574.023.2123.956.90
February23 February 20197 h to 21 h524.141.3027.008.85
April18 April 20197 h to 21 h464.191.7117.555.80
June14 June 20197 h to 21 h276.482.8520.285.60
July06 July 20197 h to 21 h408.581.383.816.35
Table 2. Materials properties for the numerical simulation.
Material PropertiesUnit of MeasureConcreteStyrofoam
Densitykg/m³240025
Specific heatJ/(kg·K)10081130
Thermal conductivityW/(m·K)Temperature dependent0.027
Emissivity-0.9-
Table 3. R, MBE, and MAE for the surface temperatures and thermal gradients measured and simulated in the daily experiments.
ExperimentHealthy Area TemperatureDamaged Area TemperatureThermal Gradient
RMBE (°C)MAE (°C)RMBE (°C)MAE (°C)RMBE (°C)MAE (°C)
22 November 20180.980.023.070.980.313.370.970.290.51
23 February 20190.970.202.170.970.632.460.970.480.51
18 April 20190.99−0.934.210.99−0.554.360.980.380.47
14 June 20190.962.512.780.972.732.960.970.220.29
6 July 20190.983.243.950.983.824.380.970.580.58
Table 4. Quantitative results of thermal gradient observations above the threshold recommended by ASTM D4788-03.
SeasonMonthN° of DetectionsN° of SimulationsMonthly Detection Percentage (%)Season Detection Percentage (%)6-Months Detection Percentage (%)
AutumnMarch36774449.3335.4635.87
April27572038.19
May14174418.95
WinterJune22772031.5336.28
July21674429.03
August35874448.12
SpringSeptember32672045.2848.0853.29
October32574443.68
November39972055.42
SummerDecember45674461.2958.56
January42874457.53
February38167256.70
Publisher’s Note: MDPI stays neutral with regard to jurisdictional claims in published maps and institutional affiliations.

