1. Introduction
Fluid mechanics is a basic science for studying fluid phenomena and related mechanical behaviors. Its application scopes cover aerospace engineering, mechanical engineering, power engineering, chemical engineering, biomedicine and other fields [
1,
2,
3]. Fluid mechanics plays a broad and huge role in promoting scientific development, technological progress and industrial upgrading. The law of fluid momentum is one of the three basic laws of fluid mechanics as a basic theory explaining the relationship between fluid momentum change and force. The verification experiment of the law of constant flow of incompressible fluids, as the basic experiment to verify the theory of fluid momentum, is the core classic experiment of fluid mechanics [
1,
4,
5]. The water jet impingement plate model method is a common experimental method to verify the law of fluid momentum. During the experiment, by changing the initial momentum of the jet, the force done on the plate and the momentum change of the jet were measured, and the momentum correction coefficient was solved to verify the law of conservation of momentum.
The phenomenon of jet impacting on solids, as the physical basis of the momentum law verification experiment, is also a natural phenomenon widely existing in nature [
6]. Analyzing the error characteristics of the momentum law verification experiment through the jet impact phenomenon will help improve the scientificity, accuracy and reliability of the error analysis, and provide a new path for the exploration of the error generation mechanism. Jet impact has a wide range of engineering application backgrounds, and its applications cover aerospace engineering, power engineering, mechanical engineering and mining engineering [
7,
8,
9,
10]. The introduction of jet impact analysis into the fluid momentum law verification experiment will not only help improve the depth of momentum law theoretical research, but also play a significantly positive role for improving the engineering innovation and application expansion based on the law of momentum [
11,
12,
13].
Water jet impacting on a solid is a nonlinear dynamic process involving water hammer force, impact force (stagnation pressure), material deformation, damage and many other factors. It has the characteristics of large deformation, high strain rate, and transient processes that are difficult to observe and detect. [
6,
10]. There are many researches on the theory and numerical calculation methods of water jet impact at home and abroad, but there are few studies on the specific impact process and error characteristics of the momentum law verification experiment based on the principle of water jet impact on a flat plate. The author and his team have studied the impact of water jet on a flat plate. A preliminary study on the action process of the model has been carried out, and the relevant experimental data on the condition of the initial momentum of the jet equal to 15.74 Kg·m/s is obtained. The analysis shows that the irregular vibration of the sensor in the non-jet direction is the main reason for the change of measurement error [
14].
This paper selects the momentum law experimental platform as the research object, establishes the numerical model of the water jet impingement momentum law experimental platform, uses the SPH-FEM coupling algorithm to analyze the jet impact on the plate, and obtains the jet load conditions at different speeds (different initial momentum). Based on the response characteristics of the sensor structure, the error characteristics of the momentum law experimental device are analyzed.
3. Analysis of Sensor Displacement Response Characteristics
The preliminary research foundation shows that the displacement response characteristics of the sensor structure can be used as the basis for error characteristic analysis [
14]. In the momentum law experimental device, the sensor is arranged in a cantilever beam structure. With reference to the existing research results, the midpoint C on the side wall of the sensor is selected as the characteristic point of the displacement response characteristic of the sensor, referred to as the characteristic point C of the sensor, as shown in
Figure 3 [
14].
The displacement response of the sensor characteristic point C in the X, Y and Z directions under the action of the jet impact is shown in
Figure 4,
Figure 5,
Figure 6 and
Figure 7, respectively. It can be seen from
Figure 4,
Figure 5,
Figure 6 and
Figure 7, under the impact of different momentum jets, the sensor is displaced in the X direction (jet impact direction), Y direction and Z direction, for further analysis, a frequency spectrum analysis is performed on the displacement in the y direction, as shown in
Figure 6. The displacement amplitudes in the X direction and Y direction are larger than that of the Z direction. It shows that the external force that the sensor suffered in the X and Y directions is relatively large.
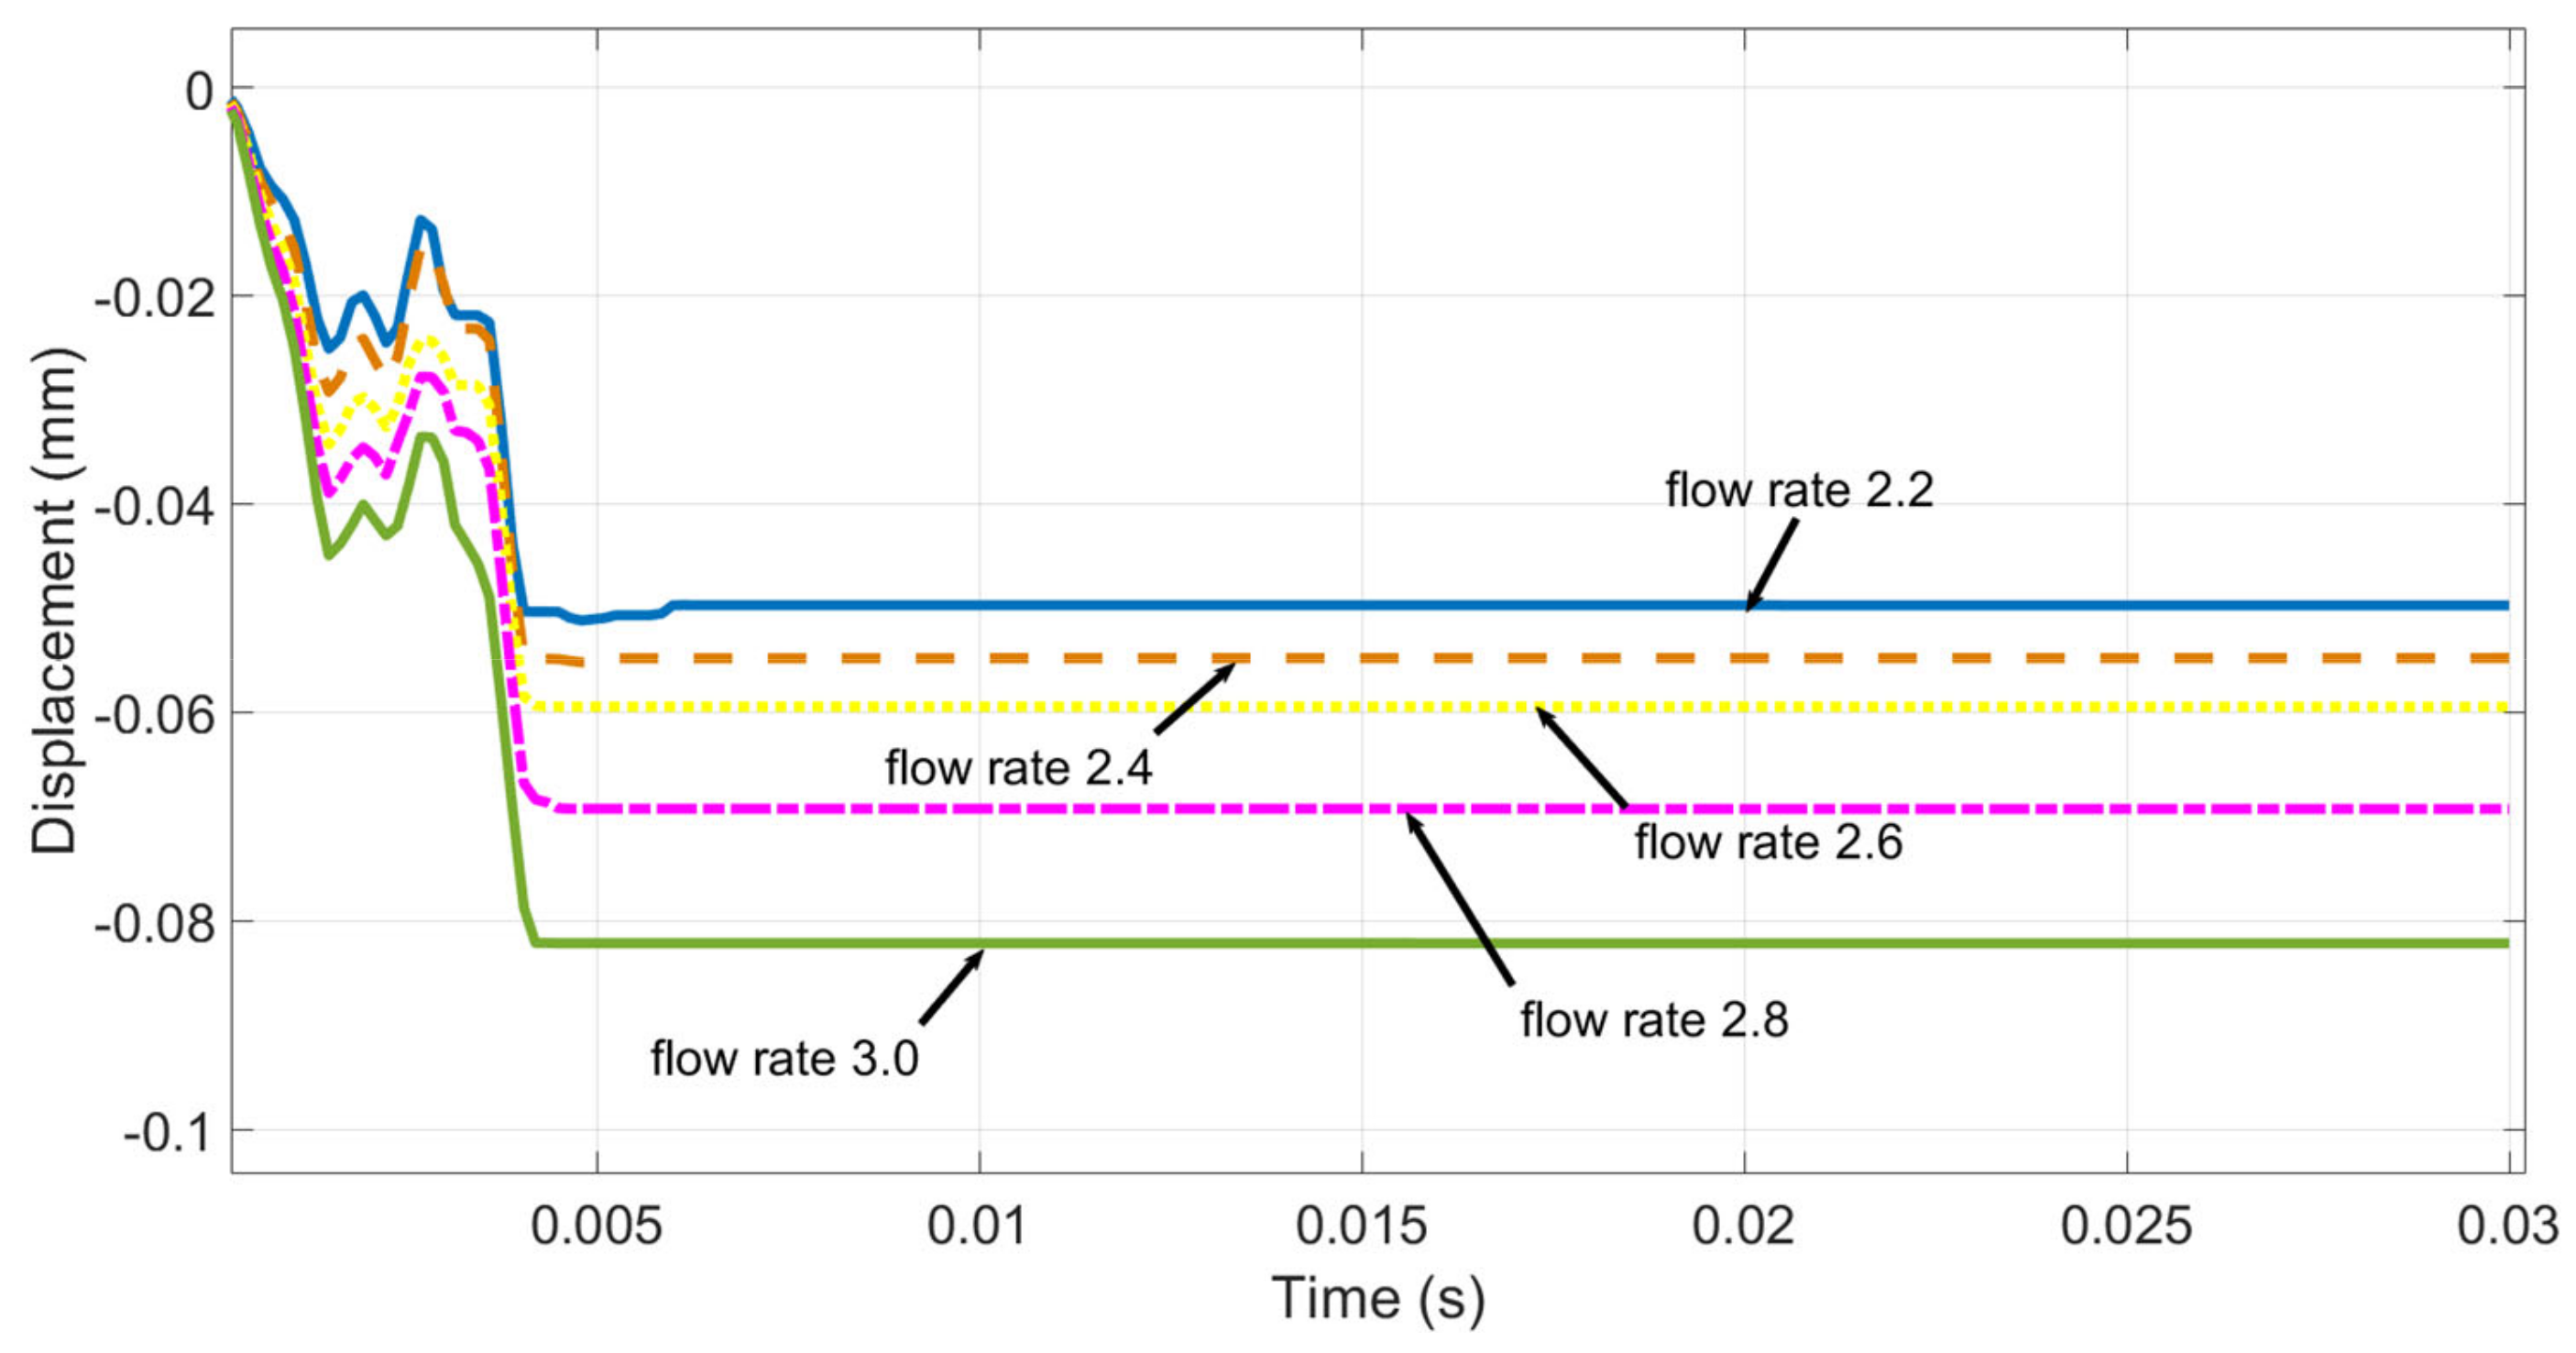
As
Figure 4 shows, the impact force generated by the change of the jet flow momentum acts on the sensor in the X direction, which causes the characteristic point C to be displaced. The displacement curve of characteristic point C in the X direction becomes stable after oscillation adjustment. Under the action of different momentum jets, the oscillation law of characteristic point C is similar, but the amplitude and adjustment time are different. The basic rules are as follows: the greater the initial momentum of the jet, the greater displacement amplitude of the characteristic point C. The greater the jet flow increment, the greater the displacement increment of the characteristic point C, the longer the oscillation stability adjustment time, and all the oscillation adjustment time is less than 5 ms, which indicates that the force
Fsx of the sensor in the X direction become stable after a period of adjustment.
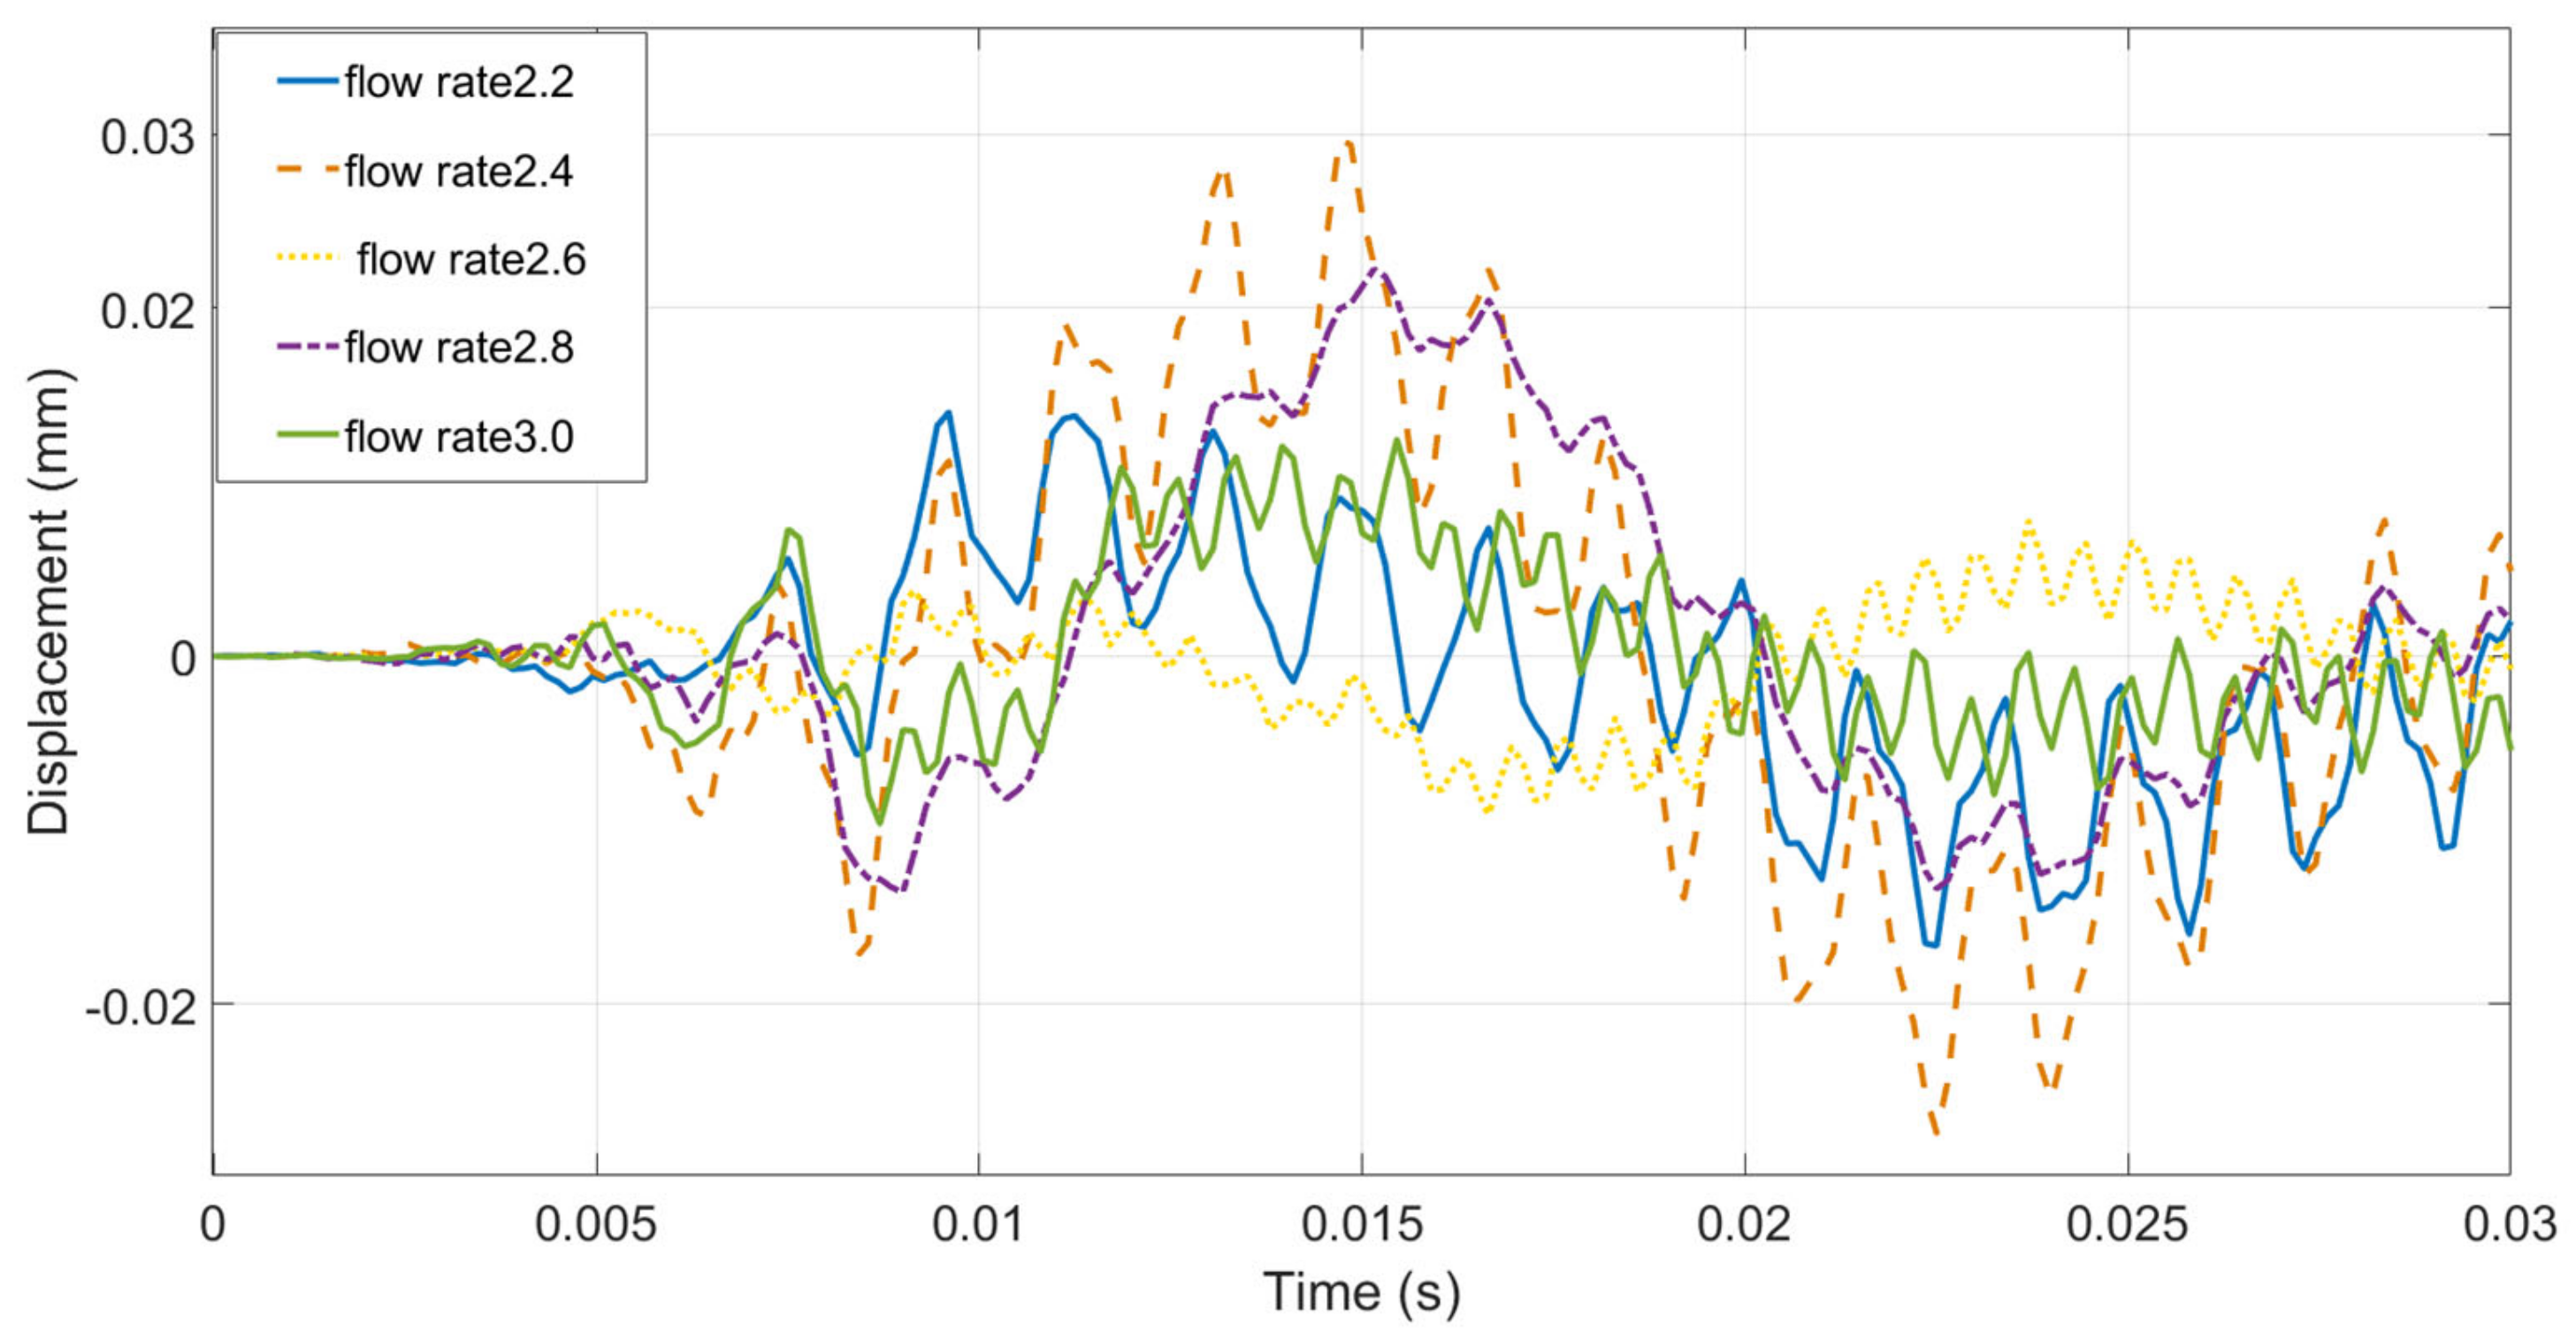
As
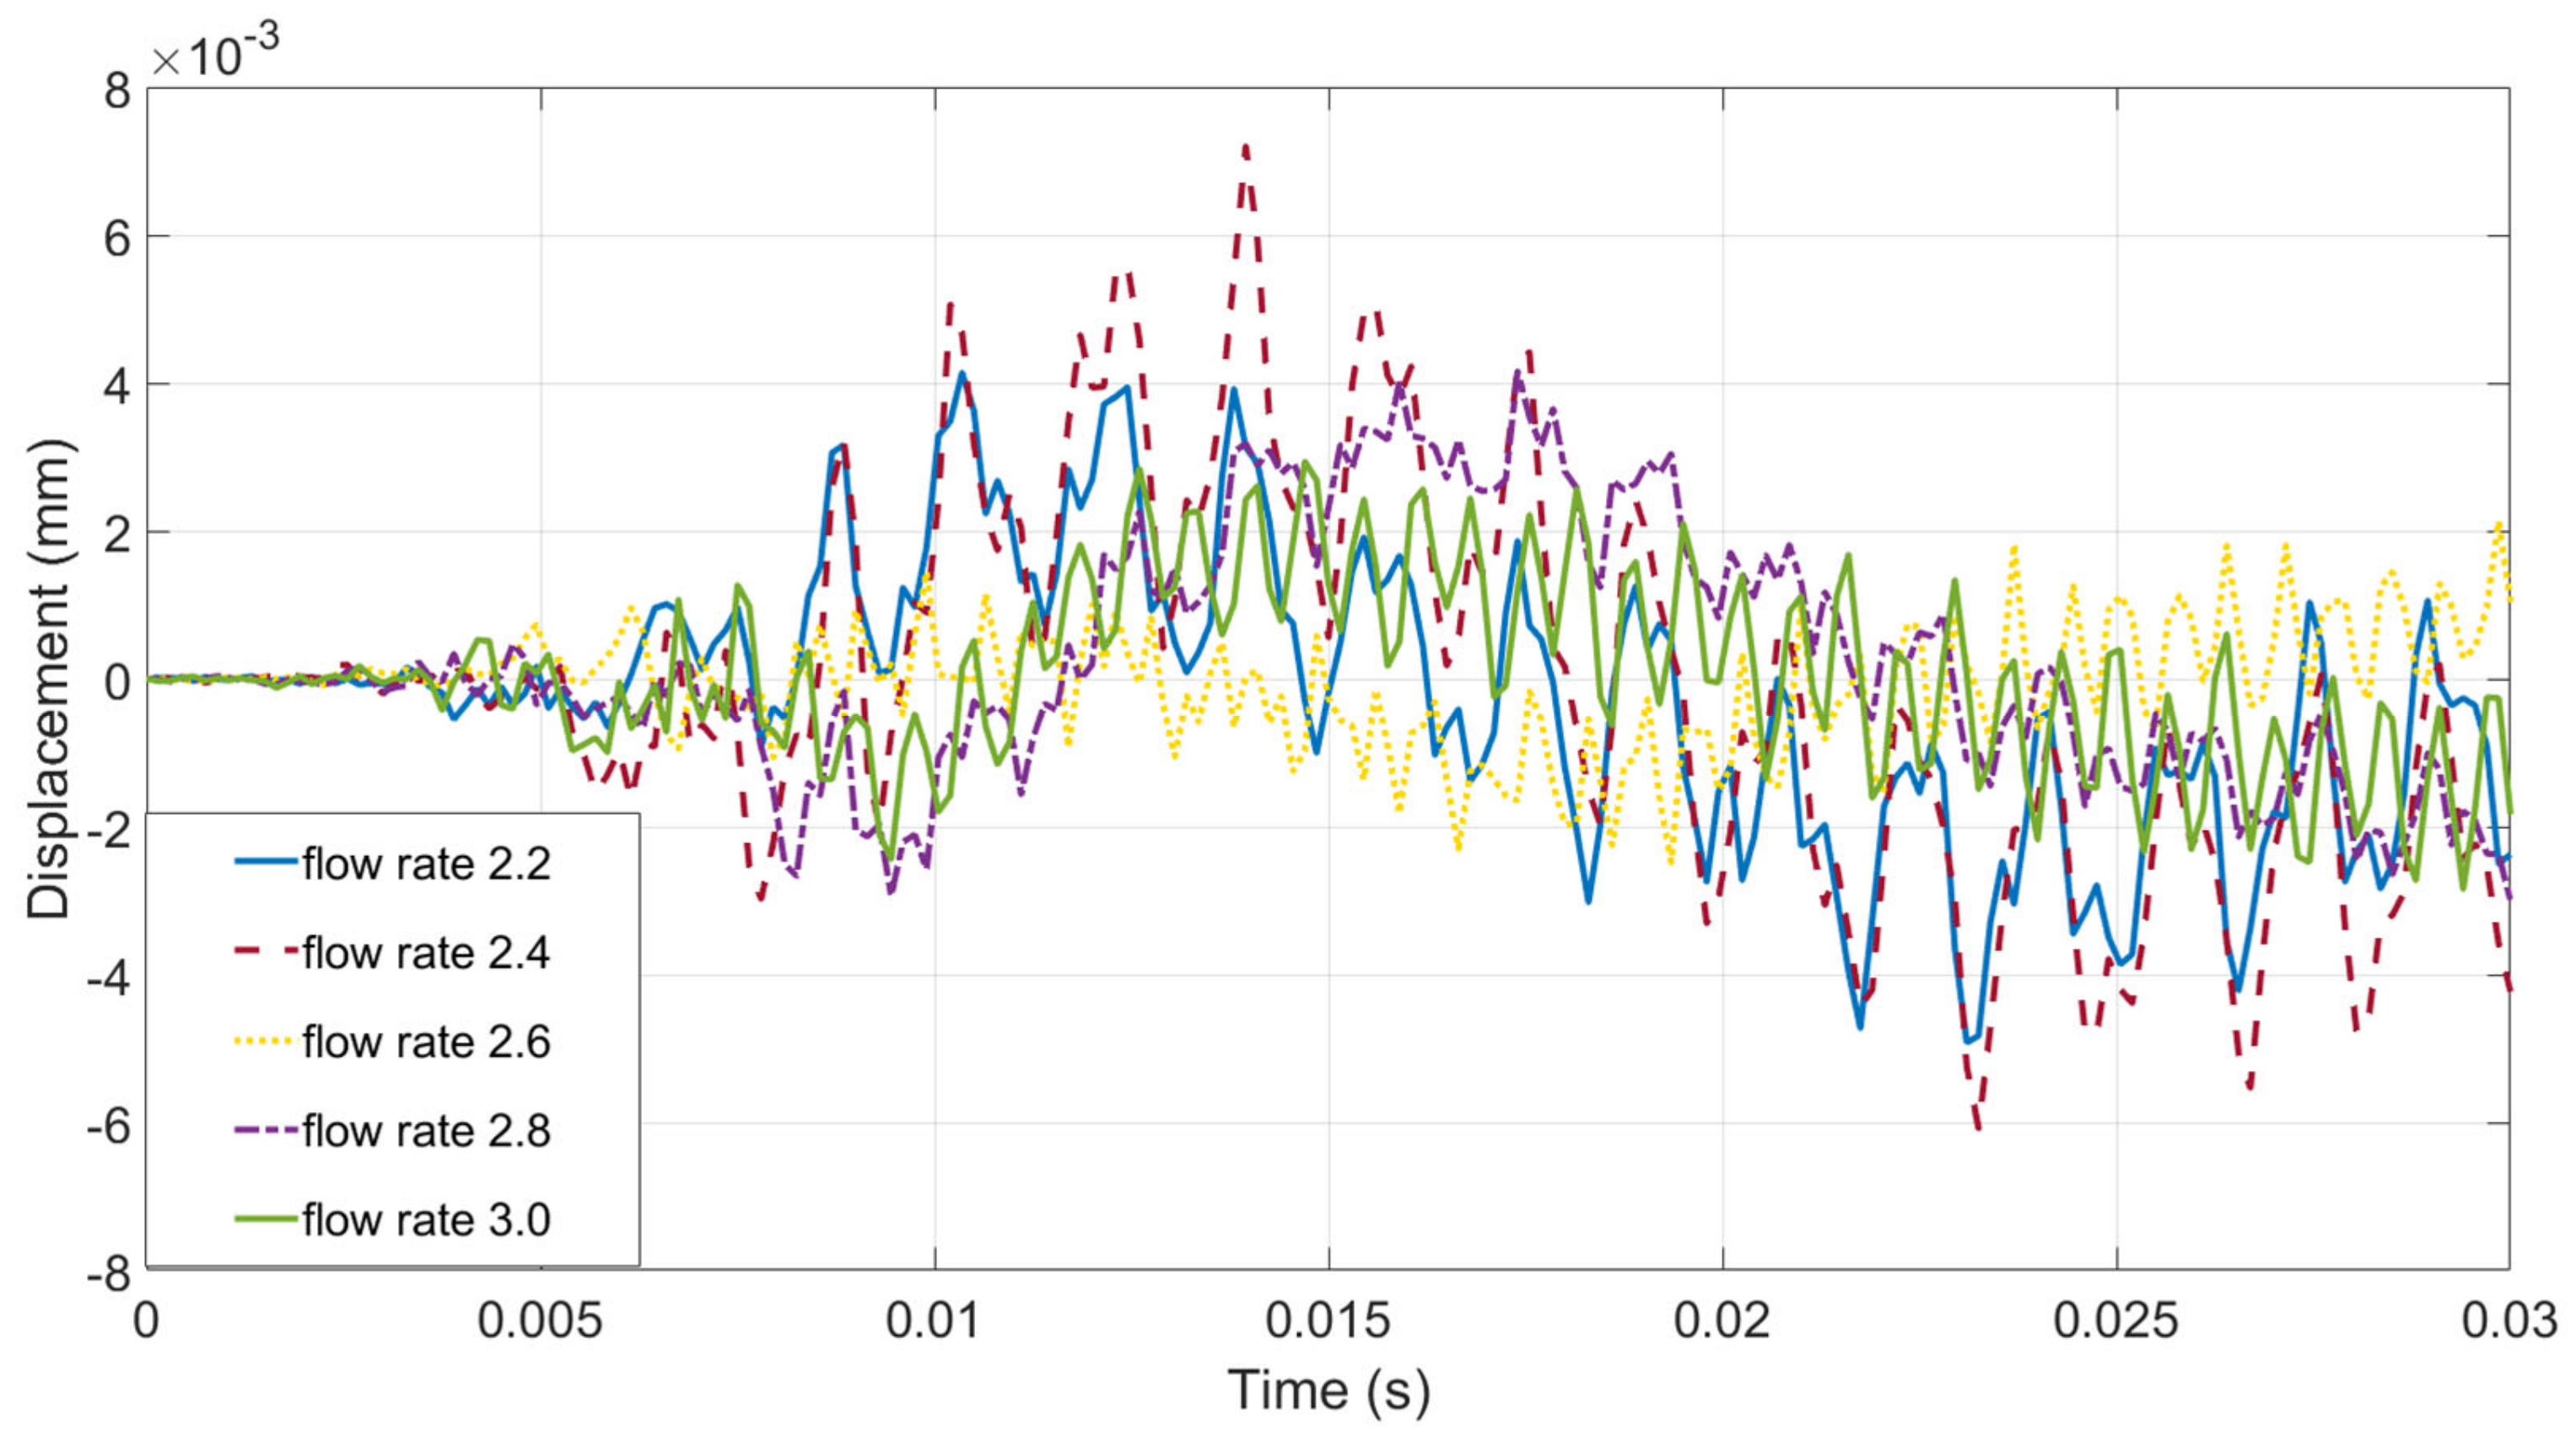
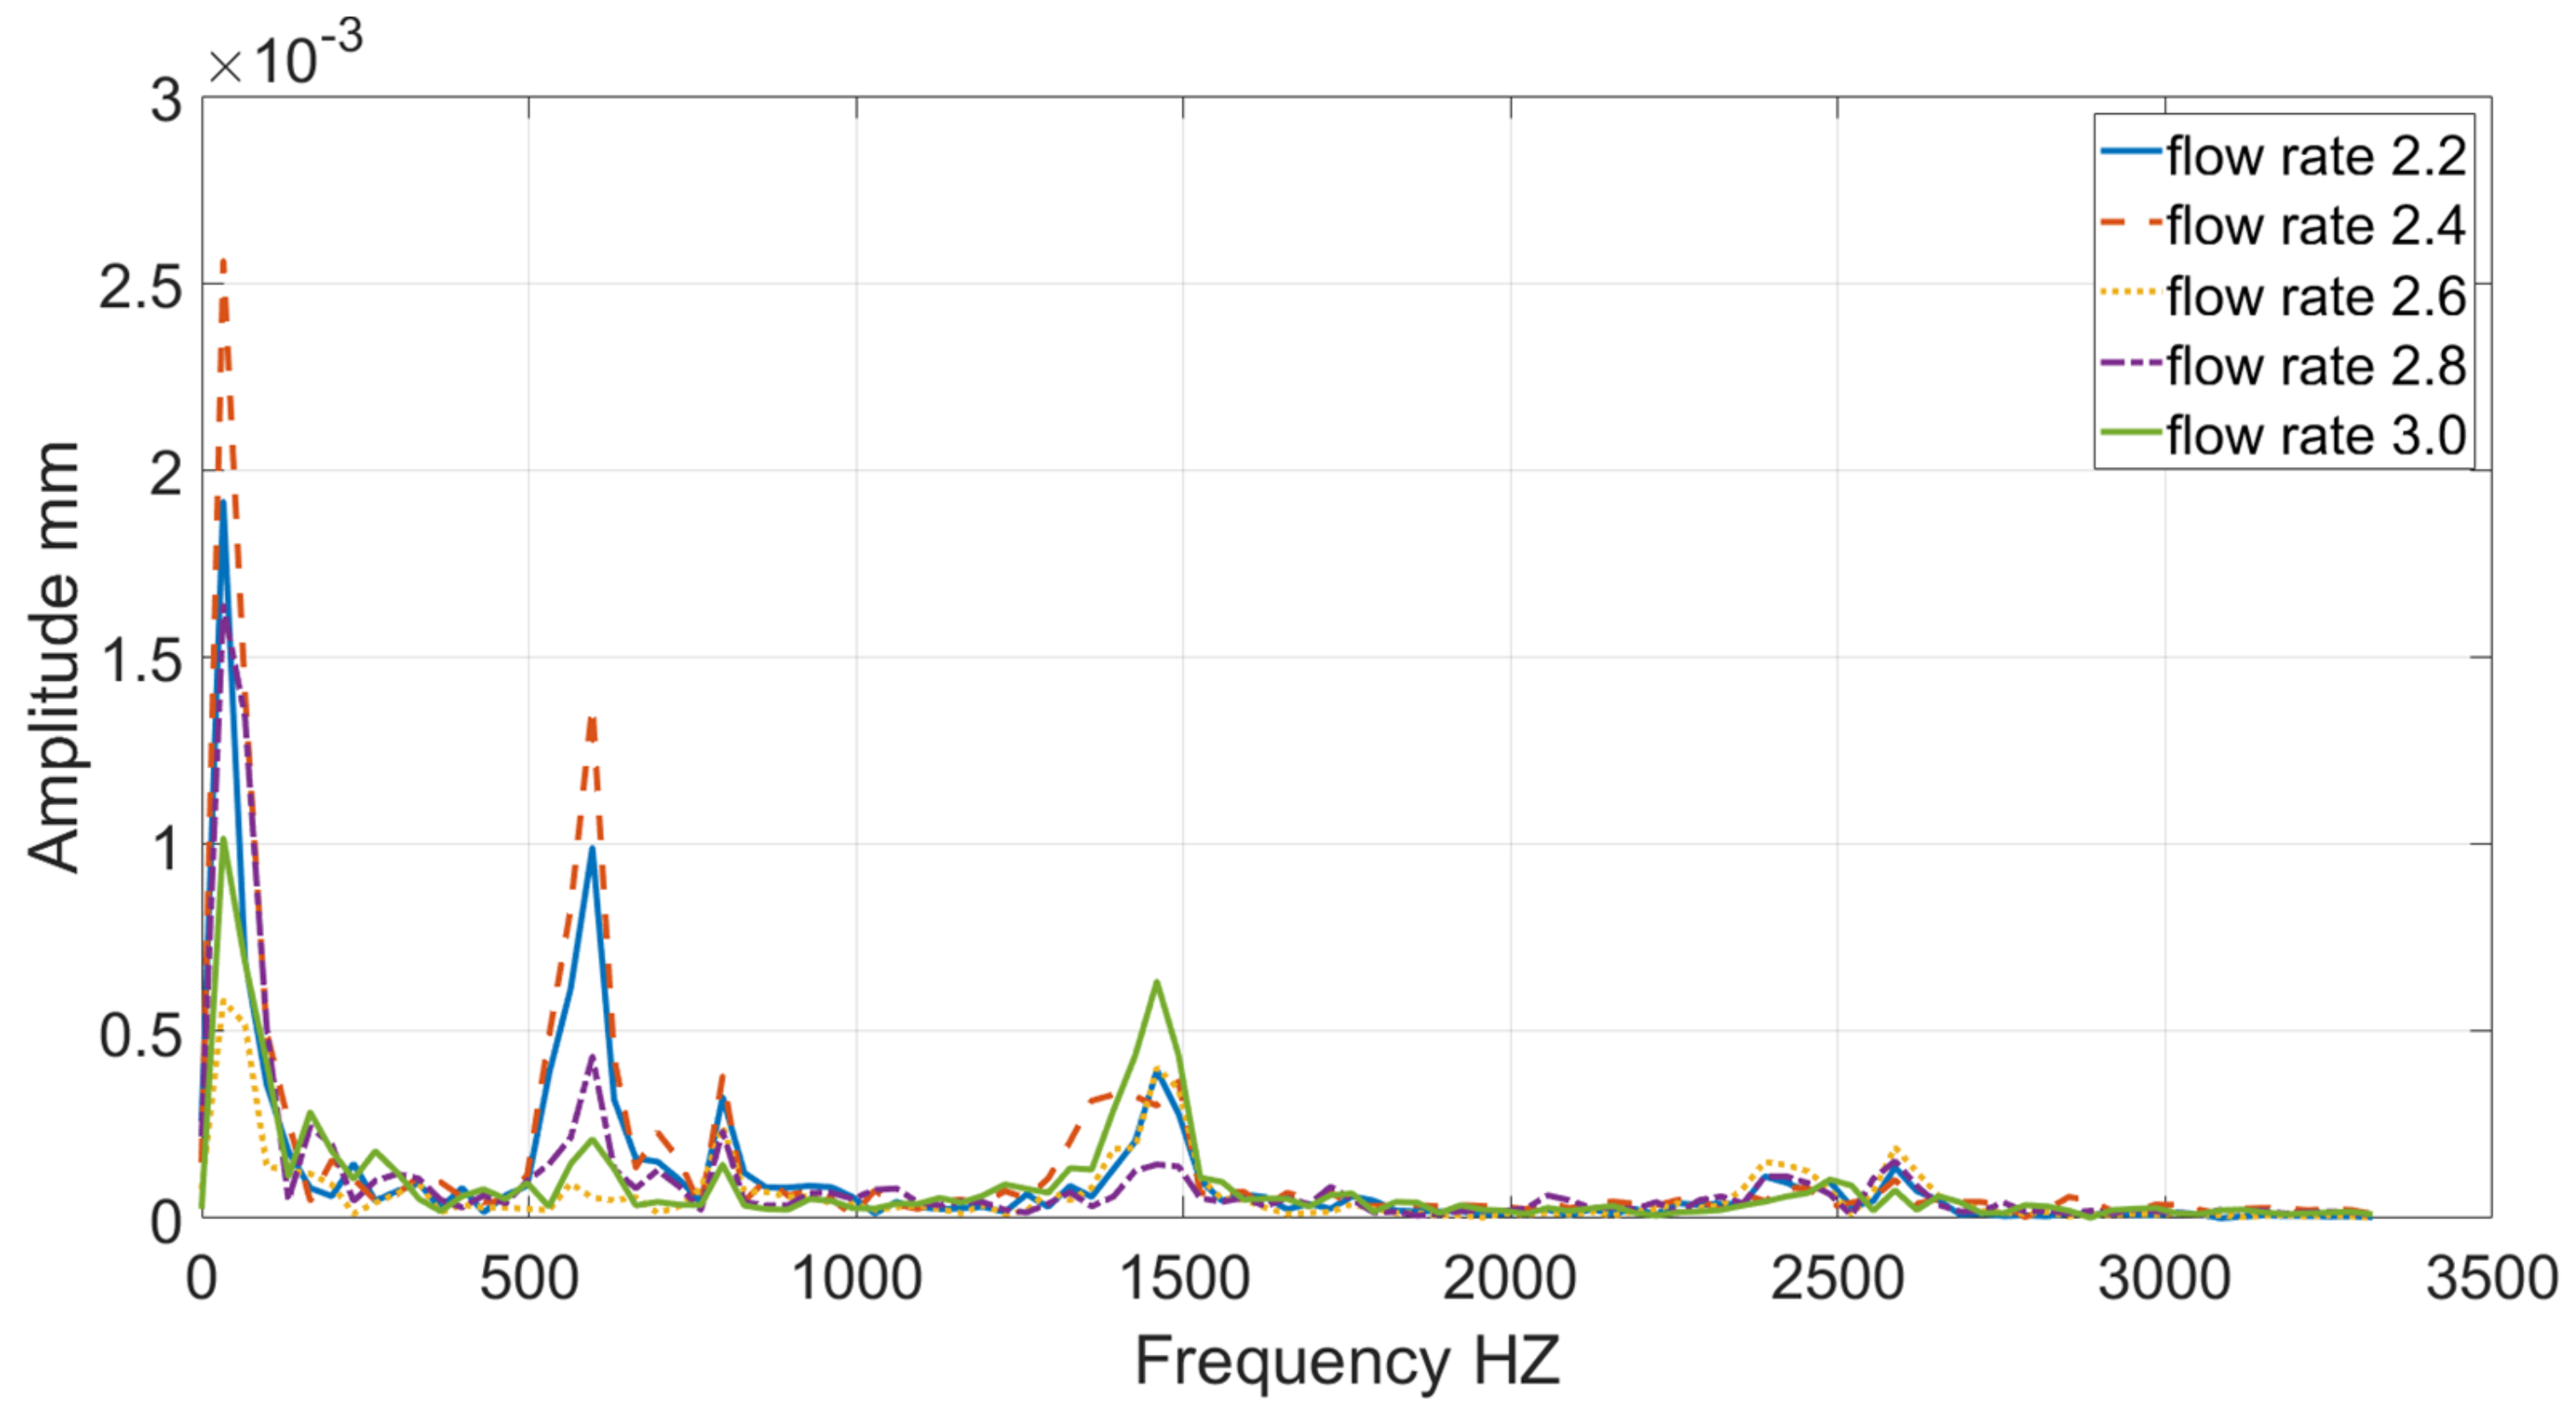
Figure 5 shows, the characteristic point C is subjected to external force in the Y direction, resulting in displacement. The displacement curve of the characteristic point C in the Y direction has a small change in the time range of [0 ms, 5 ms]. After 5 ms, the vibration amplitude gradually increases, and the oscillation continues without a stable trend. This indicates that under the impact of the jet, the sensor first moves in X direction, after the adjustment in the X direction is stable, the sensor in Y direction starts to perform a large oscillation adjustment. Under the impact of different momentum jets, there is a certain difference in the displacement response trend of the sensor characteristic point C. There is no basic law that the greater the jet momentum, the greater the displacement of the characteristic point C in Y direction. In order to further explore its response law, frequency spectrum analysis is performed on the displacement response of the characteristic point C in Y direction, as shown in
Figure 6. Under the impact of different momentum jets, the vibration frequencies of the sensor in the Y direction is similar, and the amplitude is different. The displacement vibration signal in the Y direction is a periodic signal, according to the Fourier transform theory, the periodic signal can be decomposed into a signal group, which is mainly composed of a 0-frequency signal and a set of periodic signals with different frequencies. In this article, the numerical sampling frequency is equal to 6666.7 Hz, the displacement vibration signal in the Y direction could be composed of four signals, including a 0-frequency signal and three sinusoidal periodic signals. The frequency of the periodic signal is distributed in the range of [33,66] Hz, [560,590] Hz and [1430,1460] Hz on the conditions of different flow rates. Taking into account the numerical calculation error and the relatively small range of the frequency distribution interval comparing to sampling frequency, to simplify analysis and calculation, it can be assumed considering that these three periodic signals are the fixed frequency. Take the middle of the frequency range and round up. Then, the frequencies of the three signals are 50 Hz, 580 Hz and 1450 Hz, respectively. As the frequency increases, their amplitudes decrease in turn. The vibration amplitude is the largest when the jet flow rate is 2.4 m
3/h. Comparing
Figure 4 and
Figure 5, it can be shown that the displacement of the sensor in the X direction is significantly greater than the displacement in the Y direction, which indicates that the force
Fsx of the sensor in the X direction is greater than
Fsy.
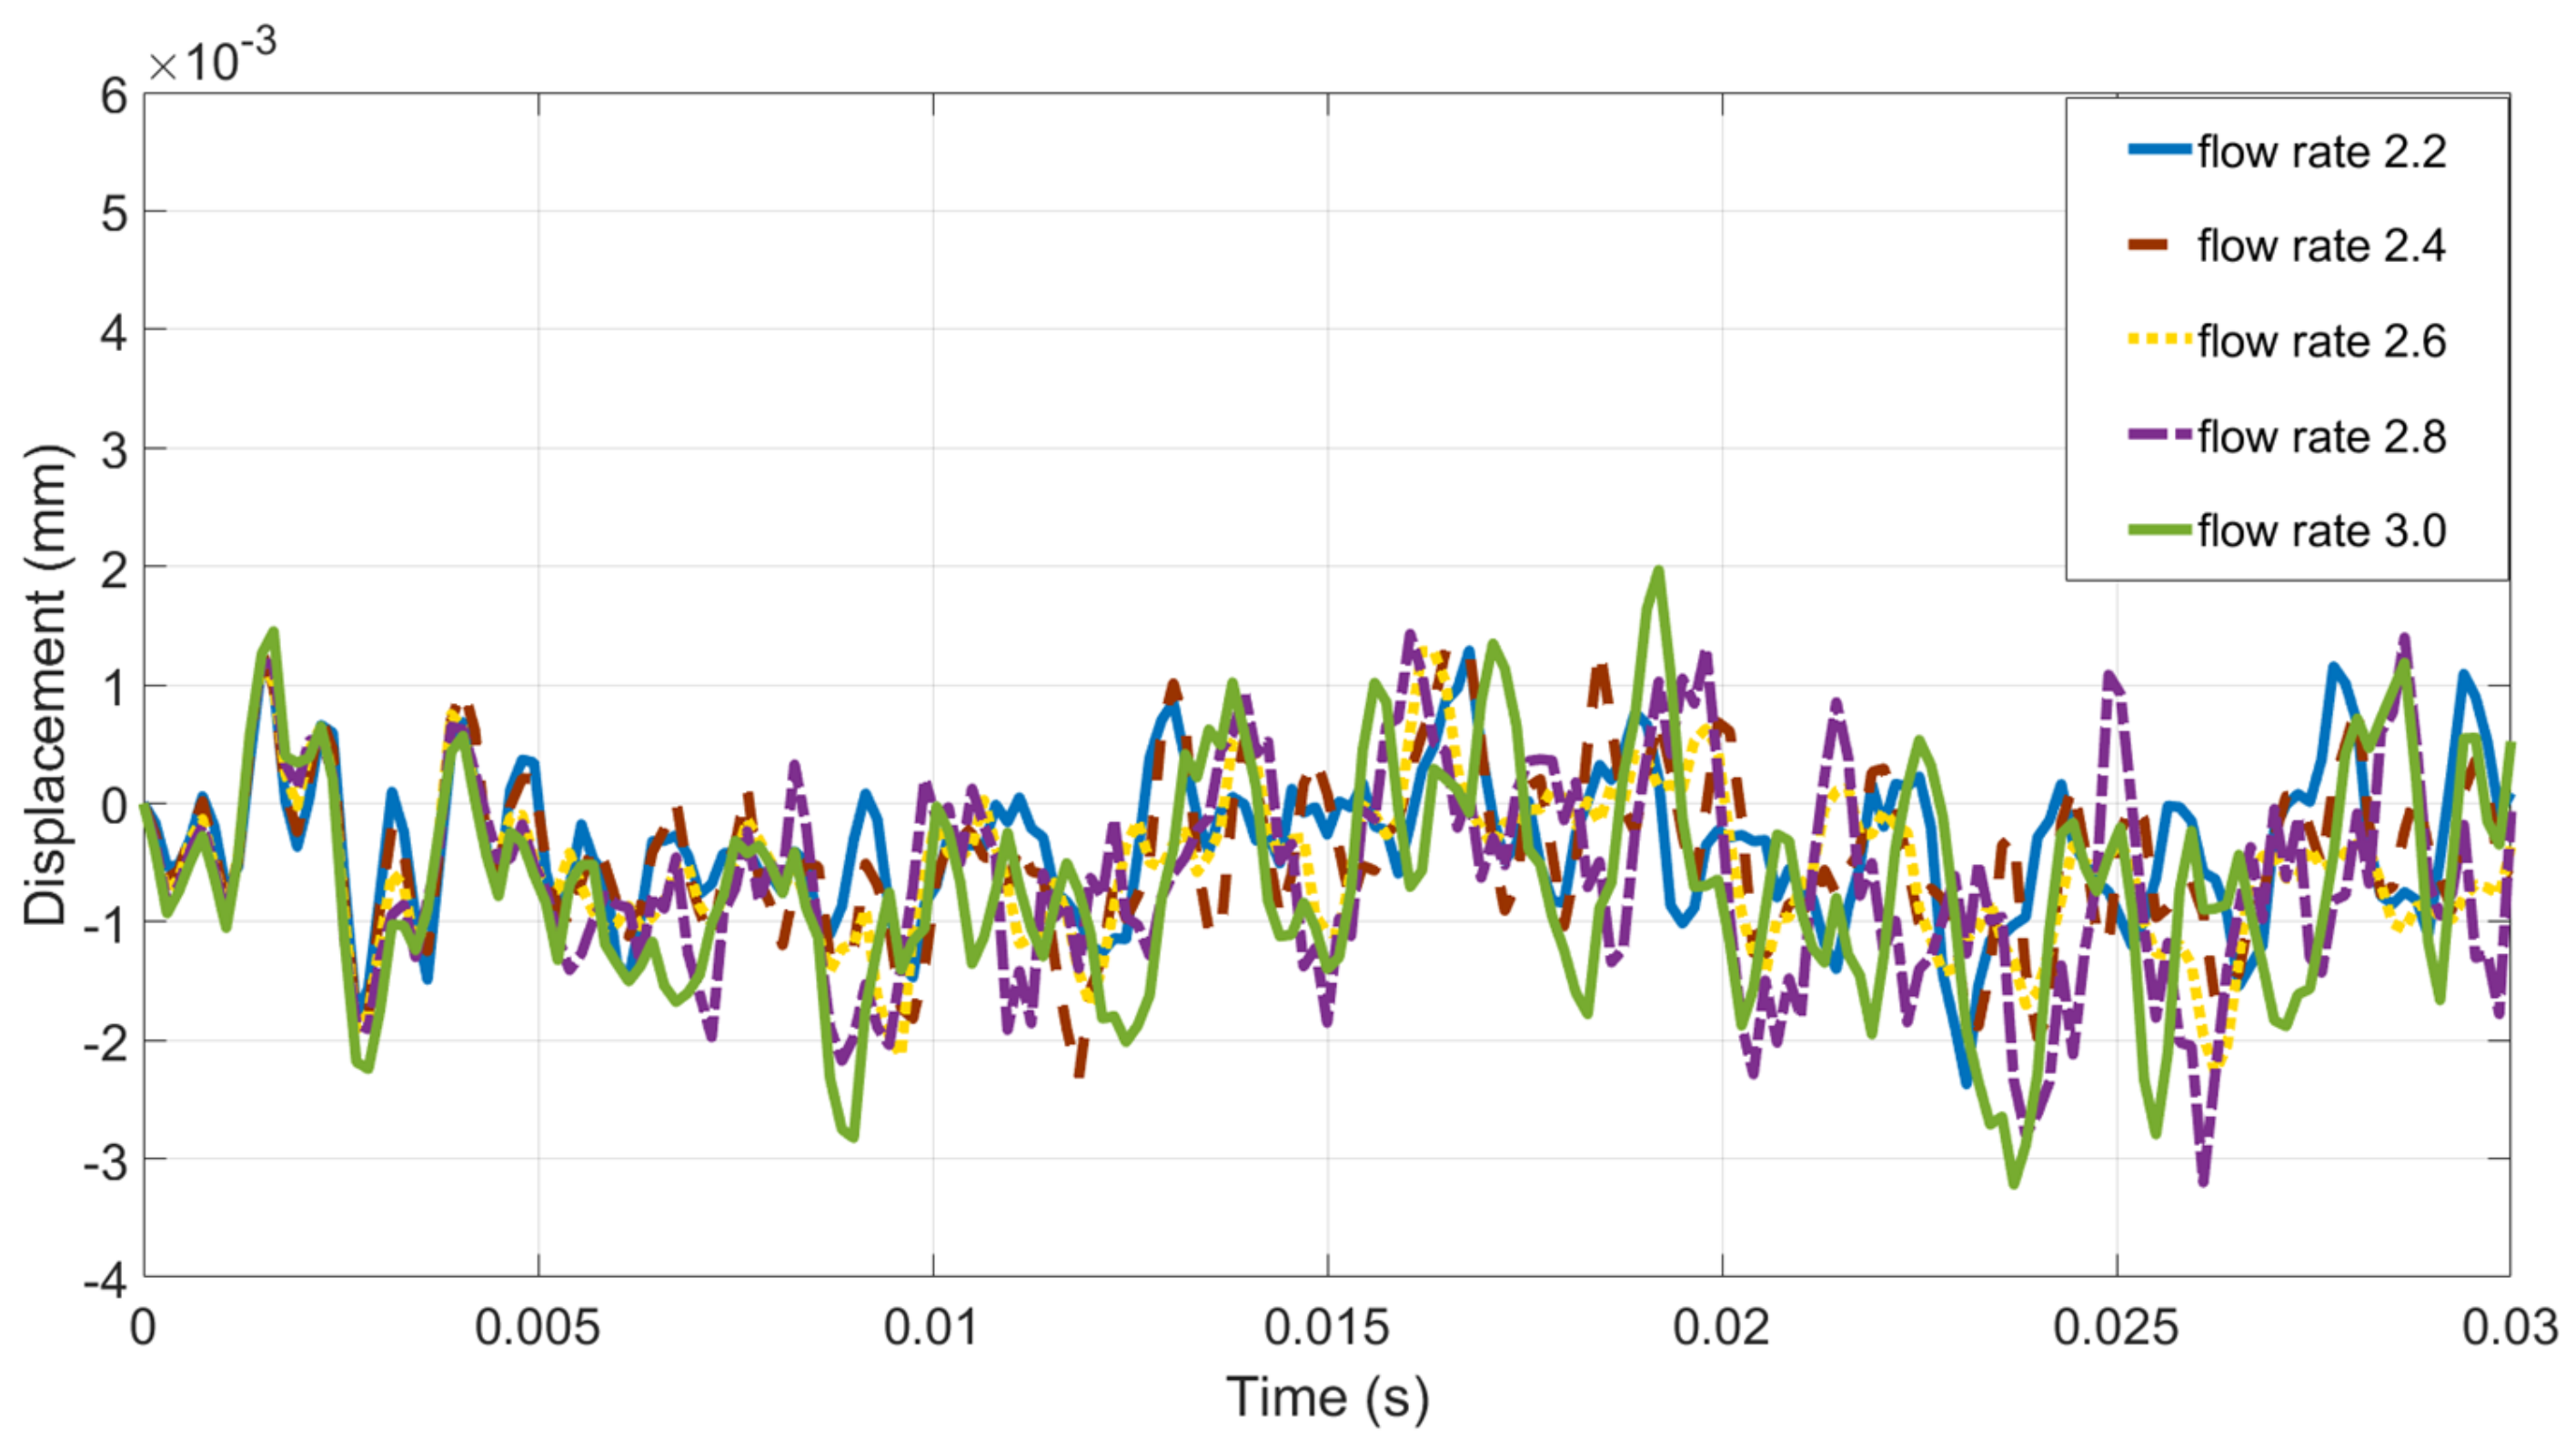
As
Figure 7 shows, under the action of the jet impact force, the characteristic point C of the sensor is displaced in the Z direction, and the displacement curve continues to oscillate. Under the same jet effect, the displacement amplitude in the Z direction is much smaller than the X and Y directions. Under the impact of different momentum jets, the displacements changing trend of the sensor characteristic point C are similar in time [0,5] ms; after more than 5 ms, the displacement changing trends are slightly different. The main reason for this situation is that the displacements and deformation of the sensor in the X and Y directions cause the change of displacement in the Z direction.
From the above analysis of the displacement response characteristics of the sensor characteristic point C under the impact of different momentum jets, it can be shown that under the action of the jet impact force, the sensor first moves in the jet direction (X direction), and tends to be stable. The greater the jet momentum, the greater the displacement in the X direction, and the longer the oscillation adjustment time. The sensor is subjected by non-constant external force in the Y direction to produce continuous vibration, and the vibration in the Y direction is greatly enhanced after the vibration in X direction enters the stable period. The vibration in the Y direction can be decomposed into a 0-frequency signal and three fixed-frequency periodic vibration signals. Under the impact of different momentum jets, the vibration frequency is equal and the vibration amplitude has a certain difference. The displacement of the sensor characteristic point C in the Z direction is mainly the result of sensor’s displacements changing in the X and Y directions, and its displacement amplitude is much smaller than in the X and Y directions. It can be inferred that under the impact of the jet, the sensor first moves and deforms along the jet direction (X direction) and performs oscillation adjustment. After the jet direction (X direction) is finished and stabilized, periodic vibration occurs in the Y direction. The vibration in the Y direction is the main measurement error source.
4. Error Characteristic Analysis
The analysis in
Section 3 shows that, under the impact of the jet, the sensor vibrates in the three directions of X, Y and Z. Combined with the relevant research that has been carried out, the transverse deformation caused by the irregular vibration is the main measured error source of resistance strain sensor. Considering the measurement principle and error theory of the resistance strain sensor, the relative displacement of the characteristic point C of the sensor relative to the point E is taken as the deformation
s of the strain gauge, and the jet impact force obtained by the sensor expressed as
F =
f(
s), which is monotone increasing function [
14].
The achieved studies have shown [
14] that the impact force value measured by the sensor consists of a fixed value and a variable value. The displacement in the X and Y directions, respectively, affect the fixed value and the variable value measured by the sensor. The basic form of the impact force measurement value is:
c(
t) +
g(
t), where
c(
t) represents a fixed value,
g(
t) represents a variable value;
g(
t) =
A0 +
A1sin(
w1t +
φ1) +
A2sin(
w2t +
φ2) +
A3sin(
w3t +
φ3);
A0,
A1,
A2,
A3 represent the amplitude of the 0-frequency signal and three period signals, respectively. Under the impact of different momentum jets, the relative displacement or deformation of the sensor characteristic point C in the X and Y directions are shown in
Figure 8 and
Figure 9, respectively.
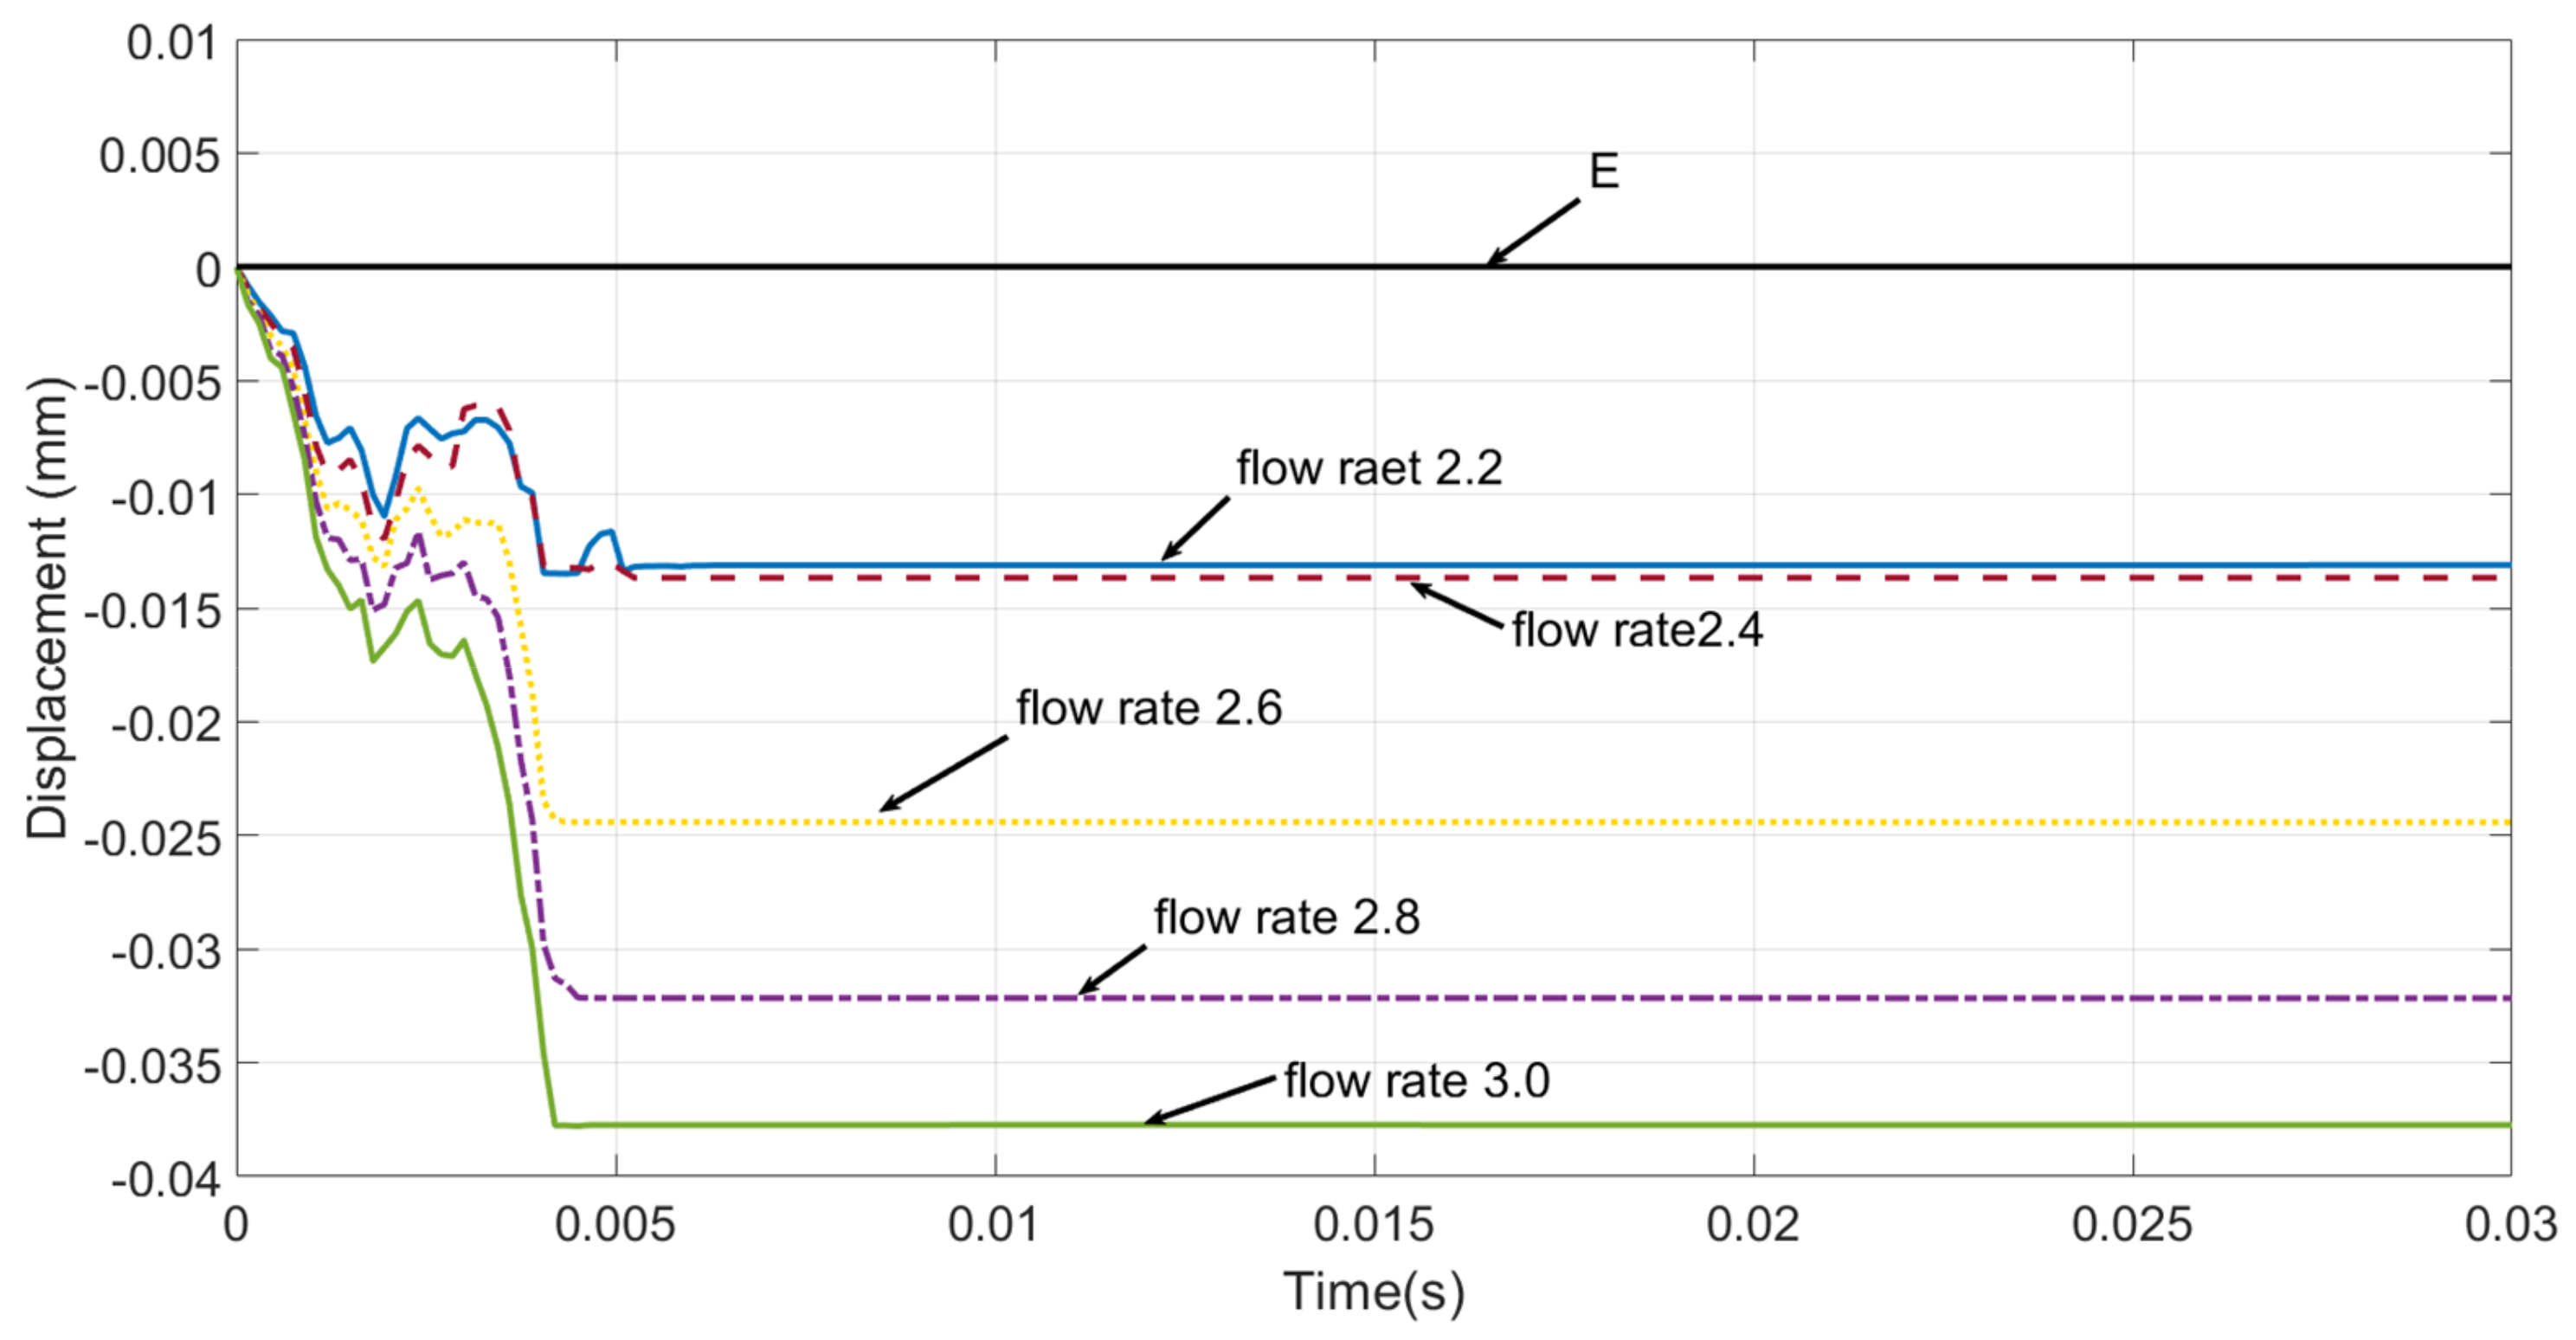
As shown in
Figure 8, under the action of the jet impact load, the sensor strain gauge undergoes relative displacement and deformation in the X direction and tends to be stable after oscillation adjustment, that is,
c(t) tends to be a constant value after adjustment. The deformation
sx of the sensor strain gage in the X direction and the jet flow are in a monotone increasing relationship, that is, the strain gauge deformation
sx increases with the increase of the jet flow. However, the trend of the strain gauge deformation increment ∆
sx and the jet flow increment are different. The manifestation mode is that, as the jet flow increases, the influence of the jet flow increment on the increment of ∆
sx gradually decreases. The reason for this phenomenon is that the greater the jet flow, the greater the impact it produces. Since the sensor and the base structure are arranged in a cantilever beam structure, the greater the deformation, the greater the displacement of point E, and the resulting increase in the relative displacement of the two points C and E decreases. The result is that the deformation of the sensor strain gauge is reduced. Above all, it can be inferred that in the jet impact direction, a linear system error is caused by the deformation of the base; the larger the jet flow, the greater the linear system error caused by the deformation of the base. The linear error can be reduced by increasing the stiffness of the base [
26].
As shown in
Figure 9 and
Figure 10, the sensor strain gauge undergoes relative displacement and deformation in the Y direction under the action of the jet impact load. Within [0 ms, 5 ms], the displacement and deformation are basically 0. After 5 ms, it will continue to vibrate without stability. The vibration trend of strain gauge deformation is the same as the related analysis results in
Section 3, and the amplitude of sensor strain gauge deformation
sY in the Y direction is still smaller than
sx, that is,
sx >
sY.
The continuous periodic vibration in the Y direction causes the deformation of the sensor strain gauge in the Y direction to change periodically, and the error caused by
sY is a periodic systematic error [
26]. Comprehensively considering the vibration characteristics of the sensor, it is important to simplify the deformation
sY of the sensor strain gauge in the Y direction and accumulate the absolute value of each signal amplitude in the spectral characteristics of
sY, as the maximum value of
sY, that is,
sYmax =
sum(
A0, A1, A2, A3). According to the two-way response characteristics of strain gauges and the theory of lateral error, the calculation method of periodic system error caused by the sensor lateral effect can be expressed as [
14,
27]:
In Formula (6), δ represents relative error; k represents the transverse sensitivity coefficient; εx represents the strain in the X direction of the strain gauge; εy represents the strain in the Y direction of the strain gauge; μ1 represents the Poisson’s ratio of the strain gauge material.
The deformation
sY/
sX of the characteristic point C on the sensor is equivalent to
εx/
εy. After the sensor is stabilized in the jet direction (X),
sX is a fixed value, and assumed as the strain gauge Poisson’s ratio
μ1 = 0.3. Take a different value for
k and estimating the error of the sensor under the different jets impacts the load, as shown in
Table 4. It can be seen from
Table 4 that the larger lateral sensitivity coefficient
k of the sensor, the larger measurement error. Under the same sensor parameter conditions, the larger jet flow, the smaller relative error.
The experiment on the apparatus is measured on the condition to the same as numerical parameters. The test data is shown in
Table 5, which is similar to the estimated error (
Table 4). Comparing the sensor estimated error (
Table 4) and measured error (
Table 5), it shows that most of measured errors are in the area that is ranged by estimated error. The result shows that the difference between the estimated error and the measured error is small, and the error analysis and estimation methods used in this article are effective. The reasons for the difference between the estimated error and the measured error are as follows [
14,
27,
28,
29,
30]:
Ignoring the linear system error caused by the deformation of the jet direction base;
Error compensation inside the sensor;
Sensor measurement error caused by temperature and humidity;
The displacement response of point C cannot fully reflect the true change of the strain gauge;
The jet velocity changing caused by the pulsation of pump flow during the actual measurement;
The difference between the calculation model, material properties, etc. and the real system.
Comprehensive analysis shows that the experimental system error consists of two parts, namely, the linear system error caused by the jet impact direction (X direction) base deformation and the periodic system error caused by the sensor’s Y direction periodic vibration and lateral effect. The linear error caused by the deformation of the base increases with the increase of the jet flow. The system error can be reduced by increasing the stiffness of the base; the measurement error caused by the lateral effect decreases with the increase of the jet, and the measurement error can be reduced by sensor correction.
5. Conclusions
This paper takes the jet impingement type momentum law experimental device as the research object, combined with the actual operation of the experiment, adopts the SPH-FEM numerical analysis method to analyze the displacement response characteristics and deformation characteristics of the characteristic point C of the sensor structure under different momentum jet loads. Based on these, the error cause, error classification, changing law, error scope and influence are analyzed and calculated, comparing with the experimental results, and the validity of the analysis and calculation method is verified. The conclusions obtained from the above analysis are as follows:
Under the action of jet impact, the sensor structure vibrates and produces displacement and deformation. The jet direction (X direction) vibrates first and stabilizes after oscillation adjustment. After the vibration of the jet direction is stable, the non-jet Y direction starts periodic vibration;
Among the vibrations in the non-jet direction, the vibration in the Y direction is the main source of error, and the vibration in the Z direction is mainly caused by the deformation caused by the vibration in the X and Y directions;
The linear error of the system is mainly caused by the deformation of the base in the jet direction (X direction), and its size is positively related to the jet load. The linear error can be reduced by improving the stiffness of the base;
The periodic error of the system is mainly caused by the periodic vibration in the Y direction and the lateral effect of the sensor. Its magnitude is negatively related to the jet load. The periodic error can be reduced by the method of sensor correction.
The analytical methods used and the conclusions obtained in this article, which have been partially applied to the experimental teaching of undergraduates to provide help for students to understand the causes of experimental errors.


