Abstract
The performance of a wind turbine generator (WTG) is highly dependent on the interaction of a rotor blade with complex fluid behaviors, especially the induced vortex structure. In this paper, vortical flows around a blade were first investigated by the unsteady Reynolds averaged Navier–Stokes (RANS) simulation with shear stress transport (SST) turbulence model. It showed that the vortical flows were strongly formed at the blade tip due to the 3D behavior of the boundary layers dominated by pressure gradient. The strong secondary flow was also formed at the near hub due to the Coriolis force and the centrifugal force. At the interacting region of the rotating blade with the tower, the power production was reduced by 22.1% due to the high-pressure fluctuation of the 3P frequency. Based on the close investigation, methods for enhancing the power performance of a WTG were explored, which included the optimization of winglet and ogee design for the blade tip and optimal layout of the nacelle anemometer. The optimized winglet achieved the increase of aerodynamic performance with 0.54%, and the optimal location of the nacelle anemometer was found with a low-turbulence intensity level of 0.003 normalized by the rotor tip speed. The results showed that the traditional anemometer needs to consider the intrinsic flow angle of 11.43° to avoid the loss of aerodynamic performance caused from yaw error.
1. Introduction
Over the last few decades, wind energy has been attracting great attention as an alternative energy resource to limit climate changes caused from fossil fuels. The total energy capacity of the existing wind energy conversion system has grown from 23.9 GW in 2001 and to 591 GW in 2019; approximately a 25-times increase has been achieved, and there is still a strong demand as it is one of the promising sustainable energy systems internationally. Even up to 1787 GW capacity by 2030 is expected along with the reduced levelized cost of energy (LCOE) through the improved technologies, including better understanding of fluid behavior, composite materials, and blade design [1,2,3,4].
Wind turbines generally consist of three main components such as the rotor blade, nacelle, and tower. A rotor blade is the most important component to harvest energy from wind efficiently. A recent rotor blade enhances the power performance with an increased blade length and improved aerodynamic design of the blade, achieving higher annual energy production (AEP) while satisfying aerodynamic thrust force constraints [5]. Most wind turbine rotor blades of horizontal axis wind turbines (HAWT) have been basically designed by blade element momentum theory (BEMT) with the wind tunnel experiment data of airfoils [6]. However, it is difficult for BEMT to evaluate the three-dimensional aerodynamic effect of the rotor resulted from three-dimensional flow fields [7,8,9]. Recently, along with the evolution of computing power, the numerical approaches from computational fluid dynamics (CFD) can accurately evaluate the aerodynamic performance of the rotor blade within the three-dimensional flow fields [10,11,12]. Although vortical flow phenomena in the wind turbine were addressed by previous studies, the detailed three-dimensional structures and relationship between vortical flow phenomena and aerodynamic performance were not completely addressed [13]. With the detailed investigation of accurate three-dimensional (3D) vortical flows around a rotor blade, it is possible to explore the ways to increase the power performance while reducing aerodynamic loads.
In this paper, the detailed three-dimensional vortical flow phenomena and the aerodynamic characteristics were first investigated by the unsteady Reynolds averaged Navier–Stokes (RANS) simulation with the shear stress transport (SST) turbulence model in a high resolution scheme [14,15,16]. Then, based on the closed investigation of vortical flows, the blade tip designs such as winglet and ogee types were proposed and optimized to improve aerodynamic performance while lowering thrust force on the structure. Additionally, the flow angle and turbulence intensity were investigated to find out the optimal location of the nacelle anemometer related to yaw error, which could be lowered by considering the intrinsic error of flow angle passing the anemometer device of a wind turbine generator (WTG) [17,18,19].
2. Numerical Analysis Model
This section describes the design specifications of the main components such as the blade, nacelle, and tower in the wind turbine generator and defines the numerical model for the three-dimensional CFD analysis including boundary conditions, grid size, and turbulence model [20].
2.1. Design Specification of a WTG Model
The current study was conducted to investigate the three-dimensional vortical flow phenomena in the wind turbine having 3 rotor blades, nacelle, and tower. Figure 1 shows three-dimensional wind turbine model which consists of blade shape in the spanwise direction designed with DU and NACA airfoil series [21] and a wind turbine information used to GH Bladed.
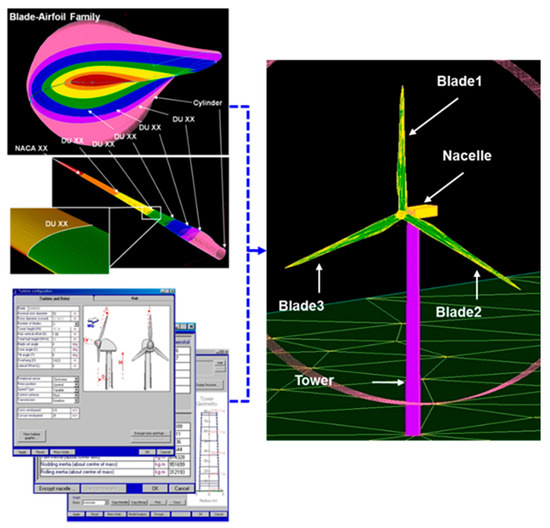
Figure 1.
Three-dimensional wind turbine model.
As shown in Figure 1, the airfoil thickness ratio near the rotor hub is much higher than that near the rotor tip, which results in greater blade stiffness and lower aerodynamic efficiency.
Due to this reason, optimization of the airfoils at the blade root was aimed to maximize higher aerodynamic efficiency while satisfying greater thickness [22]. Design specifications of the rotor blade, nacelle, and tower are listed in Table 1 and Table 2.

Table 1.
Design specifications of the rotor blade.

Table 2.
Design specifications of nacelle and tower.
2.2. Grid Size and Boundary Conditions
For CFD simulation of a full-scale WTG in ANSYS CFX software, grids were defined according to the rotating frame (rotor blade) and the stationary frame (nacelle, tower) as shown in Figure 2.
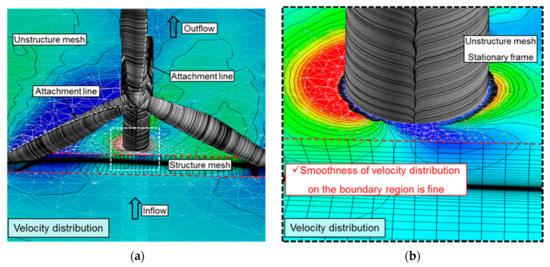
Figure 2.
Grids by sliding mesh method and velocity distribution. (a) Overall view, (b) enlarged view on the boundary region.
Considering the relative motions between the rotating frame and the stationary frame, a sliding mesh method was applied to the present analysis [23]. As shown in Figure 2b, the velocity distribution of the sliding mesh boundary region was smoothly formed by the sliding mesh technique. Structured H-type grids were adopted in the rotating frame in order to evaluate the aerodynamic performance of the wind turbine with high accuracy. The computational grids of a blade passage in the rotating frame consist of 115 cells in the streamwise direction, 140 cells in the spanwise direction, and 148 cells in the tangential direction. However, the stationary frame area excluding the rotor blade was too large to apply the structure grids. Due to this reason, the computational grids of the stationary frame are composed of 3.04 × 10⁶ un-structured tetrahedral cells, and the total number of whole computational grid systems is approximately 1.028 × 10⁷ cells [24].
Figure 3 shows the whole computational domain. The distance from the center of the rotors to the inlet boundary is four times longer than the rotor radius. This distance is enough to avoid interaction between the pressure field around the rotor blade and the inlet boundary condition with a wind speed in the direction perpendicular to the rotating plane, that is, the yaw angle of 0°. The uniform wind speed has a wind shear profile, , as below.
where V() is the wind speed at hub height and H is the height from ground.
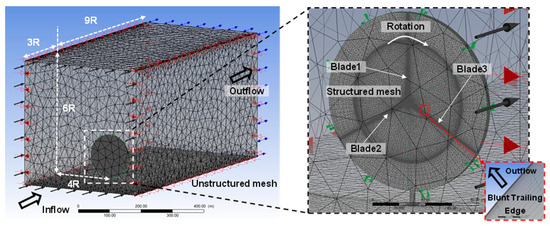
Figure 3.
Whole computational domain for computational fluid dynamics (CFD) analysis.
The distance from the center of the rotors to the outlet boundary is ten times longer than the rotor radius to capture the complicated and vortical flow phenomena of wake precisely. The outlet boundary condition was adopted as atmospheric pressure. Free-slip and no-slip boundary condition was applied to the ceiling surface and the wall surface of the rotor, nacelle, tower, and ground, respectively.
2.3. Turbulence Model
Numerical simulation techniques of turbulent flow are typically divided into DNS (direct numerical simulation), LES (Large Eddy Simulation), and RANS (Reynolds averaged Navier–Stokes simulation) [25]. DNS resolves all range of spatial and temporal scales of the turbulence. Because the grid and time scales of DNS need to be less than the Kolmogorov scale, that is, the smallest dissipative scales, the DNS requires fine grids and small time intervals. LES solves spatially filtered Navier–Stokes equations on coarser grids. Thus, the LES does not resolve the entire scales of the turbulent flow. LES resolves only large scales of the turbulent flow. Small scales of the turbulent flow are modeled using sub-grid scale (SGS) models by Smagorinsky [26]. RANS solves the time averaged Navier–Stokes equations and models all the scales of the turbulence using turbulence models such as k-ε, k-w, and SST.
Assuming that computing cost of the RANS is equal to be one, that of the DNS and LES increases as the cube and square of Reynolds number, respectively. Since Reynolds number based on the rotor tip speed and rotor tip radius of the present wind turbine is 2.25 × 10⁸, the DNS and LES are not feasible methods. For the current wind turbine analysis, the RANS simulation is preferably selected because it is very practical and affordable engineering solutions with good knowledge of the turbulence [27,28].
The turbulence model for the RANS equations computes the Reynolds stresses tensor from turbulent fluctuations in fluid momentum. The turbulence models like the k-ε, k-w, and SST have become industry standard models and are commonly used for most types of engineering problems, although k-ε model has the weakness in cases of large adverse pressure gradient and k-w model is too sensitive to the inlet free-stream turbulence properties [29]. For current work, the SST model was selected because it uses the k-ε model in the free-stream and the k-w model in the viscous sub-layer [30]. The minimum grid scale on the rotor surface was set to 0.05 mm to capture the laminar to turbulent flow transition with SST turbulence model. Additionally, the high-resolution option for advection and turbulence was selected for the numerical scheme in the CFX setup, and the second order backward Euler scheme was taken for transient term.
The normalized time, Δt*, interval of the simulation was set to 0.0323, which was normalized by the rotor tip speed and rotor tip radius as below.
where Δt is the time interval, is the rotor tip speed, and R is the rotor tip radius. In addition, the normalized time for one revolution of the rotor is equal to 6.276.
3. Investigation of Flow Characteristics Based on Numerical Analysis Results
3.1. Verification of Numerical Results
Figure 4 shows the verification of aerodynamic performance obtained from 3D CFD simulation at a 0° azimuth angle of rotor 1 with values obtained by GH Bladed software, which is based on modified BEMT for the certification at variable azimuth angles of a rotor blade. It showed that the 3D CFD analysis results are in good agreement with the BEMT analysis results within 5.6% error of the shaft power.
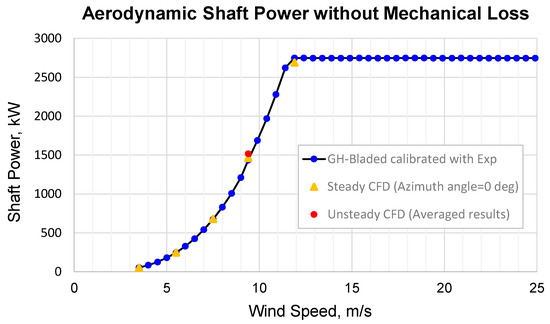
Figure 4.
Numerical verification of aerodynamic performance.
3.2. Three-Dimensional Vortex Structure of a Rotor Blade
Figure 5 shows simultaneous streamline, limiting streamline, and vorticity distribution near the rotor tip, where streamline1 and streamline 2 are boundary layers developed on the suction surface of the rotor tip and on the pressure surface of the rotor tip, respectively, and streamline 3 is a wake boundary layer developed on the trailing edge around the rotor tip. The tip vortex started to be strongly formed by streamline 1 containing the vortex core and streamline 2 in the vicinity of the rotor tip leading edge. As streamline 3 with low energy develops downstream, streamline 3 is drawn into the tip vortex structure. The tip vortex, which is the most sensitive three-dimensional phenomenon related with aerodynamic performance and thrust force, grows in the tangential direction.
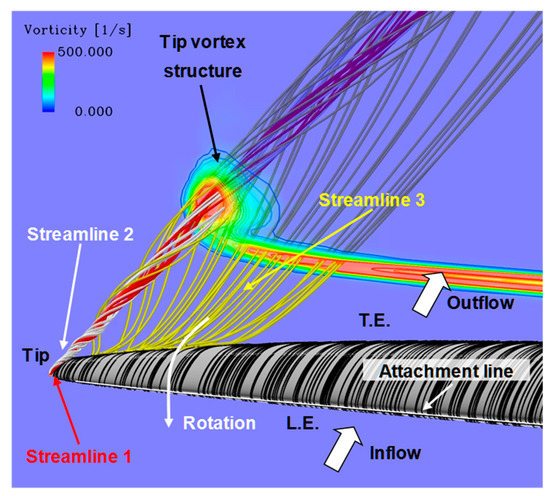
Figure 5.
Three-dimensional flow structure of rotor blade tip.
Figure 6 shows the simultaneous streamline, limiting streamline, and vorticity distribution near the rotor hub, where the streamline 1 is a boundary layer separated on the suction surface of the rotor hub, and the streamline 2 is a boundary layer separated on the pressure surface of the rotor hub. The hub separation vortices, which are the largest vortex structures, are generated by streamline 1 and streamline 2 near the rotor hub leading edge and develop close along the rotor blade suction surface in the spanwise direction. The strong secondary flow above the rotor hub is formed by the blade rotating effect of the Coriolis force and the centrifugal force. Furthermore, the re-attachment line is generated between the separation line near the streamline 1 and separation line near the streamline 2, as both of the hub separation vortices interact with each other.
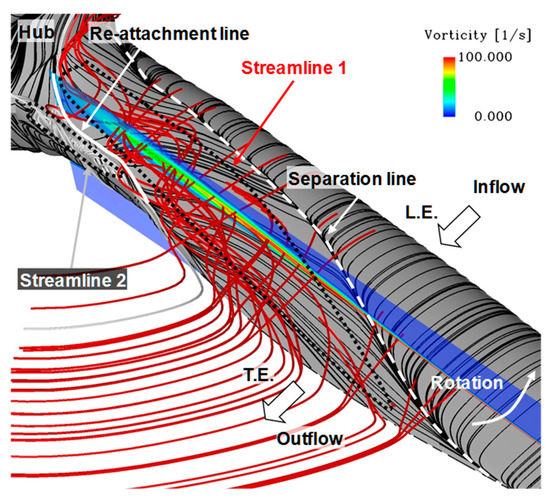
Figure 6.
Three-dimensional flow structure at the rotor hub.
3.3. Aerodynamic Interaction of Rotating Blades and Tower under Wind Shear Condition
The aerodynamic performance (shaft power) history of a WTG on each rotating blade with the various azimuth angles is shown in Figure 7.
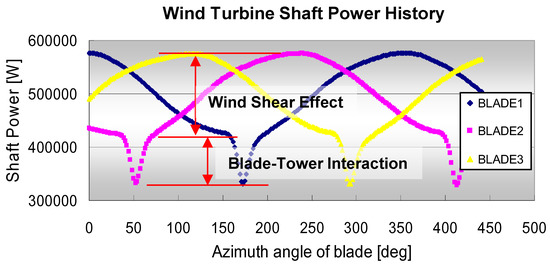
Figure 7.
Simultaneous pressure distribution around tower.
Two different aerodynamic fluctuations with 3P frequency are distinctively observed. The first phenomenon is the wind shear effect determined by Equation (1) in Section 2.2. In the case of 0° azimuth angle, the aerodynamic performance of the rotor 1 is approximately 18.7~31.9% higher than that of the rotor 2 and 3, while the performance rapidly decreased at the 45° azimuth angle. The second phenomenon is the blade-tower interaction, which leads to high pressure drop as blades pass close to tower as shown in Figure 7, which showed additional 22.1% drop of shaft power when the blade 2 passed tower very closely (50° azimuth angle). Figure 8 shows the visualization of the pressure distribution at two different azimuth angles, 33° and 50°.
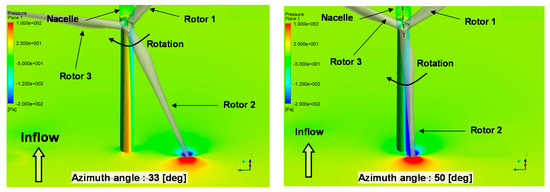
Figure 8.
Pressure distribution due to blade-tower interaction.
The flow field around the tip area of the rotor blade 2 has a strong pressure difference between the rotor suction surface and the rotor pressure surface, which rapidly dropped the aerodynamic performance by the blade-tower interaction. Figure 9 provides more intuition on the blade-tower interaction based on the axial induction factor distribution.
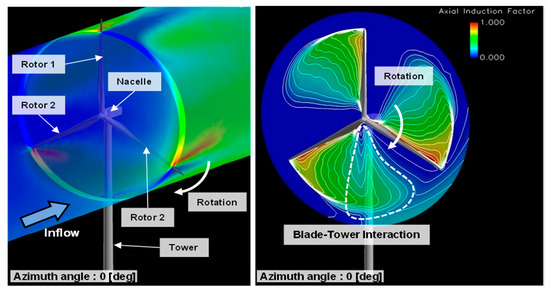
Figure 9.
Aerodynamic performance of rotating blade.
Based on the one-dimensional momentum theory and Betz limit [31], axial induction factor (a) and related aerodynamic performance coefficient (Cp) are expressed in Equations (3) and (4).
where is an inlet free-stream velocity and is a rotor outlet free-stream velocity.
When the axial induction factor becomes 1/3, the aerodynamic performance coefficient has maximum value with 0.593. As shown in Figure 9, the axial induction factor of the rotor blade passage between the rotor 2 and the rotor 3 around the tower is remarkably high, compared with other rotor blade passages. Based on Equation (3), the above phenomenon influences the aerodynamic characteristics of the wind turbine rotor blade.
3.4. Effect of Rotating Blades on Flow Angle around Nacelle
Instantaneous velocity distribution and unsteady behavior of the vortex structures around the nacelle anemometer at 50° and 85° azimuth angle are shown in Figure 10. The vortices around the rotor hub are shed in synchronization with 3P frequency due to a large blockage effect of the stationary tower. The vortex shedding 1 has a significant effect on the flow field around the nacelle anemometer at 50° azimuth angle. At the 85° azimuth angle, the vortex shedding 1 is diffused as moving in the downstream direction, and then the vortex shedding 2 has a major effect on the nacelle anemometer flow field. Above that, the periodic vortex shedding phenomena dominate the complicated and vortical flow field around the nacelle anemometer and wind vanes.
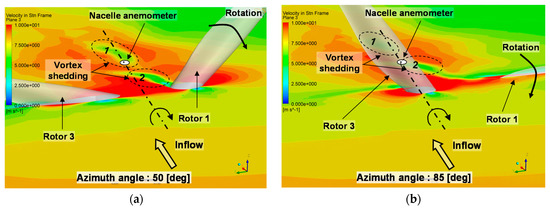
Figure 10.
Velocity distribution around nacelle anemometer. (a) 50° azimuth angle, (b) 85° azimuth angle.
4. Aerodynamic Performance Enhancements
Based on the numerical investigation on the flow phenomena at the WTG, in the following section numerical design studies on optimal blade tip design and nacelle anemometer position were performed to enhance the aerodynamic performance.
4.1. Optimal Blade Tip Designs
The tip vortex behavior corresponding to the rotor blade tip shape remarkably dominates the aerodynamic performance (shaft power), the aerodynamic thrust force, and the aero-acoustic sound in the wind turbine. Figure 11 shows the spanwise aerodynamic contribution in the out-of-plane and in-plane directions on each rotor blade section, where the out-of-plane and in-plane directions indicate the axial direction of the rotor blade and the tangential direction perpendicular to the axial direction, respectively. It is found that the aerodynamic force contribution of the rotor blade is significantly dominated by that of the rotor blade tip area. In this study, two different types of blade tip designs, the winglet and ogee type, were studied for the aerodynamic performance improvement of current WTG model as shown in Figure 12.
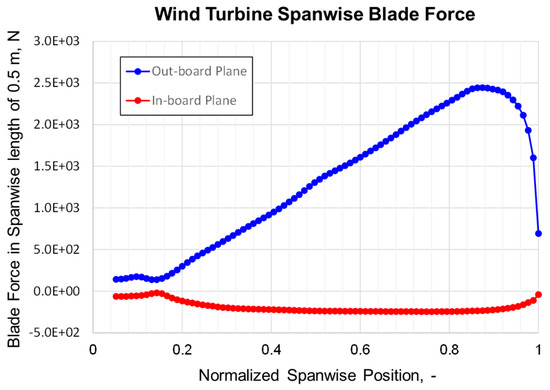
Figure 11.
Spanwise aerodynamic force contribution.
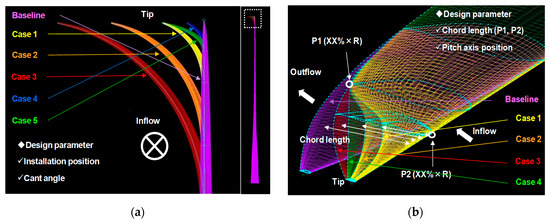
Figure 12.
Blade tip designs: winglet and ogee type. (a) Winglet tip, (b) ogee tip.
Figure 13 shows the tip vortex vorticity distribution of original blade tip design, optimized winglet type, and ogee type. Here, the vorticity distribution is on the 3 m downstream plane perpendicular to the tangential direction from the rotor blade tip trailing edge. The performance, that is, the shaft power was increased for the optimized winglet tip (Figure 13b) and ogee type (Figure 13c) compared to the base tip design (Figure 13a), while the aerodynamic load and the vorticity strength were decreased as desired. The simulation results are summarized in Table 3.
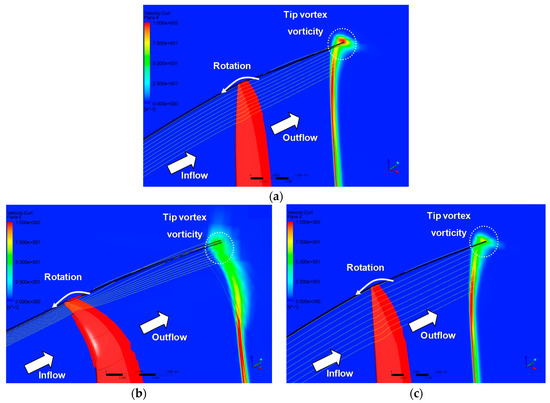
Figure 13.
Three-dimensional vorticity distribution according to various rotor blade tip. (a) Original tip design (base), (b) optimized winglet tip design, (c) optimized ogee tip design.

Table 3.
Comparison of aerodynamic characteristics.
As shown in Figure 12a, several design parameters such as the spanwise installation position, cant angle, taper ratio, and sweep angle should be considered to design the winglet tip shape. However, the winglet tip shape design of the present study was carried out using only two design parameters of the installation position and cant angle. The determinants of the ogee tip shape are the spanwise chord length and pitch axis position distribution as shown in Figure 12b.
The aerodynamic characteristics are closely related to the reduction of the induced drag and the rotor tip loss which are significantly dominated by the vorticity strength of the tip vortex. Furthermore, the reduction of the tip vortex vorticity strength leads to the reduction of the aero-acoustic sound generated by the tip vortex behavior.
4.2. Optimal Position of Nacelle Anemometer and Flow Angle
The nacelle anemometer of the wind turbine is used for the yaw angle control, which makes the wind flow perpendicular to the rotating blade plane. The yaw angle has a significant effect on the aerodynamic performance [19]. If a yaw error of 15° occurs, the aerodynamic performance decreases about 6.7%. The several candidate locations of nacelle anemometer are shown in Figure 14.
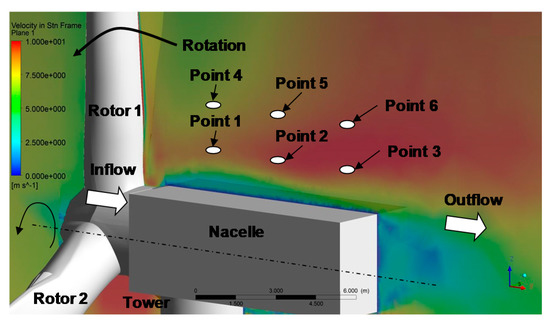
Figure 14.
Possible locations of nacelle anemometer.
Additionally, velocity time history at suggested six points are computed as shown in Figure 15 according to the varying azimuth angle. The periodic fluctuation apparently indicates the effect of interaction of rotating blades with a hub and nacelle. The velocity components (, , ) in the polar coordinate were transformed from the Cartesian velocity components (, , ) as follow.
where is axial component, is radial component, is tangential component, and is the azimuth angle of rotor blade 1. As shown in Figure 15, all velocity components have the remarkable fluctuation with 3P frequency.
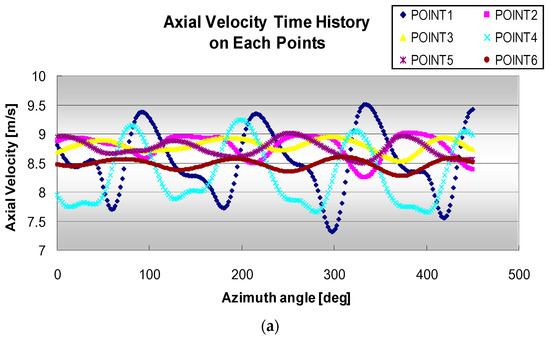
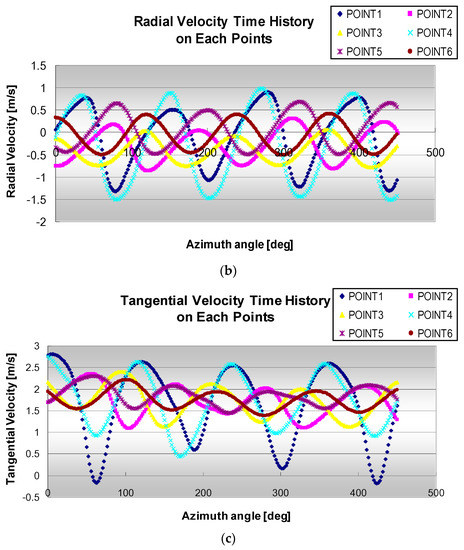
Figure 15.
Velocity time history with varying azimuth angle. (a) Axial velocity time history, (b) radial velocity time history (c) tangential velocity time history.
The flow angle (FA) and turbulence intensity () normalized by the rotor tip speed on the nacelle anemometer points are computed by Equations (8) and (9), and the time history of flow angle (FA) on each location is shown in Figure 16.
where , , and denote the velocity fluctuation components in the axial, radial, and tangential directions, respectively, and is the rotor tip speed.
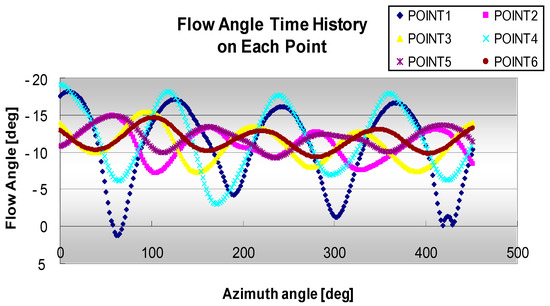
Figure 16.
Flow angle time history on each nacelle anemometer position with varying azimuth angle.
The FA is dominated by the fluctuation with 3P frequency and is defined negative for the clockwise rotating when viewed from upstream. The FA has the strong relationship with anemometer positions. Table 4 lists the time averaged FA and level at the different positions of nacelle anemometer. As the distance between the vortex shedding area of the rotor hub and the nacelle anemometer position becomes closer, the higher the FA fluctuation and turbulence intensity become. Regardless of the nacelle anemometer position, the time averaged FA values are little different. It means that the inlet free-stream flowing with theoretically 0° yaw angle error will be deflected to 11.43° in average, due to the interaction of rotating blades with a hub and nacelle. Based on Table 4, it is recommended that the nacelle anemometer position should be placed at the point 6 due to the lowest turbulence intensity level. Additionally, analysis results show that the intrinsic yaw error should be considered for wind turbine control to avoid the loss of aerodynamic performance.

Table 4.
Effect of anemometer positions on FA and .
5. Conclusions
In this paper, three-dimensional vortical flow phenomena in the wind turbine were investigated by the unsteady Reynolds averaged Navier–Stokes (RANS) flow simulation with SST turbulence model. Based on the investigation, the studies for enhancing aerodynamic performance were carried out including the optimization of the innovative blade tip design and the optimal layout of the nacelle anemometer. The results are summarized as follows:
- (1)
- The three-dimensional vortical flow field in the wind turbine was dominated by the tip vortex and hub separation vortices. The tip vortex starts to be formed near the rotor tip leading edge. The hub separation vortices were generated near the rotor hub leading edge and develop nearly in the spanwise direction.
- (2)
- The winglet and ogee rotor tip shape, which is remarkably sensitive to the aerodynamic characteristics, were optimized to achieve higher aerodynamic performance while lowering aerodynamic thrust force and tip vorticity.
- (3)
- The interaction between the rotating blade and the stationary tower brings about the high pressure fluctuation on the tower surface with 3P frequency, which makes the aerodynamic performance and thrust force remarkably fluctuate with 3P frequency. The vortices around the rotor hub are also shed in synchronization with 3P frequency. The vortex shedding is not the prominent effect on the aerodynamic performance and thrust force in the wind turbine.
- (4)
- The unsteady nature of the vortex shedding from the rotor hub led to the generation of the complicated and vortical flow field around the nacelle anemometer and wind vane. The flow angle (FA) time history is dominated by the fluctuation with the 3P frequency. As the distance between the rotor hub and the nacelle anemometer becomes closer, the higher the FA fluctuation and turbulence intensity occur. Regardless of the anemometer position, the time averaged FA value is 11.43° in average.
Author Contributions
J.-H.J. compiled the literature review, conceptualized the ideas, performed the numerical simulation, and wrote the bulk of the paper; K.H. organized the concept idea and paper structure, compiled the literature review, contributed in structuring and review of the paper, and partially wrote the paper. Both authors have read and agreed to the published version of the manuscript.
Funding
This study has been supported by National R&D Program through the National Research Foundation of Korea (NRF) funded by the Ministry of Science, ICT & Future Planning (2020R1G1A1099560). Additionally, this work was supported by Brain Pool Program through the National Research Foundation of Korea (NRF) funded by the Ministry of Science and ICT (grant number: 2019H1D3A2A02102093).
Acknowledgments
I acknowledge the administrative and technical support of Floating Offshore Wind Energy System Engineering Department of University of Ulsan.
Conflicts of Interest
The authors declare no conflict of interest.
References
- Global Wind Energy Council. Global Wind Statistics 2011; GWEC: Brussels, Belgium, 2012. [Google Scholar]
- IRENA. Future of Wind: Deployment, Investment, Technology, Grid Integration, Socio-Economic Aspects; IRENA: Abu Dhabi, UAE, 2019; ISBN 978-92-9260-155-3. [Google Scholar]
- Konstantinidis, E.I.; Botsaris, P.N. Wind Turbines: Current status, obstacles, trends, and technologies. In IOP Conference Series: Materials Science and Engineering, Proceedings of the 20th Innovative Manufacturing Engineering and Energy Conference (IManEE 2016), Kozani, Greece, 23–25 September 2016; IOP Publishing: Bristol, UK, 2016. [Google Scholar] [CrossRef]
- Stevens, R.J.; Meneveau, C. Flow Structure and Turbulence in Wind Farms. Annu. Rev. Fluid Mech. 2017, 49, 311–339. [Google Scholar] [CrossRef]
- Schubel, P.J.; Crossley, R.J. Wind Turbine Blade Design: Review. Energies 2012, 5, 3425–3449. [Google Scholar] [CrossRef]
- Monteiro, J.; Silvestre, M.; Piggott, H.; André, J. Wind tunnel testing of a horizontal axis wind turbine rotor and comparison with simulations from two Blade Element Momentum codes. J. Wind Eng. Ind. Aerodyn. 2013, 123, 99–106. [Google Scholar] [CrossRef]
- Manwell, J.F.; McGowan, J.G.; Rogers, A.L. Wind Energy Explained: Theory, Design and Application; John Wiley & Sons: Hoboken, NJ, USA, 2002; Chapter 3. [Google Scholar]
- Du, Z.; Selig, M.S. The effect of rotation on the boundary layer of a wind turbine blade. Renew. Energy 2000, 20, 167–181. [Google Scholar] [CrossRef]
- Rommel, D.P.; Di Maio, D.; Tinga, T. Calculating wind turbine component loads for improved life prediction. Renew. Energy 2020, 146, 223–241. [Google Scholar] [CrossRef]
- Lin, L. BEMT and CFD-Based Unsteady Aerodynamic Analyses of Floating Offshore Wind Turbine. Ph.D. Thesis, University of Strathclyde, Glasgow, UK, 2016. [Google Scholar]
- Bangga, G.; Lutz, T.; Jost, E.; Kramer, E. CFD studies on rotational augmentation at the inboard sections of a 10MW wind turbine rotor. J. Renew. Sustain. Energy 2017, 9, 023304. [Google Scholar] [CrossRef]
- Jeong, J.; Kim, S. CFD investigation on the flatback airfoil effect of 10 MW wind turbine blade. J. Mech. Sci. Technol. 2018, 32, 2089–2097. [Google Scholar] [CrossRef]
- Montazeri, H.; Montazeri, F. CFD simulation of cross-ventilation in buildings using rooftop wind-catchers: Impact of outlet openings. Renew. Energy 2018, 118, 502–520. [Google Scholar] [CrossRef]
- Zahle, F.; Sørensen, N.N. Characterization of the unsteady flow in the nacelle region of a modern wind turbine. Wind Energy 2011, 14, 271–283. [Google Scholar] [CrossRef]
- Obert, B.; Cinnella, P. Comparison of steady and unsteady RANS CFD simulation of a supersonic ORC turbine. Energy Procedia 2017, 129, 1063–1070. [Google Scholar] [CrossRef]
- Zhong, W.; Tang, H.; Wang, T.; Zhu, C. Accurate RANS Simulation of Wind Turbine Stall by Turbulence Coefficient Calibration. Appl. Sci. 2018, 8, 1444. [Google Scholar] [CrossRef]
- Kuethe, A.M.; Chow, C.Y. Foundations of Aerodynamics: Bases of Aerodynamic Design, 4th ed.; John Wiley & Sons: Hoboken, NJ, USA, 1986. [Google Scholar]
- Brocklehurst, A.; Barakos, G. A review of helicopter rotor blade tip shapes. Prog. Aerosp. Sci. 2013, 56, 35–74. [Google Scholar] [CrossRef]
- Madsen, H.A.; Sørensen, N.N.; Schreck, S. Yaw aerodynamics analyzed with three codes in comparison with experiment. In Proceedings of the ASME 2003 Wind Energy Symposium, Reno, NV, USA, 6–9 January 2003. [Google Scholar]
- Ansys, C.F.X. ANSYS CFX-Solver Theory Guide; ANSYS Inc.: Canonsburg, PA, USA, 2018. [Google Scholar]
- Bertagnolio, F.; Sørensen, N.N.; Johansen, J.; Fuglsang, P. Wind Turbine Airfoil Catalogue; Risoe-R. No. 1280(EN); Forskningscenter Risoe: Roskilde, Denmark, 2001. [Google Scholar]
- Grasso, F. Development of Thick Airfoils for Wind Turbines. J. Aircr. 2012, 50, 975–981. [Google Scholar] [CrossRef]
- Murthy, J.Y. CFD simulation of flows in stirred tank reactors using mesh technique mixing. Inst. Chem. Eng. Symp. Ser. 1994, 136, 341–348. [Google Scholar]
- Bangga, G.; Weihing, P.; Lutz, T.; Kramer, E. Effect of computational grid on accurate prediction of a wind turbine rotor using delayed detached-eddy simulations. J. Mech. Sci. Technol. 2017, 31, 2359–2364. [Google Scholar] [CrossRef]
- Svorcan, J.; Peković, O.; Ivanov, T. Estimation of wind turbine blade aerodynamic performances computed using different numerical approaches. Theor. Appl. Mech. 2018, 45, 53–65. [Google Scholar] [CrossRef]
- Smagorinsky, J. General Circulation Experiments with the Primitive Equations. I. The Basic Experiment. Mon. Weather Rev. 1963, 91, 99–165. [Google Scholar] [CrossRef]
- Muiruri, P.I.; Motsamai, O.S.; Ndeda, R.A. A comparative study of RANS-based turbulence models for an upscale wind turbine blade. SN Appl. Sci. 2019, 1, 1–15. [Google Scholar] [CrossRef]
- Iungo, G.V.; Santhanagopalan, V.; Ciri, U.; Viola, F.; Zhan, L.; Rotea, M.A.; Leonardi, S. Parabolic RANS solver for low-computational-cost simulations of wind turbine wakes. Wind Energy 2018, 21, 184–197. [Google Scholar] [CrossRef]
- Wilcox, D.C. Reassessment of the scale-determining equation for advanced turbulence models. AIAA J. 1998, 26, 1299–1310. [Google Scholar] [CrossRef]
- Menter, F.R. Two-equation eddy-viscosity turbulence models for engineering applications. AIAA J. 1994, 32, 1598–1605. [Google Scholar] [CrossRef]
- Betz, A. Introduction to the Theory of Flow Machines; Pergamon Press: Oxford, UK, 1966. [Google Scholar]
Publisher’s Note: MDPI stays neutral with regard to jurisdictional claims in published maps and institutional affiliations. |
© 2020 by the authors. Licensee MDPI, Basel, Switzerland. This article is an open access article distributed under the terms and conditions of the Creative Commons Attribution (CC BY) license (http://creativecommons.org/licenses/by/4.0/).