Article

Optimization of Lignin Recovery from the Pre-Hydrolysate of Kraft-Based Dissolving Pulp Production Processes

1
Chemical Engineering Department, Ecole Polytechnique de Montreal, Montreal, QC H3T 1J4, Canada
2
FPInnovations, Pulp, Paper and Bioproducts, 570 St John Blvd, Pointe Claire, QC H9R 3J9, Canada
3
Chemistry and Chemical Engineering, Royal Military College of Canada, Kingston, ON K7K 7B4, Canada
*
Author to whom correspondence should be addressed.
Appl. Sci. 2021, 11(1), 454; https://doi.org/10.3390/app11010454
Submission received: 15 December 2020 / Revised: 27 December 2020 / Accepted: 29 December 2020 / Published: 5 January 2021
(This article belongs to the Special Issue Biorefineries and Sustainable Biomass Conversion: Recent Advances)

Abstract

:
A pre-hydrolysate is an aqueous stream obtained during the production of hardwood kraft dissolving pulp. It is rich in sugars and contains dissolved organic matters. The purpose of this study is to investigate the optimization of lignin recovery from wood pre-hydrolysates and to characterize the extracted lignin. The optimal conditions for lignin extraction have been determined to be (a) a filtration temperature of 40 °C, (b) a sulfuric acid concentration of 8.5 kg·m−3, and (c) a coagulation time of 180 min. Using these conditions, high filtration rates have been obtained and the extracted lignin has a low content of impurities (8.3%), a low molecular weight (1270 Da), and a very low polydispersity (Mw/Mn = 1.22). Compared to kraft lignin, the pre-hydrolysate lignin has a much lower molecular weight and could be a potential candidate for niche applications. A high lignin recovery rate is possible (52% of the total lignin content in the pre-hydrolysate).

1. Introduction

During the last decade, there has been great interest in converting some hardwood kraft pulp mills to dissolving pulp (DP) operations (Figure 1). It has been reported that about 14 pulp mills have announced an increase in DP production or conversion from kraft to DP [1]. In kraft dissolving pulp mills, a step of pre-hydrolysis (using steam or hot water) is required to remove a significant part of hemicelluloses and lignin in order to produce purer cellulose pulp during subsequent steps. By subjecting wood chips to hot water treatment at about 170 °C and high pressure, the hemicelluloses are hydrolyzed to sugar oligomers and monomers. As a result, the hemicelluloses and part of the lignin present in wood chips are released into solution to form the pre-hydrolysate. This solution is then mixed with black liquor generated at the end of the cooking process. Black liquor has a high calorific value; it is sent to the recovery boilers for burning to produce energy and steam and to recycle chemicals used throughout the process to meet the internal needs of the plant. This high calorific value of black liquor is mainly due to the presence of lignin. The excess lignin can be extracted from black liquor using various techniques, namely acid precipitation, ultrafiltration, and use of organic solvents.
It is well known that most kraft pulp and paper mills in North America have recovery boilers with limited capacity [2,3]. To increase pulp production, either the capacity of the boiler should be increased or a new boiler must be purchased and installed. The latter option would be very expensive for a pulp mill. One less expensive option would be to reduce the load of the boilers by extracting a portion of the lignin from black liquor [4,5,6] or by extracting and valorizing the pre-hydrolysate.
The pre-hydrolysate generated during the Kraft-based (PHK) dissolving pulp process can be a potential source for the production of biochemicals. Organic components such as lignin, monomeric and oligomeric sugars, and furfural and organic acids are present in the pre-hydrolysate and can be used to produce high value-added products. Several studies have been conducted on pre-hydrolysate valorization such as furfural production from pre-hydrolysate [7,8,9,10], furfural production from a pre-hydrolysate generated using SO2 [11], lignin removal by acidification [12], acidification and flocculation [13,14], surfactant and calcium oxide [15] or laccase treatments [16,17], as well as lignin recovery using membrane technology [18] and pre-hydrolysate detoxification [19]. However, the focus of all these studies was the valorization of hemicelluloses and organic acids to produce biochemicals and biofuels such as furfural, bio-ethanol, bio-butanol, acetic acid, formic acid, and succinic acid. Lignin in the pre-hydrolysate is considered a fermentation inhibitor and is removed prior to the conversion of sugars to biochemicals [13,15,19]. To date, very few works have been done on the extraction and characterization of lignin from wood pre-hydrolysate. In addition, no studies have been done on its recovery from the pre-hydrolysate. Unlike other types of lignin (kraft, lignosulphonates, and organosolv), this lignin has never been exposed to chemicals. Thus, its purity as well as chemical and physical properties are expected to be different from other lignins. However, it has not yet attracted attention from researchers. Numerous studies have been conducted to extract lignin from black liquor and various applications have been discussed in the literature such as the use of kraft lignin in rigid polyurethane foams [20], in flexible polyurethane foams [21], in phenol formaldehyde resins [22], and in activated carbon [23] as well as the use of lignin as an antioxidant and antibacterial [24]. Therefore, the recovery and characterization of lignin from the pre-hydrolysate will provide valuable information about its potential use and commercial applications. Figure 1 presents a simplified diagram of a kraft dissolving pulp mill with an approach to valorizing the pre-hydrolysate.
Shi et al. [13] published a study on the development of a new process by combining acidification and treatment with polyethylene oxide (PEO) to improve the extraction of lignin. The idea was to form lignin/PEO complexes which are easy to separate from the solution. With this technique, it was possible to extract more than 22% of lignin compared to only 3.8% when acid precipitation was used (at pH = 2).
Shi et al. [15] also studied the extraction of lignin from pre-hydrolysate using over-liming treatment (CaO) and/or surfactant molecules. The results showed that the highest extraction of lignin (17%) was achieved by using dodecyltrimethylammonium chloride (DTAC) with an optimal ratio DTAC/pre-hydrolysate of 0.3%. In addition, over-liming resulted in the extraction of 36% lignin and 23% hemicelluloses. The effect of the sequence/order of the two treatments on the lignin extraction rate was also studied. Over-liming followed by treatment with DTAC was more effective than treatment with DTAC followed by over-liming. In the first case, a yield of 44% lignin removal and 27% hemicelluloses loss was obtained. In another study, Shi et al. [25] combined PEO and aluminum polychloride (PAC); 46% of lignin was extracted.
Chen et al. [26] tested several methods of lignin extraction from the pre-hydrolysate. Extractions of 27%, 52%, 36%, and 25% were obtained using (1) precipitation at pH = 2, (2) ethanol, (3) polyDADMAC, and (4) PAC (aluminum polychloride), respectively. The corresponding sugar losses were 38%, 38%, 39%, and 1.7%, respectively.
The results obtained by Yasarla and Ramarao [14] were different since they were able to extract a higher amount of lignin (70%) using polyDADMAC. However, polyDADMAC was not selective for lignin, since it resulted in 37% and 38% losses of sugars and acetic acid, respectively.
As previously reported by Mazar et al. [18], these techniques are still far from being optimal for recovering lignin from the pre-hydrolysate. In fact, they do not take into consideration a subsequent step that is needed for the recovery and the valorization of lignin. The only objective of these studies was to remove (and not to recover) lignin because it was considered a fermentation inhibitor. Therefore, it had to be separated before utilization of hemicelluloses (these techniques can be considered as detoxification steps). In addition, significant losses of hemicelluloses were observed in most of these techniques.
The objective of this study is to maximize the quantity of recovered lignin and to enhance its quality by determining the best conditions for the precipitation, coagulation, and filtration steps. To the best of our knowledge, this is the first study conducted to investigate the optimization of lignin recovery from a DP pulp mill pre-hydrolysate using the acidification method.

2. Materials and Methods

2.1. Raw Materials

The wood chips used in this study were a mixture of maple (65 wt%) and aspen (35% wt%) obtained from 30-year-old trees (without bark). They were provided by a Canadian kraft dissolving pulp mill. The chips were screened on a disc screen using a thickness fraction between 2 and 8 mm. The mass fractions of their solid contents were 60.5% and 37.3% for maple and aspen, respectively. In order to extract hemicelluloses from wood chips, the chips were subjected to a two-step treatment. The first step consisted of placing the chips in a 56 L-digester and then purging them three times with steam to remove air. Each time, the treatment lasted for three minutes under a pressure of 138 kPa. During the second step (the pre-hydrolysis), an initial water-to-wood ratio of 3:1 was employed. The pre-hydrolysis stage was carried out at a temperature of 170 °C for 90 min (typical conditions used usually in industrial level). About 15 dm3 of pre-hydrolysate was produced per batch. A typical composition of the pre-hydrolysate is presented in Table 1.

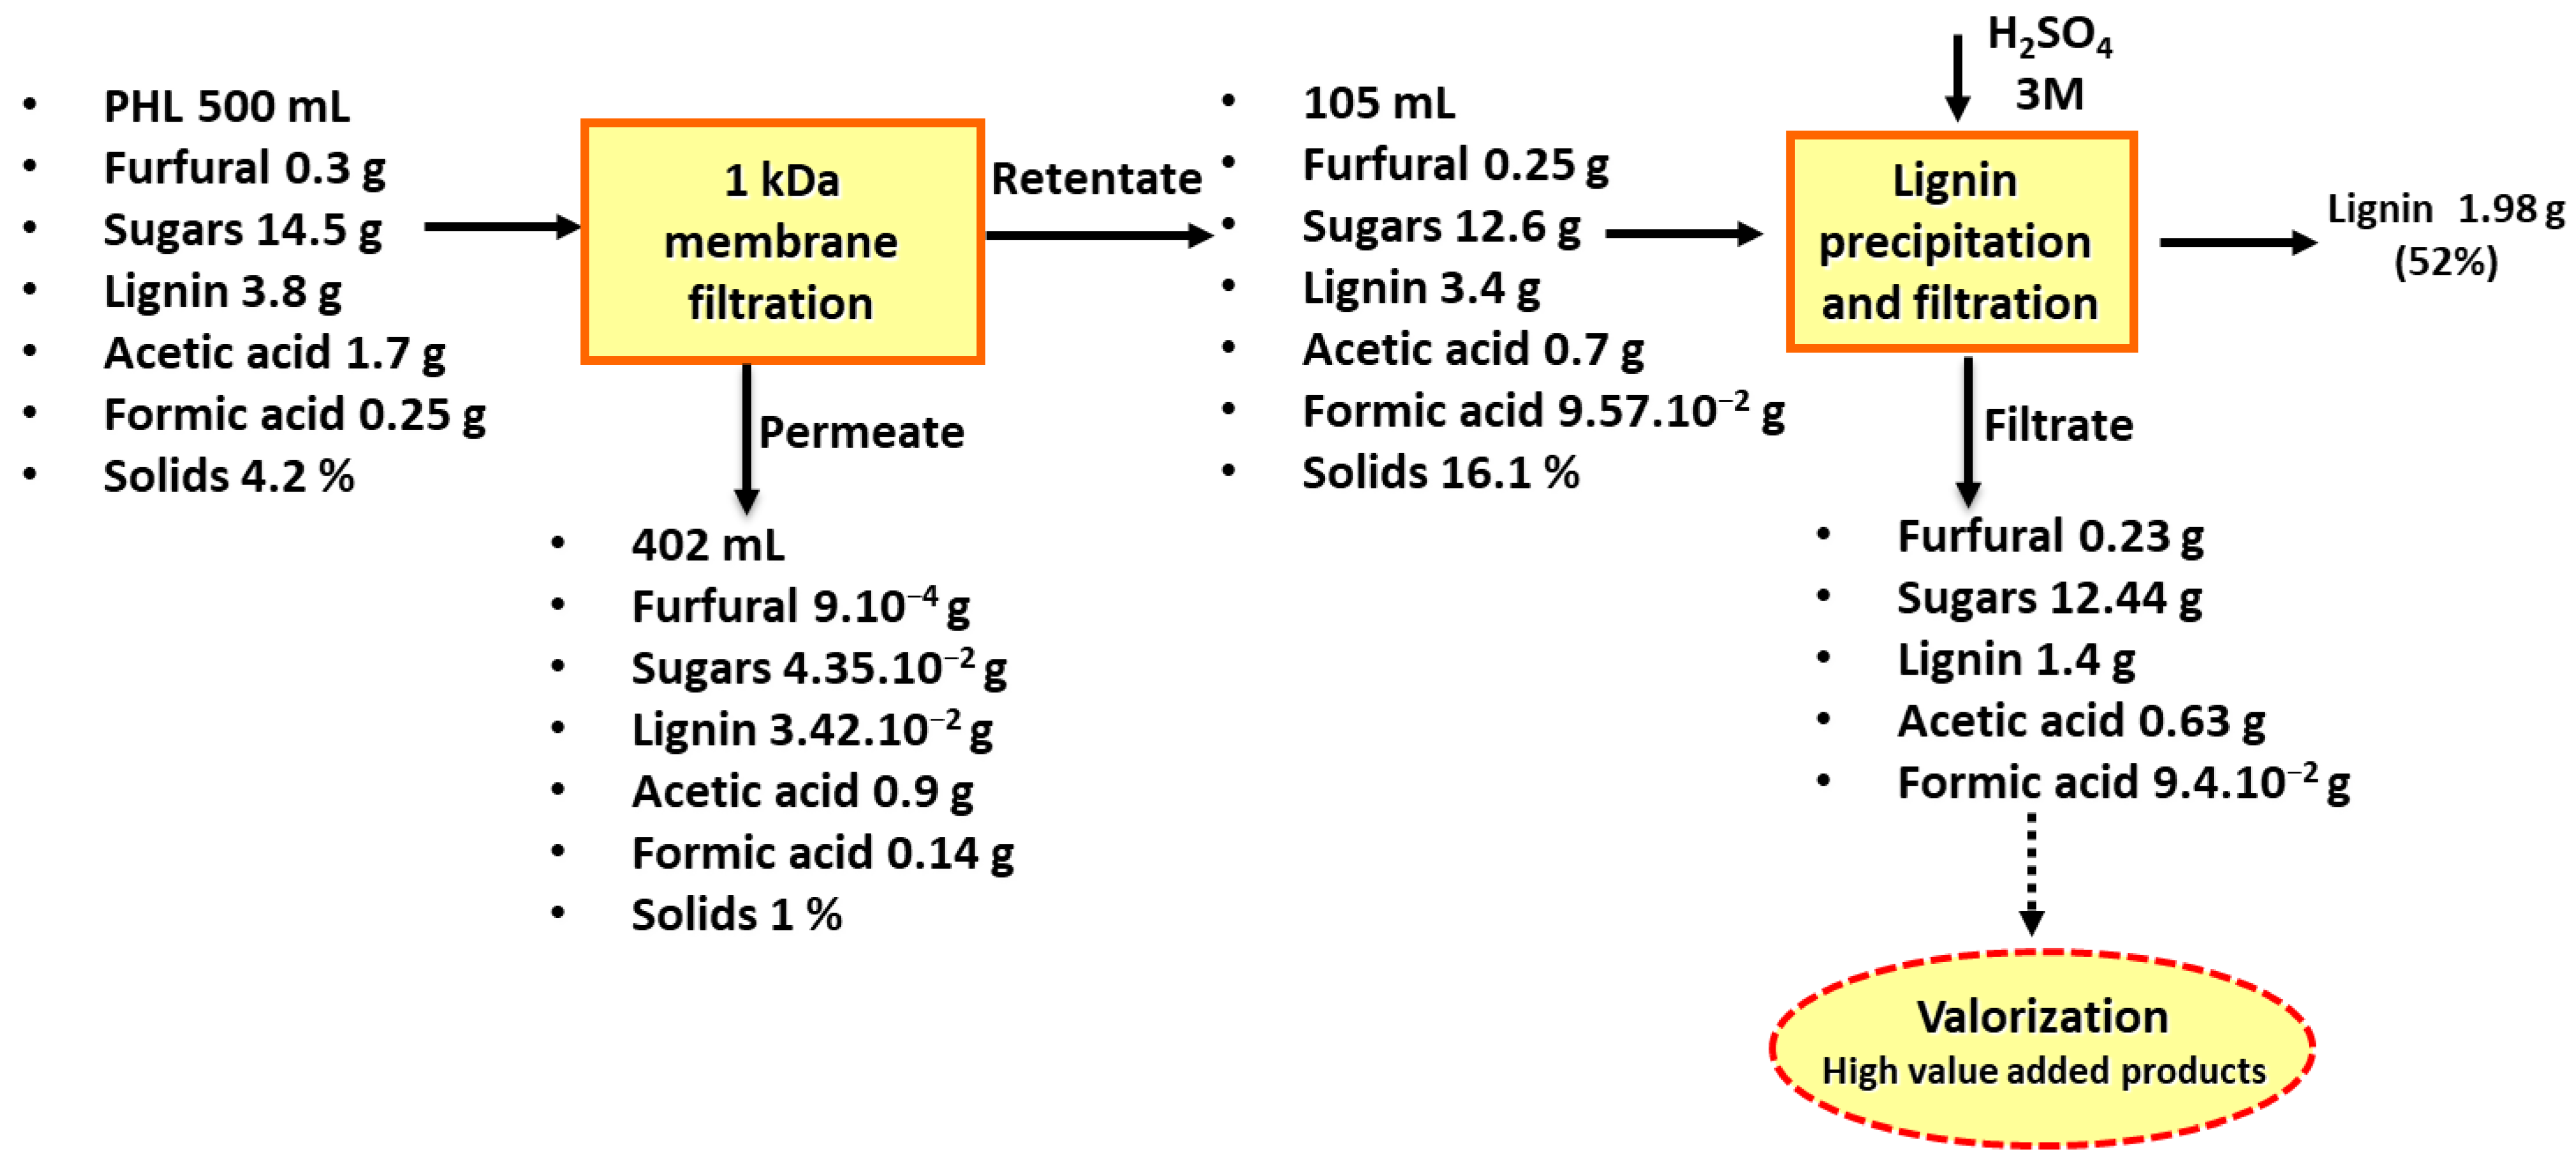
2.2. Pre-Hydrolysate Concentration

In order to recover lignin from the pre-hydrolysate, a concentration step was done prior to the acidic precipitation. All concentration experiments were carried out under a temperature of 60 °C, a pressure of 30 bars, and a concentration factor (CF) of 5 (also called volume reduction factor (VRF)).
The filtration experiments were conducted using a stainless-steel membrane module from Koch Membranes that contained a flat membrane with an effective surface of 28 cm2. The membrane system consisted of a pump (capacity of 1.8 dm3·min−1), a valve for adjusting the applied pressure, and a filtration module (max hold up volume is 500 cm3, max operating pressure is 35 bars, and max operating temperature is 90 °C).

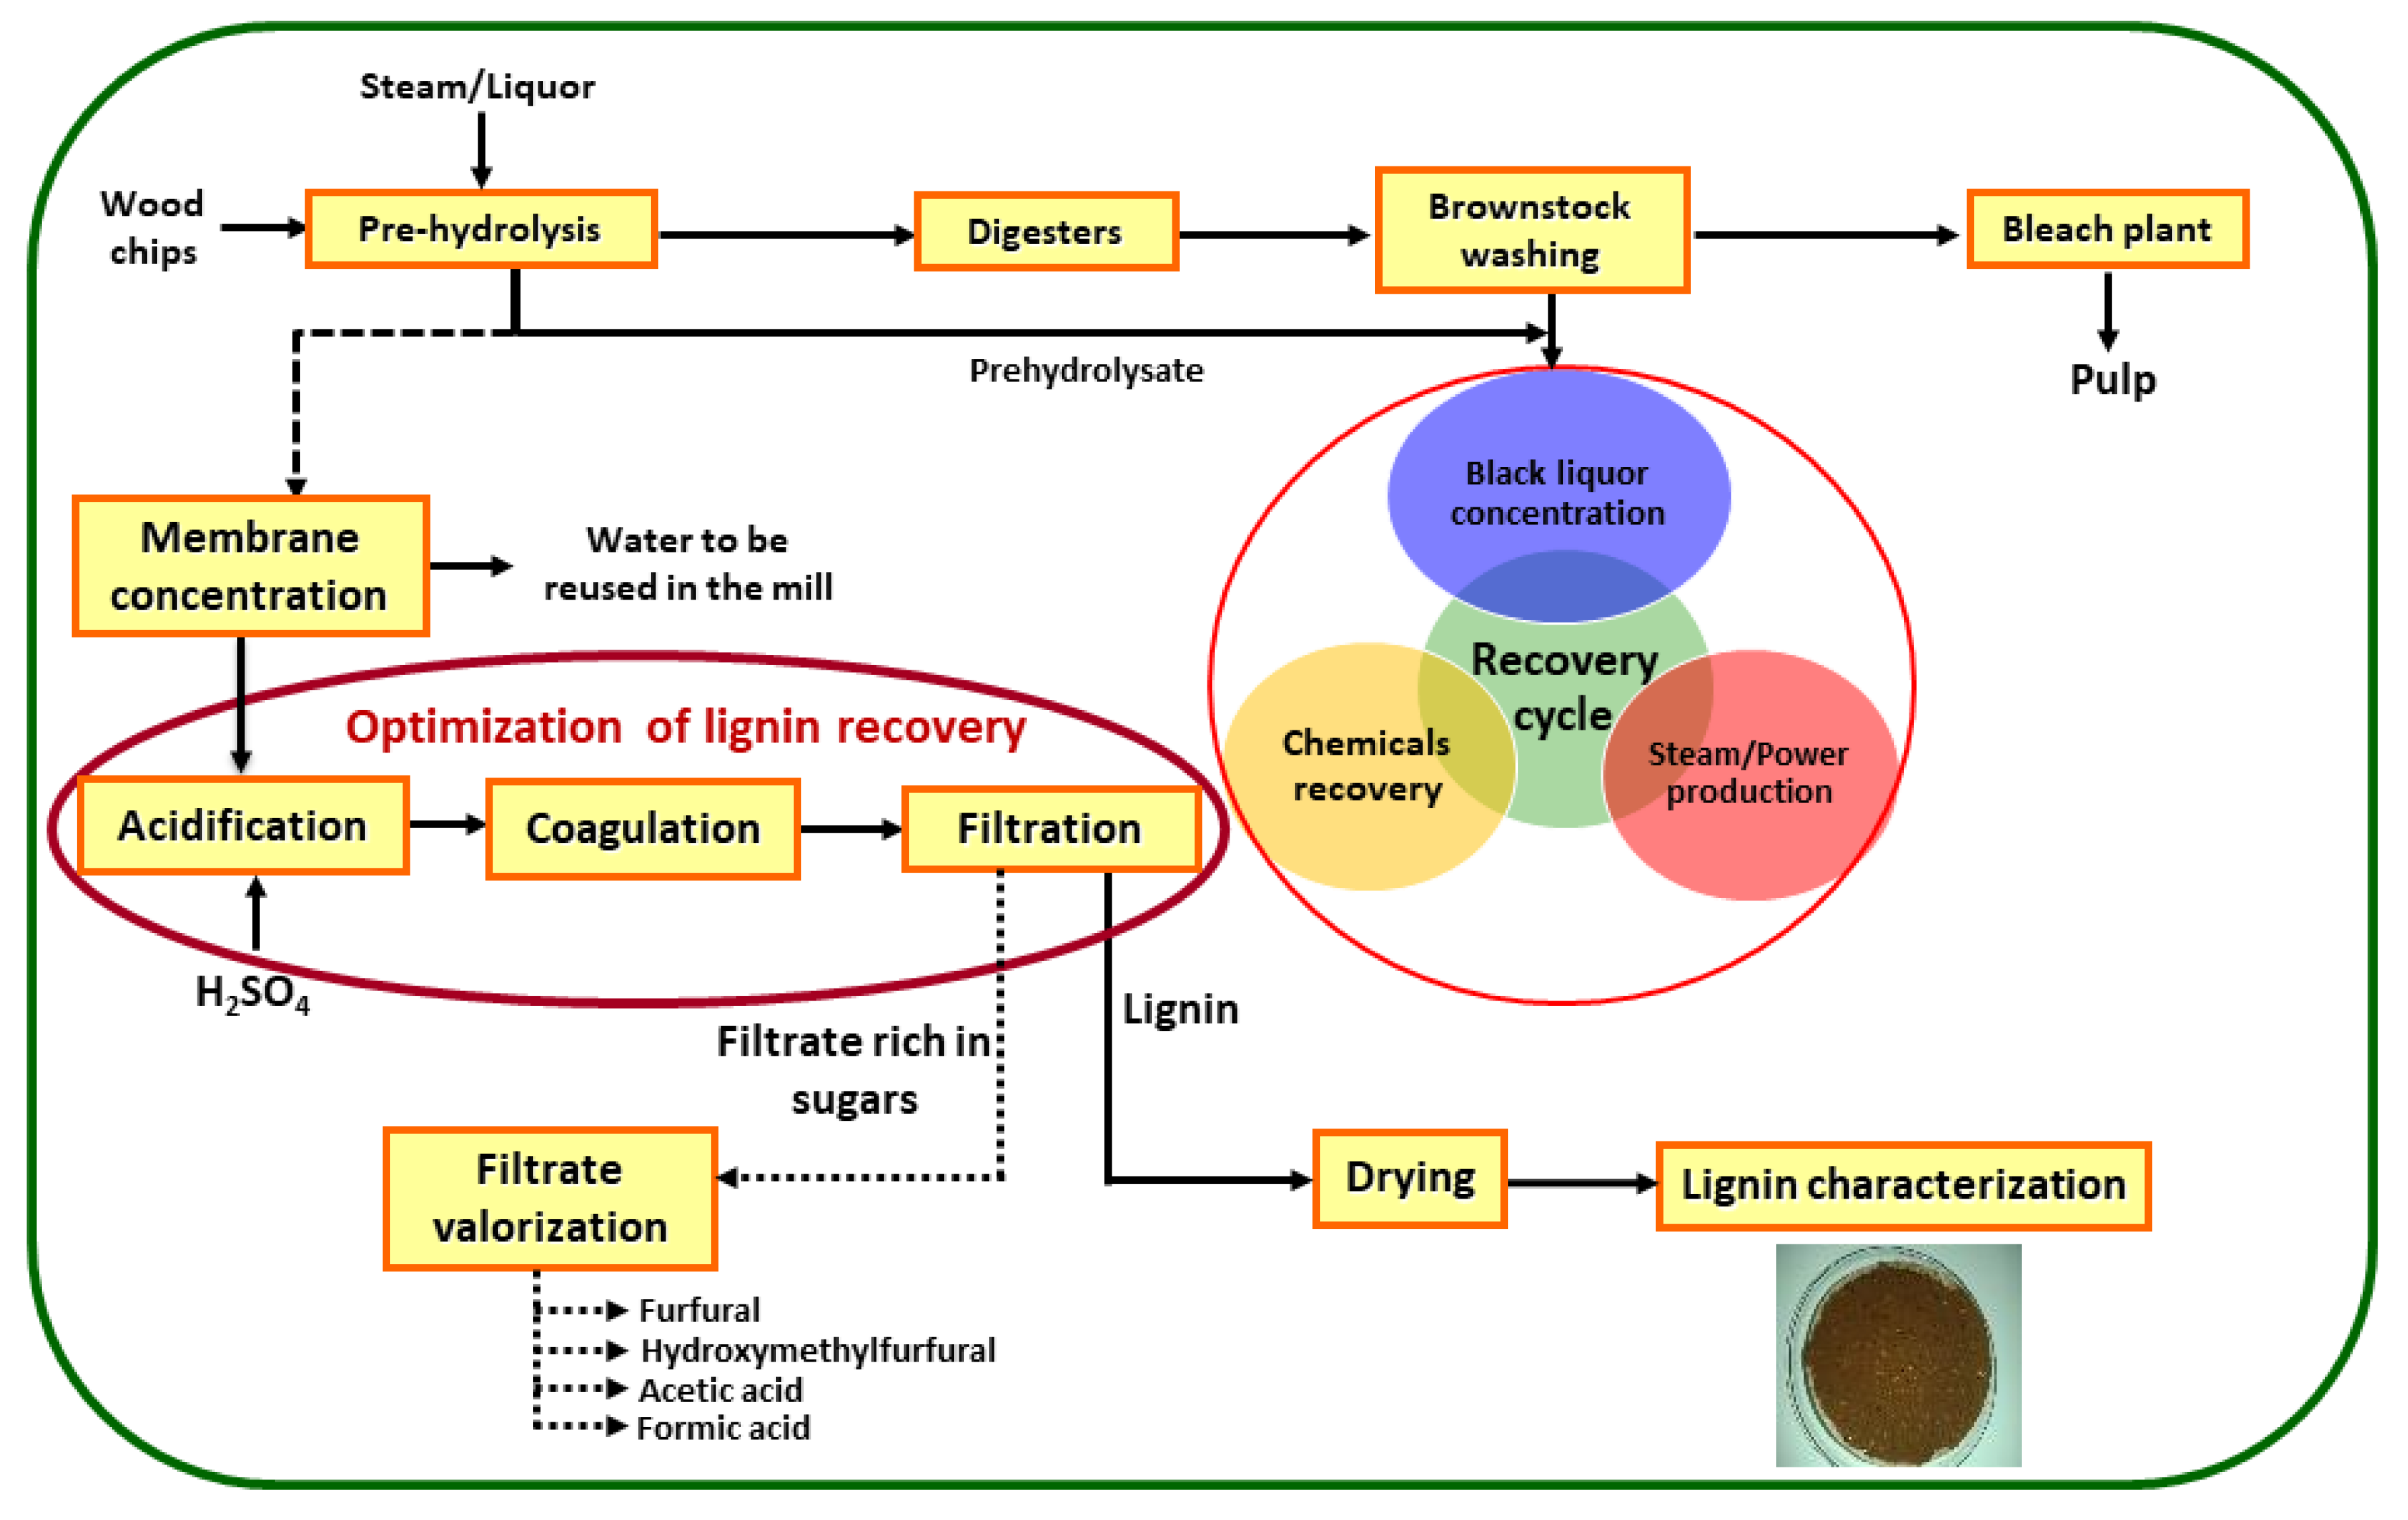
2.3. Lignin Recovery Optimization

A pre-hydrolysate solution having the composition shown in Table 1 and containing about 7.6 kg·m−3 of total lignin was passed through a 1000-MW cutoff membrane and concentrated by a factor of 5. In the concentrate, the total solid content increased from about 4.3% to about 16%. The concentrate of this step was acidified by adding sulfuric acid (3 mole·dm−3). The solution was left to coagulate for about 60–180 min at 73 °C to allow lignin particles to agglomerate. After the coagulation-precipitation step, the lignin was separated from the liquid by a simple filtration.
For all the precipitation experiments, the membrane concentrates were heated to 73 °C. The effect of parameters such as sulfuric acid concentration, filtration temperature, and coagulation time on the filtration flux and the amounts of recovered lignin, lignin purity, lignin molecular weight, and molecular weight distribution were studied in this work. Four final sulfuric acid concentrations were tested in this study (0, 5.7, 8.5, and 14 kg·m−3) using a sulfuric acid solution with an initial concentration of 3 mole·dm−3. Three membrane filtration temperatures were tested in the current study (40, 45, and 50 °C). The coagulation time varied between 60 and 180 min.
To have an idea about the quality of the pre-hydrolysate lignin obtained (PHL lignin), its properties were compared to those of kraft softwood lignin (KSW lignin) and kraft hardwood lignin (KHW lignin). The KSW and KHW lignins were produced at FPInnovations using the LignoForceTM process.

2.4. Chemical Analyses

2.4.1. Insoluble Lignin

To determine the amount of insoluble lignin in each fraction, two 5 cm3 samples were subjected to acid hydrolysis with sulfuric acid. The final concentrations of sulfuric acid in the samples were adjusted to 2% and 4%. The hydrolysis was conducted in a steam autoclave at a temperature of 121 °C for one hour (NREL Technical Report: NREL/TP-510-42618). The amount of solid residue after hydrolysis was determined gravimetrically by simple filtration using glass microfiber filters (Whatman, 934-AHTM, diameter 70 mm) and expressed as acid-insoluble lignin.

2.4.2. Soluble Lignin

The lignin content was determined using a UV-visible spectrophotometer. The absorbance of the filtrate after acid hydrolysis was measured at a wavelength of 205 nm. When needed, the samples were diluted with deionized water to obtain a final absorbance between 0.2 and 0.8.

2.4.3. Monomeric Sugar Content

The monomeric sugars were determined by an ion chromatography with a Pulse Amperometric detector. A Dionex Ion Chromatograph (IC) equipped with ED-50 detector and a CarboPac PA1 column using distilled water as a mobile phase at a flow rate of 1.0 cm3·min−1 and oven operating at ambient temperature was used to separate the sugars. The order of elution is arabinose, galactose, glucose, xylose, and mannose. Deoxy-D-glucose was used as an internal standard. A solution of 0.5 mol.dm−3 NaOH flowing at 0.25 cm3·min−1 was used to wash the column.
Before analysis, the filtrates were filtered by a syringe-driven filter unit (Millex-SV, 5.00 µm).

2.4.4. Oligomeric Sugar Content

To determine the total sugar content, the samples were hydrolyzed to convert the oligomeric sugars into monomeric sugars. Two 5 cm3 samples of each fraction were placed in tubes of 15 cm3. Samples of 100 mm3 and 200 mm3 of 1000 kg·m−3 sulfuric acid were added to achieve final concentrations of 2% and 4%, respectively. The tubes were then hydrolyzed for one hour in an autoclave at 121 °C. The oligomeric sugar content was calculated as the total sugar content minus the monomeric sugars measured in Section 2.4.3 (without acid hydrolysis).

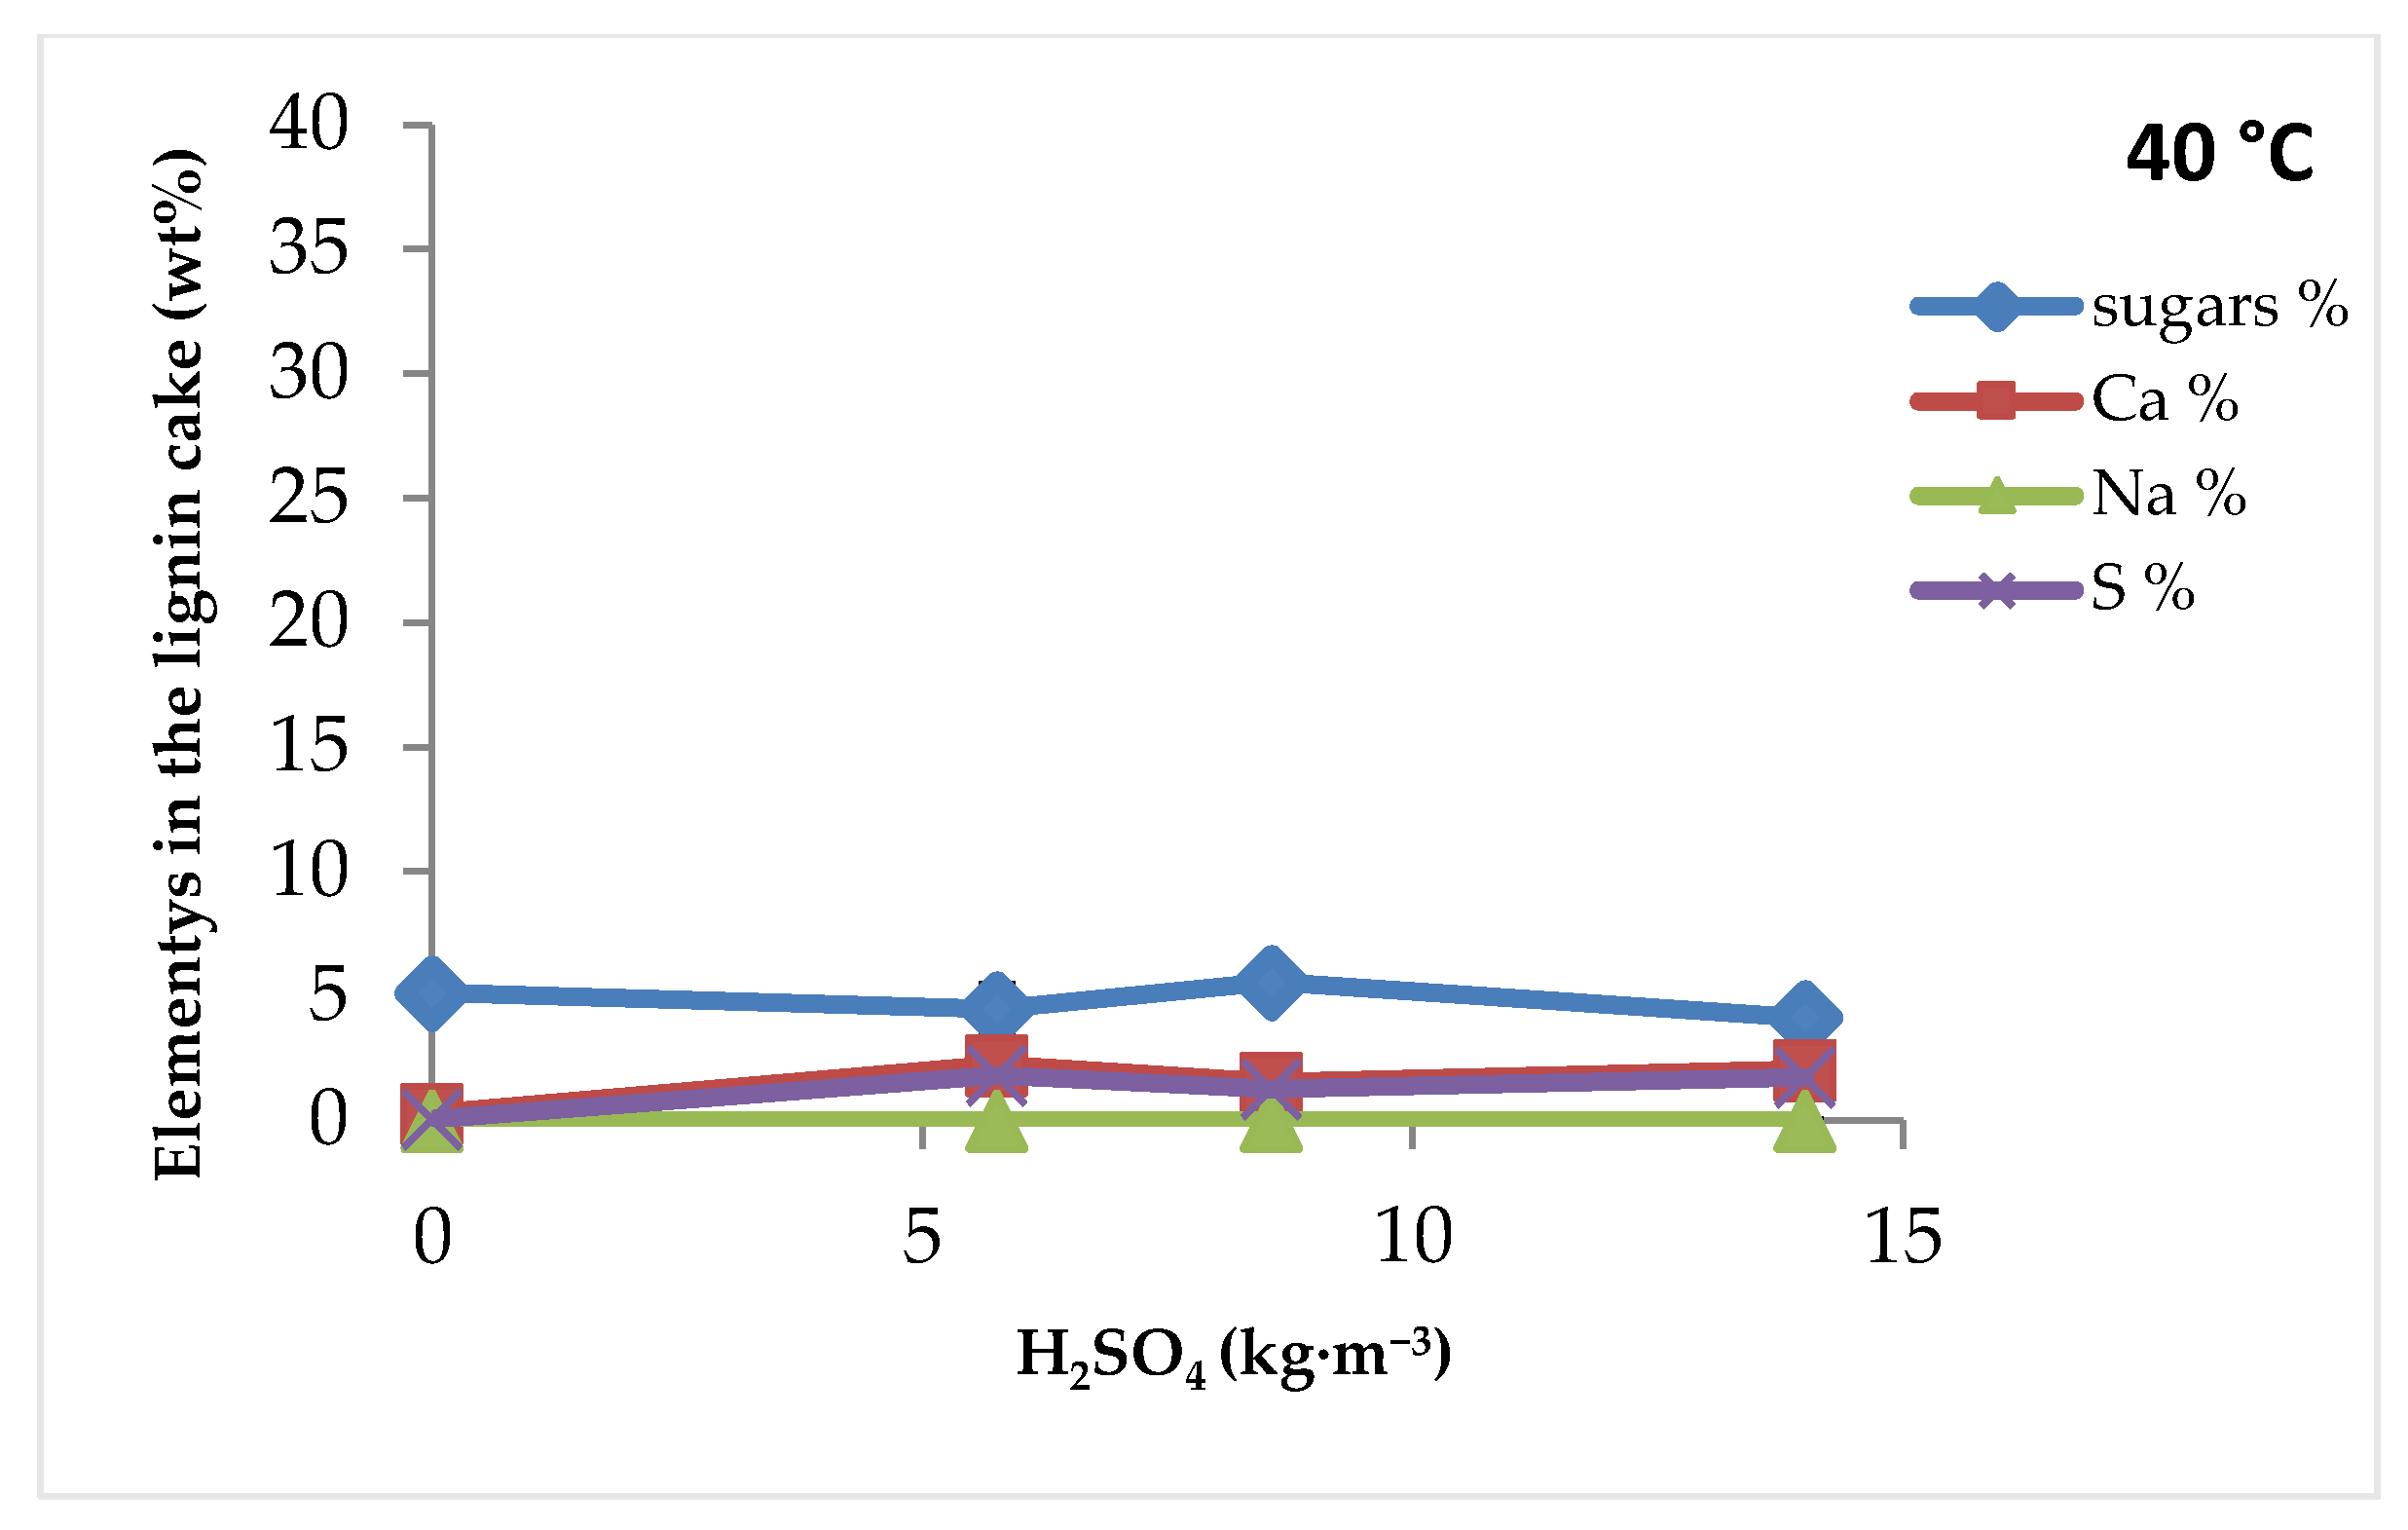
2.4.5. Sodium and Sulfur

Sodium and sulfur were determined by emission spectroscopy using an emission spectrophotometer plasma commonly called Inductively Coupled Plasma (ICP). The instrument used was a Thermo Fisher Model iCAP6500 Duo.

2.4.6. Molecular Weight

To determine the molecular weight of the lignin, gel permeation chromatography was used. The system employed three columns and three detectors in series. Columns can separate molecules having molecular weights between 100 Da and 1000 kDa. The detectors used were UV detector and MALLS detector (Multi-angle laser light scattering). The solvent used to solubilize the lignin was tetrahydrofuran (THF).
Since lignin is not soluble in THF, the lignin samples were modified by “acetobromination” to solubilize them. The acetobromination of lignin was carried out as follows:
A sample of 10 mg of lyophilized lignin was weighed in a 40-cm3 flask. Then, 2.5 cm3 of acetyl bromide/acetic acid (8:92 v/v) were added. The mixture was digested at 50 °C for 2 h with occasional stirring. The solvent was evaporated using a rotary evaporator at 40 °C for 15 min under a vacuum of 30 mm Hg. The sample was dried in the lyophilizer overnight. The lignin obtained was dissolved in THF stabilized by BHT (butylated hydroxytoluene). About 1 cm3 of the solution was filtered using a polytetrafluoroethylene (PTFE) filter of 0.2 μm porosity.
A solution of BHT-THF having a flow rate of 1 cm3·min−1 was used as the eluent. The analysis was performed after injecting 75 mm3 of the sample. Signal detection was performed using the two detectors: MALLS and UV.

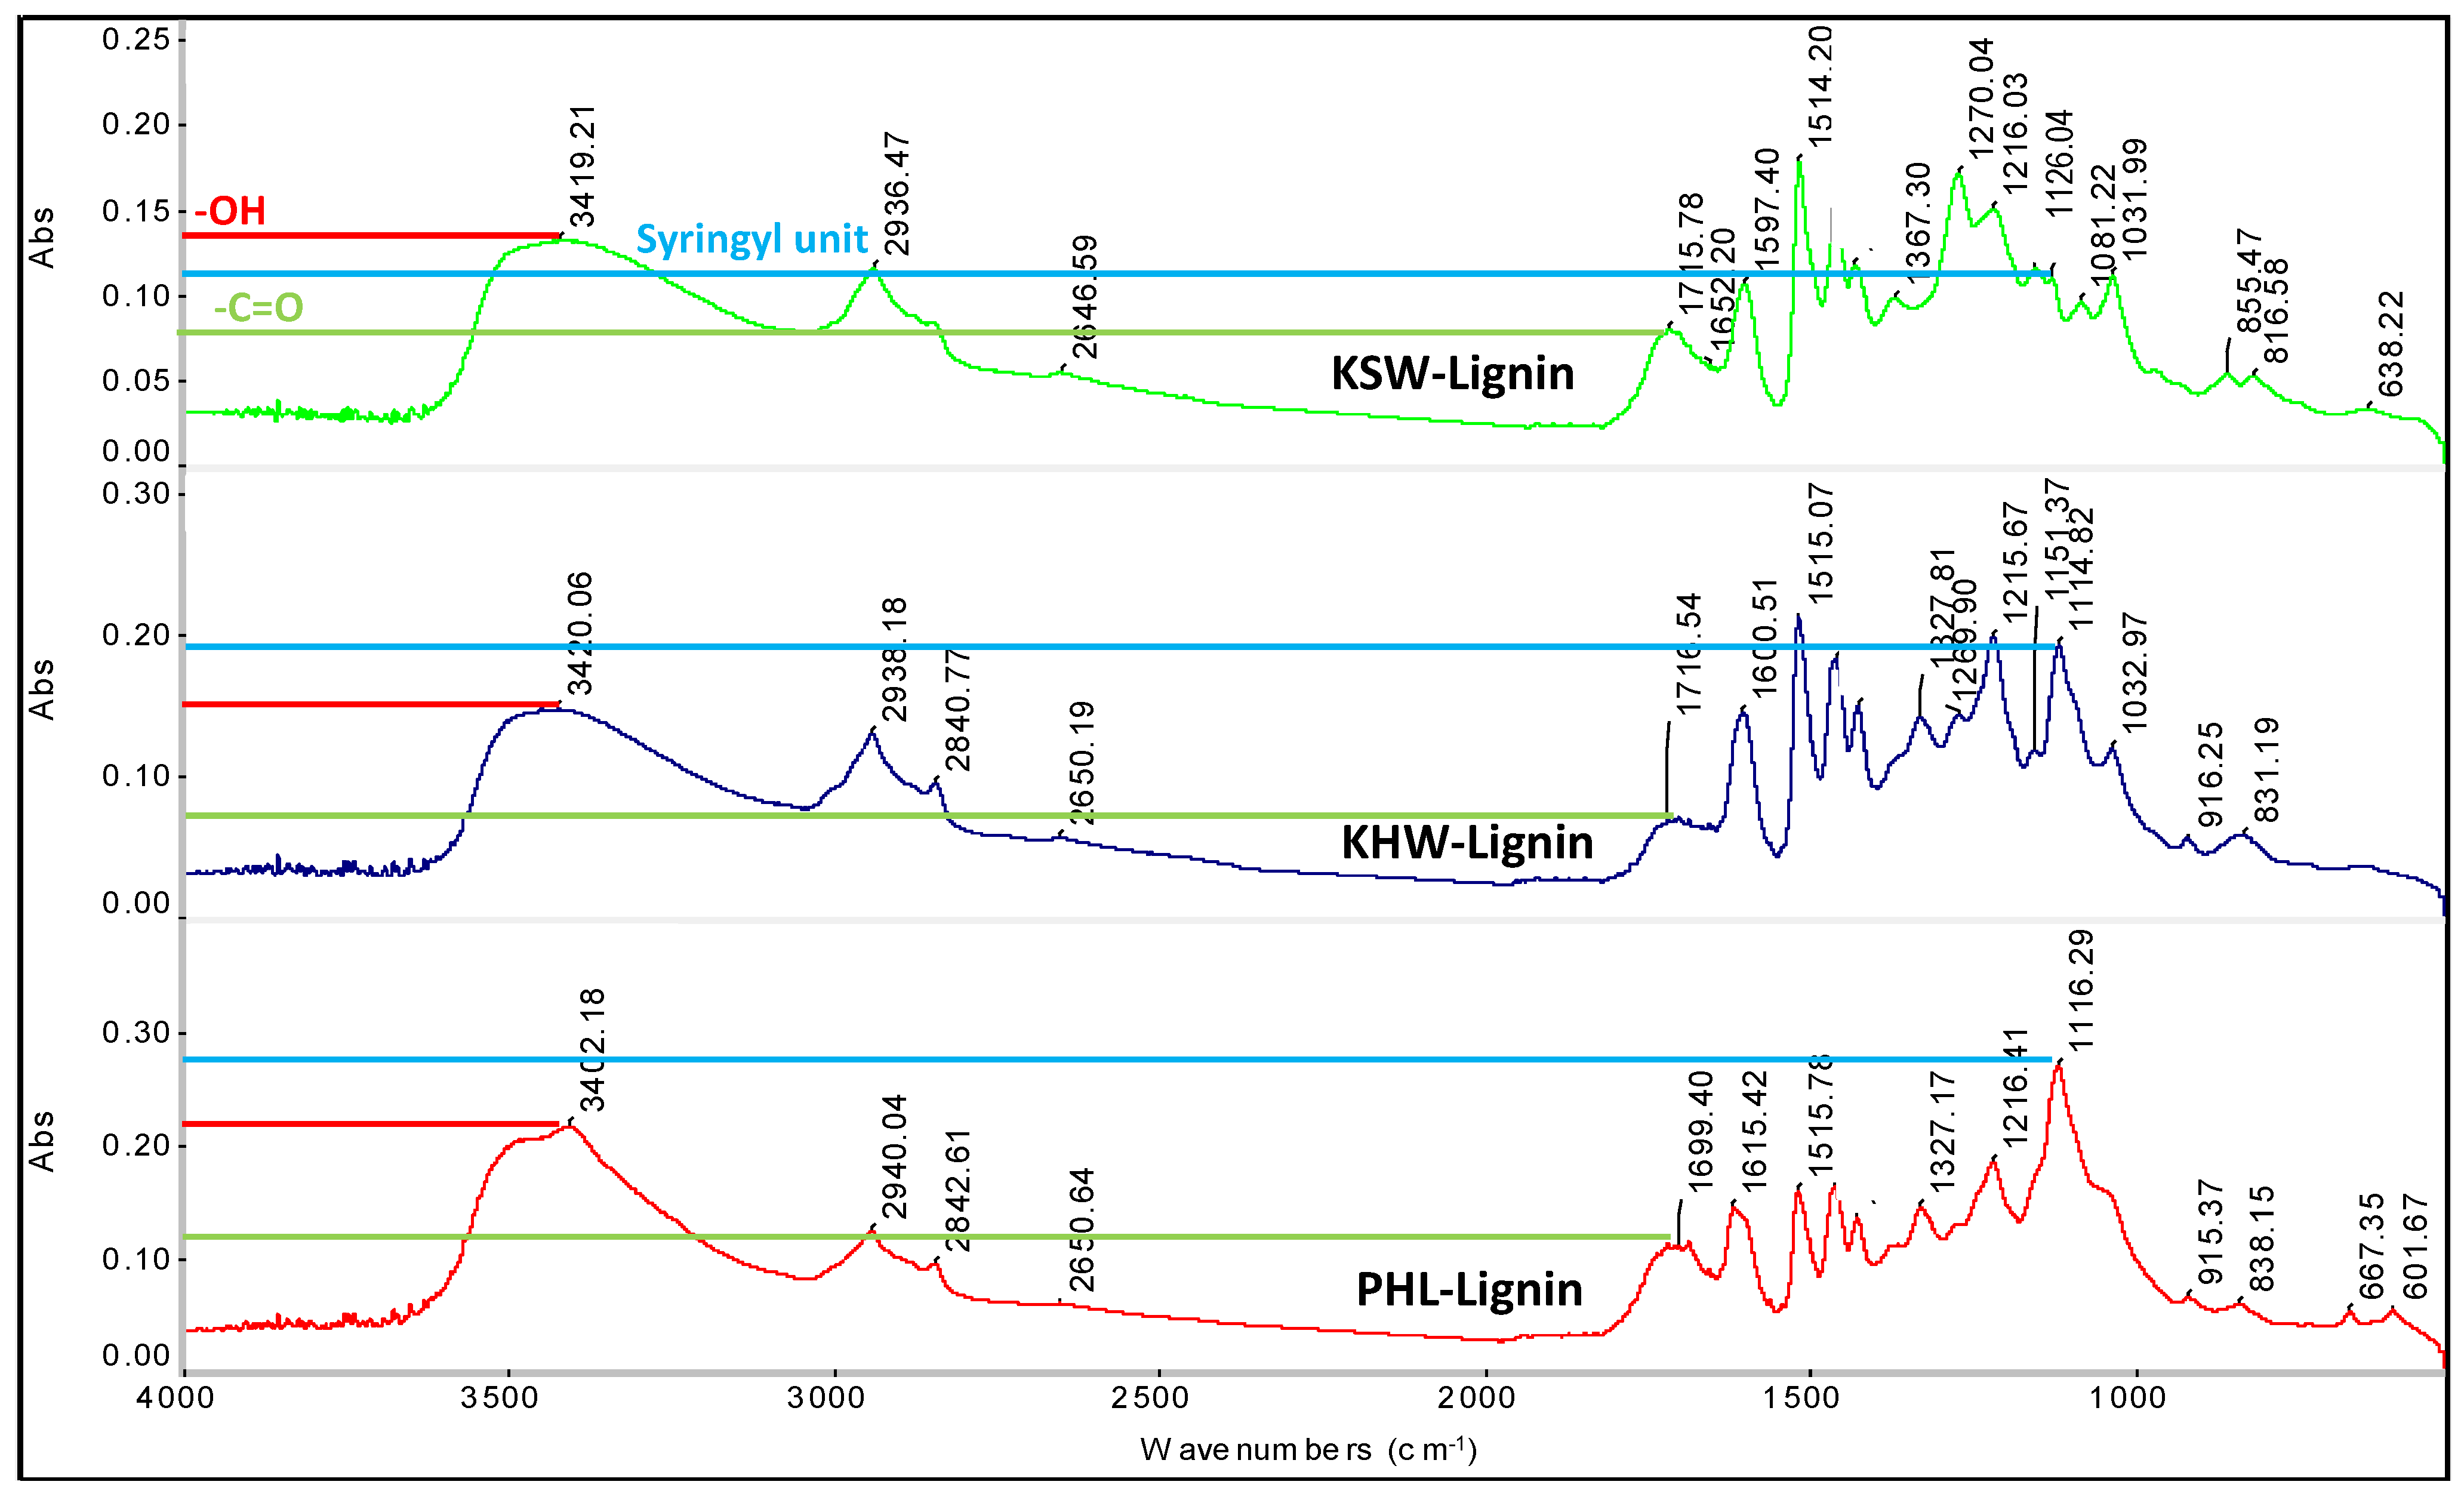
2.4.7. Fourier-Transform Infrared Spectroscopy (FTIR) Analysis

FTIR spectroscopy was employed using a Nicolet-6700 Fourier Transform Infrared Spectrometer with a universal attenuated total reflection (ATR) accessory for lignin samples to understand the changes in functional groups of the lignin structure. Spectra from 800 to 4000 cm−1 were collected for the sample powders in absorbance mode with 64 scans per spectrum at 4 cm−1 resolution.

2.4.8. Functional Groups

Quantitative 31P NMR spectra of all lignin preparations were obtained using published procedures. Approximately 30–40 mg of dry lignin was dissolved in 500 mm3 of anhydrous pyridine and deuterated chloroform (1.6:1, v/v) under constant stirring. This was followed by the addition of 100 mm3 of cyclohexanol (23.76 kg·m−3 in pyridine and deuterated chloroform 1.6:1, v/v) used as an internal standard and 50 mm3 of chromium (III) acetylacetonate solution (5.5 kg·m−3 in anhydrous pyridine and deuterated chloroform 1.6:1, v/v) used as a relaxation agent. Finally, 100 mm3 of phosphitylating reagent (2-chloro-4,4,5,5-tetramethyl-1,3,2-dioxaphospholane: TMDP) was added and the vial was sealed and shaken to ensure thorough mixing. The mixture was transferred into a 5-mm NMR tube for subsequent NMR analysis.
All NMR experiments were carried out at 25 °C on a VARIAN Unity INOVA 500 NMR spectrometer (serial number: 001059) operated at a 1H frequency of 500.13 MHz and equipped with a 5-mm broadband inverse probe. 31P NMR spectra were recorded with 32,768 data points and a spectral width of 60,606.06 Hz. A relaxation delay of 5 s was used, and the number of scans was 512. The 31P chemical shifts were referenced with respect to water signal at 132.2 ppm. Spectra were processed and analyzed using MestReNova 8.1 software package. All chemical shifts are reported relative to the products of TMDP with cyclohexanol, which has been observed to give a sharp signal at 145.15 ppm referenced from water signal (132.2 ppm) for the phosphitylating reagent. The content of hydroxyl groups was obtained by integration of the following spectral regions: aliphatic hydroxyls (150.4–145.5 ppm), condensed phenolic units (Diphenylmethane (DPM): 144.4–143.1, 4-O-5′:143.1–141.7, and 5-5′:141.7–140.8 ppm), condensed phenolic units (143.1–141.7 ppm), guaiacyl phenolic hydroxyls (140.3–138.3 ppm), p-hydroxylphenyl phenolics (138.3–137.3 ppm and 136.8–136.5 ppm), and carboxylic acids (135.9–134.0 ppm).

2.4.9. Calculations

The solute retention is calculated according to Equation (1).
Retention% = mr/mi × 100 = (Cr × Vr)/(Ci × Vi) × 100
where
-
mr and mi are solute mass in the retentate and the pre-hydrolysate, respectively;
-
Cr and Ci are solute concentrations in the retentate and the pre-hydrolysate, respectively; and
-
Vr and Vi are retentate and pre-hydrolysate volume, respectively.

2.4.10. Statistics

Error bars in this study represent standard deviations. They were calculated using Microsoft Excel from at least two replicate measurements.

3. Results

In this study, the membrane efficiency and its effect on lignin and sugar recovery will not be discussed. In fact, this was already investigated in a previously published paper [18]. The membrane which gave the best results in terms of lignin and sugars retention, flux through the membrane, and resistance to fouling was used in this work (1-kDa membrane). The concentration experiments were carried out under the same conditions (temperature = 60 °C and concentration factor = 5). Lignin and sugar retentions were maintained constant for almost all experiments (99.1% and 99.7%, respectively).

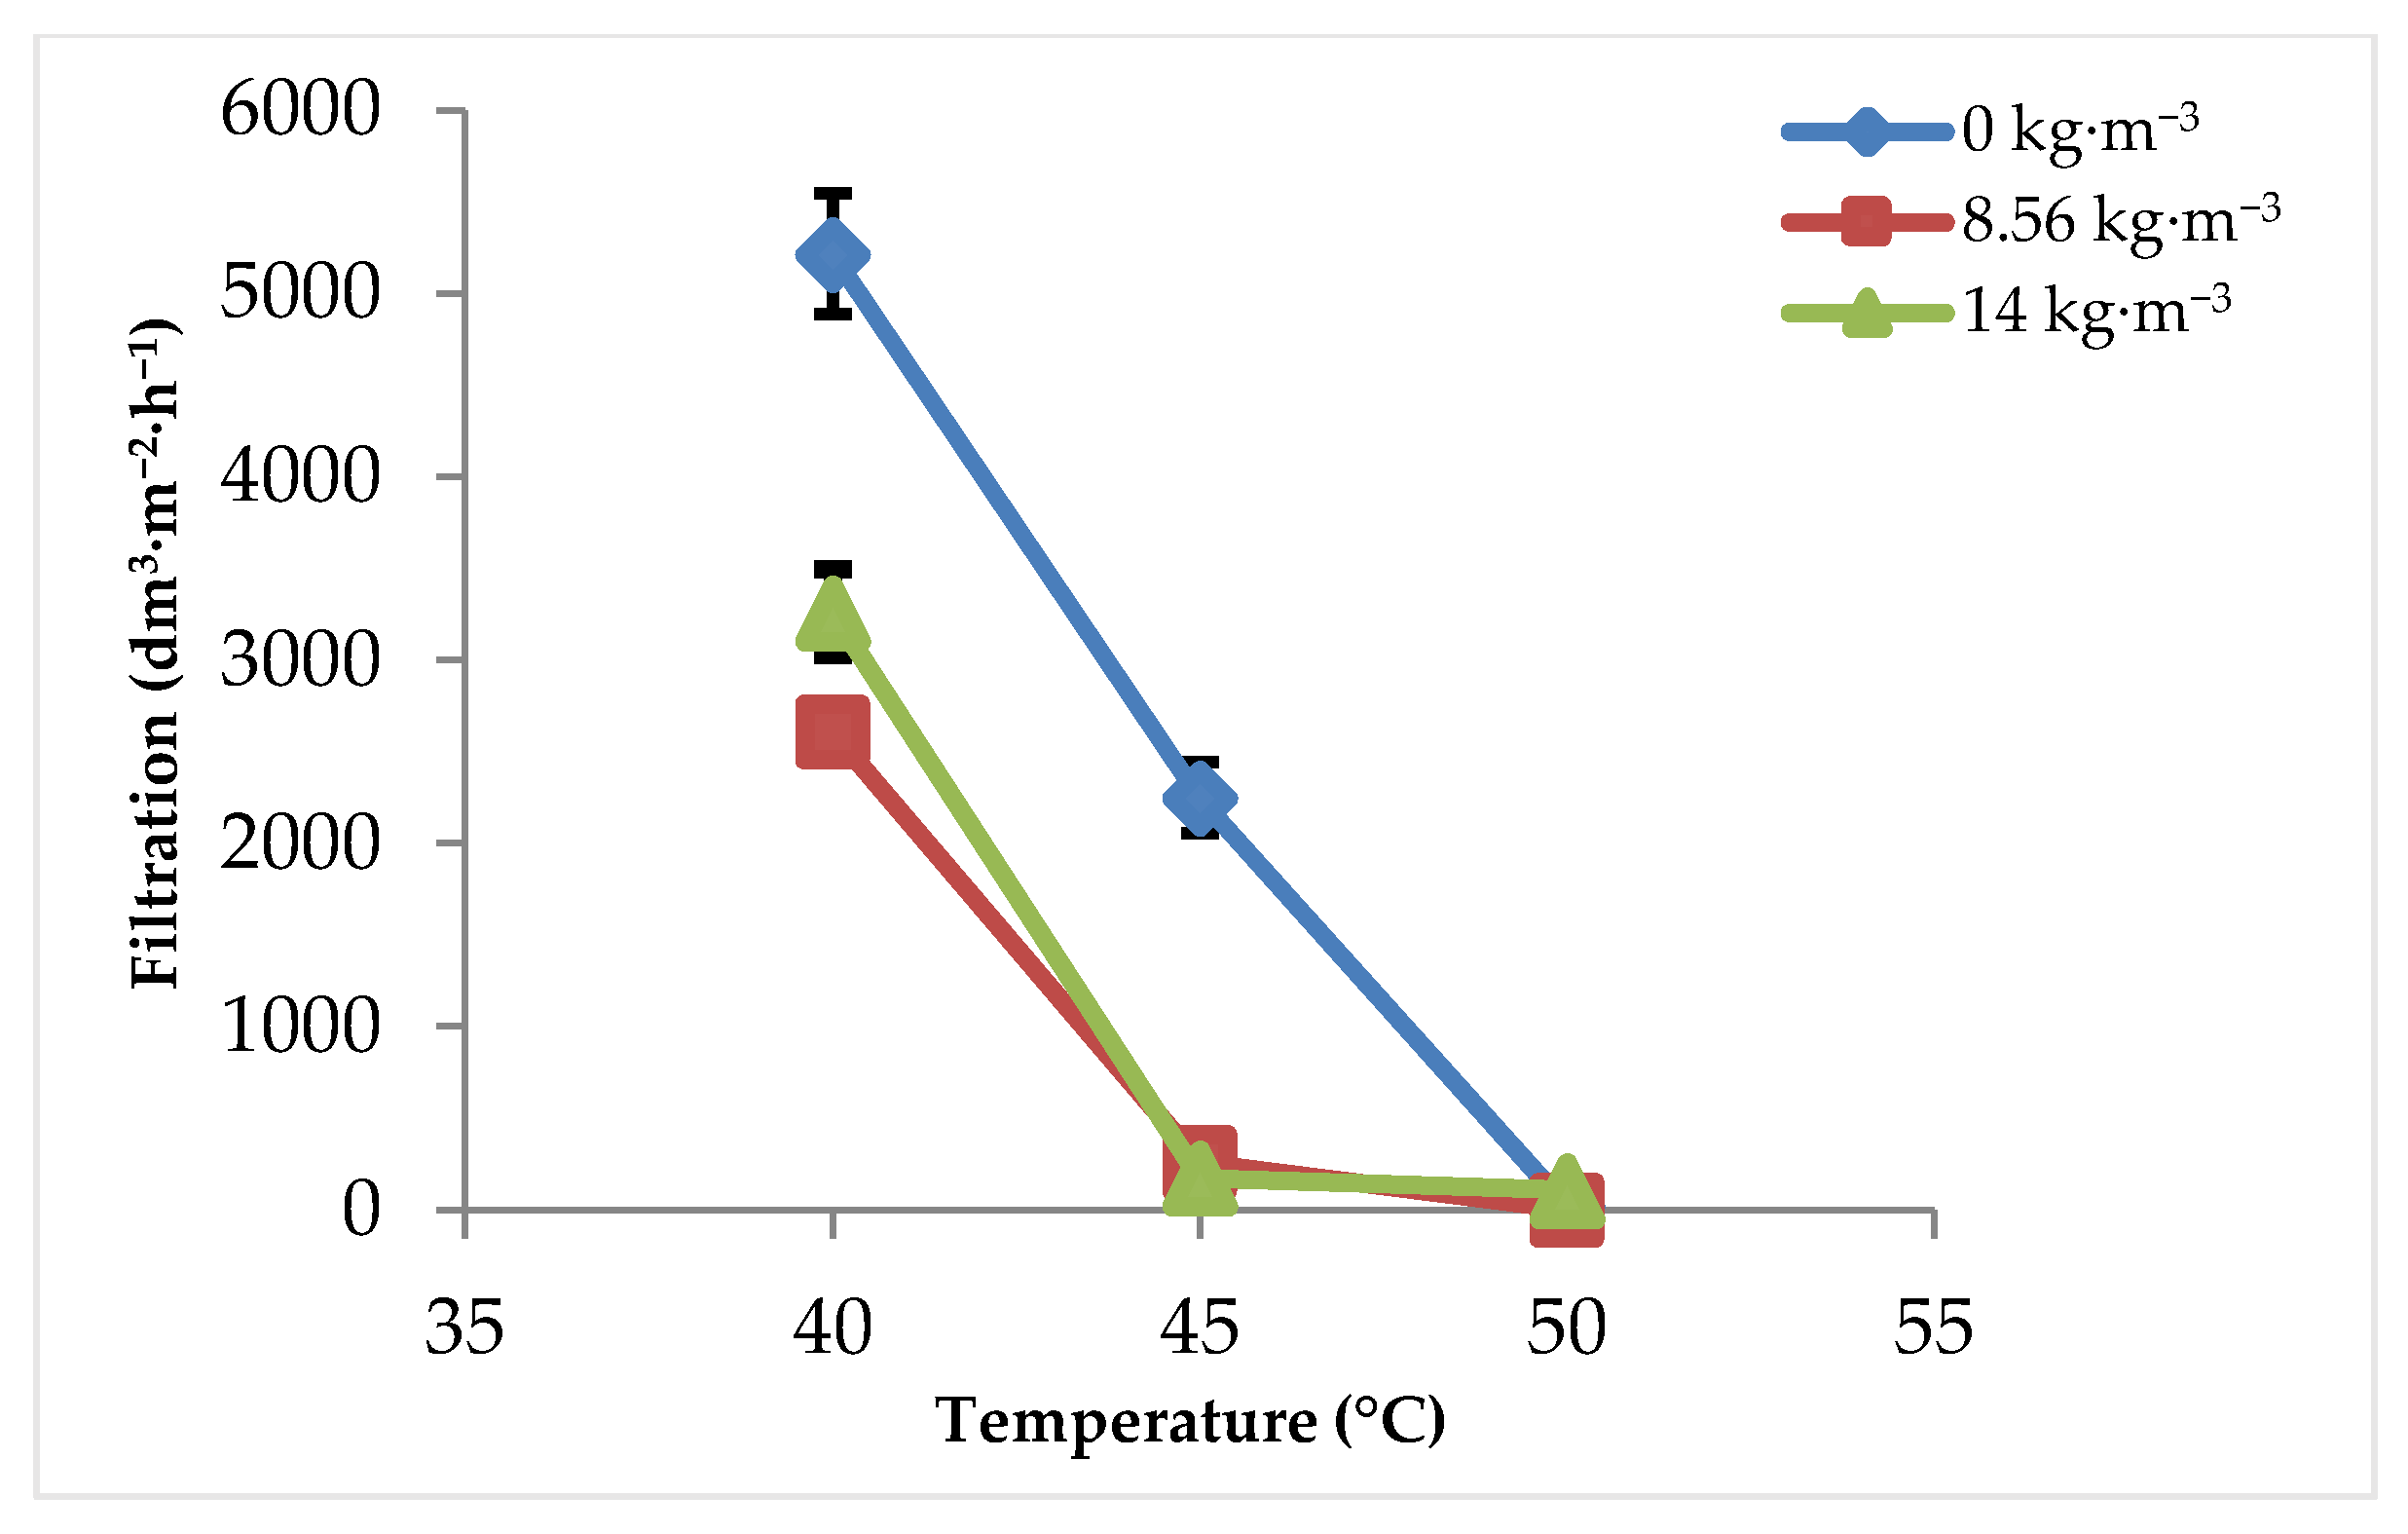
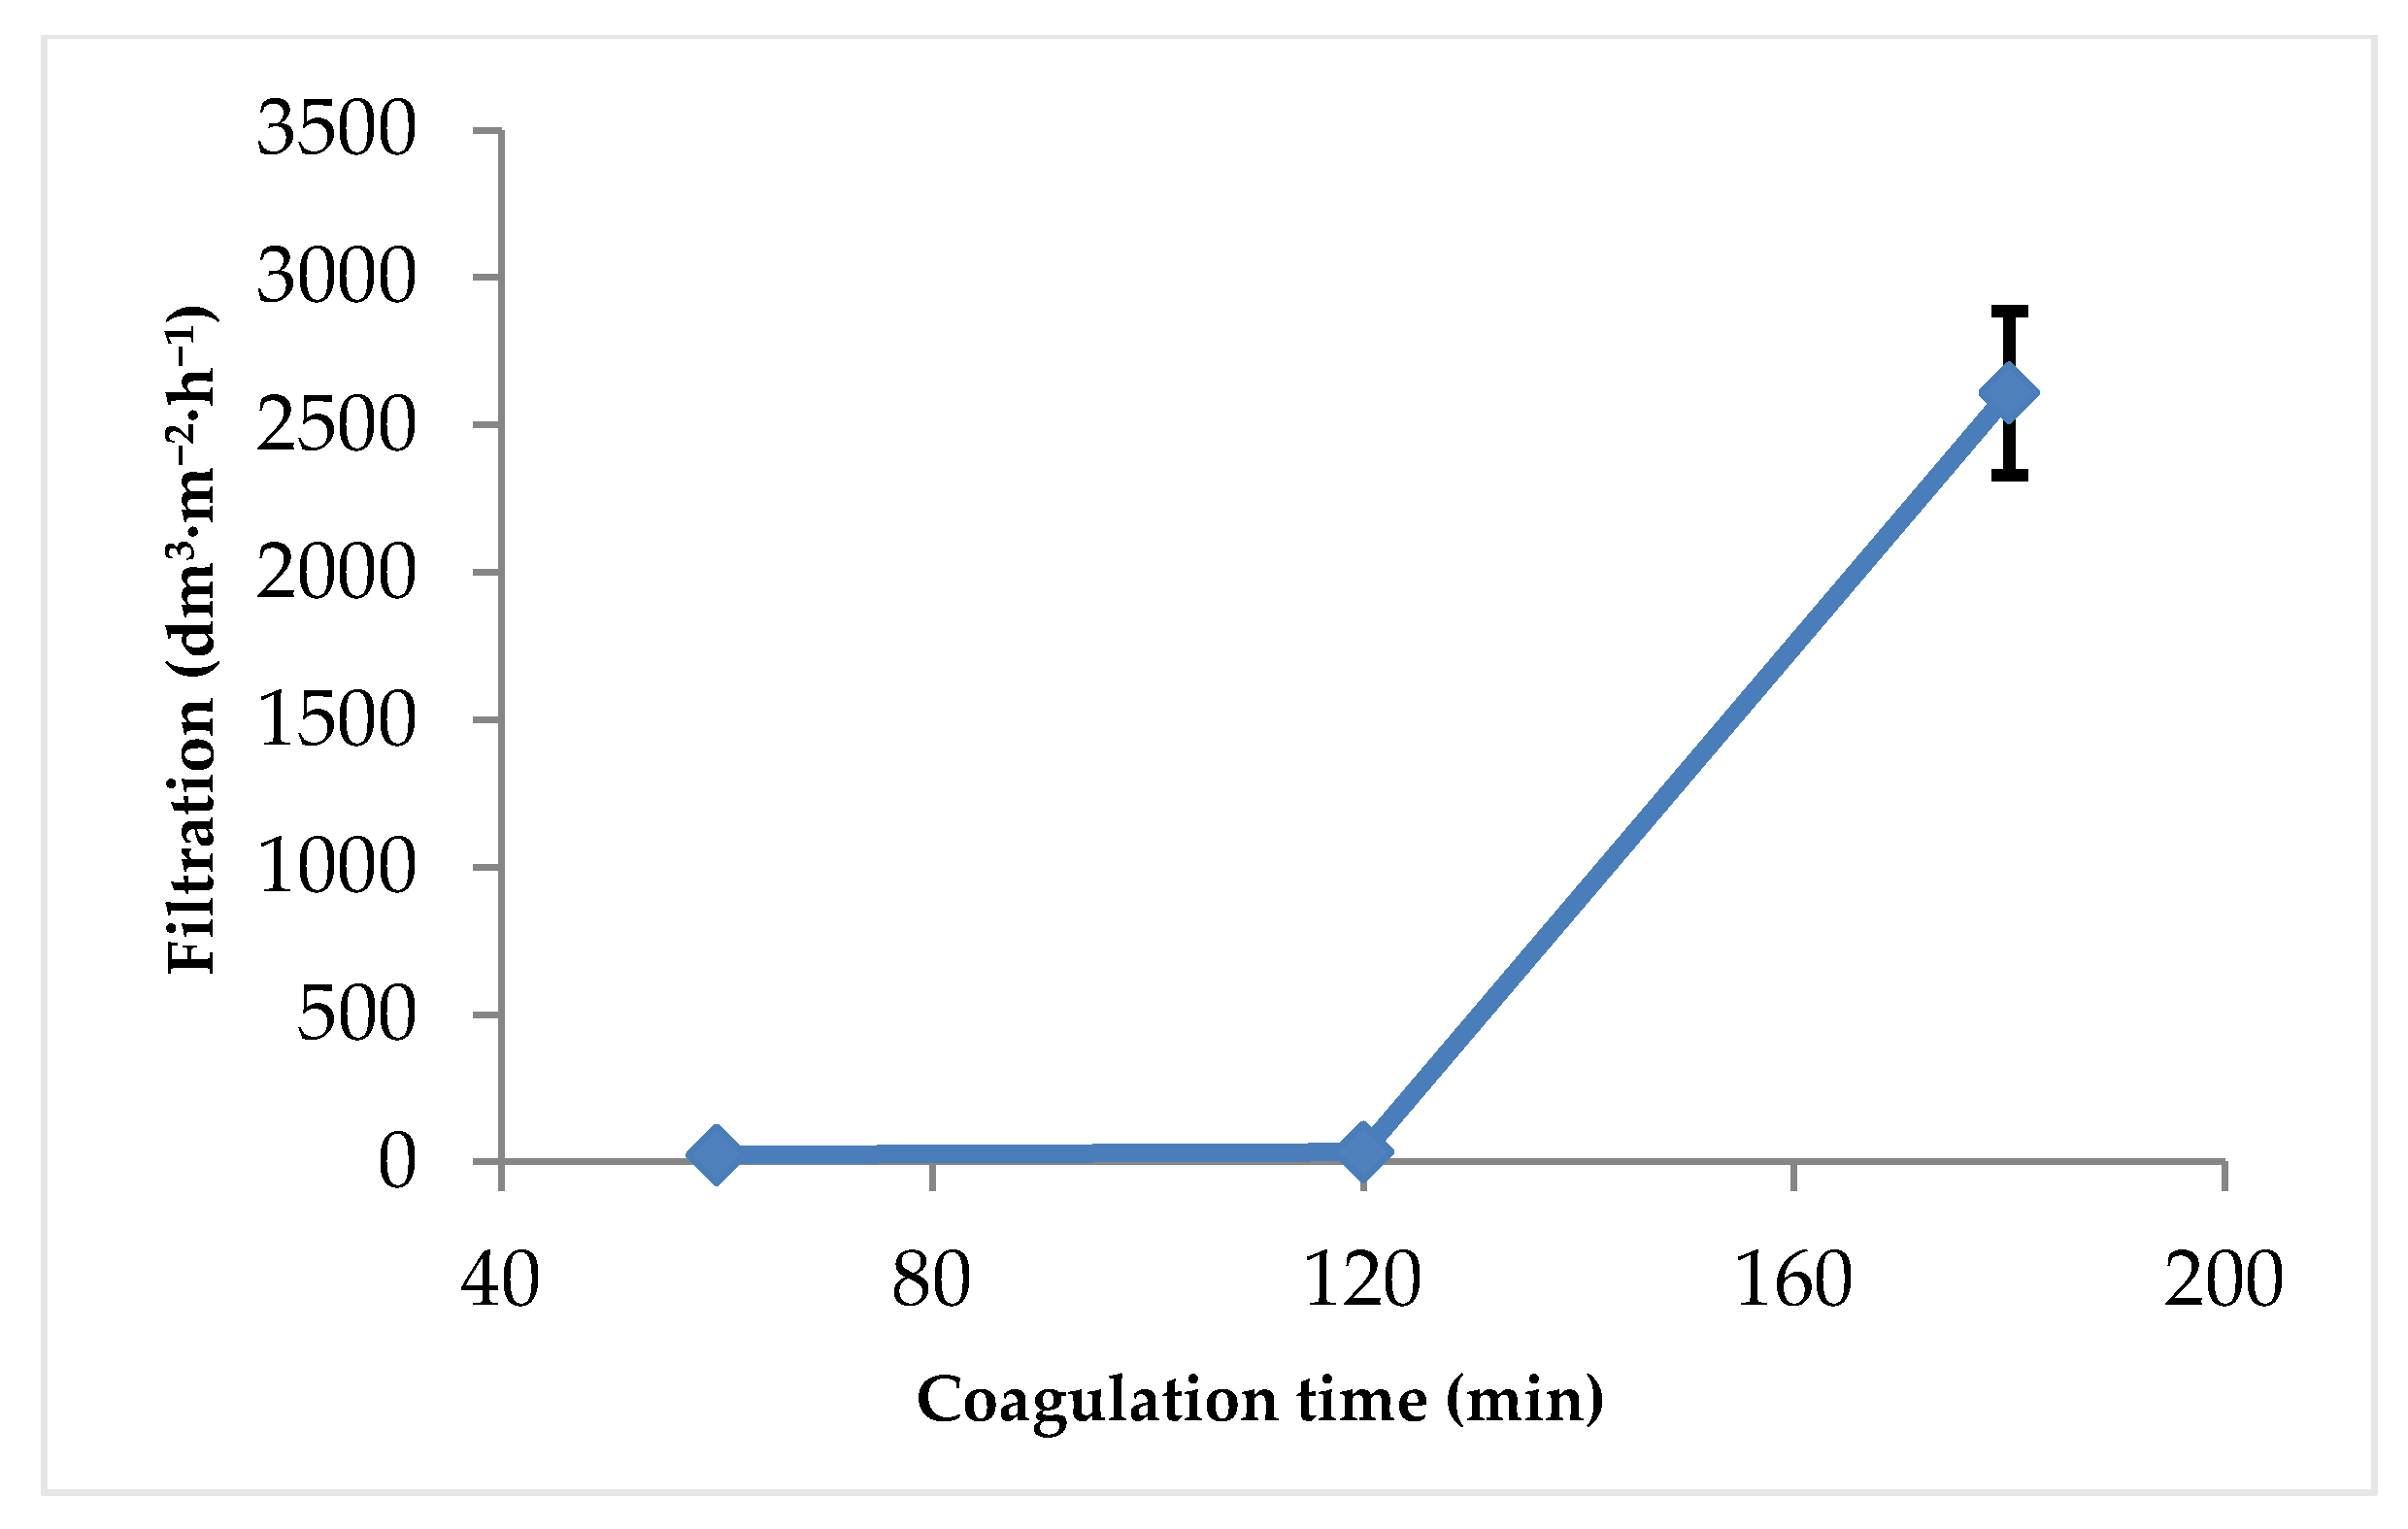
3.1. Filtration Rate

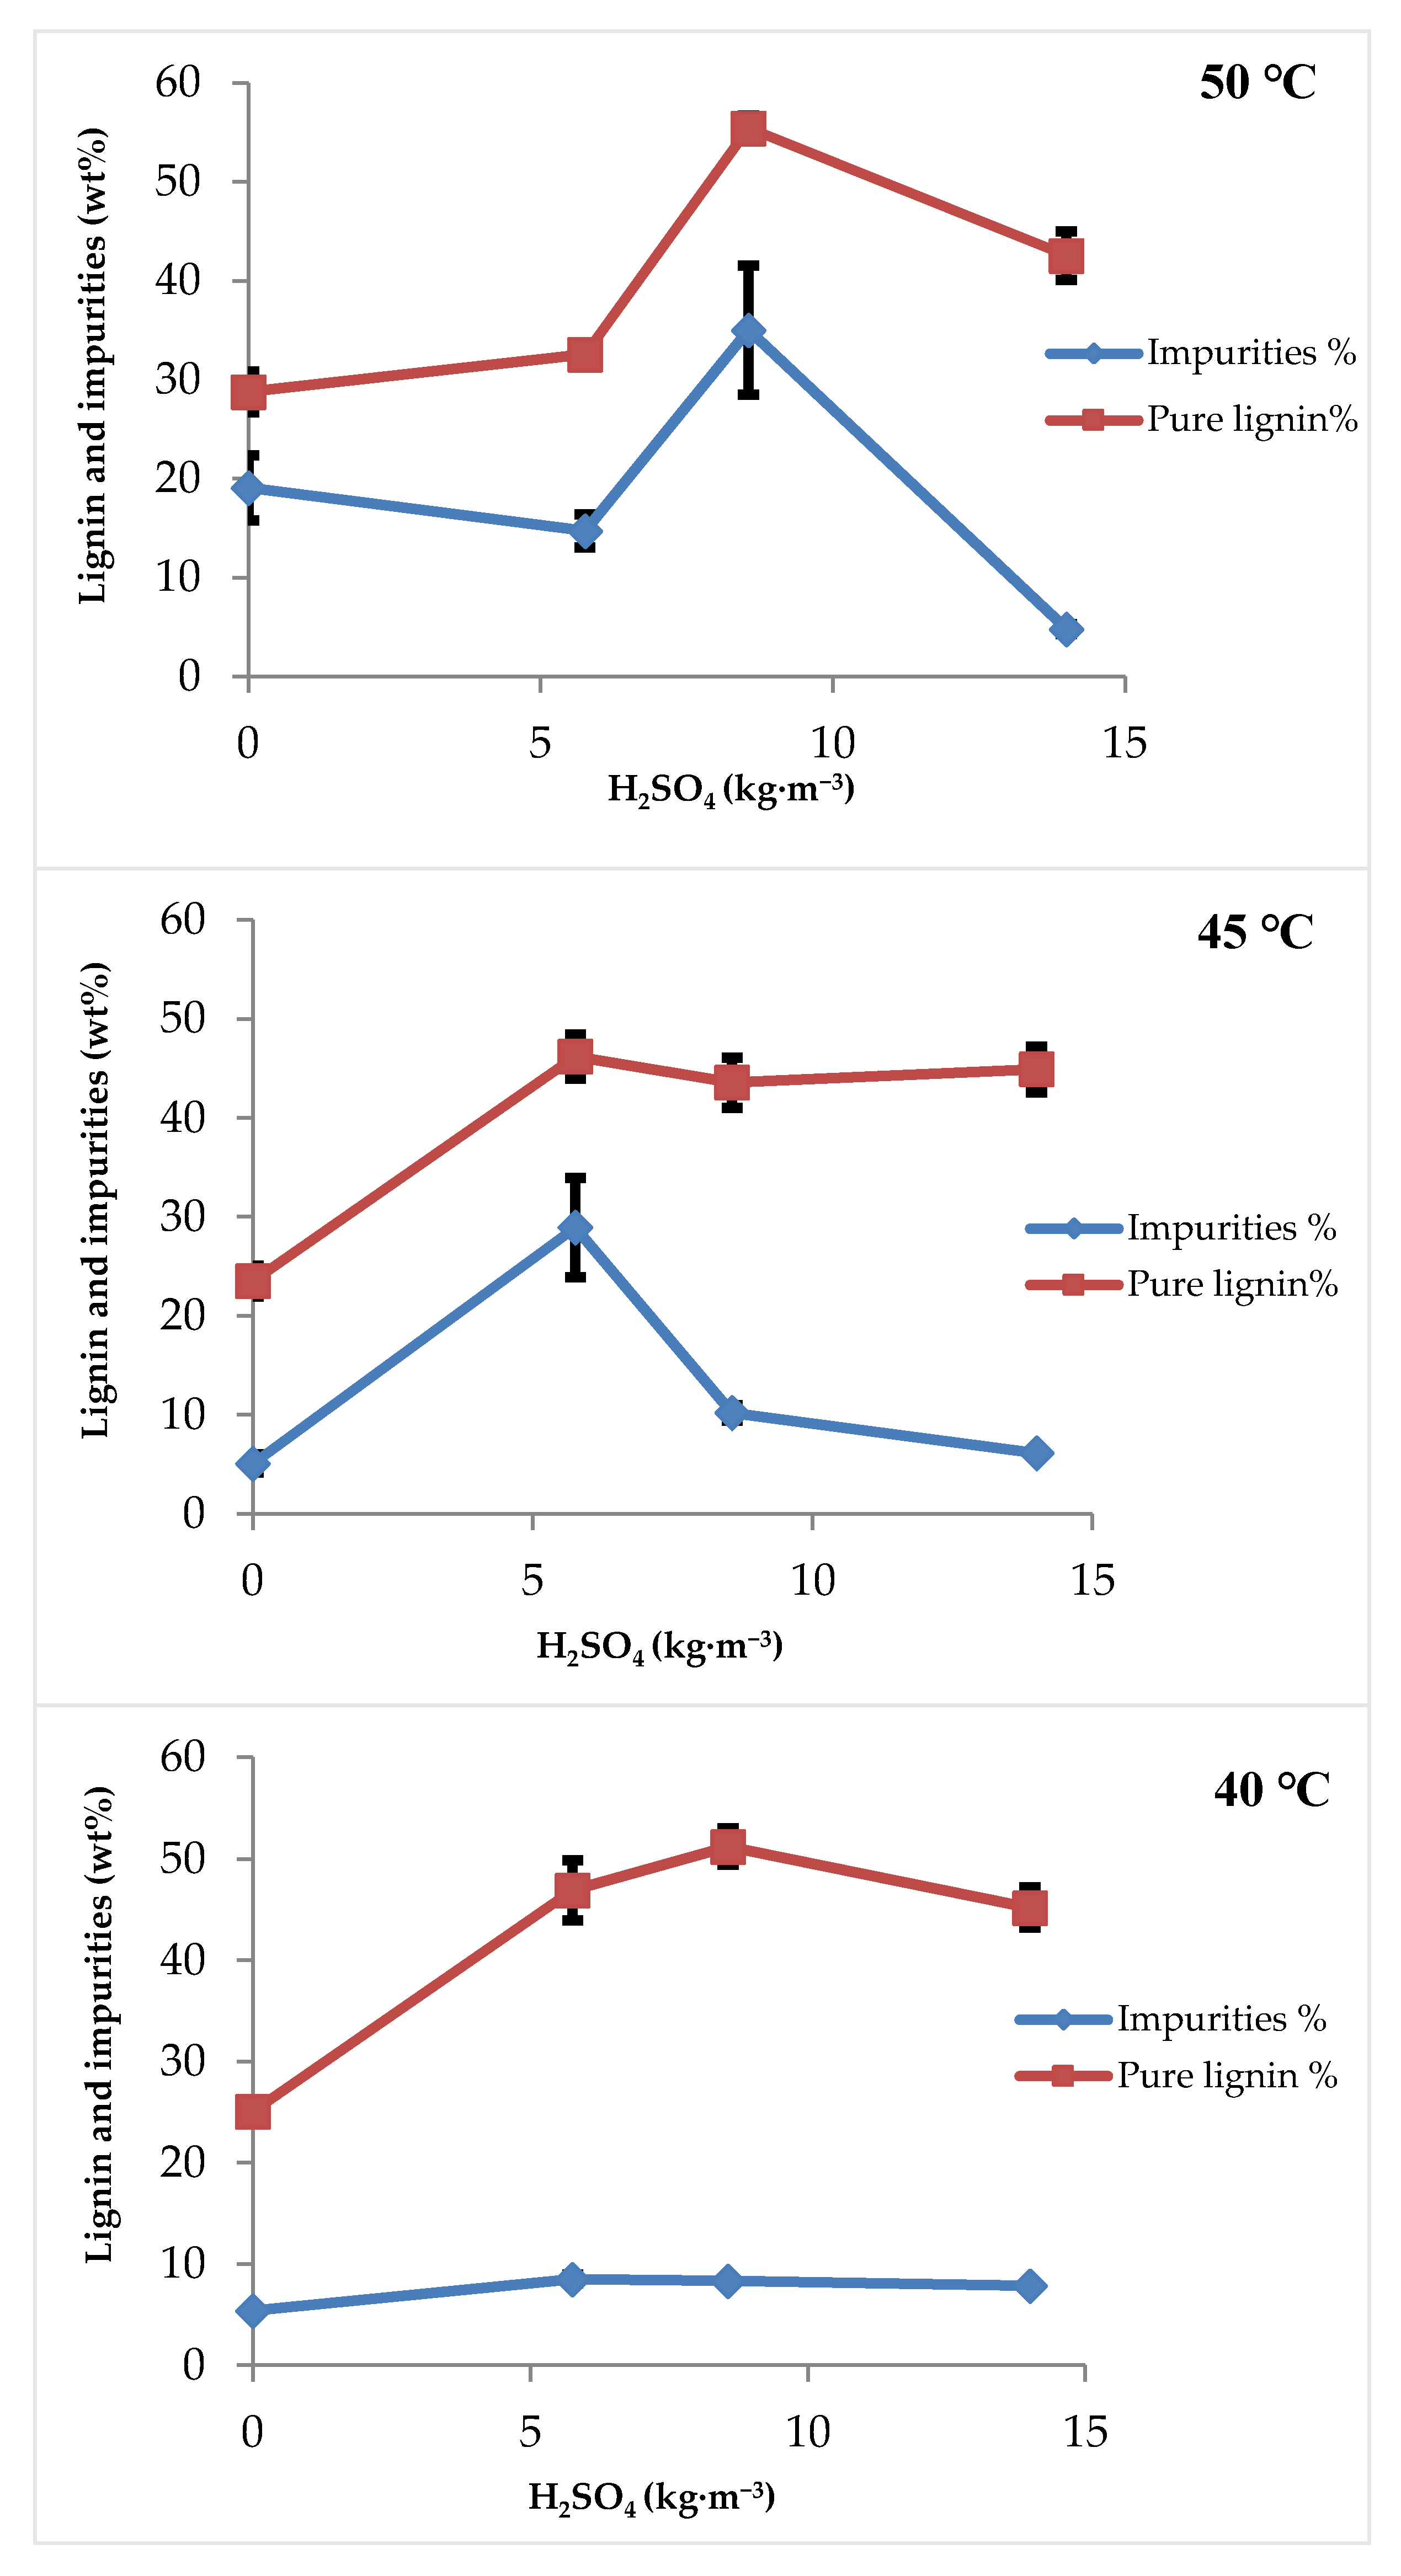
3.1.1. Effect of Sulfuric Acid Concentration and Filtration Temperature

The effects of sulfuric acid concentration and temperature on the filtration rate are shown in Figure 2. In general, there is a significant decrease in filterability as the temperature increases. With no sulfuric acid added, the filterability of the solution after coagulation decreased from 5216 dm3·m−2·h−1 at 40 °C to 2248 dm3·m−2·h−1 at 45 °C and then to 21 dm3·m−2·h−1 at 50 °C. The same tendency was observed with increasing sulfuric acid concentration in a solution from 0 to 14 kg·m−3. It appears that acidification has a negative effect on filterability, and the best condition was observed when no sulfuric acid was added. At 8.6 and 14 kg·m−3 of sulfuric acid, the filterability curves were similar. However, a large increase in filterability was observed when no acidification was applied. It is worth mentioning that, without acidification, the recoverable lignin was only the insoluble lignin in the concentrate. This lignin is characterized by its high molecular weight compared to the lignin that is still soluble in the pre-hydrolysate. This can explain the high filterability obtained when acidification was not applied. The soluble lignin is mainly stabilized because of the repulsive forces due to the presence of ionized phenolic hydroxyl and carboxylic groups. To recover higher lignin quantities, an acidification step should be used in the process. This leads to protonation of the dissociated phenolic hydroxyl groups of the lignin. As a result, repulsive forces decrease and more lignin precipitates [27]. With acidification, lignin with a lower molecular weight starts to precipitate [28], thus leading to a decrease in filterability of the solution. At 45 and 50 °C and after acid addition, the filterability was low, as indicated in Figure 2. At a temperature of 40 °C and any acid concentration, the filtration rate is significantly higher compared to those obtained at temperatures of 45 and 50 °C.

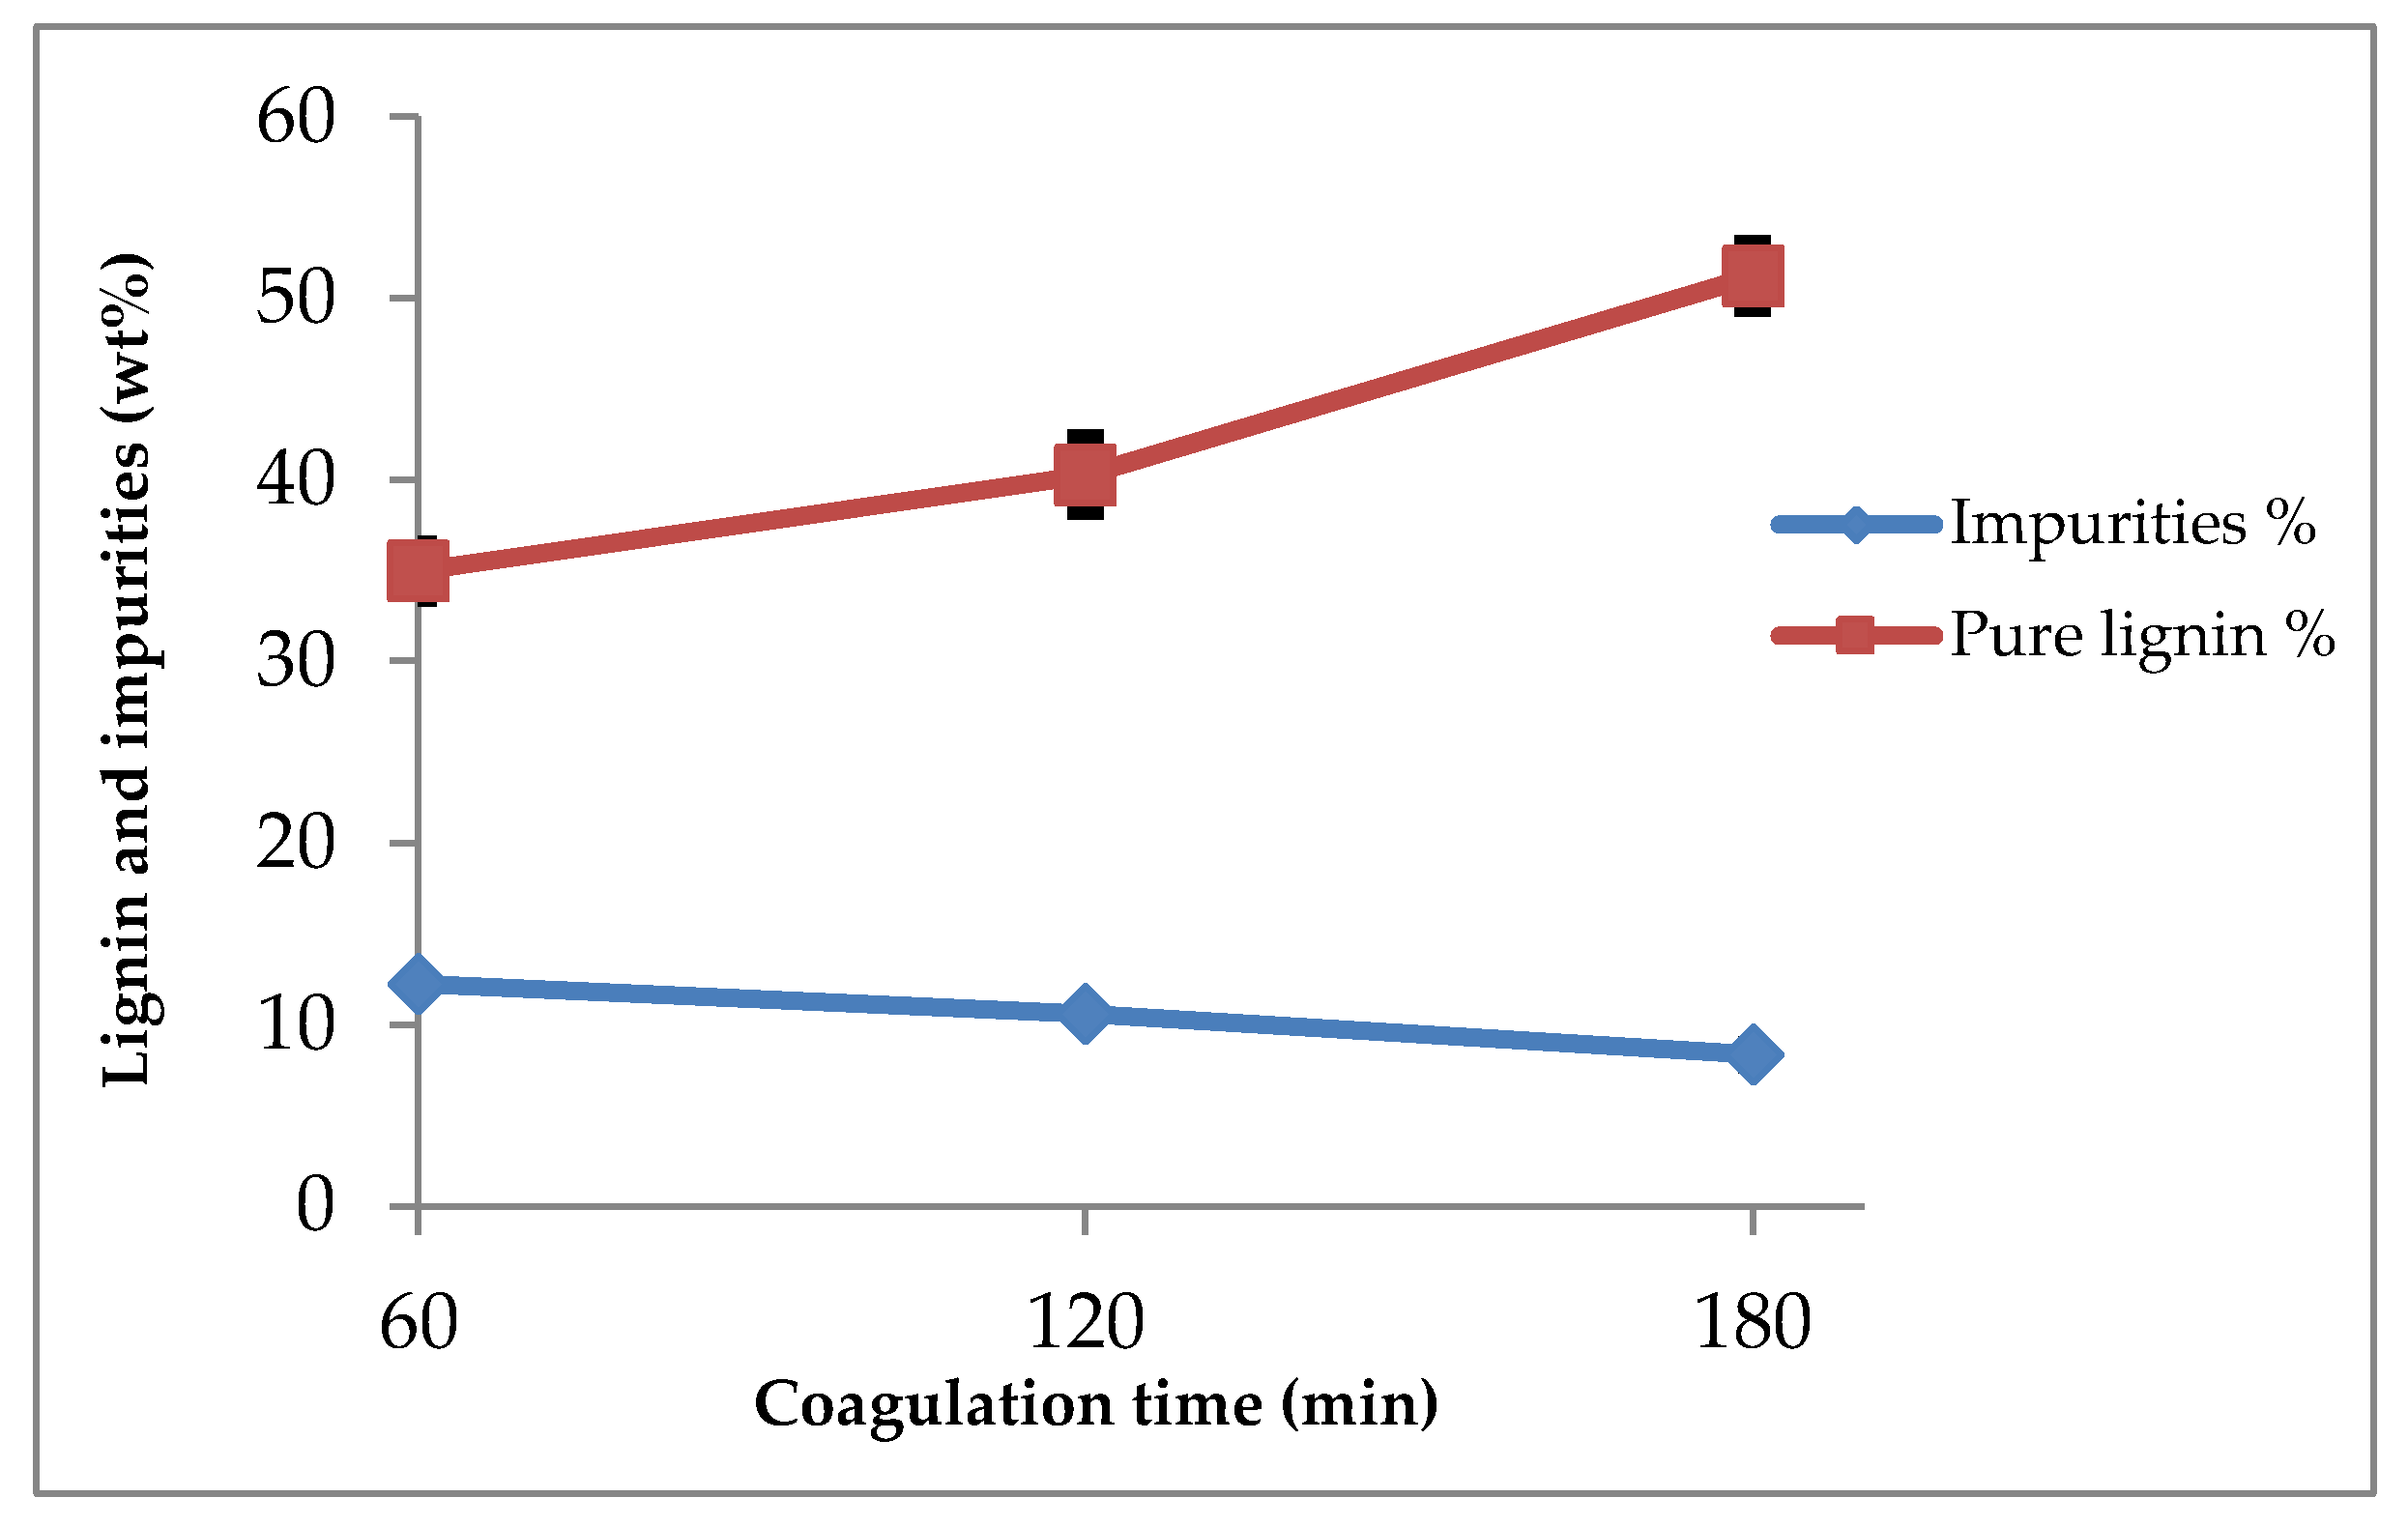
3.1.2. Effect of Coagulation Time

The effect of coagulation time on the filtration rate of the lignin-containing solution is shown in Figure 3. After 60 and 120 min of coagulation, the filtration rates were poor, 25.1 and 33.4 dm3·m−2·h−1, respectively. The filterability was increased to 2608 dm3·m−2·h−1 when the coagulation time was increased to 180 min. This is logical because giving enough time for the lignin molecules to sufficiently coagulate can be beneficial for the filtration step. As discussed before, when the concentrate is acidified, more molecules of lignin with a low molecular weight are precipitated. These low molecular weight molecules require time to agglomerate and form larger particles. The particles of lignin should have a reasonable size in order to obtain a high filtration rate, and this can be achieved by allowing sufficient time for the coagulation step. As a result, a considerable increase in the flux is achieved. Furthermore, this will reduce the size of the filter and will allow savings in the capital cost of the filtration unit.

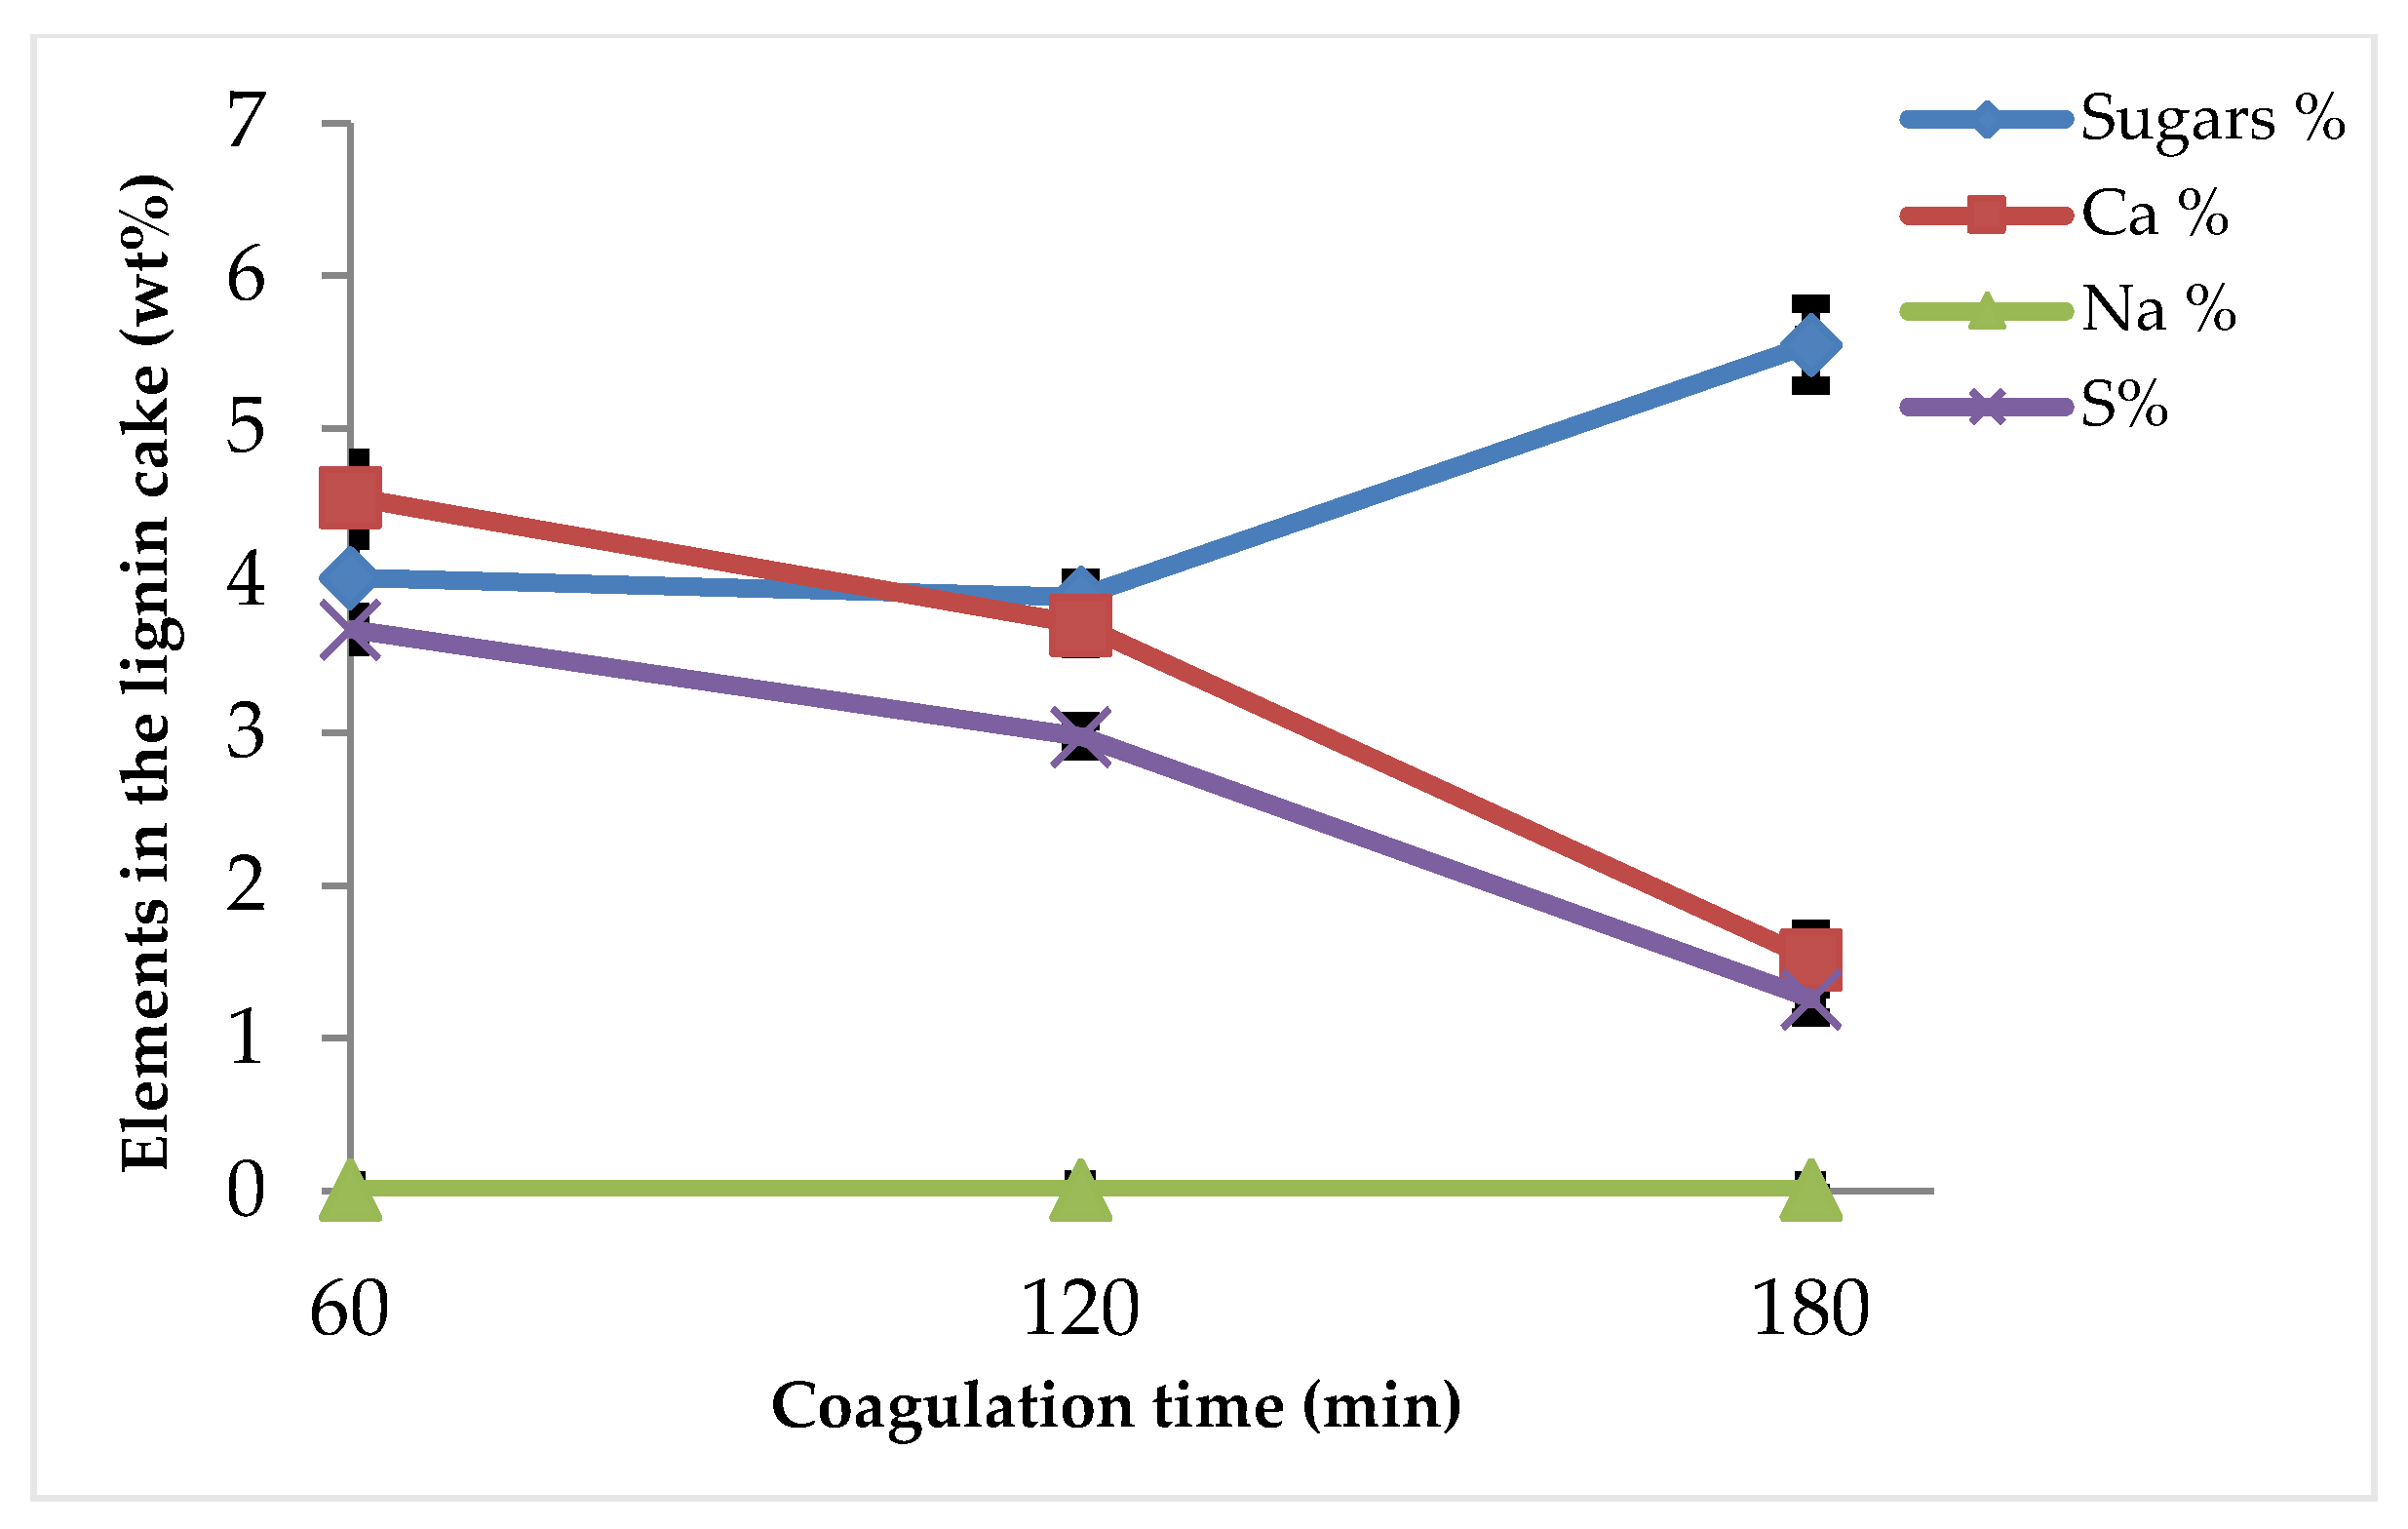
3.2. Purity of Lignin

3.2.1. Effect of Coagulation Time

The purity of lignin is an important parameter. Elements such as sulfur, calcium, and sodium can be found in the final lignin product. The variation in the levels of several elements present in the lignin cake as a function of coagulation time is shown in Figure 4. The sodium content in the pre-hydrolysate is low since chips were not treated with white liquor as in the kraft pulping process. As seen, it is clear that the purity of the obtained lignin is influenced by the coagulation time. In fact, the percentages of calcium and sulfur decrease significantly with increasing coagulation time. Calcium, sulfur, and sugars levels of 4.5%, 3.7%, and 4.0%, respectively were measured when the coagulation time was 60 min. The increase in coagulation time to 180 min led to a decrease in the percentage of calcium (1.5%) and sulfur (1.25%). However, the sugar level at that point increased to 5.5%. As discussed above, a higher coagulation time leads to higher filtration rates, which allow soluble species to pass easily through the lignin cake and to not be partially retained. Most of the Na, S, and Ca are soluble in the acidified filtrate and are expected to pass through the filter after good coagulation. For this reason, their levels decreased as the coagulation time increased. Most of the sugars are in the oligomeric form and are bound to lignin. As the coagulation time increases, the lignin particles (together with the sugars) become larger and more sugars are precipitated with the lignin. This leads to an increase in the lignin cake’s sugar content.

3.2.2. Effect of Sulfuric Acid Concentration and Filtration Temperature

Figure 5 presents the percentages of Na, S, Ca, and sugars in the lignin cake as a function of sulfuric acid in the solution at temperatures of 40, 45, and 50 °C. At 14.7 kg·m−3 of acid, the Ca, Na, and S contents are the lowest at 45 and 50 °C. However, these temperatures are not recommended as the filtration rates are low, as shown in Figure 2. The sugar, Na, Ca, and S contents seem to be almost constant at 40 °C, irrespective of the concentration of the sulfuric acid. Thus, the lowest total impurity level of 8.5% can be achieved at 40 °C and a sulfuric acid concentration of 5.76 kg·m−3 (4.47% sugars, 0.007 % sodium, 1.79% sulfur, and 2.23 % calcium).

3.3. Lignin Quantity

3.3.1. Effect of Coagulation Time

The variation in the percentage of lignin recovery as a function of coagulation time is shown in Figure 6 for experiments conducted at 40 °C. In fact, a recovery of about 35% of the initial lignin was observed using a coagulation time of 60 min. By increasing the coagulation time to 120 or 180 min, lignin recovery increased to 40.3 and 51%, respectively. As the coagulation time is increased, molecules of lignin (which are in suspension) have sufficient time to coagulate and form agglomerates of lignin that are large enough to be retained on the filter cake. At any time, fine lignin particles that did not agglomerate will pass through the cake and the filter. These fine particles are present in a considerable amount when coagulation time is short. A coagulation time of 180 min gave the lowest content of impurities in the lignin cake, as shown in Figure 6. The impurity level was 8.3%.

3.3.2. Effect of Sulfuric Acid Concentration and Filtration Temperature

Figure 7 presents the percentages of lignin recovered and the amounts of impurities as a function of sulfuric acid concentration and filtration temperatures of 40, 45, and 50 °C. The highest amount of lignin recovered in this study was 55.4%. It was recovered at 50 °C and a sulfuric acid concentration of 8.5 kg·m−3. However, under the same conditions, the cake also contained more than 35% of impurities. At the same temperature of 50 °C and at other sulfuric acid concentrations (0, 5.7, and 14 kg·m−3), not more than 43% of the initial lignin was recovered. The same observations can be made for the experiments conducted at 45 °C (Figure 7). Even though more than 40% of the initial lignin was recovered, the lignin cake still contained a high percentage of impurities when 5.7 and 8.5 kg·m−3 of sulfuric acid were used. Notably, a low percentage of lignin was recovered when no sulfuric acid was used. Except for the 0 kg·m−3 sulfuric acid concentration, all the other experiments carried out at 40 °C showed a recovery of lignin higher than 45% and a level of impurity less than 8.5%.

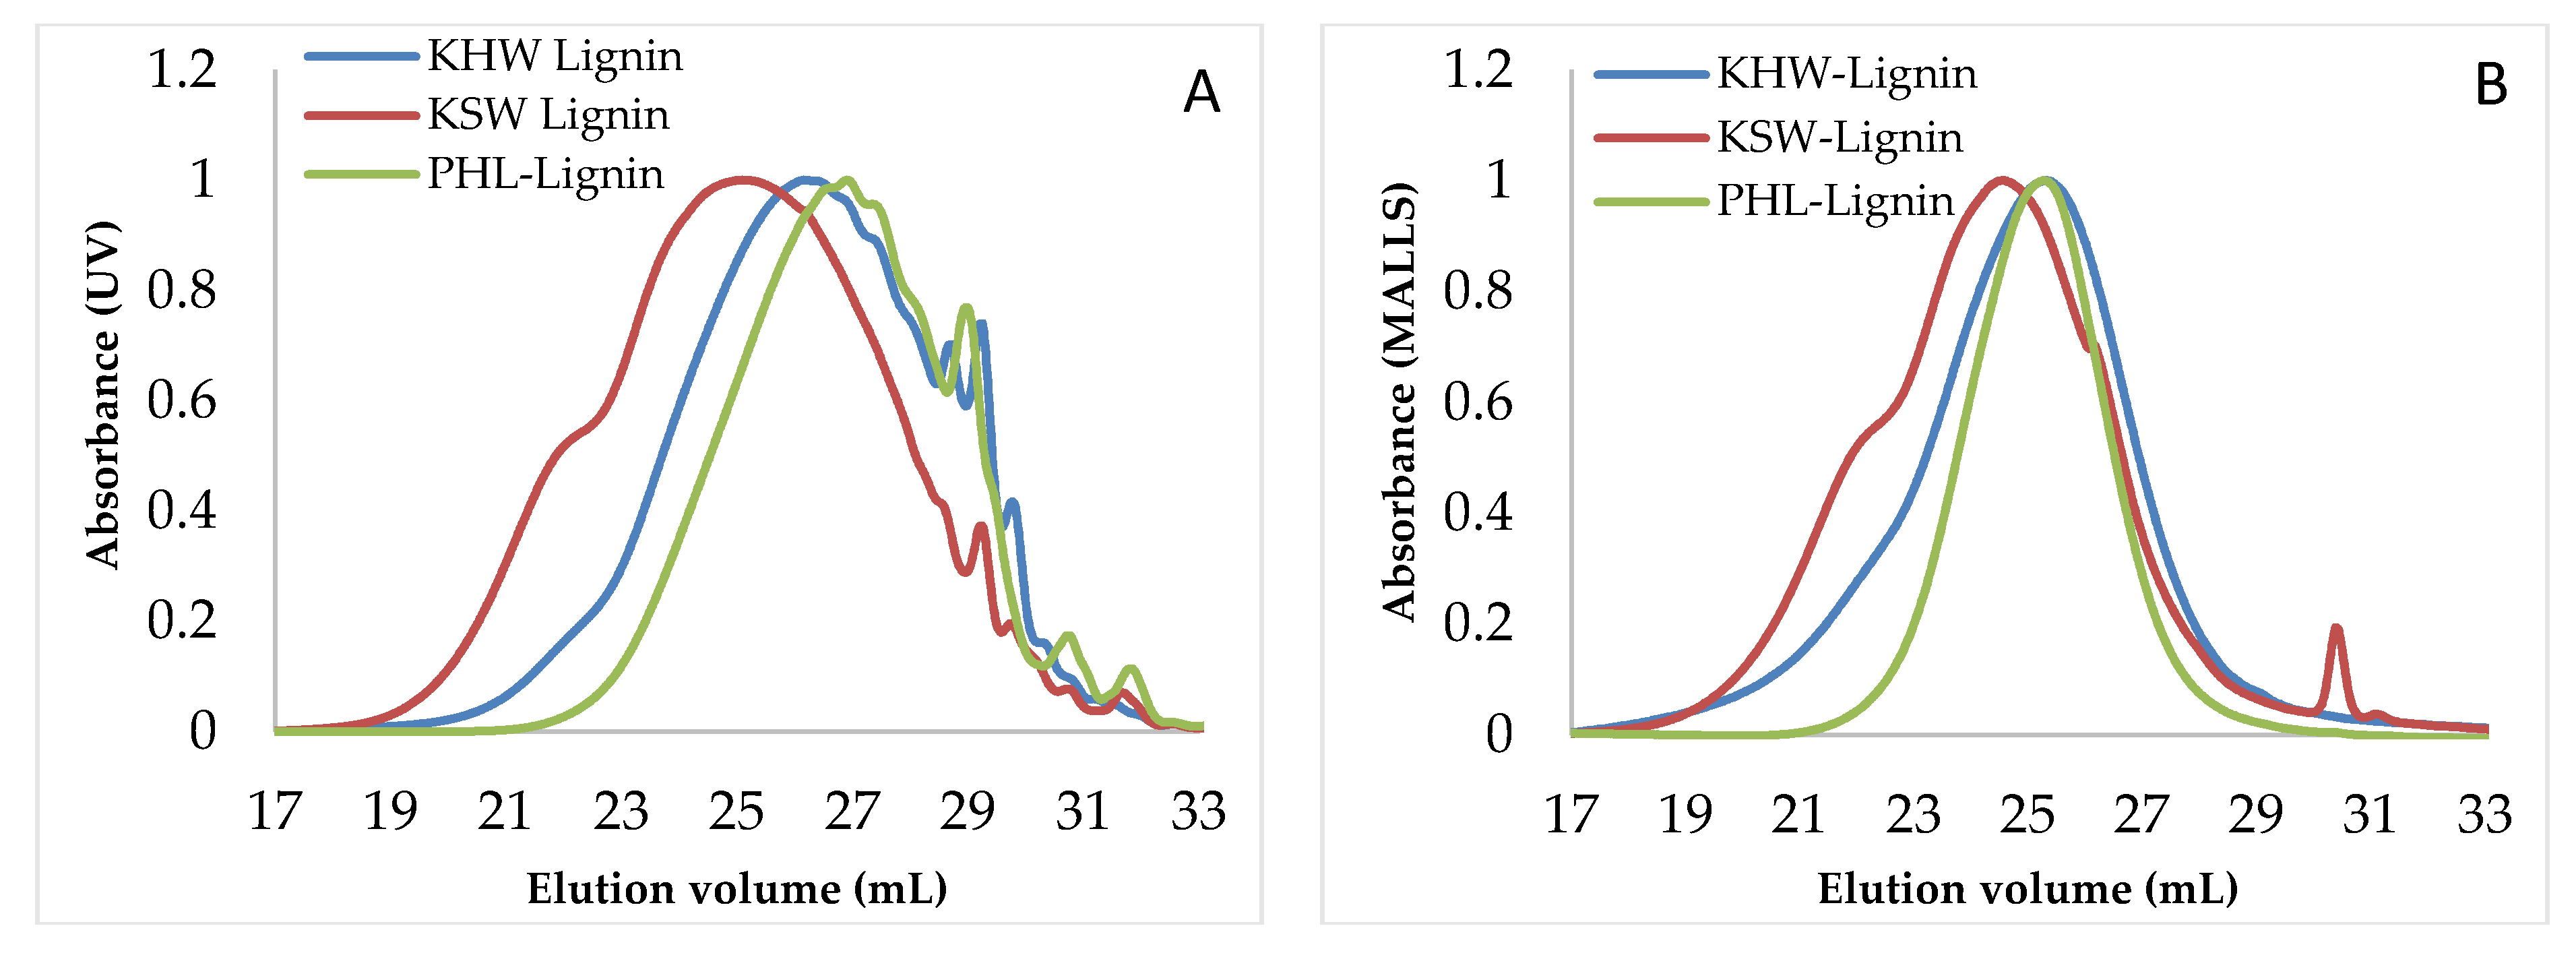
3.4. Molecular Weight and Molecular Weight Distribution

Table 2 shows the molecular weight and molecular weight distribution of different fractions of lignin obtained by varying the sulfuric acid concentration, the coagulation time, and the filtration temperature. According to the results, it appears that these parameters influence the molecular weight distribution of lignin.

3.4.1. Effect of Filtration Temperature

The first trend that can be observed from the data in Table 2 is that the molecular weight changes as a function of the filtration temperature, as shown for examples in lignin samples A1, B1, and C1. These samples were obtained using the same sulfuric acid concentration (14 kg·m−3), the same coagulation time (180 min), and different temperatures (40, 45, and 50 °C for A1, B1, and C1, respectively). Using MALLS, molecular weights of 2160, 3280, and 4015 Da were obtained at 40, 45, and 50 °C, respectively. The same trend can be observed at other different acid concentrations and coagulation times. In general, at a given acid concentration and coagulation time, the results in Table 2 clearly show that the molecular weight increases as the filtration temperature is increased.

3.4.2. Effect of Coagulation Time

The coagulation time also has a significant effect on the molecular weight of lignin. Samples D3, D2, and A2 were obtained using the same filtration temperature of 40 °C and the same sulfuric acid concentration of 8.5 kg·m−3 but using different coagulation times of 60, 120, and 180 min, respectively. In these samples, a clear decrease in MALLS molecular weight (from 2320 to 1890 and then to 1270 Da, respectively) is observed with increasing coagulation time. As the coagulation time was extended, small molecules of lignin were given the chance to precipitate and coagulate, which led to a higher contribution of small molecules of lignin in the total molecular weight distribution and, consequently, lower final molecular weight.

3.4.3. Effect of Acid Concentration
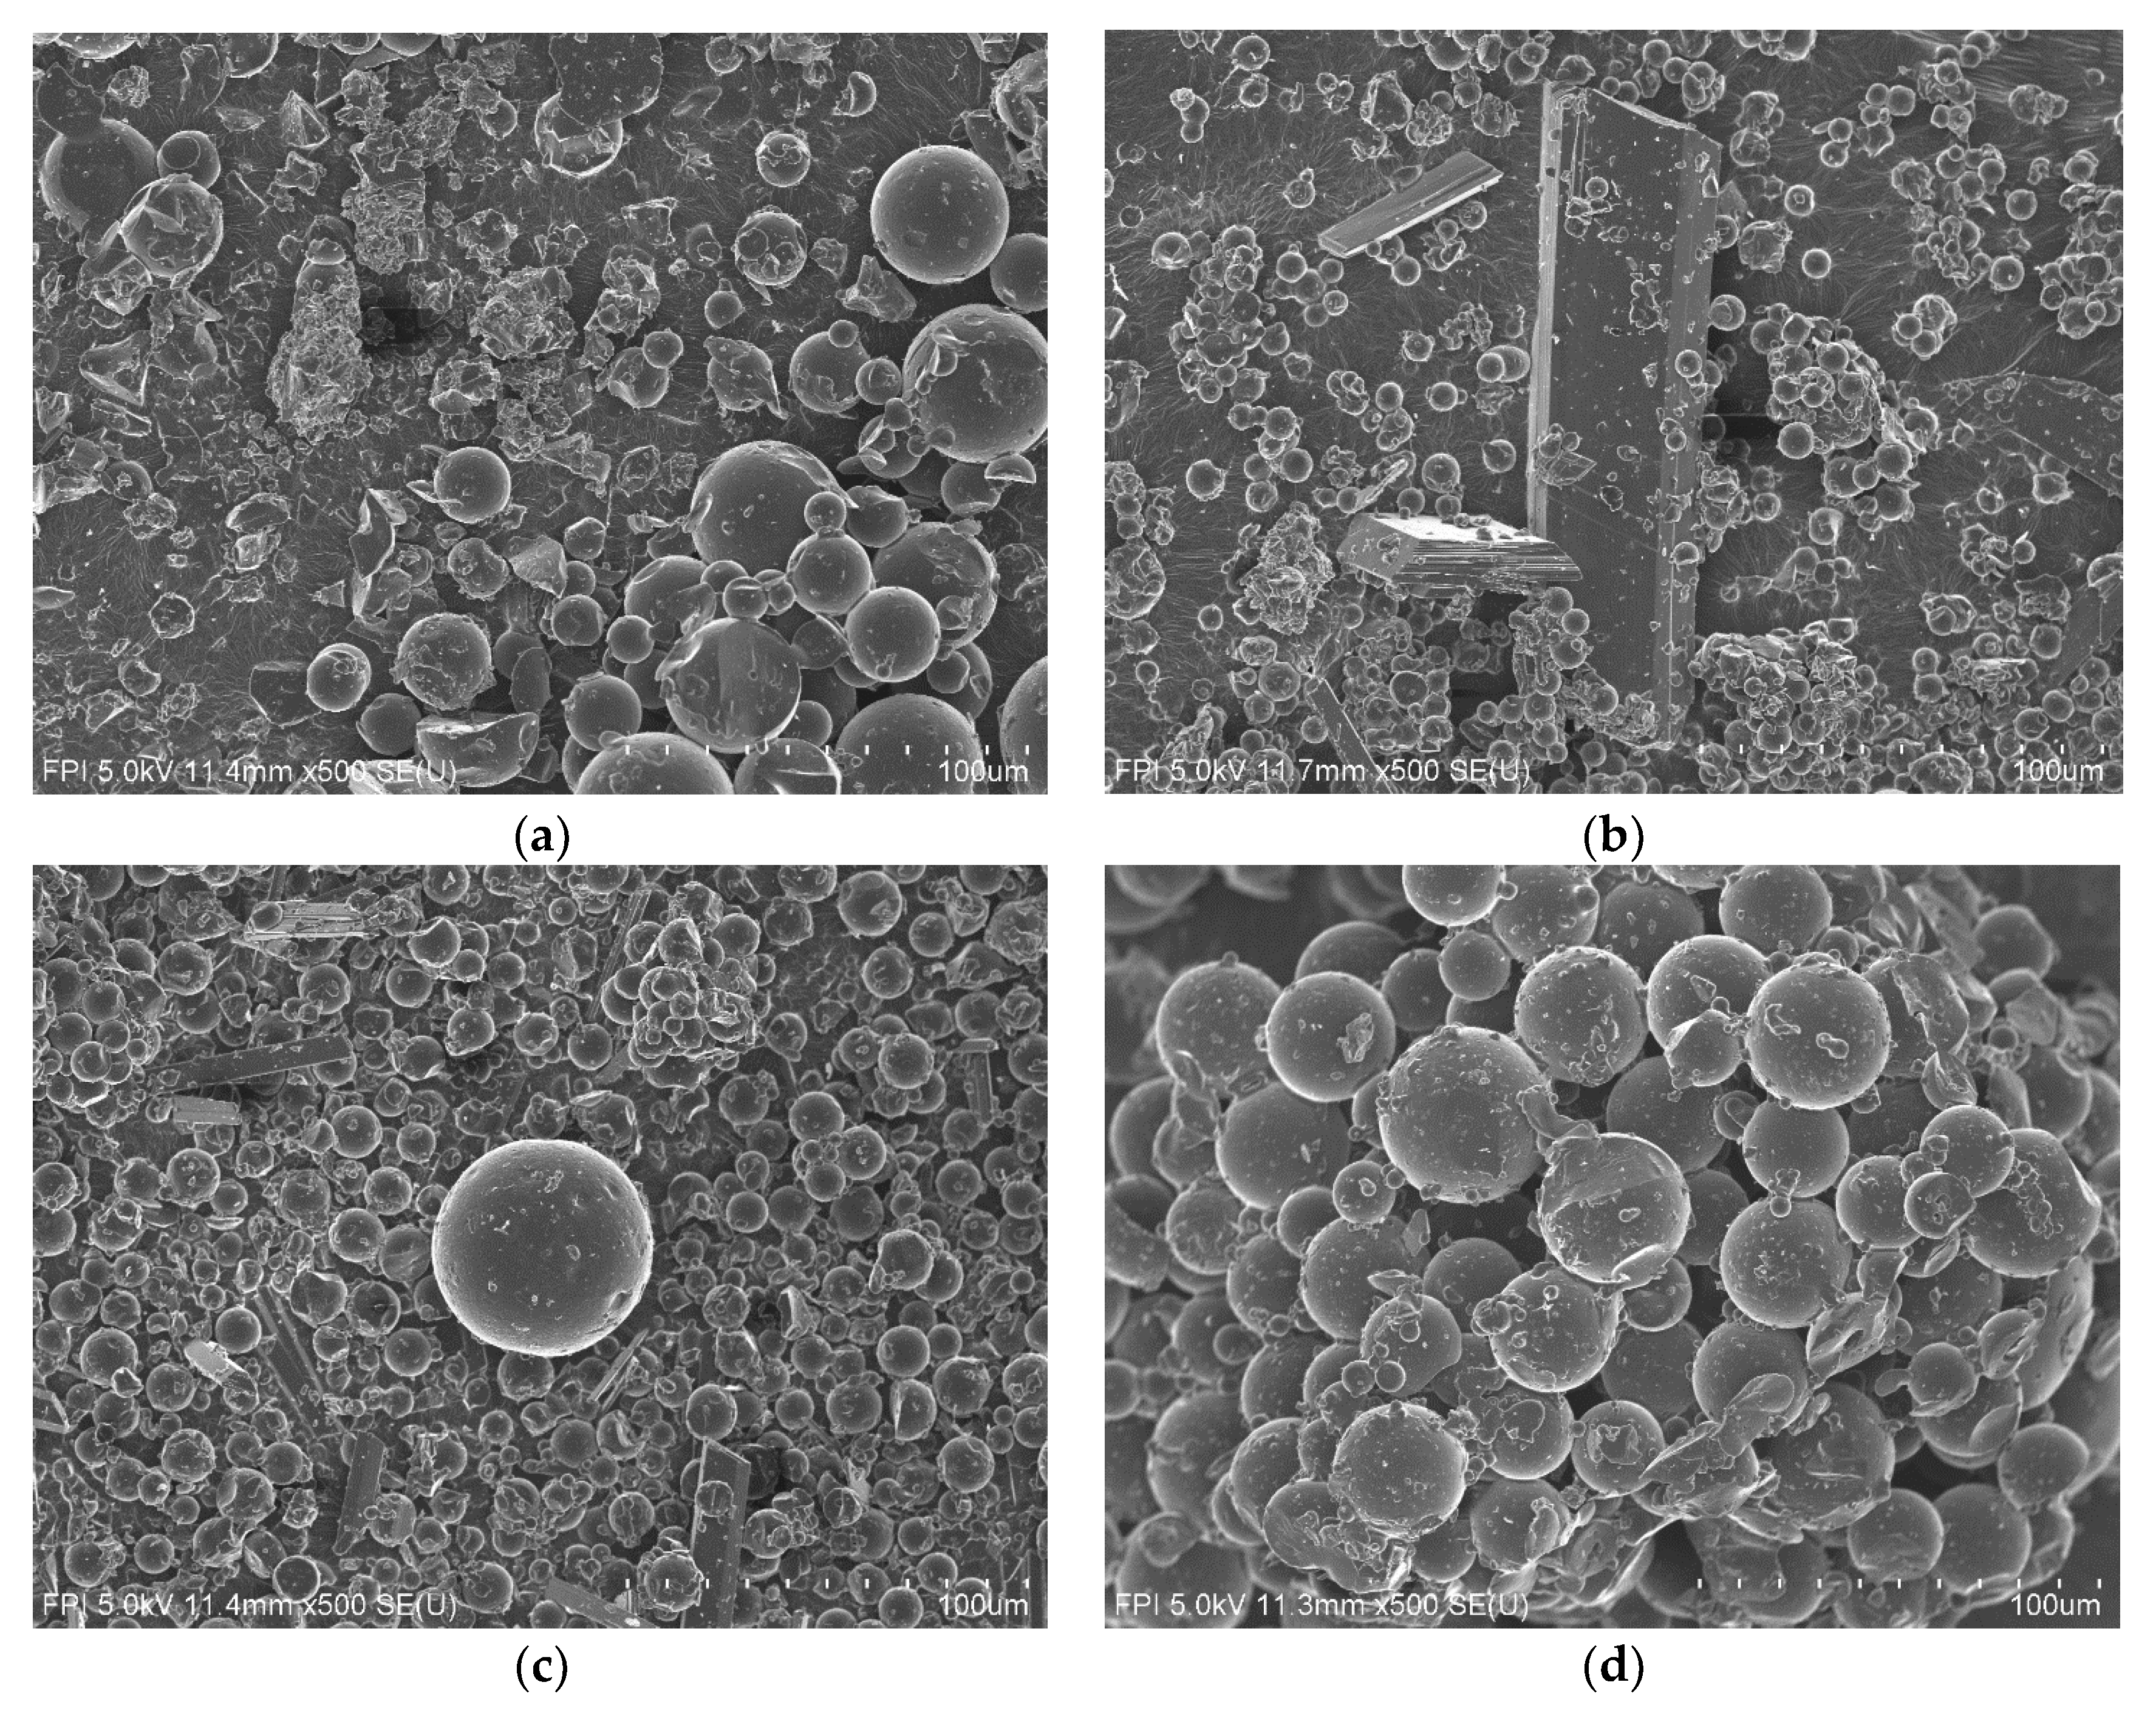
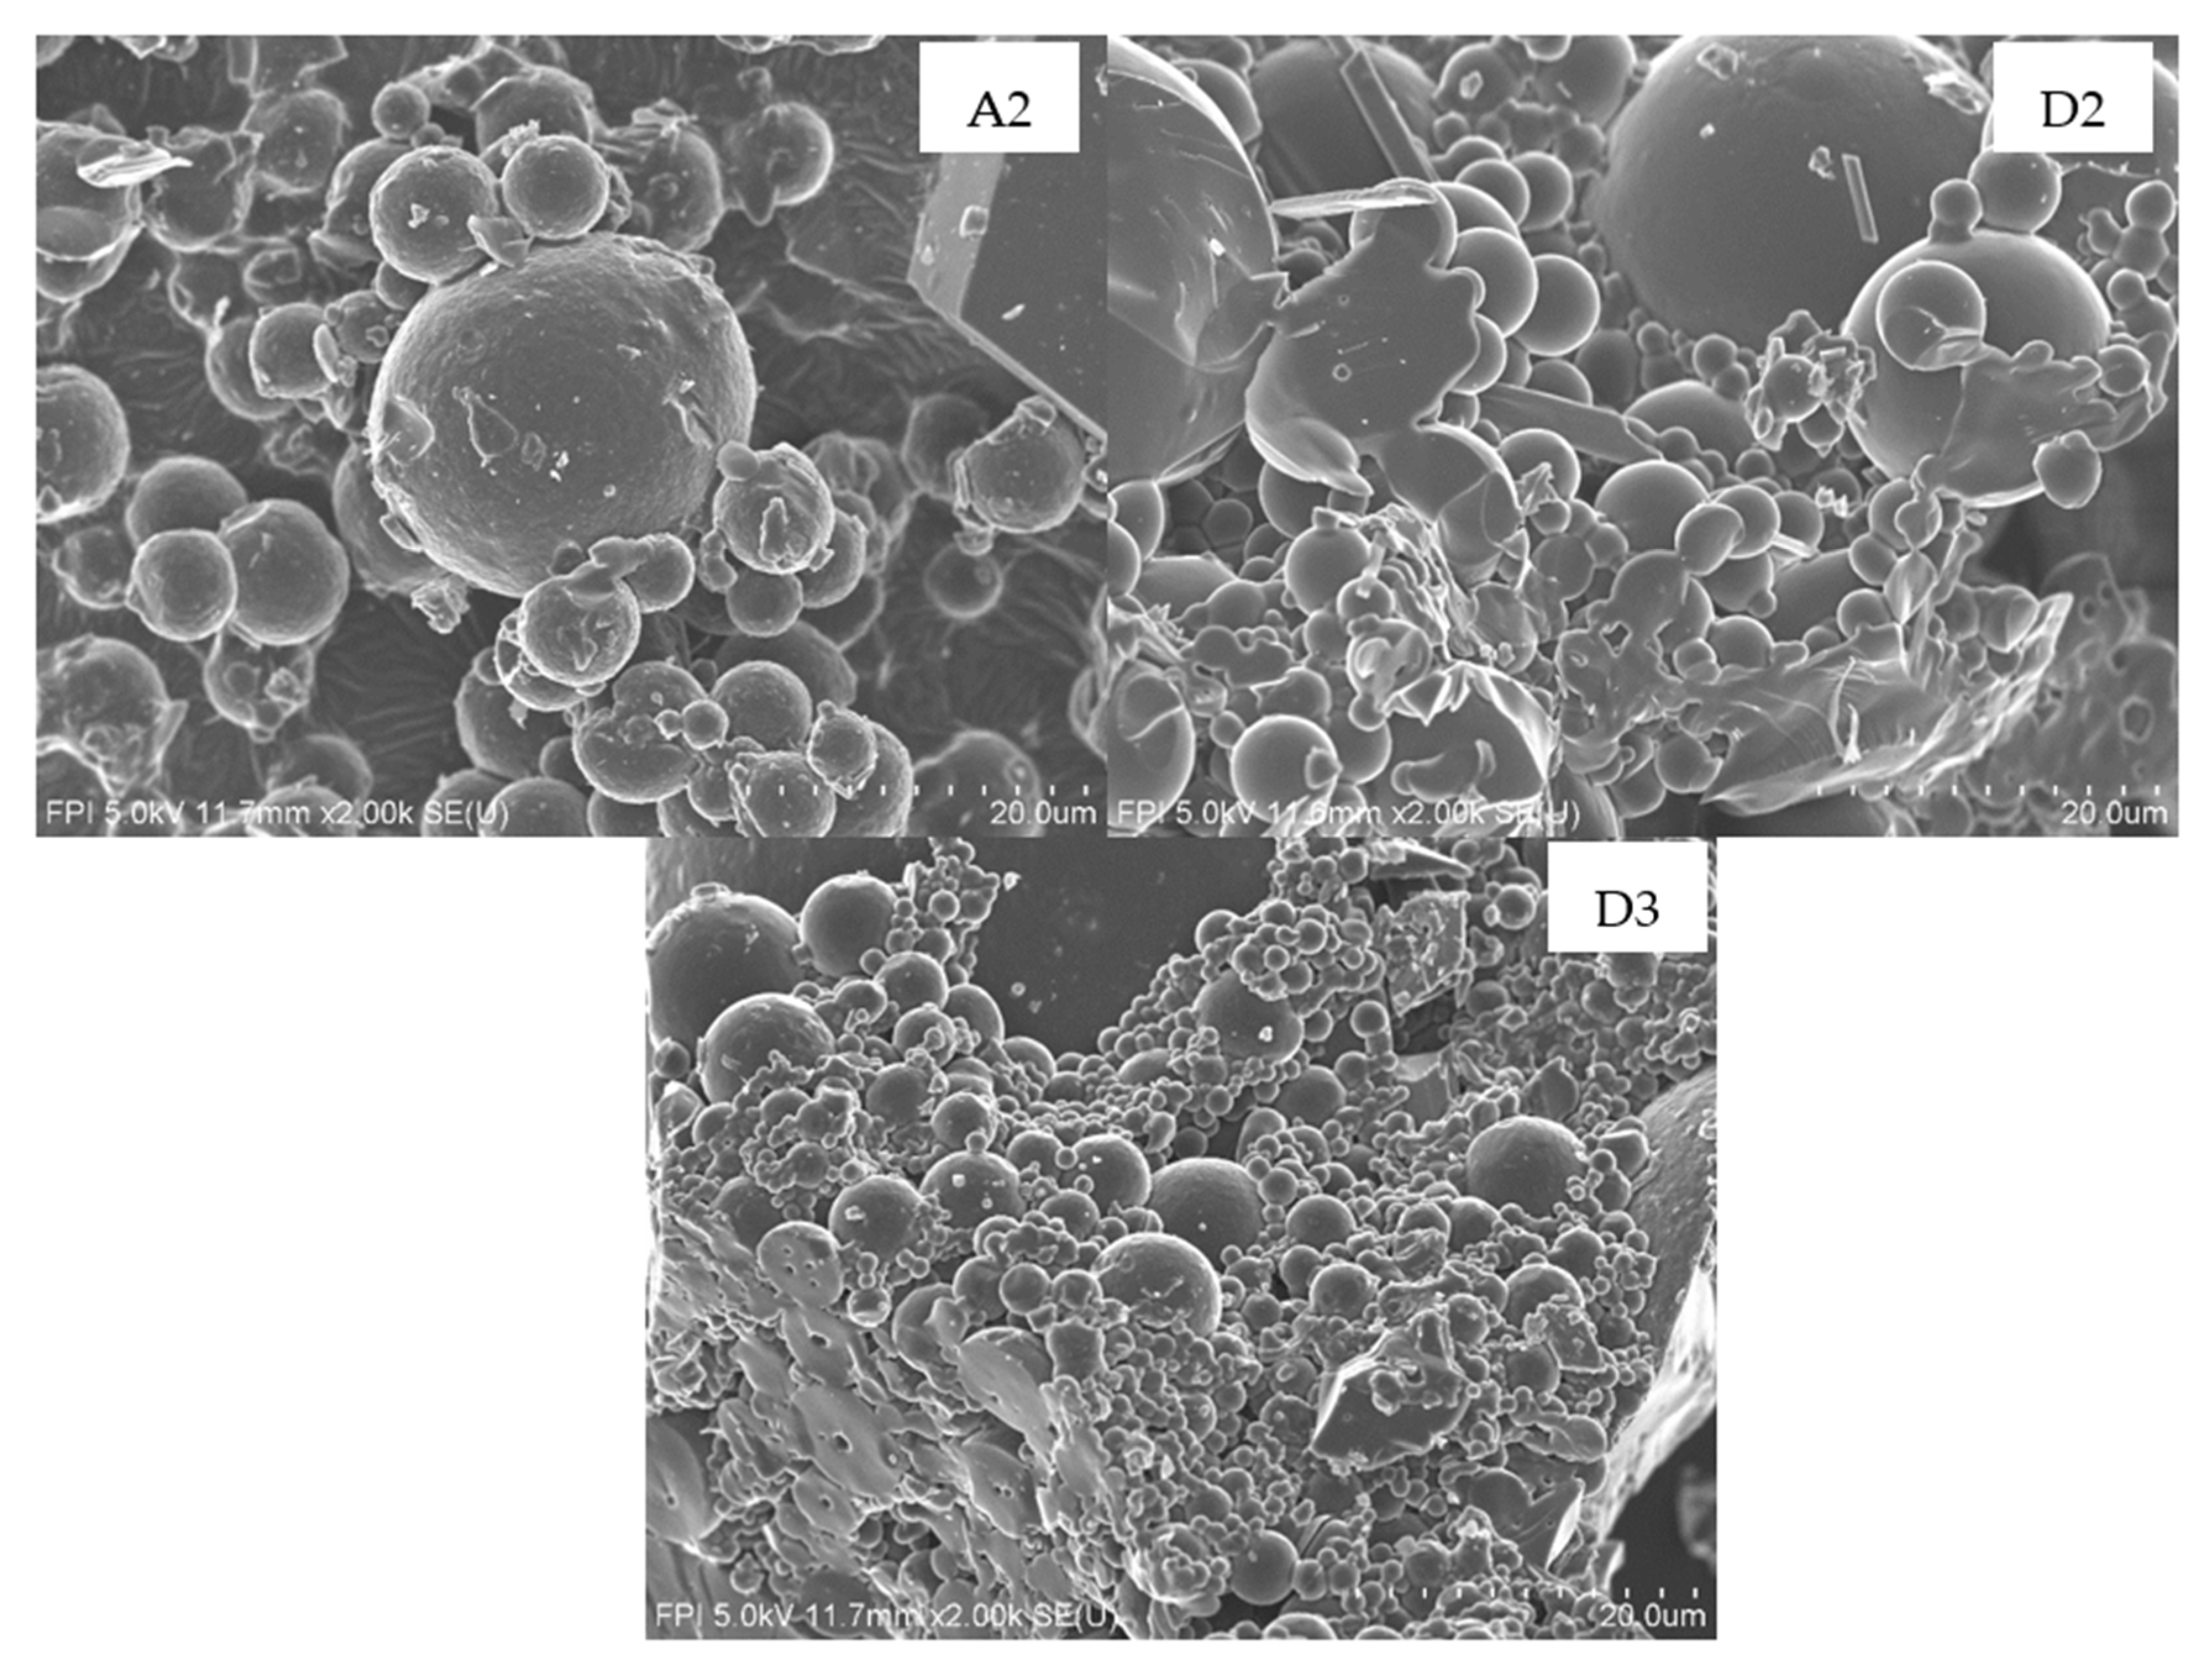
It is known that the molecular weight of the precipitated lignin decreases as a function of acid strength in the solution [28]. This means that, with higher acidity, more molecules of lignin with low molecular weight are precipitated. This trend can be clearly observed in series A and B in Table 2. When no sulfuric acid is added to the solution, the sample of lignin obtained (A4) had a high molecular weight (4285 Da). Increasing the acid concentration in the solution to 5.7 kg·m−3 resulted in a lower molecular weight of 1540 Da (A3). At 8.5 kg·m−3, the molecular weight decreased to 1270 Da (A2). The same trend is observed in B experiments. The molecular weight of lignin dropped from 4160 Da (B4) (without acidification) to 2610 Da using 5.7 kg·m−3 of sulfuric acid (B3). This is expected since, as the acid concentration increases, more molecules having low molecular weights are precipitated and contribute to the decrease in overall molecular weight of the lignin. However, with severe acidification, the molecular weight of the lignin starts to increase. This is observed when, for example, the concentrate in series A (A1) was acidified using 14.7 kg·m−3 of acid. The molecular weight increased from 1270 Da (at 8.5 kg·m−3 of sulfuric acid (A2)) to 2160 Da (at 14.7 kg·m−3 of sulfuric acid (A1)). For the B series obtained at 45 °C, the molecular weight decreased when the acid concentration increased from 0 to 5.7 kg·m−3 but started to increase as higher acid concentrations were used (8.5 and 14 kg·m−3). It seems that, as the temperature increases, high acid concentration does not lead to lower molecular weight of the lignin (experiments A1, B1, and C1).

3.5. Particles Size

3.5.1. Effect of Acid Concentration

It can be clearly observed from Figure 8 that lignin particle size changes as a function of acid concentration. Without acidification, most particles of lignin obtained have very large sizes (A4).
When acid was used, more lignin with small particles became visible (A3). The contribution of lignin particles with smaller size in the final fractions of lignin became higher with higher acid concentrations (A2). This is perfectly consistent with the discussion above about molecular weight results. It was seen that the molecular weight of lignin decreased as a function of acidification. Paradoxically, the only sample that deviated from this tendency was lignin A1 (40 °C; 14 kg·m−3, 180 min), which is the most acidified lignin. This showed an increase in its molecular weight after excessive acidification (14 kg·m−3). What is surprising is that this lignin also deviated from the particles size observations. In fact, the size of lignin particles increased when the acidification passed from 8.5 to 14 kg·m−3 (A2 to A1). This confirms that it was not an error of analysis or operation but suggests that there is a reason behind this surprising result. These results are also confirmed when the filtration behavior is taken into consideration. In fact, it is clearly shown in Figure 2 that the filtration flux decreased significantly when acidification was applied. When the solution of pre-hydrolysate was over-acidified (14 kg·m−3), however, the filtration flux started to increase again. This confirmed that the molecular weight and particles size of lignin increased when 14 kg·m−3 of sulfuric acid was used at 40 °C.

3.5.2. Effect of Coagulation Time

Coagulation time is an important parameter that should be taken into consideration during a precipitation and filtration process. Figure 9 shows that particles size increased as a function of coagulation time. This is in perfect coherence with the results obtained above (Section 3.1.2). In fact, when a long coagulation time is used, molecules of lignin had enough time to agglomerate and make particles with large sizes. This explains the higher filtration flux obtained when 180 min of coagulation time was applied. However, using a short coagulation time led to the formation of small particles due to insufficient time for lignin particles to agglomerate with each other and to form particles big enough to facilitate the filtration. These results are also consistent with those obtained for molecular weight (Section 3.4.2). The molecular weight of lignin decreased when a higher coagulation time was used. This is logical since the contribution of molecules with low molecular weight became higher, which led to a lower average molecular weight and, at the same time, contributed to an increase in the size of lignin particles.
Based on the results and discussion above, it appears that the optimal conditions to recover lignin from the pre-hydrolysate are 8.5 kg·m−3, 180 min, and 40 °C for sulfuric acid concentration, coagulation time, and filtration temperature, respectively. These conditions were the most advantageous to use because they provided the highest lignin recovery with the highest purity even though no washing step was used. The incorporation of a washing step in the proposed process might enhance the quality and the purity of the lignin. The lignin obtained is also characterized by a low molecular weight and polydispersity.
For the purpose of comparison, lignins extracted from kraft hardwood (KHW) and softwood (KSW) black liquors using a commercial process (LignoForce systemTM) were analyzed with respect to the molecular weight, FTIR, and 13P NMR analysis and compared with the pre-hydrolysate lignin (PHL) that was obtained using the conditions mentioned above.
The molecular weight distribution of KSW, KHW, and PHL lignins are shown in Figure 10. It can be seen from this figure that PHL lignin has a significantly lower molecular weight and polydispersity index than KSW and KHW lignins. This was confirmed when both UV (A) and MALLS (B) detectors were used. This can be attributed to a higher fraction of small lignin molecules in PHL lignin compared to KSW and KHW lignins. This is clearly highlighted in the elution volumes shown in Figure 10A: 21, 19, and 18 mL for PHL, KHW, and KSW, respectively. The same trend was observed when the MALLS detector was used. This demonstrates the advantage of pre-hydrolysis treatment (which can be considered a simultaneous depolymerization step) that led to the formation of a lignin with a lower molecular weight and narrower distribution than kraft lignins.
As shown in Figure 11, FTIR spectrums demonstrated that KSW, KHW, and PHL lignins are rich in hydroxyl groups. The big band around 3400 cm−1 is due to the stretching vibration of phenolic and/or aliphatic hydroxyl groups [29]. The intensity of this band was clearly higher in the case of PHL lignin, indicating the presence of higher hydroxyl group contents compared to KSW and KHW lignins. The absorption peak around 1700 cm−1 is associated to C=O stretching from the aldehyde, ketone, and ester groups [30].
The absorption peak at around 1114 cm−1 which is associated to the syringyl units [31] was also higher for PHL and KHW than KSW lignin. This result was expected since it is well known that lignin from hardwood species contains more syringyl groups than lignin from softwood species.
Analyses of the different functional groups of KSW, KHW, and PHL lignins are shown in Figure 12. The 31P NMR spectra show that the number of carboxylic hydroxyl units is almost the same for all fractions of lignin recovered from softwood and hardwood black liquors and from the pre-hydrolysate. However, it appears that the pre-hydrolysate lignin is more reactive than KSW and KHW lignins since there are more phenolic, aliphatic, and total hydroxyl groups in lignin obtained from the pre-hydrolysate than in lignins extracted from softwood and hardwood black liquors. Thus, the pre-hydrolysate lignin could be an excellent candidate for applications within phenol-formaldehyde resins and polyurethane-based materials.
With the optimal conditions determined and the PHL lignin quality demonstrated, it is time to investigate the mass balance for the proposed process. Figure 13 shows the mass distribution of different pre-hydrolysate components in the feed, retentate, permeate, and filtrate obtained using the nanofiltration and precipitation of lignin from the pre-hydrolysate. It can be seen that, while most of acetic acid and formic acid ended up in the permeate during the nanofiltration step, most of the lignin and sugars were maintained by the membrane in the retentate. However, it seems that small amounts of lignin and sugars were lost in this step. This is due to the losses of retentate in the system tubing (an amount of the retentate remained in the piping and tubing of the nanofiltration system). This problem can be easily overcome at the industrial level by adopting a continuous membrane filtration system.
The filtrate obtained after precipitating and recovering lignin (52% of the initial lignin) contains most of chemical products present in the retentate. A valorization step is encouraged to diversify the portfolio of the pulp mill. Since it already contains sulfuric acid (resulting from the lignin precipitation step), a chemical conversion of sugars into a wide range of bioproducts such as furfural and hydroxymethylfurfural could be the most adapted for this case. The best way to valorize the resulting solution (residue) is by sending it to the recovery cycle because it contains the remaining organic bioproducts and lignin. The latter has a high calorific value and could be burned in the recovery boiler to produce energy.
For the permeate, the use of ion-exchange resin technology might remove the acetic acid and then the water obtained can be reused in the pre-hydrolysis step.
Lignin is a complex and three-dimensional macromolecule. This usually leads to a nonuniform reaction with other reagents. In fact, only functional groups at the surface of lignin can be easily reached. In addition to the problems related to the high diversity of its structure, lignin also has another issue of high importance. This issue is the large distribution of its molecular weight. Lignin is a very heterogeneous molecule [32,33,34,35]. In the same sample of lignin, the molecular weight of molecules of lignin can change significantly [30]. This makes its marketing a difficult task [32,35] and its use in some industrial applications a problematic issue [32,34,36]. Thus, the structure, the reactivity, the polydispersity, and thermal properties of lignin change according to its molecular weight. Morck et al. [37] and Thring et al. [38] reported that lignin fractions with a low molecular weight have good homogeneity and high guaiacyl content compared to lignin fractions with high molecular weight. Saito et al. [35] found that the glass transition temperature of lignin increases with its molecular weight. The same observations were reported by Yoshida et al. [39] and Morck et al. [37]. Therefore, lignin fractionation is one of the approaches to take into consideration in order to obtain lignins with well-defined properties [32]. In general, there are three methods of lignin fractionation: membrane separation by ultrafiltration [32,40,41,42,43], extraction by selective solvents [33], and precipitation by a gradual decrease in the pH of the solution [32].
Depolymerization is also one of the most studied techniques that are used in order to obtain a specific type of lignin. It reduces the molecular weight of lignin and leads to the de-methylation of some methoxyl groups [44,45]. This reduces its steric hindrance effects and improves its reactivity [45,46,47]. Ahmad et al., [48] reported obtaining lignin fractions of 2340 g·mol−1 after depolymerizing kraft lignin with a molecular weight of 10,000 g·mol−1. These results are consistent with those published by Yuan et al. [49] in which the molecular weight of a kraft lignin was reduced from 10200 g·mol−1 to 1020 g·mol−1 using reductive depolymerization in supercritical acetone. However, taking into account the size of investments required to depolymerize the lignin (high temperature, high pressure, use of solvents and other chemicals, and additional units for depolymerization), a very high yield would be highly desirable to make the process economically viable. The same thing can be said when it comes to ultrafiltration. On the other hand, the pre-hydrolysate lignin extracted in this work has a very low molecular weight (1270 g·mol−1), a high homogeneity (Mw/Mn = 1.22), and a low percentage of impurities. It is expected to be suitable for several applications (antioxidant or antiozonant in the plastic and polymer industry) without any additional treatment of fractionation, polymerization, or chemical modification.

4. Conclusions

The pre-hydrolysate generated at kraft dissolving pulp mills usually contains significant amounts of lignin. During lignin precipitation from the pre-hydrolysate, parameters such as filtration rate, coagulation time, sugars concentration, mineral element concentration, lignin purity, and molecular weight distribution are very important. The pre-hydrolysate must be first concentrated to increase the solid content. This study showed that a temperature of 40 °C, a coagulation time of 180 min, and a sulfuric acid concentration of 8.5 kg·m−3 are the optimal conditions to maximize lignin recovery from the pre-hydrolysate. About 52% of the initial lignin can be recovered, with a low content of impurities in the lignin cake (8.3%). Compared to hardwood kraft lignin, the lignin precipitated from pre-hydrolysate is favored by having a low molecular distribution (1270 Da) and a very high homogeneity (Mw/Mn = 1.22). This lignin is considered a suitable feedstock for niche applications.

5. Patents

There is a patent [50] resulting from the work reported in this manuscript and from a work reported in some manuscripts already published [7,11,18,51].

Author Contributions

Conceptualization, A.M., N.J., and W.W.A.D.; methodology, A.M., N.J., and W.W.A.D.; validation, A.M.; formal analysis, A.M.; investigation, A.M.; resources, M.P., M.M., and N.J.; data curation, A.M.; writing—original draft preparation, A.M.; writing—review and editing, N.J., W.W.A.D., M.P., and M.M.; visualization, A.M.; supervision, N.J., M.M., and M.P.; project administration, N.J.; funding acquisition, M.P. and M.M. All authors have read and agreed to the published version of the manuscript.

Funding

This research was funded by “Fonds de Recherche Nature et Technologie”, “Conseil de Recherches en Sciences Naturelles et en Génie du Canada”, and “FPInnovations”.

Institutional Review Board Statement

Not applicable.

Informed Consent Statement

Not applicable.

Data Availability Statement

Data is contained within the article.

Conflicts of Interest

The authors declare no conflict of interest.

References

  1. Macdonald, C. Dissolving pulp draws renewed interest. Pulp Pap. Can. 2011, 112, 19–26. [Google Scholar]
  2. Huang. S. Reductive Depolymerization of Kraft Lignin for Chemicals and Fuels Using Formic Acid as an In-Situ Hydrogen Source. Master’s Thesis, University of Western Ontario, London, ON, Canada, 2014; p. 2.
  3. Tran, H.N.; Elliott, M.; Barham, D.; Reeve, D. Recovery boiler operation and plugging in Canada. Pulp Pap. Can. 1986, 87, 58–64. [Google Scholar]
  4. Kouisni, L.; Paleologou, M. Method for Separating Lignin from Black Liquor. U.S. Patent No. 8,940,130. U.S. Patent and Trademark Office: Washington, DC, USA, 9 April 2015. [Google Scholar]
  5. Kouisni, L.; Holt-Hindle, P.; Maki, K.; Paleologou, M. The Lignoforce system: A new process for the production of high quality lignin from black liquor. J. Sci. Tech. Forest Prod. Proc. 2012, 2, 6–10. [Google Scholar]
  6. Ohman, F.; Theliander, H.; Tomani, P.; Axegard, P. Method for Separating Lignin from Black Liquor. International Patent Application, WO2006/031175 A1, 23 March 2006. [Google Scholar]
  7. Mazar, A.; Jemaa, N.; Al Dajani, W.W.; Marinova, M.; Perrier, M. Furfural production from a pre-hydrolysate generated using aspen and maple chips. Biomass Bioenergy 2017, 104, 8–16. [Google Scholar] [CrossRef]
  8. Liu, H.; Hu, H.; Jahan, M.S.; Ni, Y. Improvement of Furfural Production from Concentrated PreHydrolysis Liquor (PHL) of a Kraft-Based Hardwood Dissolving Pulp Production Process. J. Wood Chem. Technol. 2015, 35, 260–269. [Google Scholar] [CrossRef]
  9. Liu, H.; Hu, H.; Jahan, M.S.; Ni, Y. Furfural formation from the pre-hydrolysis liquor of a hardwood kraft-based dissolving pulp production process. Bioresour. Technol. 2013, 131, 315–320. [Google Scholar] [CrossRef]
  10. Baktash, M.M.; Ahsan, L.; Ni, Y. Production of furfural from an industrial pre-hydrolysis liquor. Sep. Purif. Technol. 2015, 149, 407–412. [Google Scholar] [CrossRef]
  11. Mazar, A.; Jemaa, N.; Al Dajani, W.W.; Marinova, M.; Perrier, M. Comparative study: Furfural production from two types of pre-hydrolysates produced using aspen and maple chips. Biomass Bioenergy 2018, 111, 103–113. [Google Scholar] [CrossRef]
  12. Jahan, M.S.; Liu, Z.; Wang, H.; Saeed, A.; Ni, Y. Isolation and characterization of lignin from prehydrolysis liquor of kraft-based dissolving pulp production. Cellul. Chem. Technol. 2012, 46, 261–267. [Google Scholar]
  13. Shi, H.; Fatehi, P.; Xiao, H.; Ni, Y. A combined acidification/PEO flocculation process to improve the lignin removal from the pre-hydrolysis liquor of kraft-based dissolving pulp production process. Bioresour. Technol. 2011, 102, 5177–5182. [Google Scholar] [CrossRef]
  14. Yasarla, L.R.; Ramarao, B.V. Dynamics of Flocculation of Lignocellulosic Hydrolyzates by Polymers. Ind. Eng. Chem. Res. 2012, 51, 6847–6861. [Google Scholar] [CrossRef]
  15. Shi, H.; Fatehi, P.; Xiao, H.; Ni, Y. A process for isolating lignin of pre-hydrolysis liquor of kraft pulping process based on surfactant and calcium oxide treatments. Biochem. Eng. J. 2012, 68, 19–24. [Google Scholar] [CrossRef]
  16. Wang, Q.; Jahan, M.S.; Liu, S.; Miao, Q.; Ni, Y. Lignin removal enhancement from prehydrolysis liquor of kraft-based dissolving pulp production by laccase-induced polymerization. Bioresour. Technol. 2014, 164, 380–385. [Google Scholar] [CrossRef]
  17. Wang, Q.; Liu, S.; Yang, G.; Chen, J. Modeling laccase-induced lignin removal in prehydrolysis liquor from kraft-based dissolving pulp production. Bioresour. Technol. 2015, 175, 638–641. [Google Scholar] [CrossRef] [PubMed]
  18. Mazar, A.; Jemaa, N.; Al Dajani, W.W.; Marinova, M.; Perrier, M. Influence of membrane filtration on extraction and characteristics of lignin from a kraft dissolving pulp mill pre-hydrolysate. Ind. Crop. Prod. 2018, 124, 726–734. [Google Scholar] [CrossRef]
  19. Ajao, O.; Le Hir, M.; Rahni, M.; Marinova, M.; Chadjaa, H.; Savadogo, O. Concentration and Detoxification of Kraft Prehydrolysate by Combining Nanofiltration with Flocculation. Ind. Eng. Chem. Res. 2015, 54, 1113–1122. [Google Scholar] [CrossRef]
  20. Tavares, L.B.; Boas, C.V.; Schleder, G.R.; Nacas, A.M.; Rosa, D.S.; Santos, D.J. Bio-based polyurethane prepared from Kraft lignin and modified castor oil. Express Polym. Lett. 2016, 10, 927–940. [Google Scholar] [CrossRef]
  21. Gómez-Fernández, S.; Ugarte, L.; Calvo-Correas, T.; Peña-Rodríguez, C.; Corcuera, M.A.; Eceiza, A. Properties of flexible polyurethane foams containing isocyanate functionalized kraft lignin. Ind. Crop. Prod. 2017, 100, 51–64. [Google Scholar] [CrossRef]
  22. Solt, P.; Rößiger, B.; Konnerth, J.; Van Herwijnen, H.W. Lignin phenol formaldehyde resoles using base-catalysed de-polymerized Kraft lignin. Polymers 2018, 10, 1162. [Google Scholar] [CrossRef] [Green Version]
  23. Brazil, T.R.; Gonçalves, M.; Junior, M.S.; Rezende, M.C. A statistical approach to optimize the activated carbon pro-duction from Kraft lignin based on conventional and microwave processes. Micropor. Mesopor. Mat. 2020, 308, 110485. [Google Scholar] [CrossRef]
  24. Lourençon, T.V.; De Lima, G.G.; Ribeiro, C.S.; Hansel, F.A.; Maciel, G.M.; Da Silva, K.; Winnischofer, S.M.; De Muniz, G.I.; Magalhães, W.L. Antioxidant, antibacterial and antitumoural activities of kraft lignin from hardwood fractionated by acid precipitation. Int. J. Biol. Macromol. 2021, 166, 1535–1542. [Google Scholar] [CrossRef] [PubMed]
  25. Shi, H.; Fatehi, P.; Xiao, H.; Ni, Y. Optimizing the poly ethylene oxide flocculation process for isolating lignin of prehy-drolysis liquor of a kraft-based dissolving pulp production process. Ind. Eng. Chem. Res. 2012, 51, 5330–5335. [Google Scholar] [CrossRef]
  26. Chen, X.; Wang, Z.; Fu, Y.; Li, Z.; Qin, M. Specific lignin precipitation for oligosaccharides recovery from hot water wood extract. Bioresour. Technol. 2014, 152, 31–37. [Google Scholar] [CrossRef] [PubMed]
  27. Norgren, M.; Edlund, H.; Wågberg, L.; Lindström, B.; Annergren, G. Aggregation of kraft lignin derivatives under con-ditions relevant to the process, part I: Phase behaviour. Colloids Surf. A 2001, 194, 85–96. [Google Scholar] [CrossRef]
  28. Öhman, F.; Theliander, H. Filtration properties of lignin precipitated from black liquor. TAPPI J. 2007, 6, 3–9. [Google Scholar]
  29. Faix, O. Classification of Lignins from Different Botanical Origins by FT-IR Spectroscopy. Holzforschung 1991, 45, 21–28. [Google Scholar] [CrossRef]
  30. Gomez-Serrano, V.; Pastor-Villegas, J.; Perez-Florindo, A.; Duran-Valle, C.; Valenzuela-Calahorro, C. FT-IR study of rockrose and of char and activated carbon. J. Anal. Appl. Pyrolysis 1996, 36, 71–80. [Google Scholar] [CrossRef]
  31. Li, B.; Zhou, M.; Huo, W.; Cai, D.; Qin, P.; Cao, H.; Tan, T. Fractionation and oxypropylation of corn-stover lignin for the production of biobased rigid polyurethane foam. Ind. Crop. Prod. 2020, 143, 111887. [Google Scholar] [CrossRef]
  32. Toledano, A.; García, A.; Mondragon, I.; Labidi, J. Lignin separation and fractionation by ultrafiltration. Sep. Purif. Technol. 2010, 71, 38–43. [Google Scholar] [CrossRef]
  33. Yuan, T.-Q.; He, J.; Xu, F.; Sun, R. Fractionation and physico-chemical analysis of degraded lignins from the black liquor of Eucalyptus pellita KP-AQ pulping. Polym. Degrad. Stab. 2009, 94, 1142–1150. [Google Scholar] [CrossRef]
  34. Sun, R.; Tomkinson, J. Fractional separation and physico-chemical analysis of lignins from the black liquor of oil palm trunk fibre pulping. Sep. Purif. Technol. 2001, 24, 529–539. [Google Scholar] [CrossRef]
  35. Saito, T.; Perkins, J.H.; Vautard, F.; Meyer, H.M.; Messman, J.M.; Tolnai, B.; Naskar, A.K. Methanol Fractionation of Softwood Kraft Lignin: Impact on the Lignin Properties. ChemSusChem 2014, 7, 221–228. [Google Scholar] [CrossRef] [PubMed]
  36. Brodin, I.; Sjöholm, E.; Gellerstedt, G. Kraft lignin as feedstock for chemical products: The effects of membrane filtration. Holzforschung 2009, 63, 290–297. [Google Scholar] [CrossRef]
  37. Mörck, R.; Reimann, A.; Kringstad, K.P. Fractionation of kraft lignin by successive extraction with organic solvents: Functional groups, 13C NMR spectra and molecular weight distributions. Holzforschung 1986, 40, 51–60. [Google Scholar]
  38. Thring, R.; Vanderlaan, M.; Griffin, S. Fractionation of Alcell® Lignin by Sequential Solvent Extraction. J. Wood Chem. Technol. 1996, 16, 139–154. [Google Scholar] [CrossRef]
  39. Yoshida, H.; Mörck, R.; Kringstad, K.P.; Hatakeyama, H. Fractionation of kraft lignin by successive extraction with or-ganic solvents. II. Thermal properties of kraft lignin fractions. Holzforschung 1987, 41, 171–176. [Google Scholar] [CrossRef]
  40. Wallberg, O.; Jönsson, A.S.; Wimmerstedt, R. Fractionation and concentration of kraft black liquor lignin with ultrafil-tration. Desalination 2003, 154, 187–199. [Google Scholar] [CrossRef]
  41. Jönsson, A.-S.; Nordin, A.-K.; Wallberg, O. Concentration and purification of lignin in hardwood kraft pulping liquor by ultrafiltration and nanofiltration. Chem. Eng. Res. Des. 2008, 86, 1271–1280. [Google Scholar] [CrossRef]
  42. Norgren, M.; Lindström, B. Physico-chemical characterization of a fractionated kraft lignin. Holzforschung 2000, 54, 528–534. [Google Scholar] [CrossRef]
  43. Helander, M. The Use of Membrane Filtration to Improve the Properties of Extracted Wood Componets. Ph.D. Thesis, KTH Royal Institute of Technology, Stockholm, Sweden, 2014. [Google Scholar]
  44. Beauchet, R.; Monteil-Rivera, F.; Lavoie, J.-M. Conversion of lignin to aromatic-based chemicals (L-chems) and biofuels (L-fuels). Bioresour. Technol. 2012, 121, 328–334. [Google Scholar] [CrossRef]
  45. Diop, A. Extraction, Dépolymérisation et Valorisation de la Lignine Kraft de la Liqueur Noire. Ph.D. Thesis, Sciences et Génie des Matériaux Lignocellulosiques, Université de Québec à Trois Rivières, Trois-Rivières, QC, Canada, 2014. [Google Scholar]
  46. Madhav, P.P. Lignin Depolymerisation and Conversion: A Review of Thermochemical Methods. Chem. Eng. Technol. 2011, 34, 29–41. [Google Scholar]
  47. Khitrin, K.S.; Fuks, S.L.; Khitrin, S.V.; Kazienkov, S.A.; Meteleva, D.S. Lignin utilization options and methods. Russ. J. Gen. Chem. 2012, 82, 977–984. [Google Scholar] [CrossRef]
  48. Ahmad, Z.; Mahmood, N.; Yuan, Z.; Paleologou, M.; Xu, C.C. Effects of Process Parameters on Hydrolytic Treatment of Black Liquor for the Production of Low-Molecular-Weight Depolymerized Kraft Lignin. Molecules 2018, 23, 2464. [Google Scholar] [CrossRef] [Green Version]
  49. Yuan, Z.; Tymchyshyn, M.; Xu, C. (Charles) Reductive Depolymerization of Kraft and Organosolv Lignin in Supercritical Acetone for Chemicals and Materials. ChemCatChem 2016, 8, 1968–1976. [Google Scholar] [CrossRef]
  50. Jemaa, N.; Mazar, A.; AL DAJANI, W.W.; Paleologou, M. Lignin Recovery and Furfural Production from Prehydrolysate Streams. U.S. Patent Application No.16/088,980, October 15, 2020. [Google Scholar]
  51. Mazar, A.; Ajao, O.; Benali, M.; Jemaa, N.; Al-Dajani, W.W.; Paleologou, M. Integrated Multiproduct Biorefinery for Furfural Production with Acetic Acid and Lignin Recovery: Design, Scale-Up Evaluation, and Technoeconomic Analysis. ACS Sustain. Chem. Eng. 2020, 8, 17345–17358. [Google Scholar] [CrossRef]
Figure 1. Pre-hydrolysate valorization options at a kraft dissolving pulp mill.
Applsci 11 00454 g001
Figure 2. Effect of sulfuric acid concentration and temperature on the filtration flux.
Applsci 11 00454 g002
Figure 3. Effect of coagulation time on filtration step with the following conditions: sulfuric acid concentration at 8.56 kg·m−3 and filtration temperature at 40 °C.
Applsci 11 00454 g003
Figure 4. Effect of the coagulation time on sugar, calcium, sodium, and sulfur percentages in the lignin cake at a temperature of 40 °C and 8.56 kg·m−3.
Applsci 11 00454 g004
Figure 5. Sugar, calcium, sodium, and sulfur contents in the lignin cake as a function of the sulfuric acid concentration and temperature after 180 min of coagulation.
Applsci 11 00454 g005aApplsci 11 00454 g005b
Figure 6. Effect of coagulation time on the amount of recovered lignin and its purity at a temperature of 40 °C and a sulfuric acid concentration of 8.56 kg·m−3.
Applsci 11 00454 g006
Figure 7. Percentages of lignin recovered and impurities at different filtration temperatures and 180 min of coagulation.
Applsci 11 00454 g007
Figure 8. Scanning electron microscopy (SEM) micrographs of lignin obtained (the scale bar is 100 μm): (a) = A1 (40 °C; 14 kg·m−3 H2SO4, 180 min), (b) = A2 (40 °C; 8.5 kg·m−3 H2SO4, 180 min), (c) = A3 (40 °C; 5.7 kg·m−3 H2SO4, 180 min), and (d) = A4 (40 °C; 0 kg·m−3 H2SO4, 180 min).
Applsci 11 00454 g008
Figure 9. SEM micrographs of lignin obtained (the scale bar is 20 μm): (A2) (40 °C; 8.5 kg·m−3 H2SO4, 180 min), (D2) (40 °C; 8.5 kg·m−3 H2SO4, 120 min), and (D3) (40 °C; 8.5 kg·m−3 H2SO4, 60 min).
Applsci 11 00454 g009
Figure 10. Molecular weight distribution of kraft softwood (KSW), kraft hardwood (KHW), and pre-hydrolysate (PHL) lignins as determined by (A) UV and (B) MALLS.
Applsci 11 00454 g010
Figure 11. The FTIR of KSW, KHW, and PHL lignin.
Applsci 11 00454 g011
Figure 12. Quantitative 31P NMR spectra for KSW, KHW, and PHL lignins.
Applsci 11 00454 g012
Figure 13. Mass balance for the proposed process.
Applsci 11 00454 g013
Table 1. Composition of the pre-hydrolysate used in this work.
SpeciesValue
Phenolics, kg·m−32.1
Furfural, kg·m−30.6
Hydroxymethylfurfural (HMF), kg·m−30.1
Solid, % (w/w)4.3
Total lignin, kg·m−37.6
Acetic acid, kg·m−33.4
Formic acid, kg·m−30.5
Total sugars, kg·m−329
Total monomeric sugars, kg·m−35
Total oligomeric sugars, kg·m−324
pH3.5
Table 2. Molecular weight and molecular weight distribution of the recovered lignin.
Lignin Precipitation ParametersMALLS
MWMnMW/Mn
A1 (40 °C; 14 kg·m−3, 180 min)216018601.16
A2 (40 °C; 8.5 kg·m−3, 180 min)127010401.22
A3 (40 °C; 5.7 kg·m−3, 180 min)154013101.18
A4 (40 °C; 0 kg·m−3, 180 min)428537251.15
B1 (45 °C; 14 kg·m−3, 180 min)328025551.28
B2 (45 °C; 8.5 kg·m−3, 180 min)286521151.35
B3 (45 °C; 5.7 kg·m−3, 180 min)261014451.81
B4 (45 °C; 0 kg·m−3, 180 min)416037401.11
C1 (50 °C; 14 kg·m−3, 180 min)401530901.30
C2 (50 °C; 8.5 kg·m−3, 180 min)355023501.51
C3 (50 °C; 5.7 kg·m−3, 180 min)289019801.46
C4 (50 °C; 0 kg·m−3, 180 min)261021401.22
D2 (40 °C; 8.5 kg·m−3, 120 min)189010951.73
D3 (40 °C; 8.5 kg·m−3, 60 min)232015301.52
Publisher’s Note: MDPI stays neutral with regard to jurisdictional claims in published maps and institutional affiliations.

