Abstract
A novel process model simulating methanol production through pyrolysis oil gasification was developed, validated, then used to predict the effect of operating conditions on methanol production yield. The model comprised gasification, syngas post-treatment, and methanol synthesis units. The model was validated using experimental data from the literature, and the results obtained by the model were consistent with reference data. The simulation results revealed that gasification temperature has a significant impact on syngas composition. Indeed, rising temperature from 400 °C to 600 °C leads to higher syngas stoichiometric number (SN) value. Conversely, SN value decreases when the gasifier temperature is above 1000 °C. Moisture content in pyrolysis oil also affects both syngas composition and SN value; an increase in the first (from 10 to 30%) leads to an increase in SN value. The Rectisol unit deeply influences the syngas SN value and methanol yield, the best results being obtained with operating conditions of −20 °C and 40 bar. Increasing the operating temperature of the methanol synthesis unit from 150 °C to 250 °C leads to an increase in the yield of methanol production; the yield decreases beyond 250 °C. Although high pressures favor the methanol production yield, the operating pressure in the synthesis unit is limited at 50 bar for practical considerations (e.g., equipment price, equipment requirements, or operational risks).
1. Introduction
The increase in global energy depletion and the massive utilization of fossil fuels have led to an alarming increase in CO2 emissions into the environment and to potential energy supply issues. World energy-related CO2 emissions will increase from 30.2 billion metric tons in 2008 to 43.2 billion metric tons in 2035 [1]. The greenhouse gases (GHG) emissions from fossil fuels have a dominant impact on the atmospheric CO2 concentrations, leading to global temperature and sea level rise [2]. With the rapidly increasing global energy demand and the growing concerns about the environmental challenges, renewable and sustainable energy (e.g., solar, wind, and biomass) have been considered as key resources to solve the coming energy crisis. Among all the possible alternatives, biofuels have been regarded as the most promising substitute to fossil fuels. Indeed, bioresources (such as biomass, biochar, and pyrolysis oil) are an attractive feedstock to produce fuels because their utilization emits less greenhouse gases (GHG) if we consider that the newly grown biomass absorbs CO2 emissions [3]. However, the bioresources only account for a small proportion of energy consumption.
Gasification is the most common thermochemical process to convert bioresources into a gaseous fuel in a high temperature, partially oxidized atmosphere [4]. The syngas produced by gasification can be burned directly or used as fuel for turbines. It is also one of the key building blocks to produce fuels for transportation and chemicals. For example, the current usage of synthesis gas is for the production of ammonia (50%) and hydrogen (25%). The rest is dedicated to the production of methanol, Fischer–Tropsch (FT) products, and other purposes [5]. Gasification is a process dedicated to the production of syngas, mainly composed of gases such as H2, CO, CO2, and CH4. However, syngas contains impurities, including char, tars, high molecular weight hydrocarbons, sulfur, or CO2; but also trace contaminants (e.g., ammonia, metals, halides, etc.) [6]. All these impurities must be removed before the downstream operations. In addition to this purification step, the syngas composition must also be modified to meet the requirements of methanol synthesis, especially the content of H2, CO, and CO2. The most frequently applied technology for syngas cleaning up and CO2 removal is the absorption process by means of chemical solvents, such as alkanolamines and Monoethanolamine (MEA) [7]. However, those processes are expensive and a large scale is needed to be cost-effective [8]. Nowadays, Rectisol is a better method for its removal, given that more than 98% of CO2 and sulfur in the gas can be removed [9]. Rectisol uses methanol as CO2 solvent since it is much more effective than water, especially at low temperatures. The solubility of CO2 in methanol is about four times of water at room temperature and more than eight times higher than of water at temperatures below 0 °C [10,11]. Therefore, methanol has been industrially used in the Rectisol process as a physical absorber of CO2 [12].
Nowadays, methanol is gaining more attention as a possible future fuel that can be consumed in fuel cells and engines [13,14]. Methanol is of interest for large-scale transportation applications because it has a significant positive environmental impact over fossil fuels, particularly when used in fuel-cell vehicles [15]. The technology to produce methanol from biomass is similar to that used to produce methanol from coal [16]. The process flow chart is mainly composed of commercially established technologies such as gasification, syngas cleaning and conditioning, and methanol synthesis.
Pyrolysis oil, also called bio-oil, is a complex blend of numerous oxygenated compounds produced from lignocellulosic biomass through a thermochemical process (i.e., pyrolysis) in the intermediate temperature ranges from 400 °C to 600 °C in the absence of oxygen [17]. Pyrolysis oil contains organic compounds such as carboxylic acids, alcohols, aldehydes, ketones, esters, furans, and aromatics [18]. The water content of pyrolysis oil generally ranges from 15 wt.% to 25 wt.% [19,20]. Up to 70 wt.% of the original dry biomass can be converted into pyrolysis oil [21]. The properties of pyrolysis oil depends on multiple factors such as the type of biomass feedstock, alkaline compounds content, reactor type, reaction temperature, residence time, char removal, etc. [22,23,24]. For example, the pyrolysis oil produced from pyrolysis of beech wood chips consists mainly of aldehydes, acids, esters, alcohols, ketones, benzene derivatives, phenol, and alkanes; due to the different reaction conditions, the product content varies considerably [25]. Compared to the primary biomass, pyrolysis oil presents several advantages. First, its volumetric energy density is increased about five times more than the “bulk” biomass, making transport economically more attractive, especially over long distances [26]. When large-scale remote biomass collection is considered, pyrolysis oil can firstly be produced locally and then transported to the central processing area [21]. Second, pyrolysis oil is a liquid, which makes storage, transport, processing, and pressurization easier. It can also be stored in tanks that resist well against biodegradation and cannot be ignited at ambient temperature [27]. Third, compared to conventional fossil fuels, pyrolysis oil contains small quantities of sulfur, nitrogen, and ash. As a result, its combustion releases less harmful gas emissions such as nitrogen oxides (NOx) and sulfur dioxide (SO2). [26]. Furthermore, as the pyrolysis oil is produced through a low temperature process, minerals and metals remain in the solid char residue. However, the drawbacks of pyrolysis oil should not be ignored, the pyrolysis oil properties limiting its applications. This phenomenon is caused by high oxygen content, volatility, high viscosity, acidity, low heating value, and incompatibility with petroleum and other bio-based fuels [28]. Despite these constraints, pyrolysis oil has plentiful advantages to be used to produce syngas by gasification.
In this paper, a new model is dedicated to simulating the methanol production via a set of processes including pyrolysis oil gasification, Rectisol, and methanol synthesis. The model is then validated by experimental and industrial results and used in a sensitivity analysis to identify the effects of varying operating conditions on the methanol production yield. Firstly, the modeling methodology is discussed, i.e., assumptions, model’s description, and its validation. Thereafter, the main results of the sensitivity analysis are presented and discussed, highlighting the impacts of various operating conditions on methanol yield, i.e., the gasifying temperature, pyrolysis oil moisture content, Rectisol temperature/pressure, and methanol synthesis reactor temperature/pressure.
2. Materials and Methods
2.1. Pyrolysis Oil Characteristics
The pyrolysis oil in this study has characteristics mentioned in reference [21]. It is produced by a company named BTG located in the Netherlands, processing beech wood chips in a pilot plant facility. The proximate and ultimate analysis provided the properties of this pyrolysis oil, which are presented in Table 1.

Table 1.
Beech wood pyrolysis oil composition.
2.2. Modeling Methodology
The main purpose was to design a comprehensive process model for methanol synthesis from pyrolysis oil gasification. The model was then used as a tool to identify the influence of the operating conditions on the methanol synthesis yield. Operating parameters such as gasification temperature, moisture content in pyrolysis oil, Rectisol pressure and temperature, but also methanol synthesis reactor conditions (temperature and pressure) were varied over wide ranges.
Pyrolysis oil gasification was applied to produce syngas. In many cases, syngas produced from biomass through gasification is CO2 rich or H2 deficient. However it can be adjusted using processes like water gas shift reaction, methane reforming, or CO2 removal [29]. Supplying external H2 is also a solution to adjust its composition before feeding into the fuel synthesis loop [30]. In this study, Rectisol process was applied to clean up syngas and adjust syngas composition to satisfy the methanol synthesis requirements. Then post-treatment syngas was compressed at high pressure and introduced into the methanol synthesis reactor to produce the desired compound. The process flow diagram in Figure 1 shows the Aspen Plus blocks illustrating the model used to simulate the methanol synthesis production from pyrolysis oil. The model consists of three main parts: gasification, syngas post-treatment, and methanol synthesis. The pyrolysis oil is specified as a nonconventional ingredient in Aspen Plus and defined in the block by properties presented in Table 1.
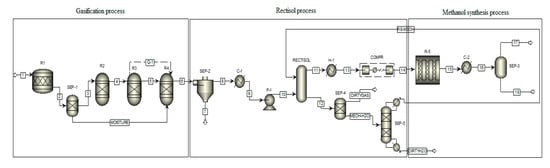
Figure 1.
Process flow diagram of the Aspen Plus model for methanol synthesis via pyrolysis oil gasification.
2.2.1. Gasification Process
Several thermochemical reactions occur during gasification at different temperature zones: drying zone (>150 °C), decomposition zone (250~700 °C), combustion zone (700 °C to 1500 °C), and gasification zone (800 °C to 1200 °C) [31]. At drying stage, the moisture content is removed from pyrolysis oil. The decomposition stage is initiated at about 250 °C when the labile bonds between the aromatic clusters are cracked, generating light molecular weight fragments. This stage generates gaseous molecules such as H2, CO, CH4, as well as light char and tar. After decomposition, pyrolysis oil undergoes combustion, which practically provides the thermal energy required to sustain the endothermic reactions. This stage generates gaseous molecules such as CO2 and H2O [32]. A series of endothermic reactions, such as water gas, Boudouard, water gas shift, and steam methane reforming reactions occur at this stage [14]. Useful combustible gases such as H2 and CO are produced at gasification stage. At the end, the whole gasification process generates a syngas composed mainly of CO, CO2, H2, and CH4. The production of CO, CO2, CH4, H2, and steam in the whole process can be explained by the reactions given in (Equations (R-1)–(R-8)), which occur at various stages [15].
The gasification model is based on the following assumptions, i.e.,
- (1)
- Pyrolysis oil feed rate is 1000 kg/h.
- (2)
- Gasification is assumed to be steady state, isothermal, and simulated using a kinetic-free model [32].
- (3)
- Pyrolysis oil devolatilization occurs instantaneously and the volatile products mainly include H2, CO, CO2, CH4, H2S, NH3, and H2O.
- (4)
- All gases are ideal gases and uniformly distributed in the gas phase.
- (5)
- All reactions take place at a chemical equilibrium state and the pressure loss was not considered.
A kinetic-free equilibrium model was designed for the gasification process by using Aspen plus. Gasification process is usually divided into four stages, as presented in Figure 1: drying (R1), decomposition (R2), combustion (R3), and gasification (R4). Table 2 lists a brief explanation of the units used in the gasification process. Firstly, the wet pyrolysis oil (stream 1) was fed into R1 block to model the drying process. Dry pyrolysis oil and moisture were separated by the SEP-1 block. Secondly, dry pyrolysis oil (stream 3) was fed into reactor R2 where pyrolysis oil is decomposed into its elemental components (C, H, O, N, S, etc.). The elemental distribution of pyrolysis oil was specified according to its ultimate analysis (see Table 1). R2 block was used to convert nonconventional pyrolysis oil into conventional components. The nonconventional definition of pyrolysis oil is shown in Appendix A. Thirdly, combustion of pyrolysis oil is modeled by a Gibbs reactor. The RGibbs reactor handles the complete chemical equilibrium by minimizing Gibbs-free energy. The decomposed pyrolysis oil enters the R3 block where partial oxidation and combustion reactions occur. After combustion, the produced syngas with steam originating from pyrolysis oil moisture was fed to gasification units. Lastly, gasification is also modeled by using a Gibbs reactor, the R4 block handling the calculation of the syngas component by minimizing Gibbs free energy [31].
Table 2.
Description of Aspen plus blocks used in the gasification model.
2.2.2. Rectisol Unit
The main purpose of Rectisol is to clean up the outlet syngas of gasification to obtain a high-quality syngas that can be used for the methanol synthesis [12]. The Rectisol process uses chilled methanol as the solvent to remove the major impurities, such as CO2, H2S, COS, CS2, and HCN, producing a cleaner syngas. Thus, the Rectisol system is able to obtain a pure syngas stream and simultaneously adjust its stoichiometric ratio to satisfy the requirements of methanol synthesis. In addition, the methanol used in the purification step can be reused over several cycles, making the process economically feasible.
It is worth noting that the stoichiometric number (SN) (Equation (1)) for the syngas composition plays a dominating role in methanol synthesis reaction. The ideal value of SN is slightly higher than 2, indicating an excess of H2 or less CO2.
Table 3 lists a brief explanation of the Aspen Plus blocks used in Rectisol system. Firstly, after the gasification process, ash content in syngas (stream 6) was eliminated by the SEP-2 (Cyclone separator). Secondly, the syngas leaving the separator is cooled and pressurized to a temperature of 80 °C and 40 bar by the C-1 and P-1. Lastly, the RECTISOL block in Aspen Plus is used to simulate Rectisol process where the syngas (stream 10) was fed into Rectisol columns at the bottom. Meanwhile, a 20 kmol/h flow rate of cooled solvent methanol (RE-MEOH), entering from the top of columns, interacts with the syngas. Post-treatment syngas (stream 11) is withdrawn from the top of Rectisol column. Water, impurities and part of the CO2 are absorbed by the cooled methanol (stream 12), flowing out from the bottom of the Rectisol column. Meanwhile, SEP-4 is used to separate gas (impurities and CO2) and liquid phase (methanol and H2O) from the liquid phase. Another separator (SEP-5) is used to separate H2O and methanol. After purification, the methanol (RE-MEOH) is reintroduced into Rectisol unit.
Table 3.
Description of Aspen plus blocks used in Rectisol.
2.2.3. Methanol Synthesis and Water Gas Shift Reaction Process
After syngas post-treatment, the syngas (stream 14) was introduced into the methanol synthesis reactor. At this step, CO2 hydrogenation to methanol and water gas shift reaction over a commercial Cu/ZnO/Al2O3 catalyst occur simultaneously [33]. As the methanol synthesis is exothermic and volumetric reduction reaction, the productivity can be increased by rising pressure and reducing the reaction temperature. Therefore, the methanol synthesis reactor was assumed to operate at 250~350 °C and 50~150 bar [34]. The main reactions in the methanol synthesis unit can be expressed as described in the following Equations:
The methanol synthesis model is based on several assumptions, i.e.,
- (1)
- Pressure loss in the methanol synthesis reactor is not considered.
- (2)
- Syngas is preheated sufficiently and the temperature distribution in the methanol synthesis reactor is assumed to be uniform.
Table 4 lists the blocks that were applied in methanol synthesis system. The post-treatment syngas (stream 11) obtained from Rectisol was heated up to 250 °C by H-1 and compressed to 50 bar by COMPR block. The methanol synthesis reactor is simulated by the R5 block where CO2 hydrogenation and water gas shift reaction occur. The Langmuir–Hinshelwood–Hougen–Watson (LHHW) kinetic model is applied in the format of the reactant fugacity of the hydrogenation of CO2 and water gas shift. The kinetic parameters applied in the LHHW block are obtained from the William experimental results [35]. Finally, a SEP-3 block was used to separate residual syngas from the mixture of methanol and water.
Table 4.
Description of Aspen plus block used in methanol synthesis and operating condition.
The LHHW expression is presented in Equation (2):
The reaction rate to produce methanol from carbon dioxide hydrogenation is given in Equation (3).
The reaction rate for the water gas shift reaction is given in Equation (4).
where
- Ri = reaction rate [mol/kgcat*s]
- ki = kinetic factor [kmol/kgcat*s*bar] or [kmol/kgcat*s*bar2]
- pi = partial pressure [bar]
- KEi = equilibrium constant [-] or [bar−2]
- k1/2/3 = adsorption constants [barn]
3. Results and Discussion
3.1. Model Validation
3.1.1. Gasification
The flowsheet result of gasification in Aspen Plus is presented in Appendix B. The simulation model is validated by using experimental data from gasification of pyrolysis oil published by Van Rossum et al. [21]. The experimental data and simulation results are shown in Table 5. In this research, pyrolysis oil is used to produce syngas through gasification in a fluidized bed with nickel-based catalysts at 800 °C. It may be observed that the model syngas concentration is in good agreement with the experimental results except the concentration of CO and CH4. In the experiments, the steam methane reforming reaction is restricted by the reaction time so it cannot reach a state of complete equilibrium [29]. Therefore, the concentration of CH4 simulated by RGibbs reactor without the time limitation is very low and this part of CH4 reacts with steam into CO and H2 (R-8). Because the nitrogen and sulfur content in pyrolysis oil is relatively low, the content of H2S and NH3 in the produced syngas is low.
Table 5.
Comparison between experimental and simulated results of gasification process.
3.1.2. Rectisol
To validate the Rectisol process model, the simulated results were compared with the experimental data. The flowsheet result of Rectisol is presented in Appendix C. In Bell et al. research, Rectisol is designed to process syngas from acid gas shift reactor prior to the synthesis of ammonia at 1000 tons/day [36]. The Rectisol columns are designed to remove most of the dissolved CO2, H2S, and COS. The syngas, composed of H2, N2, Ar, CO, CH4, CO2, H2S, and COS, is fed to the bottom of the column, the chilled methanol is fed to the top of the Rectisol column. As the gas flows upward in the Rectisol column, downward flowing methanol absorbs H2S, COS, and CO2, so the syngas leaving the top of Rectisol column is nearly sulfur and CO2 free. Liquid methanol is withdrawn from the bottom of the column; the results are presented in Table 6. The simulation results are compared with the experimental results. There is a small discrepancy between the experimental data and simulation results but it is not significant. Therefore, the Rectisol model could be considered as a valid model to simulate Rectisol process.
Table 6.
Comparison between simulated and experimental results of Rectisol.
3.1.3. Methanol Synthesis
The flowsheet result of methanol synthesis in Aspen Plus is presented in Appendix D. The methanol synthesis simulation results are compared with the data obtained from the industrial methanol synthesis results [37]. Results obtained from the simulation and the corresponding industrial data are presented in Table 7. As the comparison between experimental and simulated results shows, the model produces results close to the reference data. The error between simulated results and experimental results is 0.7%. It is worth noting the discrepancy between the content of CO and CO2; this is due to the synthetic pathway of methanol in the practical experiment where both of CO and CO2 participate into the methanol synthesis reaction. However, in the simulation, CO participates into the water-gas shift reaction instead of methanol synthesis. There is a difference between the reference and simulated pressure. This is because the syngas volume is reduced during methanol synthesis process, resulting in the decrease of the partial pressure of H2, CO, and CO2. As a consequence, the side of the equilibrium with fewer moles is becoming more unfavorable [38]. Therefore, a higher reaction pressure is needed in the actual reaction to facilitate methanol synthesis. However, in the simulation, the methanol synthesis reactor pressure is fixed at 40 bar. The simulated and experimental results of the methanol yield are approximately similar. Therefore, the model can be considered as a valid model to simulate the methanol synthesis process.
Table 7.
Comparison between simulated and industrial results of methanol yield.
3.2. Effect of Operating Conditions
In this section, the effect of the operating conditions, such as gasification temperature, pyrolysis-oil moisture content, Rectisol temperature and pressure on syngas composition, SN and methanol yield, as well as methanol synthesis operation conditions are discussed.
3.2.1. Effect of Gasifier Temperature
The gasification temperature is a key parameter for syngas production. Figure 2 and Figure 3 show the effect of gasifier temperature on syngas composition and SN. The gasifier temperature varies from 400 °C to 1200 °C. Low temperature conditions (from 400 °C to 600 °C) favor the production of CO2 and CH4. Increasing the temperature from 400 °C to 800 °C leads to a constant and significant increase in CO and H2 concentrations. This phenomenon is caused by endothermic reactions like Boudouard (R-4), water gas shift (R-7), and methane steam reforming (R-8). According to Le Chatelier’s principle, high temperatures favor the formation of endothermic reaction products [39]. Therefore, the CO and H2 concentrations increase at high temperatures, while the CH4 and CO2 concentrations decrease. At high temperatures (above 800 °C), the concentrations of H2 and CO2 slightly decrease, while the concentration of carbon monoxide slightly increases. This is attributed to the water gas shift reaction (R-7). Due to its exothermic nature, this reaction is thermodynamically favored at low temperatures.
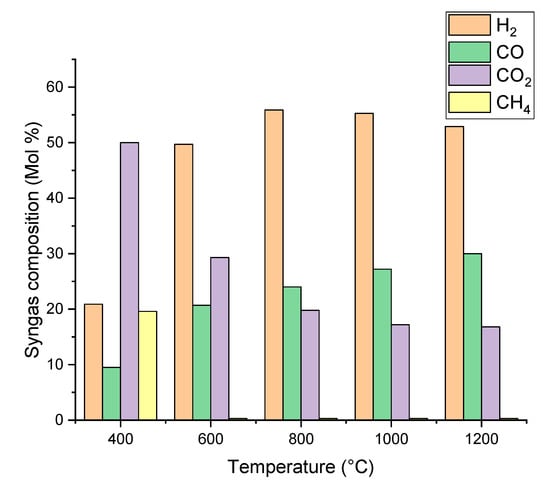
Figure 2.
Effect of gasifier temperature on syngas composition.
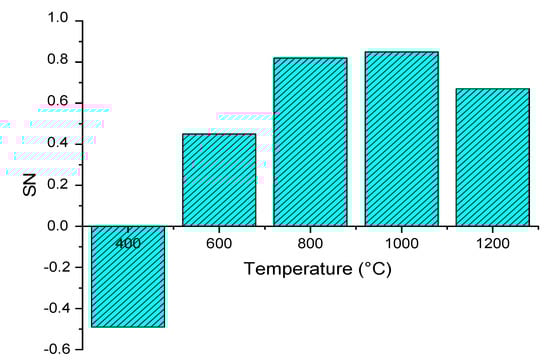
Figure 3.
Effect of gasifier temperature on stoichiometric number (SN)
Figure 3 shows the effect of the gasification temperature on SN that closely determines the methanol yield. The SN value increased from a minimum of −0.49 (CO2 content is greater than H2) to a maximum of 0.85 when the temperature increased from 400 °C to 1000 °C. This is because steam methane reforming (R-8) and Boudouard (R-4) reactions are dominant reactions over the water gas shift (R-7) reaction [40]. However, when the temperature increased to 1000 °C, the SN value dropped to 0.67. This is because of the water gas shift reaction: the carbon dioxide production being favored at high temperatures. The effects of gasifier temperature on syngas composition and SN value is closed to previous experimental results. In van Rossum research [26], the effect on the trend of H2, CO, and CO2 content is the same as our simulation. The pyrolysis oil characteristics have a significant effect on the syngas composition, however, the trend of syngas SN value is the same, increasing and then decreasing.
3.2.2. Effect of Pyrolysis Oil Moisture Content
Figure 4 and Figure 5 present the effects of pyrolysis oil moisture content on syngas composition and SN between 10 wt.% and 50 wt.%. According to water gas shift reaction (R-7) and water gas reaction (R-6), moisture content in pyrolysis oil increases the mole fraction of H2 and CO2, while the amount of CO decreased. As a result, the SN value constantly increased from 0.805 to 0.865 with the pyrolysis oil moisture content from 10 wt.% to 30 wt.%. When the moisture content is more than 30 wt.%, the H2 and CO2 concentrations continually increase while the CO decreases and the SN value is maintained at 0.865. Therefore, the moisture content in pyrolysis oil seems to be the most beneficial around 30% because excess moisture content has no positive effect on syngas composition and SN value. In contrast, it will consume more heat during gasification process. The effect of pyrolysis oil moisture content on syngas SN value is also similar to Van Rossum experimental research [21]. In this study, beech oil is used to produce syngas through gasification, and the steam/carbon ratio is increased from 2.1 to 3.2, resulting in an increase in the syngas SN value from 0.566 to 0.692.
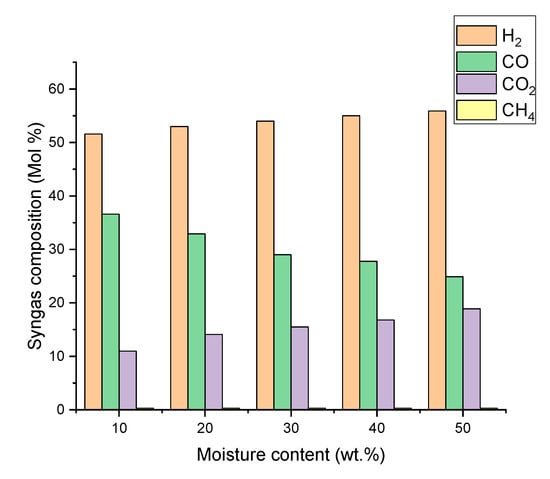
Figure 4.
Effect of pyrolysis oil moisture content on syngas composition.
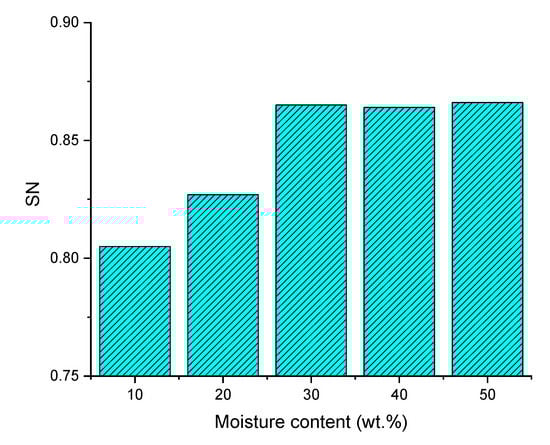
Figure 5.
Effect of pyrolysis oil moisture content on SN.
3.2.3. Effect of Rectisol Operating Temperature
As indicated in Figure 3 and Figure 5, the SN of syngas produced from gasification is so low that it cannot satisfy the requirement of methanol synthesis. Therefore, a syngas post-treatment process like Rectisol is needed to adjust its composition. Figure 6 shows the effect of Rectisol temperature on syngas composition, SN, and methanol yield. As is well known, the solubility of methanol to absorb CO2 gradually decreases while the Rectisol temperature increases [41]. When the Rectisol temperature decreases from 40 °C to −40 °C, the content of CO2 remaining in the syngas decreases from 6.175 kmol to 0.013 kmol. As a result, the SN continues to increase from 1.34 to 2.36 with the decrease of the Rectisol temperature. As Figure 7 indicated, when the temperature of Rectisol was −20 °C, the SN value was close to 2. At this point, the methanol yield reached the maximum of 7.99 kmol. When the Rectisol temperature was below −20 °C, the methanol yield decreased dramatically along with the decrease of Rectisol temperature. This is caused by the low content of CO2 in syngas to react with H2 to synthesize methanol. When the Rectisol temperature is higher than −20 °C, the methanol yield is also reduced due to excessive CO2 in syngas that cannot satisfy SN requirement.
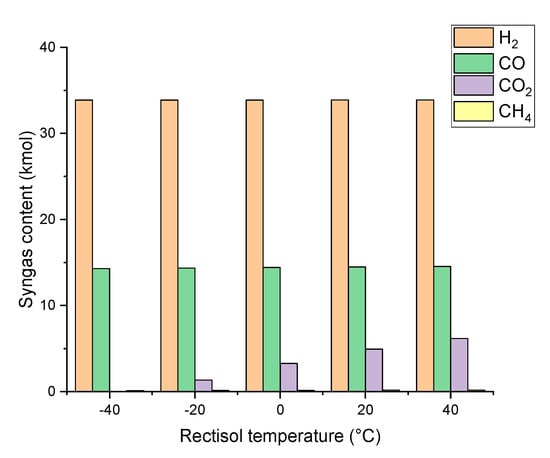
Figure 6.
Effect of Rectisol temperature on syngas composition (40 bar).
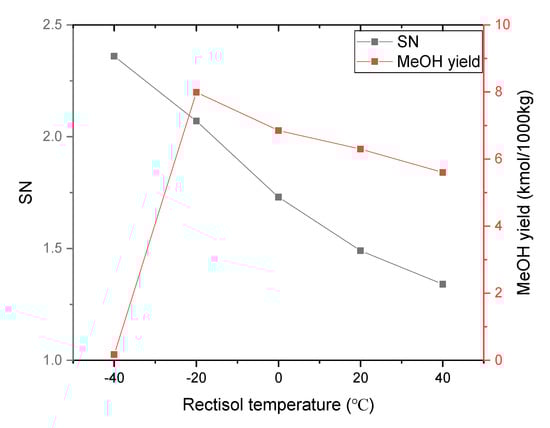
Figure 7.
Effect of Rectisol temperature on SN and methanol yield (40 bar).
3.2.4. Effect of Rectisol Operating Pressure
The effects of Rectisol pressure on the syngas composition, SN, and methanol synthesis yield are presented in Figure 8 and Figure 9. CO2 content continuously decreases from 11.13 kmol to 0 kmol when the Rectisol pressure raises from 1 bar to 80 bar. As a result, the SN increases from 0.87 to 2.5 while the Rectisol pressure increases. When the pressure is around 40 bar, the SN value is close to 2 where the methanol yield reaches the maximum of 8.02 kmol. When the Rectisol pressure increases from 40 bar to 60 bar, the solubility of methanol to absorb CO2 continues to increase, producing a significant drop in the CO2 content in the syngas. As a result, the methanol yield reaches the minimum of 0.01 kmol. This is because there is not enough CO2 in the syngas to react with H2 to produce methanol.
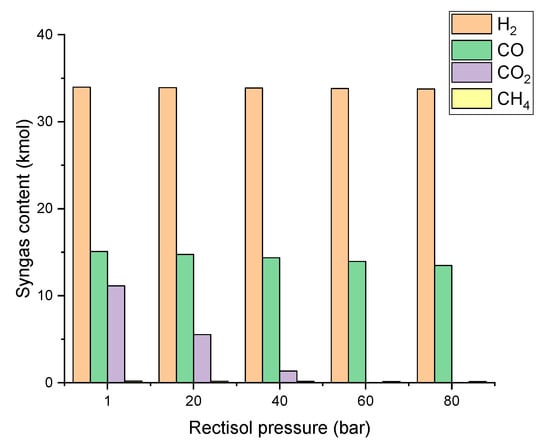
Figure 8.
Effect of Rectisol pressure on syngas composition (−20 °C).
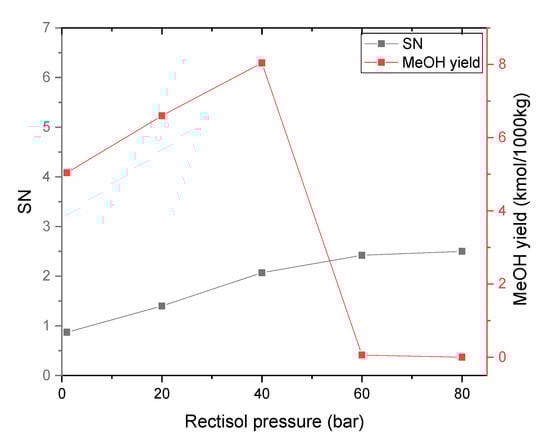
Figure 9.
Effect of Rectisol pressure on SN and methanol yield (−20 °C).
3.2.5. Effect of Methanol Synthesis Operating Temperature
First of all, in order to investigate the reaction conditions of methanol synthesis, the syngas circulation system is not considered in our simulation. The methanol synthesis reactor temperature is an influential parameter on the methanol yield. Figure 10 shows the effect of temperature on methanol production between 150 and 350 °C. The methanol yield is improved with increasing reaction temperature from 150 °C to 250 °C, reaching a maximum of 7.99 kmol/1000 kg at 250 °C. This trend is consistent with the kinetics of methanol synthesis that high temperatures favor its production. However, when the temperature increases from 250 °C to 350 °C, yields decrease significantly. This phenomenon is due to CO2 liquefaction, which is an exothermic reaction. With respect to methanol synthesis thermodynamics, the methanol synthesis reaction is favored at low temperatures. Figure 10 indicates that the optimal temperature for methanol synthesis is around 250 °C, which is in agreement with various studies reported [8,42]. In those works, the typical operation temperature for methanol synthesis is in the range of 220 °C to 280 °C.
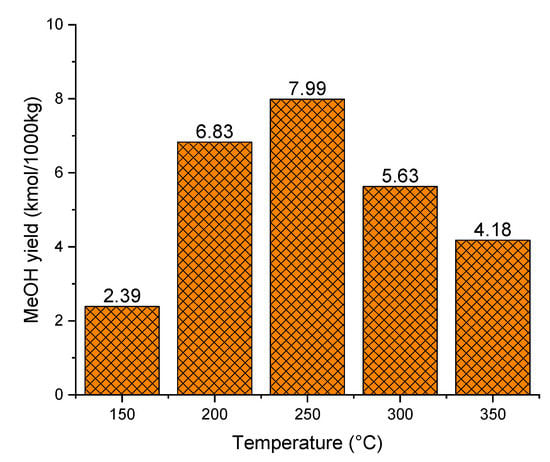
Figure 10.
Effect of temperature on methanol yield (50 bar).
3.2.6. Effect of Methanol Synthesis Operating Pressure
Figure 11 shows the effect of methanol synthesis operating pressure on yield. It is observed that the methanol yield improves with increasing operating pressures, which is due to the reversible nature of the reaction (reducing the gas volume). Therefore, increasing reaction pressure favors the methanol production. For example, when the pressure increases from 1 bar to 50 bar, the methanol yield increases significantly from 0 kmol/1000 kg to 7.99 kmol/1000 kg. However, when the pressure increases from 50 bar to 150 bar, the yield increases barely from 7.99 kmol/1000 kg to 11.35 kmol/1000 kg. The methanol yield increase rate from 0 bar to 50 bar is more significant than the yields at a pressure between 50 bar and 150 bar. Besides, using strong operating pressures involve higher equipment requirements, price, and operational risks. Therefore, although the methanol production is favored at higher pressures, a pressure of 50 bar appears as a good compromise.
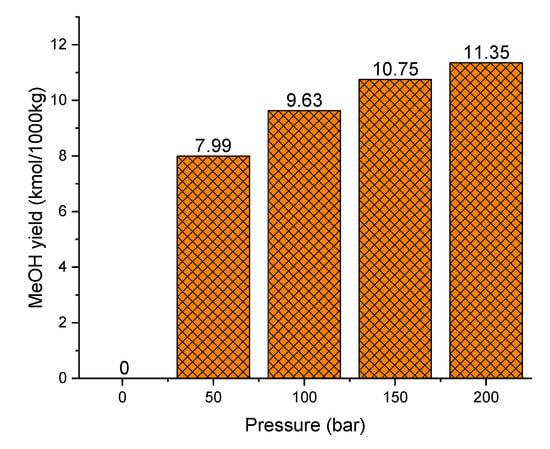
Figure 11.
Effect of pressure on methanol yield (250 °C).
4. Conclusions
The objective of this study was to develop and validate a simulation model of methanol synthesis from a syngas obtained through pyrolysis oil gasification. For this purpose, Aspen Plus simulation software was used. The model was validated using experimental data from literature and the results show a good agreement between simulations and experimental data for gasification, Rectisol, and methanol synthesis processes. The validated model was then used to analyze the influence of operating conditions on key parameters.
More specifically, the influence of the gasification temperature and moisture content in pyrolysis oil on syngas composition and syngas SN value was analyzed. Afterwards, Rectisol operation condition and methanol synthesis operation condition on methanol yield were studied. When gasification temperature increased at 1000 °C, the concentration of CO and H2 increased which results in the highest syngas SN value (0.85). The moisture content in pyrolysis oil should be kept at 30 wt.%, the SN reaches a maximum of 0.865. As the moisture content continues to increase, the syngas SN value is maintained at 0.865. The Rectisol process was applied to absorb acid syngas and simultaneously adjust syngas SN value; Rectisol unit was set at −20 °C and 40 bar. Then, syngas SN value reached a maximum of 2.07; the methanol yields also reached a maximum of 8.04 kmol. The methanol production is favored at high pressure and relatively low temperature. In this context, 50 bar and 250 °C were selected as the optimal operating conditions for the methanol synthesis.
Finally, although the methanol yield of pyrolysis oil is relatively low compared to other feedstocks (e.g., biomass and natural gas), the high volumetric density of pyrolysis oil makes it less expensive to transport and store; this advantage gives biomass the opportunity to be used on a large-scale plant. Besides that, pyrolysis oil is a cleaner bioresource than its original biomass, syngas produced from pyrolysis oil contains less impurities, making the pyrolysis oil more suitable to methanol production process. This article briefly provides guidance for the future pyrolysis oil industrial application to produce methanol.
Author Contributions
Conceptualization, Z.Z. and B.D.; methodology, Z.Z. and B.D.; software, Z.Z. and B.D.; validation, Z.Z.; formal analysis, Z.Z. and B.D.; investigation, P.M.; resources, B.D. and P.M..; data curation, Z.Z.; writing—original draft preparation, Z.Z.; writing—review and editing, B.D. and O.R.; visualization, Z.Z.; supervision, P.M.; project administration, P.M.; funding acquisition, P.M. All authors have read and agreed to the published version of the manuscript.
Funding
This research received no external funding.
Acknowledgments
The authors are grateful to Patrice Mangin (Université du Québec à Trois-Rivières) for funding this research.
Conflicts of Interest
The author declares no conflict of interest
Appendix A
Table A1.
Pyrolysis oil nonconventional definition.
Table A1.
Pyrolysis oil nonconventional definition.
| Attribute ID: | |||
|---|---|---|---|
| PROXANAL | SULFANAL | ||
| MOISTURE | 32.5 | PYRITIC | 0.001 |
| FC | SULFATE | ||
| VM | ORGANIC | ||
| ASH | |||
Appendix B
Table A2.
Gasification flowsheet in Aspen Plus.
Table A2.
Gasification flowsheet in Aspen Plus.
| Component Mass Flow (kg/hr) | 1 | 2 | 3 | MOISTURE | 4 | 5 | 6 |
|---|---|---|---|---|---|---|---|
| Temp (°C) | 50 | 100 | 100 | 100 | 500 | 800 | 800 |
| Pressure (bar) | 1 | 1 | 1 | 1 | 1 | 1 | 1 |
| Pyrolysis oil | 1000 | ||||||
| Oil | 675 | 675 | |||||
| H2O | 325 | 325 | |||||
| -H2 | 4.15 | ||||||
| -O2 | 32.82 | ||||||
| -C | 30.40 | ||||||
| -N2 | 0.27 | ||||||
| -S | 0.001 | ||||||
| H2O | trace | 42.7 | |||||
| H2 | 40.9 | 64.2 | |||||
| CO | 570.1 | 386.0 | |||||
| CO2 | trace | 500.4 | |||||
| CH4 | 2.8 | 2.8 | |||||
| C | 59.7 | ||||||
| H2S | 0.01 | trace | |||||
| H3N | 3.8 | 3.3 | |||||
| C2H6 | trace | trace |
- Elemental distribution.
Appendix C
Table A3.
Post-treatment flowsheet in Aspen Plus.
Table A3.
Post-treatment flowsheet in Aspen Plus.
| Component Mass Flow (kg/hr) | 6 | 7 | 8 | 9 | 10 | RE-MEOH | 11 | 12 | DIRTY GAS | MEOH- H2O | DIRTY H2O | 13 | 14 |
|---|---|---|---|---|---|---|---|---|---|---|---|---|---|
| Temp (℃) | 800 | 800 | 800 | 80 | 80 | −20 | −20 | −20 | −20 | −20 | 250 | 250 | |
| Pressure (bar) | 1 | 1 | 1 | 1 | 40 | 40 | 40 | 1 | 1 | 1 | 40 | 50 | |
| H2O | 42.7 | 42.7 | 42.7 | 42.7 | 42.7 | 42.7 | 42.7 | ||||||
| H2 | 64.2 | 64.2 | 64.2 | 64.2 | 64.2 | 64.2 | 64.2 | ||||||
| CO | 386.0 | 386.0 | 386.0 | 386.0 | 386.0 | 386.0 | 386.0 | ||||||
| CO2 | 500.4 | 500.4 | 500.4 | 500.4 | 50.2 | 450.2 | 450.2 | 50.2 | 50.2 | ||||
| CH4 | 2.8 | 2.8 | 2.8 | 2.8 | 2.8 | 2.8 | 2.8 | ||||||
| H2S | trace | trace | trace | trace | trace | trace | |||||||
| H3N | 3.3 | 3.3 | 3.3 | 3.3 | 3.3 | 3.3 | |||||||
| ASH | 0 | 0 | |||||||||||
| MeOH | 640 | 640 | 640 |
Appendix D
Table A4.
Methanol synthesis flowsheet in Aspen Plus.
Table A4.
Methanol synthesis flowsheet in Aspen Plus.
| Component Mass Flow (kg/hr) | 14 | 15 | 16 | 17 | 18 |
|---|---|---|---|---|---|
| Temp (°C) | 250 | 250 | 50 | 50 | 50 |
| Pressure (bar) | 50 | 50 | 1 | 1 | 1 |
| H2 | 64.2 | 31.0 | 31.0 | 31.0 | |
| CO | 386.0 | 175.6 | 175.6 | 175.6 | |
| CO2 | 50.2 | 26.8 | 26.8 | 26.8 | |
| CH4 | 2.8 | 2.8 | 2.8 | 2.8 | |
| H2O | 9.5 | 9.5 | 9.5 | ||
| MeOH | 257.3 | 257.3 | 257.3 |
References
- Taba, L.E.; Irfan, M.F.; Daud, W.A.M.W.; Chakrabarti, M.H. The effect of temperature on various parameters in coal, biomass and CO-gasification: A review. Renew. Sustain. Energy Rev. 2012, 16, 5584–5596. [Google Scholar] [CrossRef]
- Zickfeld, K.; Solomon, S.; Gilford, D.M. Centuries of thermal sea-level rise due to anthropogenic emissions of short-lived greenhouse gases. Proc. Natl. Acad. Sci. USA 2017, 114, 657–662. [Google Scholar] [CrossRef]
- McKendry, P. Energy production from biomass (part 1): Overview of biomass. Bioresour. Technol 2002, 83, 37–46. [Google Scholar] [CrossRef]
- Ruiz, J.A.; Juárez, M.; Morales, M.; Muñoz, P.; Mendívil, M. Biomass gasification for electricity generation: Review of current technology barriers. Renew. Sustain. Energy Rev. 2013, 18, 174–183. [Google Scholar] [CrossRef]
- Rauch, R.; Hrbek, J.; Hofbauer, H. Biomass gasification for synthesis gas production and applications of the syngas. Wiley Interdiscip. Rev. Energy Environ. 2014, 3, 343–362. [Google Scholar] [CrossRef]
- Abdoulmoumine, N.; Adhikari, S.; Kulkarni, A.; Chattanathan, S. A review on biomass gasification syngas cleanup. Appl. Energy 2015, 155, 294–307. [Google Scholar] [CrossRef]
- Moioli, S.; Pellegrini, L.A.; Gamba, S. Simulation of CO2 capture by MEA scrubbing with a rate-based model. Proc. Eng. 2012, 42, 1651–1661. [Google Scholar] [CrossRef]
- Ortiz, F.G.; Serrera, A.; Galera, S.; Ollero, P. Methanol synthesis from syngas obtained by supercritical water reforming of glycerol. Fuel 2013, 105, 739–751. [Google Scholar] [CrossRef]
- Gupta, M.; Coyle, I.; Thambimuthu, K. CO2 Capture Technologies and Opportunities in Canada. In Proceedings of the 1st Canadian CC&S Technology Roadmap Workshop, Calgary, AB, Canada, 18–19 September 2003; p. 19. [Google Scholar]
- Chihara, H. Kagaku Binran–Kiso Handbook of Basic Chemistry, 3rd ed.; Maruzen: Tokyo, Japan, 1984; Volume 2, p. 158. [Google Scholar]
- Hochgesand, G. Rectisol and purisol. Ind. Eng. Chem. Res. 1970, 62, 37–43. [Google Scholar] [CrossRef]
- Gatti, M.; Martelli, E.; Marechal, F.; Consonni, S. Review, modeling, Heat Integration, and improved schemes of Rectisol®-based processes for CO2 capture. Appl. Therm. Eng. 2014, 70, 1123–1140. [Google Scholar] [CrossRef]
- Vancoillie, J.; Demuynck, J.; Sileghem, L.; Van De Ginste, M.; Verhelst, S.; Brabant, L.; Van Hoorebeke, L. The potential of methanol as a fuel for flex-fuel and dedicated spark-ignition engines. Appl. Energy 2013, 102, 140–149. [Google Scholar] [CrossRef]
- Breeze, P. Chapter 8-direct methanol fuel cell. In Fuel Cells; Breeze, P., Ed.; Academic Press: Cambridge, MA, USA, 2017; pp. 75–82. [Google Scholar] [CrossRef]
- Larson, E.D.; Katofsky, R.E. Production of hydrogen and methanol via biomass gasification. In Advances in Thermochemical Biomass Conversion; Springer: Berlin/Heidelberg, Germany, 1993; pp. 495–510. [Google Scholar] [CrossRef]
- Chmielniak, T.; Sciazko, M. Co-gasification of biomass and coal for methanol synthesis. Appl. Energy 2003, 74, 393–403. [Google Scholar] [CrossRef]
- Alvarez, J.; Lopez, G.; Amutio, M.; Bilbao, J.; Olazar, M. Bio-oil production from rice husk fast pyrolysis in a conical spouted bed reactor. Fuel 2014, 128, 162–169. [Google Scholar] [CrossRef]
- Staš, M.; Kubička, D.; Chudoba, J.; Pospíšil, M. Overview of analytical methods used for chemical characterization of pyrolysis bio-oil. Energy Fuels 2014, 28, 385–402. [Google Scholar] [CrossRef]
- Bridgwater, A.; Cottam, M. Opportunities for biomass pyrolysis liquids production and upgrading. Energy Fuels 1992, 6, 113–120. [Google Scholar] [CrossRef]
- Radlein, D. The production of chemicals from fast pyrolysis bio-oils. In Fast Pyrolysis of Biomass: A Handbook; CLC Press: Newnury, UK, 1999; p. 164. [Google Scholar]
- Van Rossum, G.; Kersten, S.R.; van Swaaij, W.P. Catalytic and noncatalytic gasification of pyrolysis oil. Ind. Eng. Chem. Res. 2007, 46, 3959–3967. [Google Scholar] [CrossRef]
- Huber, G.W.; Iborra, S.; Corma, A. Synthesis of transportation fuels from biomass: Chemistry, catalysts, and engineering. Chem. Rev. 2006, 106, 4044–4098. [Google Scholar] [CrossRef]
- Demirbas, A. The influence of temperature on the yields of compounds existing in bio-oils obtained from biomass samples via pyrolysis. Fuel Process. Technol. 2007, 88, 591–597. [Google Scholar] [CrossRef]
- Brown, R.C.; Radlein, D.; Piskorz, J. Pretreatment processes to increase pyrolytic yield of levoglucosan from herbaceous feedstocks. In Chemicals and Materials from Renewable Resources, Proceedings of the ACS Symposium Series, Washington, DC, USA, 2001; American Chemical Society: Washington, DC, USA, 1999; pp. 123–132. [Google Scholar] [CrossRef]
- Özbay, G.; Özçifçi, A.; Aysal, S. Pyrolysis of beech wood catalysed by FeCl3: Production and characterisation of bio-oil. In Proceedings of the 9th Wood Science and Engineering in the Third Millennium–ICWSE, Brasov, Romania, 7–9 September 2013; Volume 1, pp. 75–81. [Google Scholar]
- Rossum, G. Steam Reforming and Gasification of Pyrolysis Oil; University of Twente: Enschede, The Netherlands, 2009. [Google Scholar]
- Oasmaa, A.; Meier, D. Norms and standards for fast pyrolysis liquids: 1. Round robin test. J. Anal. Appl. Pyrolysis 2005, 73, 323–334. [Google Scholar] [CrossRef]
- Krutof, A.; Hawboldt, K. Blends of pyrolysis oil, petroleum, and other bio-based fuels: A review. Renew. Sustain. Energy Rev. 2016, 59, 406–419. [Google Scholar] [CrossRef]
- Zhang, Y.; Xiao, J.; Shen, L. Simulation of methanol production from biomass gasification in interconnected fluidized beds. Ind. Eng. Chem. Res 2009, 48, 5351–5359. [Google Scholar] [CrossRef]
- Yin, X.; Leung, D.Y.; Chang, J.; Wang, J.; Fu, Y.; Wu, C. Characteristics of the synthesis of methanol using biomass-derived syngas. Energy Fuels 2005, 19, 305–310. [Google Scholar] [CrossRef]
- Begum, S.; Rasul, M.; Akbar, D. A numerical investigation of municipal solid waste gasification using aspen plus. Proc. Eng. 2014, 90, 710–717. [Google Scholar] [CrossRef]
- Ramzan, N.; Ashraf, A.; Naveed, S.; Malik, A. Simulation of hybrid biomass gasification using Aspen plus: A comparative performance analysis for food, municipal solid and poultry waste. Biomass Bioenergy 2011, 35, 3962–3969. [Google Scholar] [CrossRef]
- Bussche, K.V.; Froment, G. A Steady-state kinetic model for methanol synthesis and the water gas shift reaction on a commercial Cu/ZnO/Al2O3 catalyst. J. Catal 1996, 161, 1–10. [Google Scholar] [CrossRef]
- Zhang, C.; Jun, K.-W.; Kwak, G.; Lee, Y.-J.; Park, H.-G. Efficient utilization of carbon dioxide in a gas-to-methanol process composed of CO2/steam–mixed reforming and methanol synthesis. J. CO2 Util. 2016, 16, 1–7. [Google Scholar] [CrossRef]
- Luyben, W.L. Design and control of a methanol reactor/column process. Ind. Eng. Chem. Res. 2010, 49, 6150–6163. [Google Scholar] [CrossRef]
- Bell, D.A.; Towler, B.F.; Fan, M. Coal Gasification and Its Applications; William Andrew: Amsterdam, The Netherlands, 2010. [Google Scholar]
- Chen, L.; Jiang, Q.; Song, Z.; Posarac, D. Optimization of methanol yield from a Lurgi reactor. Chem. Eng. Technol. 2011, 34, 817–822. [Google Scholar] [CrossRef]
- Atkin, P. The Elements of Physical Chemistry: With Applications in Biology; WH Freeman and Company: New York, NY, USA, 2000. [Google Scholar]
- Fernandez-Lopez, M.; Pedroche, J.; Valverde, J.; Sanchez-Silva, L. Simulation of the gasification of animal wastes in a dual gasifier using Aspen Plus®. Energy Convers. Manag. 2017, 140, 211–217. [Google Scholar] [CrossRef]
- Pala, L.P.R.; Wang, Q.; Kolb, G.; Hessel, V. Steam gasification of biomass with subsequent syngas adjustment using shift reaction for syngas production: An Aspen Plus model. Renew. Energy 2017, 101, 484–492. [Google Scholar] [CrossRef]
- Burr, B.; Lyddon, L. A Comparison of Physical Solvents for Acid Gas Removal; Gas Processors’ Association Convention: Grapevine, TX, USA, 2008. [Google Scholar]
- Trop, P.; Anicic, B.; Goricanec, D. Production of methanol from a mixture of torrefied biomass and coal. Energy 2014, 77, 125–132. [Google Scholar] [CrossRef]
Publisher’s Note: MDPI stays neutral with regard to jurisdictional claims in published maps and institutional affiliations. |
© 2020 by the authors. Licensee MDPI, Basel, Switzerland. This article is an open access article distributed under the terms and conditions of the Creative Commons Attribution (CC BY) license (http://creativecommons.org/licenses/by/4.0/).