Abstract
Laser-based methods are widely used techniques for thermonuclear plasma diagnostics, since they can probe the internal of the plasma, being contactless and non-invasive. The interferometer, the polarimeter and Thomson scattering are the most widespread techniques, providing line-integral information of the electron density and the magnetic field (interferometer–polarimeter) and local information of the electron density and temperature (Thomson scattering). The design of the diagnostics is a fundamental step, which usually requires an iterative process to maximise the performances of the diagnostics and their durability. In the future reactors, such as ITER and DEMO, the working environment will be much challenging, due to the various electro-mechanical, thermal and nuclear loads which may affect the life of the components and degrade the performances of the diagnostics. This work aims to present the modelling of plasma interferometry, polarimetry and Thomson scattering applied to a ray optics code. The model, developed on the COMSOL Multiphysics software, can be easily interfaced with multiphysics problems, allowing the possibility to test the performances of the diagnostics in several conditions.
1. Introduction
Plasma diagnostics is one of the most important research fields in nuclear fusion, since they are the inputs of the control system, which has the scope to control the confinement stability of the plasma, and they are fundamental to understand and analyse the plasma physics and equilibrium [1,2,3,4,5]. Contact measurements are prohibited for core plasma investigations, because they are invasive, their life would be too short, and their interactions with plasma would produce impurities, causing off-normal events, such as disruptions. Magnetic diagnostics provide only boundary or integrated information, causing a lack of knowledge of the interior of the plasma, making optical diagnostics one of the best methods to probe the plasma interior [6,7]. For example, bolometers are widely used to measure the total emission of the plasma [8]; fundamental for the power balance, and, by tomographic inversion methods, they are able to evaluate the radiation pattern on the poloidal plane [9,10,11]. Between the optical diagnostics, the laser-based ones found many applications, where the most valuable are interferometry, polarimetry and Thomson scattering (TS) diagnostics [12].
The interferometer, measuring the phase difference between the probing beam and the reference beam, is used to measure the line-integrated electron density along the line of sight. It is considered to be one of the most important plasma diagnostics [13,14]. For example, the Joint European Torus (JET) mounts four vertical and four horizontal interferometric lines of sight, which are used to probe the electron density of the plasma and control the plasma discharge. Plasma polarimetry is based on the birefringent characteristic of magnetised plasmas, which involves two components of the electric field of the probing beam propagate differently, involving a changing of the polarisation of the beam. Measuring the polarisation variation effects (Faraday rotation and Cotton-Mouton phase shift) of the beam, it is possible to obtain information about the line integrated electron density and magnetic field [15,16,17]. Moreover, the polarimeter and the interferometer can be performed on the same probing beam, as done at JET, making the interferometer–polarimeter a unique, reliable, and informative diagnostic. At ITER, it is expected to have different polarimeter-interferometer diagnostics, both toroidal and poloidal, and both for the study and the control of the plasma. The Thomson scattering analyses the scattering radiation of a probing beam. The scattered radiation intensity is directly proportional to the local electron density, while the scattered spectrum is dependent on the local electron temperature, because of the Doppler effect which occurs due to the interaction of the electromagnetic radiation with the moving electrons [18,19].
The design of these diagnostics is a crucial point of the building process of a tokamak since several factors must be considered. At first, since the interaction between the probing radiation and the plasma are strongly influenced by the plasma properties, it is important to simulate the effects at different plasma configuration and find the best setup which is optimised for all scenarios. For example, the laser wavelength of the polarimeter at JET is 195 µm, which is unusable for ITER or DEMO plasma scenarios [20,21,22]. Moreover, in the present tokamaks, the environment is not critical in terms of neutron and heat fluxes, as well as electromagnetic forces, while in the future tokamaks, these loads will be much higher and they will play an important role on the design of the diagnostics, since they may involve the degradation of the performances. The high neutron flux may change the optical properties of the mirrors, windows, and other optics, while the heat fluxes and the electromagnetic forces may vary the alignment, involving a decrease of the performances of the diagnostics [23,24,25]. Thus, a preventive effort to find more reliable and resilient solutions is fundamental to ensure the longest duration of the best performances. For these purposes, numerical simulations are decisive in finding the best diagnostic design. Given the various physics which need to be considered during the design of the diagnostics (optics, thermodynamics, neutrons, electromechanics, etc.), a numerical model able to easily implement multiphysics simulations will help in the development of the diagnostics of the future tokamaks.
This work aims to present the methodology implemented on the ray optics module of COMSOL Multiphysics to simulate three of the most important laser-based diagnostics in nuclear fusion reactors: interferometry, polarimetry, and Thomson scattering. The solutions presented and employed in COMSOL are general, and the same methods can be easily implemented in other ray optics models. The next section introduces the logic of COMSOL, and the equations used to simulate the various effects, while Section 3 analyses some numerical simulations with the aim to validate the logic implemented in the model. The validation will be performed by comparing the expected (or imposed value) with the measured one by the numerical simulation. At last, the most important issues and results are resumed in the last section.
2. Modelling
This section discusses the numerical models used to simulate the propagation of electromagnetic waves in a plasma. The numerical model has been implemented in COMSOL Multiphysics, a numerical simulation software which allows an easy interface of different physics. The model has been built over a standard COMSOL physics, the ray optics, and it has been implemented to take into account the propagation of electromagnetic properties in a thermonuclear plasma.
2.1. Ray Optics
The propagation of electromagnetic waves in a medium can be approached in two different ways, by the ray optics and the wave optics.
In the case of wave optics, or physical optics, the light propagates as a wave. Wave optics allows simulating, without modelling approximations, the exact propagation of electric and magnetic fields of light, and the major part of the optical phenomena, such as interference and diffraction, which normally cannot be simulated by geometrical optics. On the other hand, numerical models based on the wave optics are computationally demanding, since the maximum mesh element size must be comparable with the light wavelength. This issue limits the wave optics numerical simulations to applications with geometries that have sizes comparable with the light wavelength, making this approach unsuitable for thermonuclear diagnostics, where the ratio between the geometry size and the radiation wavelength (L/λ) is of the order of 107 for the TS, and a volumetric ratio (L/λ)3 of 1021 (considering only the vacuum vessel) [26].
Ray optics, also known as geometrical optics, describes the propagation of light as rays. The propagation of these rays is based on the reflection, refraction, and absorption equations. Ray optics is the common approach used to simulate the propagation of electromagnetic waves when the geometry size is orders of magnitude larger than the light wavelength, since the computational load required by the numerical simulation is much lower. However, without proper modelling, some physical effects, such as interference, diffraction and polarisation, cannot be simulated by ray optics [27].
The numerical model developed and presented in this work is based on a ray optics approach, where any effect due to wave propagation and interaction with the plasma is simulated as described in the following sections. The base model of ray optics simulates the propagation of the electromagnetic wave by solving the equations of the position (q) and wave vector (k) for each ray [27]:
where ω is the angular frequency of the light and the local speed of rays is defined by the speed of light (c) and the local refractive index of the medium (n), i.e., v = c/n. Thus, the propagation of the ray position and wave vector is directly simulated once the refractive index field and the light wavelength (or frequency) are known.
A magnetic plasma is birefringent and the refractive indexes of the “slow” (n1) and “fast” (n2) waves can be described by the Appleton–Hartree Equation (the collision term is neglected) [6,15,28] as follows:
where ωp is the plasma frequency and ωc is the electron cyclotron frequency:
And Ne is the electron density, e and me are the charge and mass of the electron, ε0 is the dielectric permittivity and B0 is the module of the magnetic field. F is calculated as:
And θ is the angle between the magnetic field and the light propagation direction.
In thermonuclear plasmas, the effect of magnetic field on the ray propagation can be neglected (to a first approximation) and the refractive index becomes [6]:
The ray optics model is based on the continuous interaction between the rays and the “environment”, i.e., the plasma, the vacuum, the air, the optics, etc. The ray properties are stored in a vector which evolves according with the propagation of the ray itself, while the environment properties are stored in the mesh of the numerical simulation. At the beginning of the simulation, the initial status of the ray at the time t0 is known and the successive instant is calculated numerically with a specific numerical scheme (such as the backward Euler method). The solution of the ray optics equations requires both properties belonging to the ray and to the environment (such as the refractive index). The ray properties, being stored in the ray vector, are known at each time step, while the environment properties are calculated through the position of the ray at each time step.
The numerical simulations in COMSOL are principally divided into parameters, variables, geometry, domains, boundaries, physics and materials. The parameters are the constants of the simulation, which do not change during the simulation while the variables are solved during the numerical simulations at each time step. The geometry is used to design the environment, and it can be divided into domains. Each domain may have unique characteristics, such as plasma, air, vacuum, etc. The boundaries are used to simulate discontinuities, such as a wall, mirror, material change, etc. The physics defines the model equations and different physics can be used together for multiphysics purposes. For example, the mechanical deformation of a mirror due to a heat load on the structure can be simulated, and the variation of the ray reflection can be simulated as well, using mechanical, thermal and geometrical optics physics. Materials are used as libraries of material properties which can be assigned to the domains.
2.2. Interferometry
The interferometer is based on measuring the refractive index of the plasma by probing it through a laser beam. The phase of the electric field of the beam is [6]:
and by comparing it with the phase of a reference beam, the phase shift can be directly linked with the plasma electron density [6]:
where Nc is called the cut-off density, defined as . When Ne is much smaller than Nc, and after taking into account the series development of the binomial, the equation can be approximated as [6]:
If the electron density is larger than the cut-off density, the probing beam is strongly absorbed by the plasma and the interferometer ceases to work (n2 is negative, thus n is imaginary).
In a wave optics approach, the base equations of the model would automatically compute the phase shift, while in the ray optics model, the phase shift must be modelled. In our model, an auxiliary variable, called ϕ, which computes the phase of each ray has been introduced. This variable is computed using Equation (8), where the refractive index of the plasma has been written as Equation (9). Thus, for any time instant ti, the position of the ray is x’, y’ and z’ in the laboratory frame of the reference are known and the refractive index of the propagation medium (plasma, air, vacuum, glass, etc.) is calculated. The integration of Equation (8) is performed considering that dz is vdt, where dt is the time step.
2.3. Polarimetry
While the presence of the magnetic field can be neglected to evaluate the propagation of the ray, it is important for the evolution of the polarisation of the electromagnetic wave. In fact, the presence of the two refractive indexes, even if similar, changes the polarisation of the beam crossing the plasma. Plasma polarimetry is based on measuring the change of the polarisation to obtain some integral parameters directly correlated with the electron density and the magnetic field.
The Stokes notation has been used to model the polarisation variation in plasma [15,29]. The reduced Stokes vector has three components that are directly correlated to four polarisation angles: the phase shift ϕ, the electric field component ratio tan(α), the ellipticity tan(χ) and the ellipse orientation ψ, as follows [15]:
The evolution of the Stokes vector in a magnetised plasma can be evaluated by the following differential vector equation [15]:
The vector Ω takes into account the properties of the plasma and magnetic field [15]:
where Bp is the component of the magnetic field along the beam propagation direction, while Bx and By are the orthogonal components, the constant C1 is 2.45 × 10⁻¹¹ and C3 is 5.26 × 10⁻¹³ [15].
The Faraday rotation (Δψ) and the Cotton–Mouton phase shift (Δϕ) can be directly correlated to the line integral of the electron density and magnetic field. The most common approximation, known as type 1, links the polarisation effects with the plasma parameters as follows [17]:
The propagation of the Stokes vector in the model has been considered by means of three new auxiliary variables, one for each reduced Stokes component (s1, s2 and s3), using Equation (12). Attention must be paid to the reference frame used to describe the Stokes vector and the magnetic field. In nuclear fusion plasmas, the magnetic field is usually given in terms of a toroidal field (Bt), radial field (Br) and vertical field (Bz), where r is the horizontal direction and z is the vertical direction on the poloidal section, while the Stokes propagation, described by Equation (12), is written in the reference frame of the probing beam. The direction of propagation of each beam is described by its unit vector as:
One of the two orthogonal unit vectors, defined as the “x” direction, is calculated as , which is always orthogonal to the np unit vector. The last vector, which describes the “y” direction, is calculated by the cross-product between np and nx. Thus, the magnetic field is rotated from the reference frame of the reactor to the reference frame of the electromagnetic wave. Given the magnetic field on the reference frame of the electromagnetic wave, the electron density field and the laser wavelength, the Ω is calculated. The reduced Stokes auxiliary variables are calculated by an explicit backward Euler numerical scheme:
2.4. Thomson Scattering (TS)
Thomson scattering consists in measuring the scattered radiation of a laser beam. The electromagnetic wave, interacting with the charged particles, forces them to oscillate accordingly to the electromagnetic field, causing the emission of radiation at the same frequency of the incident wave. The thermal motion of an electron in a thermonuclear plasma makes the scattered spectrum broader than the incident radiation spectrum due to the Doppler effect. Moreover, due to the relativistic aberration (or headlight effect), the spectrum is blue shifted.
The spectral power, Ps (R, ωs), of the Thomson scattering radiation due to electrons can be written as follows [19]:
where ωs is the frequency of the scattered radiation, Pi is the power of the incident radiation, r0 is the classical radius of the electron, L is a typical length associated with the scattering volume, Ne is the electron density, dΩ is the scattering solid angle, ω is the difference between the scattered and the incident radiation frequencies, s is the unit vector of the scattered radiation direction, Ei0 is the electric field vector of the incident wavelength, and k is equal to 2kisin(θ/2), where ki is the wavenumber of the incident wavelength and θ is the scattering angle. The variable a is the mode velocity of the electrons in the scattering volume, defined as a = (2kbTe/me)1/2, where kb is the Boltzmann constant, Te is the electron density and me is the electron rest mass. In practical application, the scattering spectrum is usually written in terms of radiation wavelength, using the scattered wavelength λs and incident wavelength λi, with Δλ = λs − λi. Equation (18), for probing a beam linearly polarised at φ = 0, becomes [19]:
The corr variable is used to consider the effect of the relativistic aberration. The complete correction, describe by Matoba et al. [29], can be written as:
The numerical simulation of Thomson scattering is based on performing two steps. The first step simulates the propagation of the incident radiation while the second step simulates the scattered one. In the first step, four different accumulated variables are computed. These variables are the output of the first step and the input of the second step, allowing to determine all the characteristics of the scattered radiation. From Equation (19), it can be observed that the scattered spectrum is a function of the incident power, wavelength and scattering angle. The incident wavelength is defined as an input of the model. Three accumulated variables measure respectively the t, r and z directions (reference frame of the tokamak). The fourth accumulated variable measures the number of rays which crosses the mesh element (and thus the amount of incident power).
The second simulation releases the rays from the scattering volume with properties which are defined by the local properties of the plasma, the accumulated variables of the first simulation and the direction of the released rays. In order to have a spectral measurement, it is needed to use several rays at different wavelengths. Given a chosen wavelength, and the elements of the solid angle, a ray has the average power contained in these bins:
where the index i defines the i-th direction and the index j the j-th wavelength element. A small number of the elements does not involve errors that are very large. Consider that in tokamaks the spectrum measurements are performed by a limited amount of spectral channels (from 3 to 5) and the temperature fit is obtained with a very small spectral resolution [18].
In practical applications, the electron temperature is calculated by fitting the spectrum data with the theoretical curves at different temperature and the best fit selects the temperature measured. Moreover, by measuring the total scattered intensities, it is possible to measure the local electron density, being known the scattering cross-section of one electron. However, because of the effect of optics, which may have a propagation spectrum that is not perfectly wide, the TS effect is usually calibrated [30].
The scattered radiation also has a change of polarization with respect to the input polarisation. This effect is strictly proportional to plasma temperature and a polarimetric TS could be used to measure the electron temperature of the plasma. However, the depolarisation of the TS radiation is a relativistic effect and it has not yet been implemented, since the temperature of the plasma obtained in present Tokamaks (relativistic depolarisation becomes interesting for electron temperatures higher than 15 keV.) The polarisation of the scattered radiation has been modelled considering the relativistic effects described in the literature [31,32,33,34]. Given the incident Stokes vector (Sin) and the plasma TS Mueller matrix (MTS), the scattered Stokes vector is [34]:
where the TS Mueller matrix is defined as [34]:
where , and , where K1 and K2 are the modified Bessel functions of the second kind. The definition of the scattered Stokes vector needs the accumulation of three other variables from the first step: the Stokes vector components (Sin,0 is the total energy, yet calculated from the ray density). Please note that this is the frequency integrated Mueller matrix, which does not take into account the different polarisations at different wavelengths. This problem could be solved just using the frequency-resolved Mueller matrix [33]. However, theoretical studies showed that, for wavelength relevant for nuclear fusion, the polarisation difference is very small and completely negligible for the measurement purposes. Once the incident Stokes vector and the local properties of the plasma are known, the scattered Stokes vector is calculated accordingly with Equation (22). The propagation of the polarisation vector is computed through the model in Section 2.3.
2.5. Interactions with the Boundaries and Other Elements
The interaction of the ray with boundaries is governed by specific equations which depend on the type of boundaries. The most common and relevant for this work are walls, material discontinuities, mirrors, inlets and ray detectors. Walls have different possibilities. The ray may freeze, stick, disappear, have a specular reflection, have a diffuse scattering, pass through, etc. The disappear function is used to remove from the simulation the rays which touch the walls. The freeze function retains the ray position and direction (since they no longer change over time), while stick retains the ray position but resets all other variables to zero. The other wall functions are general cases of the following more specific boundary conditions. Material discontinuities are used to simulate Snell’s law when a ray passes from one material to another. In this case, it is possible to require that both the refracted and reflected rays are generated (the incident ray becomes the refracted while the reflected is a new ray, called secondary). Mirrors specularly reflect the rays at the boundary. Inlets allow releasing rays with different properties. It is possible to set any ray feature, such as release time, the number of rays, initial direction, ray frequency and wavelength, initial phase, initial intensity and polarisation, and the initial values of the auxiliary variables. The ray detector returns a Boolean variable which describes if the ray has reached the ray detector, mostly used for post-processing. The boundary condition which involves a continuation of the ray propagation, such as material discontinuities and mirrors, allows defining the value of auxiliary variables after the interaction with the boundary condition. For example, the reduced Stokes vector components after the interaction with a mirror are defined by the incident Stokes vector components and the Mueller matrix of the mirror.
3. Validation on a Case Study
The models described in the previous section are used here in a simple case, to demonstrate the functioning and validate the model by comparing the model results with the expected ones. Three different numerical simulations have been performed, one for diagnostics.
3.1. Geometry, Domain, Boundary Conditions and Mesh
The geometry of the numerical simulations consists of an ITER-like vessel. The major radius of the Tokamak is 6.2 m, while the minor radius is 2 m [35]. The internal vessel has been built according to the poloidal section of ITER, while the external structure has been placed just to represent a solid approach and it does not play any role in the numerical simulation. The geometry of the numerical simulation is shown in Figure 1.
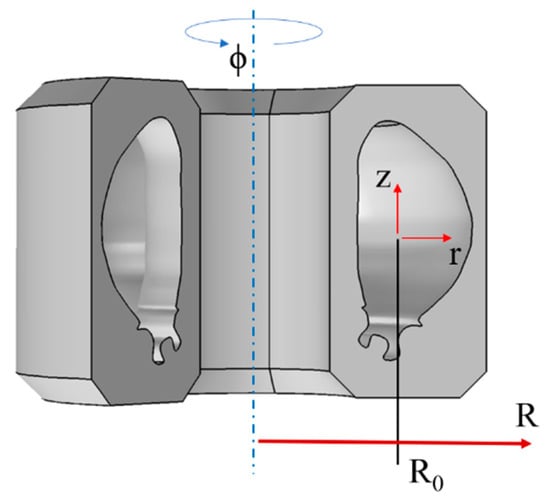
Figure 1.
Geometry schematics of the numerical simulation.
The plasma used for the numerical simulation has been built applying a circular equilibrium type, widely used in the literature for the investigation of polarimetry performances. The electron density and temperature of the plasma have a parabolic profile. Defined by the dimensionless minor radius , where r is the minor radius coordinate and a is the minor radius of the plasma, the electron density can be written as and the electron density is , where N0 is the electron density on the magnetic axis of the plasma. The toroidal field, defined by its value B0 on the major radius R0, has the form . The profile of the plasma current density has a parabolic profile as well and it is calculated from the plasma current (Ip) as . The poloidal field is calculated from the integration of the current density and it is . Then, the refractive index field is computed (see Section 2, Equation (7)). Figure 2 shows the field of the electron density, toroidal and poloidal magnetic field, and of the differential refractive index, defined as the vacuum refractive index minus the plasma refractive index.
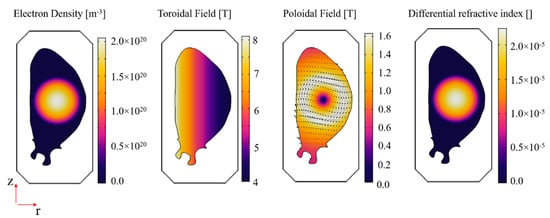
Figure 2.
Property field of the plasma used for the numerical simulation.
3.2. Interferometer Simulations
The numerical simulations of the interferometer have been performed by placing three vertical lines of sight, as shown in Figure 3. Three lasers emit beams with a wavelength of 20 μm and each laser emits 100 rays. Each beam interacts with a 50–50 beam-splitter. Thus, half of the rays are reflected, while the others are transmitted. The transmitted rays interact with the mirrors on the top of the tokamak and enter in the vessel, probe the plasma, exit from the vessel and are reflected by the mirrors placed below the vessel. Then, they pass through the beam mixers and are collected by the detectors. The reflected rays from the beam-splitters represent the “reference” beams, used to measure the differential phase. They are reflected by the mixers and collected by the detectors.
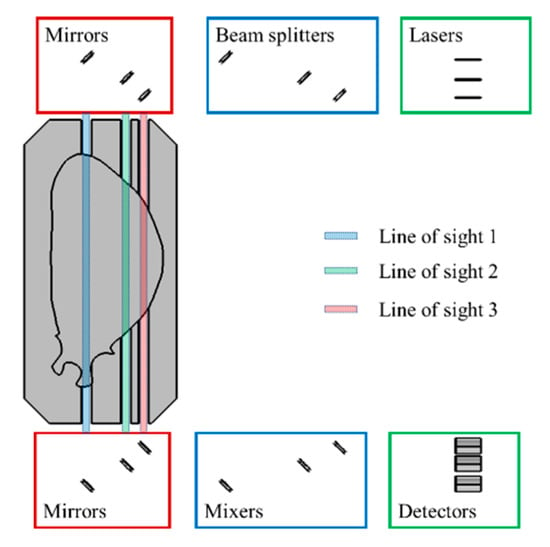
Figure 3.
Interferometer simulation geometry.
Nine numerical simulations were performed changing the electron density to simulate different plasma conditions, from the absence of the plasma to the flat top condition. The electron density (N0) goes from 0 to 2 × 10²⁰ m−3. Figure 4 shows the results of the numerical simulations. The figure on the left represents the ray trajectories from the laser to the detector, where the ray colour shows the calculated phase according to Equation (8). Since the “reference” and the “plasma” beams run different distances, the interferometer must be calibrated in the absence of plasma (numerical simulation number 1). Thus, knowing the phase difference in the absence of plasma, the phase difference due to the plasma is calculated and the electron density as well, from Equation (10). The figure on the right-top represents the calibrated differential phase for all lines of sight, where the phase for N0 = 0 m−3 has been placed equal to zero (calibration). The figure located at the right-bottom shows the true electron density, calculated as the integral on the line of sight of the electron density field, and the electron density calculated by the interferometer, through the phase difference. The comparison clearly shows that the methodologies implemented to model the interferometer in COMSOL work properly.
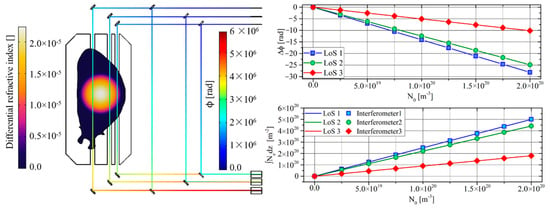
Figure 4.
Interferometer results.
3.3. Polarimeter Simulations
Analogue numerical simulations were performed to test the polarimeter model, where the plasma current scales accordingly to the electron density. The geometry is similar to the interferometer one, where the reference beam is not needed. The three lasers emit beams with a wavelength of 20 μm, and each beam is reflected by a 45° mirror. Then, they cross a linear polariser (Figure 5) which sets the polarisation of the probing beam (in the numerical simulation, a linear polarisation with 45° has been used, since this configuration maximizes the accuracy and the amount of information which can be extracted from the polarimeter, as discussed in the literature [36]). The rays then cross the plasma and their polarisation changes accordingly with Equation (17). The effect of the mirror and linear polariser on the polarisation of the ray are considered implementing the Mueller matrix of each component on the numerical simulation. The left plot of Figure 5 shows the ray trajectories, while the colour of the ray represents the local Cotton–Mouton phase shift. Note that the influences of the mirrors are not represented in the figure, in order to highlight the plasma effect, while for the proper calculation of the plasma parameters from the polarimeter, a calculation of the Mueller matrix (or Jones matrix and others) of the optics must be performed to ensure accurate results. For example, the polarimeter of JET performs a polarisation calibration in the absence of plasma before each plasma discharge. In these numerical simulations, the effects of the optics are calibrated with the first numerical simulation, when there is no plasma.
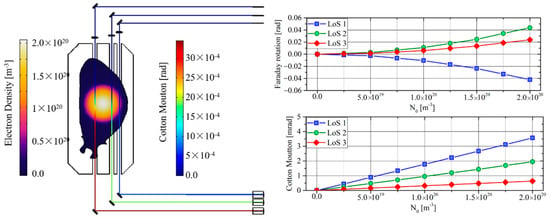
Figure 5.
Polarimeter results.
The graphs on the right-top and right-bottom show, respectively, the Faraday rotation and the Cotton–Mouton phase shift performed on the nine numerical simulations. The Faraday rotation of the line of sight 1 and 2 are both positive, being the magnetic field along the propagation direction concordant with the light propagation direction, while the line of sight 3 has a negative rotation. Moreover, the Faraday increase is parabolic since it is composed like the product of the electron density and poloidal magnetic field. Contrariwise, the Cotton–Mouton phase shift is positive and increases linearly in each line of sight since it is dominated by the Ω1 term, which is proportional to the electron density and the toroidal field (the poloidal field influence is negligible in this configuration).
Validation of the Stokes model can be performed by measuring the line integral of the electron density with the Cotton–Mouton phase shift, by using the type 1 approximation shown in Equation (15). Figure 6 shows the results of this comparison, also demonstrating that the polarisation model works properly. Contrariwise, the Faraday rotation also is proportional to the poloidal field (along the propagation direction), making the direct measurement of the electron density difficult. However, being that the Cotton–Mouton and the Faraday rotation are linked by the system of Equation (17), a validation on the Cotton–Mouton directly involves the proper propagation of the Faraday rotation.
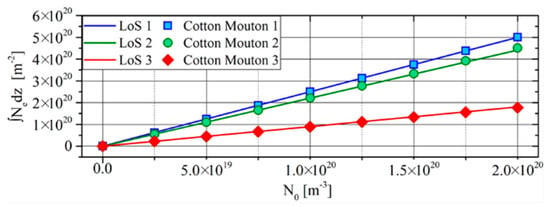
Figure 6.
Validation of the Cotton–Mouton phase shift by comparing the electron density line integral with the CM electron density.
3.4. Thomson Scattering Simulations
The numerical simulations to validate the Thomson scattering model were performed changing the geometry according to Figure 7. The light beam, generated by the laser, crosses the plasma. The laser wavelength is 1064 nm, while the peak power is 5 × 10⁸ W (note that the TS diagnostic requires a pulsed laser with high peak power). Four different scattering volumes were placed along the direction of the laser beam and accumulate the variables needed for the scattering simulation. For each wavelength, the scattering volumes release rays with a specific solid angle aperture. The rays cross the plasma, exit the vacuum vessel, interact with the spherical mirror on the top of the tokamak and the rays are collected by the spectrometers, one for each scattering volume.
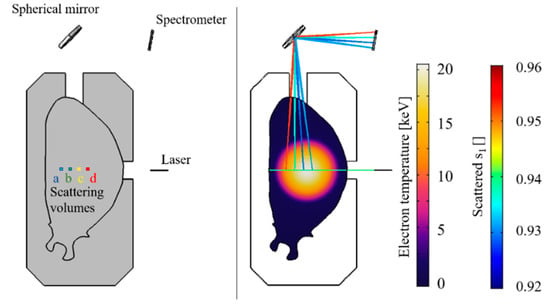
Figure 7.
Thomson scattering geometry (left); Electron temperatures, ray trajectories of the primary beam (green) and scattered radiation with the first scattered reduced Stokes component ssc,1 (right).
The numerical simulations were conducted changing the N0, T0 and Ip. The density goes from 0 to 20 × 1020 m−3, the electron temperature from 0 to 20 keV and the plasma current from 0 to 15 MA. Figure 8 compares the expected and the simulated spectral density (defined as spectral power divided by the total power, considering the wavelength step equal to 50 nm). For each channel, four different spectra are reported using 0.25, 0.5, 0.75 and 1 times the maximum values of electron density, electron temperature and plasma current. The simulated spectra are perfectly overlapped to the expected spectra at the temperature of each scattering volume, showing that the model works properly.
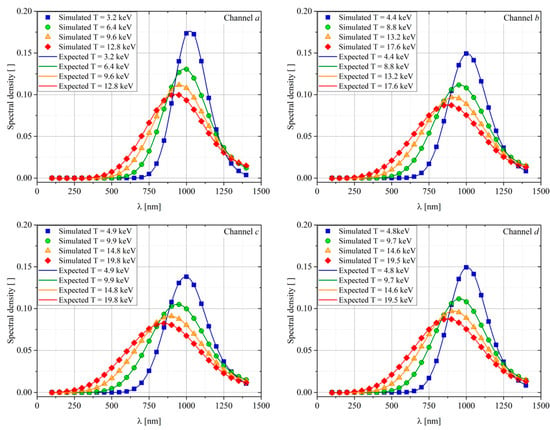
Figure 8.
Thomson scattering expected and simulated adimensional spectra of the four channels as a function of the temperature.
Regarding the polarimetric Thomson scattering, the analyses were performed on the same scattering volumes with the same electron, temperature, plasma current and magnetic field. The reduced Stokes vector of the laser beam was placed equal to [1, 0, 0] (linear polarisation with an angle at 0°), which is the polarisation normally used in TS diagnostics. In Figure 7, the colour of the ray trajectories shows the first component of the scattered Stokes vector, which decreases as a function of the local temperature. The measurement of the temperature through the polarimetric TS can be performed by using Equation (22). In the specific case of the numerical simulation, it can be demonstrated that the following equation is valid:
Thus, knowing the scattering angle and measuring the first component of the scattered Stokes vector, the temperature can be directly measured. Figure 9 (left) shows the first component of the reduced Stokes vector of the scattered light for the four channels as a function of the electron temperature. Note that the points do not lie on the same line because of the different scattering angle. The other two Stokes components are not shown since they are equal to zero (as expected when the input polarisation has a Stokes vector equal to [1, 0, 0]). Figure 9 (right) shows the expected electron temperature vs. the “measured” temperature by Equation (24) using the first component of the reduced Stokes vector. Even in this case, the measured temperature coincides with the expected one, validating the proper functioning of the simulation.
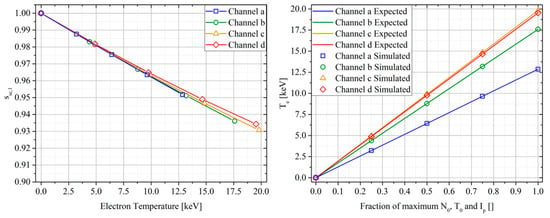
Figure 9.
The first component of the reduced scattered Stokes vector as a function of the electron temperature on the four scattering volumes (left) and expected vs. simulated electron temperature for each channel at each numerical simulation (right).
4. Conclusions
The simulation of diagnostics is a fundamental step in the design process of tokamaks, in order to ensure that the best performances are obtained, and that the degradation due to electromechanical, thermal and nuclear effects is the most limited as possible. These simulations require the use of multiphysics models which can take into account all the effects of degradation and misalignment.
In this work, the modelling of interferometry, polarimetry and Thomson scattering effects have been introduced and implemented on the ray optics module of COMSOL multiphysics. COMSOL was chosen since it allows a very easy interface of the various modules (thermal, mechanics, electromagnetic, etc.), reducing the efforts required to run a multiphysics simulation. However, all the models can be implemented on other platforms.
The validation of the models has been performed by comparing the expected value with the simulated one. All the effects implemented in the model have been tested in an ITER-like geometry, using a simple circular plasma model (which does not affect the functioning and the validation of the model) with properties comparable with the ones expected in ITER. In the case of the interferometry, three lines of sight have been used. The phase differences between the probing beams and the reference beams, and thus the line integrated electron densities, were calculated. They were compared with the line integral of the electron density of each line of sight, and it was shown that the data are overlapped. In the case of plasma polarimetry, the same probing beams of the interferometer were used, and the simulated Faraday rotation and Cotton–Mouton phase shift were calculated. Then, the line integral density was been calculated using the type 1 approximation of the Cotton–Mouton phase shift. This value was been compared with both the expected and the interferometer quantities, showing perfect accordance and also validating the polarimetric model. The spectral Thomson scattering, since it provides local information, was validated by just comparing simulated spectrum with the expected one, calculated from the local values, while the polarimetric TS was validated calculating the electron temperature from the simulated depolarisation of the scattered radiation and by comparing it with the temperature of the scattering volumes.
This work aimed to analyse the possibility to accurately simulate the optical laser-based diagnostics of thermonuclear plasma and to describe how the model can be implemented in a ray optics code. The validation section clearly shows that the phenomena can be simulated with no errors (between the expected or imposed and the simulated values). In the future, these models may be used to design, test and evaluate the performances of nuclear reactor diagnostics in several conditions, helping in understanding the best setup of the instruments to ensure the best performances and their longest lifetime.
Author Contributions
Conceptualization, R.R. and P.G.; methodology, L.S., I.W. and R.R.; software, L.S. and I.W.; validation, L.S. and I.W.; investigation, L.S., I.W. and R.R.; writing—original draft preparation, R.R.; writing—review and editing, L.S., I.W. and P.G.; supervision, R.R. and P.G.; project administration, P.G.; funding acquisition, P.G. All authors have read and agreed to the published version of the manuscript.
Funding
This research received no external funding.
Informed Consent Statement
Not applicable.
Data Availability Statement
Data sharing not applicable.
Conflicts of Interest
The authors declare no conflict of interest.
References
- Wesson, J. Tokamaks; Claredon Press: Oxford, UK, 2004. [Google Scholar]
- Igochine, V. Active Control of Magneto-Hydrodynamic Instabilities in Hot Plasmas; Springer: Berlin/Heidelberg, Germany, 2015. [Google Scholar]
- Gelfusa, M.; Murari, A.; Lupelli, I.; Hawkes, N.; Gaudio, P.; Baruzzo, M.; Brix, M.; Craciunescu, T.; Drozdov, V.; Meigs, A.; et al. Influence of plasma diagnostics and constraints on the quality of equilibrium. Rev. Sci. Instrum. 2013, 84, 103508. [Google Scholar] [CrossRef]
- Murari, A.; Angelone, M.; Bonheure, G.; Cecil, E.; Craciunescu, T.; Darrow, D.; Edlington, T.; Ericsson, G.; Gatu-Johnson, M.; Gorini, G.; et al. New developments in the diagnostics for the fusion products on JET in preparation for ITER. Rev. Sci. Instrum. 2010, 81, 10E136. [Google Scholar] [CrossRef] [PubMed]
- Rigamonti, D.; Giacomelli, L.; Gorini, G.; Nocente, M.; Rebai, M.; Tardocchi, M.; Angelone, M.; Batistoni, P.; Cufar, A.; Ghani, Z.; et al. Neutron spectroscopy measurements of 14 MeV neutrons at unprecedented energy resolution and implications for deuterium-tritium fusion plasma diagnostics. Meas. Sci. Technol. 2018, 29, 045502. [Google Scholar] [CrossRef]
- Hutchinson, I.H. Principle of Plasma Diagnostics; Cambridge University Press: Cambridge, UK, 1987. [Google Scholar]
- Barth, C.J.; Donné, A.J. Laser-aided plasma disagnostics. Fusion Sci. Technol. 2004, 45, 407–417. [Google Scholar] [CrossRef]
- Huber, A.; McCormick, K.; Andrew, P.; de Baar, M.R.; Beaumont, P.; Dalley, S.; Fink, J.; Fuchs, J.C.; Fullard, K.; Fundamenski, W.; et al. Improved radiation measurements on JET—First results from an upgraded bolometer system. J. Nucl. Mater. 2007, 363, 365–370. [Google Scholar] [CrossRef]
- Craciunescu, T.; Peluso, E.; Murari, A.; Gelfusa, M.; Contributors, J.E.T. Maximum likelihood bolometric tomography for the determination of the uncertainties in the radiation emission on JET TOKAMAK. Rev. Sci. Instrum. 2018, 89, 053504. [Google Scholar] [CrossRef]
- Peluso, E.; Craciunescu, T.; Murari, A.; Carvalho, P.; Gelfusa, M.; Contributors, J.E.T. A comprehensive study of the uncertainties in bolometric tomography on JET using the maximum likelihood method. Rev. Sci. Instrum. 2019, 90, 123502. [Google Scholar] [CrossRef]
- Peluso, E.; Craciunescu, T.; Gelfusa, M.; Murari, A.; Carvalho, P.J.; Gaudio, P.; Contributors, J.E.T. On the effects of missing chords and systematic errors on a new tomographic method for JET bolometry. Fusion Eng. Des. 2019, 146, 2124–2129. [Google Scholar] [CrossRef]
- Orsitto, F.P.; Villari, R.; Moro, F.; Todd, T.N.; Lilley, S.; Jenkins, I.; Felton, R.; Biel, W.; Silva, A.; Scholz, M.; et al. Diagnostics and control for the steady state and pulsed tokamak DEMO. Nucl. Fusion 2016, 56, 026009. [Google Scholar] [CrossRef]
- Button, K.J. Infrared and Millimeter Waves; Academic Press: New York, NY, USA, 1979. [Google Scholar]
- Van Zeeland, M.A.; Carlstrom, T.N.; Finkenthal, D.K.; Boivin, R.L.; Colio, A.; Du, D.; Gattuso, A.; Glass, F.; Muscatello, C.M.; O’Neill, R.; et al. Tests of a two-color interferometer and polarimeter for ITER density measurements. Plasma Phys. Control Fusion 2017, 59, 125005. [Google Scholar] [CrossRef]
- Segre, S.E. A review of plasma polarimetry—Theory and methods. Plasma Phys. Control Fusion 1999, 41, R57. [Google Scholar] [CrossRef]
- Orsitto, F.P.; Boboc, A.; Gaudio, P.; Gelfusa, M.; Giovannozzi, E.; Mazzotta, C.; Murari, A.; Contributors, J.E.T. Analysis of Faraday rotation in JET polarimetric measurements. Plasma Phys. Control Fusion 2011, 53, 035001. [Google Scholar] [CrossRef][Green Version]
- Boboc, A.; Gelfusa, M.; Murari, A.; Gaudio, P.; Contributors, J.E.T. Recent developments of the JET far-infrared interferometer-polarimeter diagnostic. Rev. Sci. Instrum. 2010, 81, 10D538. [Google Scholar] [CrossRef]
- Pasqualotto, R.; Nielsen, P.; Gowers, C.; Beurskens, M.; Kempenaars, M.; Carlstrom, T.; Johnson, D.; Contributors, J.E.T. High resolution Thomson scattering for Joint European Torus (JET). Rev. Sci. Instrum. 2004, 75, 3891–3893. [Google Scholar] [CrossRef]
- Froula, D.H.; Glenzer, S.H.; Luhmann, N.C., Jr.; Sheffield, J. Plasma Scattering of Electromagnetic Radiation: Theory and Measurement Techniques; Oxford Academic Press: Cambridge, MA, USA, 2011. [Google Scholar]
- Donné, A.J.H.; Graswinckel, M.F.; Cavinato, M.; Giudicotti, L.; Zilli, E.; Gil, C.; Koslowski, H.R.; McCarthy, P.; Nyhan, C.; Prunty, S.; et al. Poloidal polarimeter for current density measurements in ITER. Rev. Sci. Instrum. 2004, 75, 4694–4701. [Google Scholar]
- Costley, A.E.; Sugie, T.; Vayakis, G.; Walker, C.I. Technological challenges of ITER diagnostics. Fusion Eng. Des. 2005, 74, 109–119. [Google Scholar] [CrossRef]
- Walsh, M.; Andrew, P.; Barnsley, R.; Bertalot, L.; Boivin, R.; Bora, D.; Bouhamou, R.; Ciattaglia, S.; Costley, A.E.; Counsell, G.; et al. ITER diagnostic challenges. In Proceedings of the 24th Symposium of Fusion Engineering, Chicago, IL, USA, 26–30 June 2011. [Google Scholar]
- Biel, W.; Albanese, R.; Ambrosino, R.; Ariola, M.; Berkel, M.V.; Bolshakova, I.; Brunner, K.J.; Cavazzana, R.; Cecconello, M.; Conroy, S.; et al. Diagnostics for plasma control—From ITER to DEMO. Fusion Eng. Des. 2019, 146, 465–472. [Google Scholar] [CrossRef]
- Donné, A.J.; Costley, A.E.; Morris, A.W. Diagnostics for plasma control on DEMO: Challenges of implementation. Nucl. Fusion 2012, 52, 074015. [Google Scholar] [CrossRef]
- Litnovsky, A.; Voitsenya, V.S.; Reichle, R.; Walsh, M.; Razdobarin, A.; Dmitriev, A.; Babinov, N.; Marot, L.; Moser, L.; Yan, R.; et al. Diagnostic mirrors for ITER: Research in the frame of International Tokamak Physics Activity. Nucl. Fusion 2019, 59, 066029. [Google Scholar] [CrossRef]
- Petykiewicz, J. Wave Optics; Springer: The Netherlands, 1991. [Google Scholar]
- Mouroulis, P.; Macdonald, J. Macdonald, Geometrical Optics and Optical Design; Oxford University Press: New York, NY, USA, 1997. [Google Scholar]
- Bittencourt, J.A. Pundamental of Plasma Physics; Springer: New York, NY, USA, 2004. [Google Scholar]
- Gaudio, P.; Gelfusa, M.; Murari, A.; Conetta, F.; Orsitto, F.P.; Boboc, A. Analysis of JET Polarimeter With a Propagation Code Based on the Stokes Formalism. IEEE Trans. Plasma Sci. 2013, 41, 1575–1586. [Google Scholar] [CrossRef]
- LeBlanc, B.P. Thomson scattering density calibration by Rayleigh and rotational Raman scattering on NSTX. Rev. Sci. Instrum. 2008, 79, 10E737. [Google Scholar] [CrossRef] [PubMed]
- Matoba, T.; Itagaki, T.; Yamauchi, T.; Funahashi, A. Analytical Approximation in the Theory of Relativistic Thomson Scattering for High Temperature Plasma. Jpn. J. Appl. Phys. 1979, 18, 1127–1133. [Google Scholar] [CrossRef]
- Parke, E.; Mirnov, V.V.; Den Hartog, D.J. A polarization-based Thomson scattering technique. J. Instrum. 2013, 9, C02030. [Google Scholar] [CrossRef]
- Mirnov, V.V.; Den Hartog, D.J.; Parke, E. Exact relativistic expressions for polarization of incoherent Thomson scattering. Phys. Plasmas 2016, 23, 052108. [Google Scholar] [CrossRef]
- Mirnov, V.V.; Den Hartog, D.J. Polarization of incoherent Thomson scattering for electron temperature measurement. Plasma Phys. Control Fusion 2017, 59, 063001. [Google Scholar] [CrossRef]
- ITER—The Way to New Energy. Available online: https://www.iter.org (accessed on 19 December 2020).
- Rossi, R.; Orsitto, F.P.; Spolladore, L.; Wyss, I.; Gaudio, P. On the interpretability and uncertainty propagation of polarimetric measurements in thermonuclear plasmas as a function of the input polarisation and laser wavelength. Plasma Phys. Control Fusion 2020, 62, 105019. [Google Scholar] [CrossRef]
Publisher’s Note: MDPI stays neutral with regard to jurisdictional claims in published maps and institutional affiliations. |
© 2021 by the authors. Licensee MDPI, Basel, Switzerland. This article is an open access article distributed under the terms and conditions of the Creative Commons Attribution (CC BY) license (http://creativecommons.org/licenses/by/4.0/).