Featured Application
Automatic speech recognition; chatbot; voice-assisted control; multimodal man-machine interaction systems.
Abstract
Speech recognition consists of converting input sound into a sequence of phonemes, then finding text for the input using language models. Therefore, phoneme classification performance is a critical factor for the successful implementation of a speech recognition system. However, correctly distinguishing phonemes with similar characteristics is still a challenging problem even for state-of-the-art classification methods, and the classification errors are hard to be recovered in the subsequent language processing steps. This paper proposes a hierarchical phoneme clustering method to exploit more suitable recognition models to different phonemes. The phonemes of the TIMIT database are carefully analyzed using a confusion matrix from a baseline speech recognition model. Using automatic phoneme clustering results, a set of phoneme classification models optimized for the generated phoneme groups is constructed and integrated into a hierarchical phoneme classification method. According to the results of a number of phoneme classification experiments, the proposed hierarchical phoneme group models improved performance over the baseline by 3%, 2.1%, 6.0%, and 2.2% for fricative, affricate, stop, and nasal sounds, respectively. The average accuracy was 69.5% and 71.7% for the baseline and proposed hierarchical models, showing a 2.2% overall improvement.
1. Introduction
These days, automatic speech recognition (ASR) performance has improved greatly by using deep neural networks [1,2,3,4,5]. Since speech is a time series, recurrent neural networks (RNNs) are mostly adopted for speech recognition [6,7,8], but there have been several attempts to apply a convolution neural network (CNN) as well [9,10]. In most ASR systems, speech is first converted to a sequence of phonemes, which is then translated to a word sequence using lexical models and language models generate meaningful sentences from the word sequence. Therefore, in ASR, the correct prediction of phonemes is the most critical factor because the errors in the earlier stage cannot be recovered in the final text.
Phonetically, the phonemes are distinguished according to the variations in pronunciation and vocalization. However, most speech recognition methods do not actively consider different characteristics of phonemes, such as end-to-end speech recognition methods [11,12,13,14,15,16]. Phonemes with similar characteristics are often confused and hard to distinguish, and they degrade the overall phoneme classification performance. Choosing feature extraction methods and acoustic model types appropriately for confusing phonemes can help improve the final sentence recognition performance. We propose a novel method of applying phoneme-specific acoustic models for automatic speech recognition by a hierarchical phoneme classification framework.
The hierarchical phoneme classification is composed of a single, baseline phoneme classifier, clustering into similar groups and final result generation using retrained group-specific models. First, we analyze the result of a general phoneme classifier based on long short-term memory (LSTM) [17]. In the next stage, we proceed clustering the confusing phonemes using a confusion matrix to group phonemes with similar characteristics. Then the phoneme groups are analyzed to find the characteristics that are common inside and different across the groups. Consonants and vowels are distinguished well and the length of consonants is usually shorter. In the proposed method, various lengths for the analysis frame are compared and the best one is chosen according to the phoneme recognition accuracy. In addition, there are several pairs of different consonants that differ by being voiced or unvoiced. For example, ‘d’ and ‘t’ sounds in different words ‘dean’ and ‘teen’, respectively, or ‘b’ and ‘p’ sounds in ‘bad’ and ‘pad’. Those consonants can be distinguished by the existence of the glottal pulse that occurs at periodic time intervals [18,19,20], and we use autocorrelation functions to add the periodicity feature of the phoneme sound if the found phoneme falls into consonant categories. The proposed hierarchical framework uses group-specific models with different features for different phoneme groups, trained by separate training data for each phoneme group.
The rest of the paper is organized as follows: Section 2 describes the phoneme clustering process from the confusion matrix of the baseline phoneme classification model and shows the resultant phoneme groups by the clustering. Section 3 explains a hierarchical phoneme classification model that adds a phoneme group model to the baseline phoneme classification and evaluate its performance. In Section 4, the evaluation results of the proposed method on phoneme recognition for the TIMIT dataset are given.
2. Phoneme Clustering
This section describes the basic definition of phonemes, particularly in English, the phoneme classes used in this paper, and the baseline phoneme classification method using RNN. Then the pairwise misclassification rates between all the pairs of the phonemes are obtained to build a confusion matrix, and phoneme clustering results are obtained by grouping phonemes so that the phonemes within the group should be more confused than the phonemes between the groups. The phoneme clustering results are used in building the proposed hierarchical classifier in Section 3.
2.1. Phonemes
Phonemes are the set of units representing the distinctive sounds of a spoken language. In most languages, there are about 20 to 60 units. In this paper, we adopt ARPAbet [21], developed by the Advanced Research Projects Agency (ARPA), which exploits standard English alphabet symbols to represent IPA (International Phonetic Alphabet) symbols [22]. Table 1 shows the mapping from ARPAbet to IPA symbols, with 11 more symbols [23] that are used in the TIMIT dataset [24,25] for a more detailed phoneme analysis. The symbol [h#] is not an actual phoneme but a special indicator symbol for the beginning and ending of a sentence, so the number of additional TIMIT phonemes is 11.

Table 1.
English phonetic symbols of the extended 2-letter ARPAbet used in the TIMIT dataset with mapping to IPA (International Phonetic Alphabet) symbols. The number of vowels is 19 and the number of consonants is 31. The begin/end marker is ignored in the phoneme recognition. There are 11 more special symbols used in the TIMIT dataset, so the total number of phonemes is 61.
The phonemes are broadly classified into consonants and vowels [26], and they are shown in the first and second columns of Table 1. The number of vowels and consonants used in ARPAbet are 19 and 31, so the total number of phonemes in this paper is 61. The consonants and vowels are further divided into more detailed categories according to the method of vocalization [27,28]. The most common types of consonants are stops, fricatives, affricates, nasals, and semivowels [29]. Stops are generated by the constriction and release of air in the mouth (closing-compression-release) [30], so there exists a certain duration called “stop gap” when the air is compressed inside the mouth. The stop sounds usually have large energies in low frequencies, roughly below 200 Hz. Fricatives have a looser constriction in the mouth, which allows producing some amount of friction at the point of contact. Most of their acoustic energy occurs at higher frequencies. Fricatives are divided into sibilants versus non-sibilants [31]. Sibilants tend to be louder than non-sibilants, and turbulence noise is stronger in sibilants than non-sibilants. Nasals have the same constriction as plosives except that air is allowed to pass through the nose but not through the mouth [32]. Nasals show the abrupt loss of overall energy because the nose is less efficient than the mouth in radiating the energy to the outside. Nasals involve a voiced feature in the frequency domain and in addition, they have formant frequencies like vowels.
The set of 61 phonemes are mapped to a smaller set of 39 labels [33] are shown in Table 2. In the new phoneme classes with multiple phonemes (classes 2, 5, 6, 8, 14, 15, 19, 20, 21, 28, 38, and 39), similar phonemes are grouped together because they are known to be hard to distinguish with acoustic features. All the closure sounds, pause, and glottal plosive ([q], equivalent to IPA [ʔ]) are all grouped together to mapped phoneme 39. They are relatively weak, are often accompanies by other sounds, and are very hard to distinguish by only sound signals without surrounding phonemes.
Table 2.
Mapping 61 phonemes to 39 phonemes for phoneme recognition. The grouping is based on the linguistic similarities between phonemes [33].
2.2. Baseline Phoneme Recognition with TIMIT Dataset
TIMIT corpus is designed to provide speech data for studies of acoustic-phonetic and speech recognition systems [24,25]. Phonetic transcripts for all sentences are provided in the TIMIT corpus distribution. A set of 61 phoneme labels from ARPAbet symbols are used in the transcripts. We subsequently collapsed the set of 61 labels into a smaller set of 39 labels in Table 2 during the scoring of performance of phoneme recognition. The baseline monophone classifier is developed by a recurrent neural network (RNN) [34,35,36]. From the input speech signals, mel-frequency cepstral coefficients (MFCCs) [37,38] are extracted from the input speech, their first and second order derivatives are computed, and the resultant 39 dimensional vector is obtained at every 10 milliseconds analyzed by 25-millisecond-overlapping windows. In this feature extraction process, all phonemes are pre-processed identically. The input to the baseline RNN is the 39-dimensional MFCC feature vectors and the number of output nodes is 39 one-hot vectors according to the 39 labels of the phonemes.
2.3. Confusion Matrix
A confusion matrix is a table of comparison results for the predicted and actual values to analyze intra-class and inter-class performances. It is used to evaluate the performance of supervised learning, such as classification in machine learning [39]. After training the baseline phoneme classification model, on a test set we evaluate phoneme classification accuracies and create a confusion matrix. Figure 1 shows the obtained confusion matrix from baseline phoneme classification results for 39 mapped phonemes. The y-axis is the real labels of the given phonemes, and the x-axis is the predicted labels from the baseline RNN. Each element of the matrix, denoted by where i and j are row and column numbers, respectively, is the rate of predicting phoneme j when the actual one is i. According to the definition of the confusion matrix, the diagonal elements () are the correct classification rates for individual phonemes and all off-diagonal elements () are ratios of incorrect classification pairs. For example, the first column of the the third row, , is brighter than the nearby components with the of the exception diagonal ones. It means that the phoneme [aw] is misclassified a lot to the phoneme [ae]. Among off-diagonal elements, ([uh], [ax]), ([uh], [ih]), ([n], [m]), and ([z], [s]) are examples of phoneme pairs with high misclassification rates.
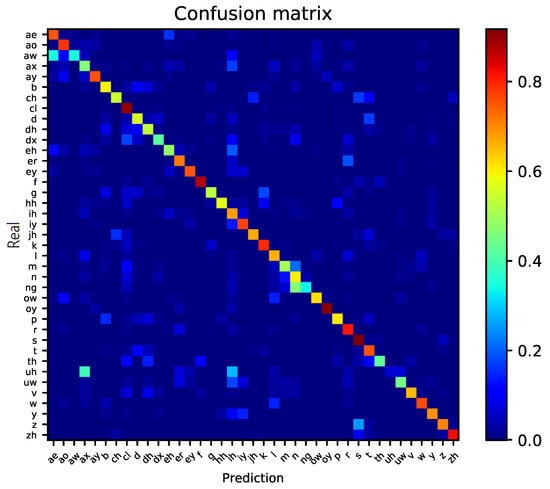
Figure 1.
Confusion matrix from the results of the baseline phoneme classification. Each row of the matrix represents the instances in a truth and each column represents the instances in a predicted class.
2.4. Phoneme Clustering Using Confusion Matrix
We clustered phonemes using the similarities defined by the sum of the off-diagonal elements in the confusion matrix as shown in Figure 1. We use an agglomerative method based on bottom up clustering, which starts from a unique cluster and ties up a pair one at a time [40]. To define the distance between a phoneme pair, we use the confusion error rates, obtained by one of the off-diagonal elements of the confusion matrix. For a newly created phoneme cluster, the new error rate is computed by the average of the merged phonemes. The process stops until the desired number of clusters remain. The results of hierarchical clustering are usually presented in a dendrogram [41]. As shown in Figure 2, the dendrogram is a tree diagram representing clusters obtained from hierarchical clustering. The y-axis shows phoneme labels and the phonemes are hierarchically paired with the height of the pair connection being the misclassification rate between the phonemes in the corresponding pair. The misclassification rate range from to along the x-axis. This method is called hierarchical clustering because paired phonemes are considered as a single phoneme after the pair is merged and all phonemes finally converge to a single cluster. The goal of the the proposed method is to improve the performance of phoneme recognition. Therefore, for the confusing phonemes, other classification method that is different from the baseline phoneme classifier is applied to further distinguish the phonemes in the same cluster.
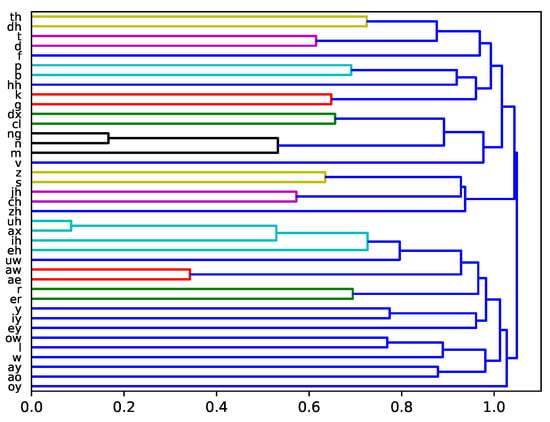
Figure 2.
Dendrogram of clustering. The x-axis shows a similarity of the clustered nodes. The higher the x-value, the more similar they are to each other. The y-axis is the phoneme label. This dendrogram shows that the consonants and vowels are well distinguished.
In Figure 2, if we backtrack the clustering path from the finally merged cluster at the right end, all the phonemes are broadly divided into two clusters. The largest cluster in the upper side is a set of phonemes from [th] to [zh]. The lower largest cluster consists of phonemes from [uh] to [oy], most of which are vowel sounds. However, [l] and [r] are consonants and more specifically, belong to voiced alveolar sounds. The phonemes [w] and [y] are semivowels, belonging to voiced labio-velar and voiced palatal sounds, respectively. These sounds are between vowels and consonants, so we split the lower cluster into “Vowels” and “Mixed”, as shown in the first and second rows of Table 3. Among vowels, the phonetic classification is somewhat grouped according to the pronunciation position similarly to the conventional phonetic classification, but is not accurately distinguished. This is because the pronunciation of vowels vary according to the adjacent phonemes. All of the phonemes in the upper largest cluster are consonants. The individual consonants have different characteristics, so we divided the consonant set into four major groups. The lower four rows of Table 3 are the phoneme groups based on the dendrogram in Figure 2 using a 0.6 cut-off with some additional adjustments. The first group is a set of nasal sounds, [m], [n], and [ng]. The second one is a group of fricatives, sounds with air friction with longer pronunciation time. Voiced sounds ([z] [zh] [v] [dh]) and their corresponding unvoiced sounds ([s] [f] [th]) are grouped together. The voiceless glottal fricative sound, [hh], also belongs to this group. The third is the affricates group ([jh] [ch]), weak sounds with friction. The stop sounds such as [t], [d], [p], and [b] are closely clustered. The clustering result is similar to the basic phonetic categories. Our resultant clusters are analogous to the conventional linguistic categories, so we can confirm that it provides reasonable results.
Table 3.
Phoneme groups obtained by agglomerative hierarchical clustering on the TIMIT training dataset.
To confirm that the phoneme categories are well clustered, we drew a confusion matrix with the new phoneme groups in Table 3, and it is shown in Figure 3a. The phonemes are reordered so that all the phonemes in the same group are located adjacently. The red-colored rectangles indicate phoneme groups, and Figure 3b is the table below the figure is a confusion matrix with the phoneme groups as classification targets. The diagonal ones represent that the accuracy of the group labeling is very high, which implies that the different groups are well distinguished. In other words, the phonemes within the same group are similar and confusing, so we focus on improving the recognition performance of these phonemes inside the groups.
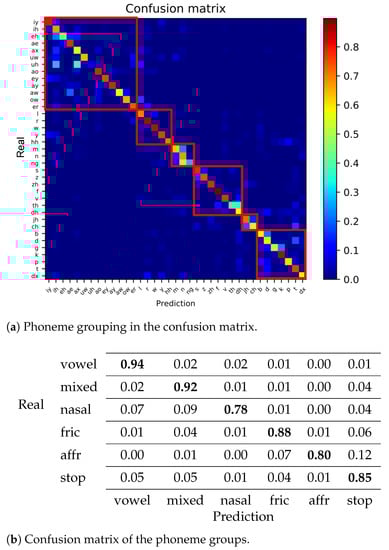
Figure 3.
(a) The confusion matrix rearranged according to the phoneme clustering result. Each row of the matrix represents the instances in a truth while each column represents the instances in a predicted class. (b) Confusion matrix of phoneme groups obtained by phoneme clustering.
3. Hierarchical Phoneme Classification
This section analyzes the characteristics of clustered phoneme groups. We explain the similarities and differences between phoneme groups, and the detailed implementation of group-specific models. By combining the group-specific phoneme classification models, a hierarchical phoneme classification framework is proposed. All individual group models are implemented by deep neural networks. The neural network automatically finds and recognizes the characteristics of speech signals. For sequential inputs such as speech signals, modeling temporal patterns is necessary. A recurrent neural network (RNN) is a type of neural network that can effectively learn temporal data. Therefore, phoneme classification model in this paper is built using RNN. More specifically, bi-directional long short-term memory (BLSTM) is adopted [8,42,43].
3.1. Overall Architecture
We propose a hierarchical phoneme classification model to improve the performance of phoneme classification. Figure 4 shows the overall model architecture. First, phoneme is predicted through the baseline phoneme classification model in which a whole phoneme is learned by using the same feature extraction method without distinguished characteristics. The baseline model was constructed using long short-term memory (LSTM) [17]. LSTM is an RNN cell that can avoid the problem of vanishing gradient using three gates of input, forget, and output. A typical LSTM uses a unidirectional structure that learns only by checking information from previous contexts. In the speech recognition, a bi-directional structure that learns both past and future information shows good performance [42,43,44]. Therefore, we implemented the model with the bi-directional LSTM (BLSTM) as a baseline system for phoneme recognition [45]. Three BLSTM layers were stacked and a fully-connected layer is added. At the output, the phoneme is classified using the softmax layer.
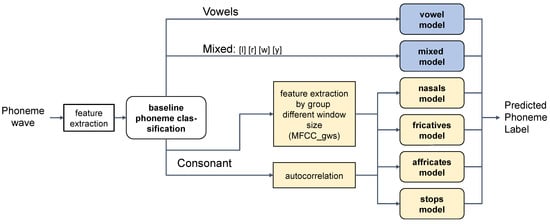
Figure 4.
Overall model structure of the proposed hierarchical classification. Using the baseline phoneme classifier, phoneme-dependent features are extracted and different phoneme group models are applied to obtain refined phoneme classification results.
The learning target of the predicted phoneme for the baseline model is the index of the phoneme group in Table 3. Then, the speech feature is re-extracted using the optimal window size for each phoneme group. In addition, autocorrelation is used together to distinguish voiced and unvoiced phonemes. The extracted speech features are used as inputs to each phoneme group model. The phoneme group model finally predicts the phoneme.
3.2. Vowels and Mixed Phoneme Classification
Two models for phoneme groups, ‘Vowel’ and ‘Mixed’ are trained by using group-specific training data. The ‘Vowel’ has 14 different labels as listed in Table 3, which is reduced from 39 phoneme labels of the baseline classifier. Out of the TIMIT training dataset, audio segments labeled by iy, ih, …, er are extracted and used in training ‘Vowel model’. To re-train ‘Mixed model’, training subsets labeled by l, r, w, and er are used. The model architecture is shown in Figure 5.
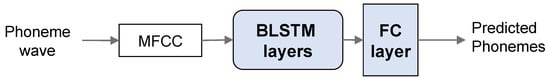
Figure 5.
Phoneme classification model architecture for the baseline, as well as Vowel and Mixed groups.
3.3. Varying Analysis Window Sizes for Consonants
Consonants are short and instantaneous, and vowels are longer and more consistent [46]. It would be better to shorten the analysis window size in feature extraction to more accurately distinguish short consonants. Therefore, we empirically decided appropriate analysis window lengths differently for individual phoneme groups. The baseline phoneme recognition model extracts features using MFCC with the same conditions such as same window and shift sizes for all phoneme. In this process, a 16 kHz sampling rate and 25 ms hamming window is used. The window shift was set to 10 ms. However, consonants are very short and strong compared to vowels. Since the properties of phonemes are different, we compared the performance of phoneme recognition by extracting features while changing window and shift sizes for each group. The window sizes are 5 ms, 10 ms, 15 ms, 20 ms, 25 ms, and 30 ms. ‘MFCC_gws’ in Figure 4 is the MFCC features with varying window sizes.
3.4. Voiced and Unvoiced Consonants Classification
Several pairs of different consonants are distinguished by being voiced or unvoiced. For voiced sounds, the glottis is closed or nearly closed, whereas for voiceless sounds it is wide open, with the distance between the folds actually amounting to only a fraction of a millimeter [18]. The voiced sounds carry periodic pulses generated by the glottis vibration, while almost no periodicity but turbulent noise is observed in the unvoiced sounds. Phonemes [b], [p], [d], and [t], all belong to the stops group in the phonetic classification. However [b], [d] are voiced phonemes and [p], [t] are unvoiced ones. Phonemes [z] and [s] are both fricatives, but [z] is voiced and [s] unvoiced. These pairs of examples are usually hard to distinguish because they are generated at the almost same place in the oral cavity area. Similarly, [p] and [b] are produced at the same place in the mouth and the only difference is being voiced or unvoiced. If we add a feature that helps distinguish voiced and unvoiced phonemes especially when recognizing consonants and create a model that can classify them, the performance may be improved. Therefore, we use autocorrelation functions to add the periodicity feature of the phoneme sound if the found phoneme falls into consonant categories.
Voiced and unvoiced sounds can be distinguished by pitch, or equivalently fundamental periodicity values [47]. Autocorrelation measures the similarity function of the time lag with itself in the signal [19,20]. Due to the vibration of the vocal cords, the voiced sound is periodic and this vibration interval is pitch. Autocorrelation is a unique case of cross-correlation [48,49]. The cross-correlation measures the similarity of the two discrete signals, and , defined by [50]:
where is an integer time lag that takes values from . If two discrete signals are identical, this process is defined as autocorrelation, which is given by:
Algorithm 1 is the pseudo code for the autocorrelation computation. The array x is the speech signal, N is the size of signal, and the autocorrelation function is denoted by . Figure 6a shows the waveform of a voiced consonant phoneme [d] and its autocorrelation computed by Algorithm 1. Likewise, Figure 6b is for an unvoiced consonant phoneme [t]. The autocorrelation of phoneme [d] shows nonzero values, while that of phoneme [t] has almost zero, meaning that there is no significant pitch. From these results, autocorrelation can help in distinguishing voiced and unvoiced phonemes.
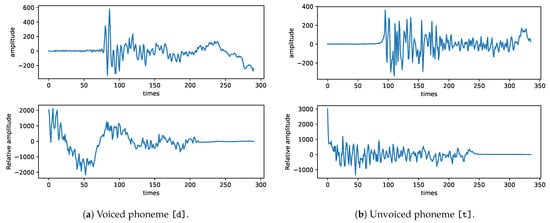
Figure 6.
Waveforms and autocorrelation functions of a voiced sound (phoneme [d]) and a unvoiced sound (phoneme [t]). Upper floats are waveforms and lower floats are computed autocorrelation functions.
| Algorithm 1 Autocorrelation |
| H] |
| N length of signal x |
| for to N do |
| for to do |
| end for |
| end for |
3.5. Consonant Group Model Architectures
As described in the previous section, we focus on making a better decision on consonants rather than on vowels. Consonants show various types of energy distributions in phoneme groups. Therefore, we implement appropriate models for individual consonant phoneme groups and verify their performance. MFCC_gws is a feature extraction method with group different window sizes, as well as autocorrelation features added to help distinguish voiced phonemes and unvoiced phonemes within the consonant group. By combining the two features [51], three phoneme group models are created.
Figure 7 shows three different model configurations. Figure 7a simply concatenates MFCC_gws and the autocorrelation vector at the input unit and passes them to a BLSTM layer. A fully connected (FC) layer generates softmax outputs as many as the number phoneme to generate predictions for phoneme labels. Figure 7b has individual BLSTM layers for MFCC_gws and the autocorrelation vector, and concatenates the outputs to pass them through an FC layer. The advantage of output concatenation over input concatenation is that the mismatches of the different kinds of features, such as scale differences can be automatically adapted to each other. The concatenation at the BLSTM output layers is expected to be more reliable than Figure 7a. Figure 7c adds another BLSTM layer to the concatenated output of Figure 7b. These three configurations are used to construct the hierarchical phoneme classifier in Figure 4.
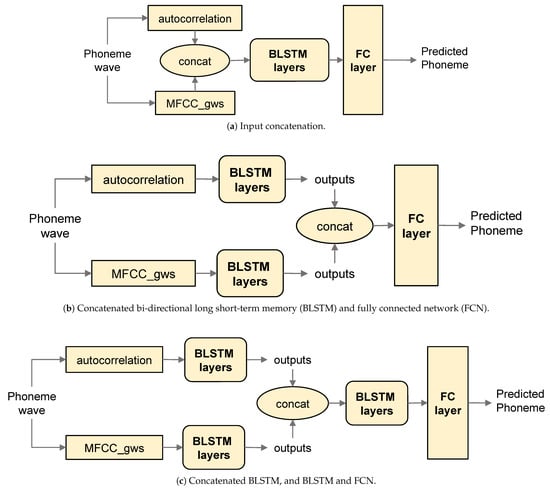
Figure 7.
Various types of the consonant group models with additional autocorrelation features. (a) input features are concatenated. (b) BLSTM outputs are cocatenated. (c) another BLSTM layer is added for the concatenated BLSTM outputs.
4. Experimental Results
This section shows the analysis results of the phoneme group characteristics described in Section 2 and also presents comparison results of the performance of the phoneme group model with that of the baseline model.
4.1. TIMIT Database
We have carried out speech recognition experiments on the TIMIT corpus [25], which is designed to provide speech data for studies of acoustic-phonetic and speech recognition systems. The speech data was recorded at Texas Instruments (TI), transcribed at the Massachusetts Institute of Technology (MIT), and prepared for CD-ROM production by the National Institute of Standards and Technology (NIST). The corpus includes the speech waveforms with phonetic transcriptions. TIMIT corpus has 6300 sentences, spoken by 630 speakers, who spoke exactly 10 sentences each. There are three types of sentences. Dialect sentences (SA) were recorded from speakers with dialectal diversity. Phonetically-compact (SX) and phonetically-diverse sentences (SI) were created to model different situations of phoneme distributions. Phonetic transcripts for all sentences are provided in the TIMIT corpus distribution. The full phoneme transcript of an example sentence is shown in Table 4. All the numbers are in samples, so the length of the audio file in the example is 46,797/16,000 kHz s.
Table 4.
An example of the phonetic transcripts in the TIMIT corpus. The audio file is “dr1/rcjf0/sa1.wav” in the provided CD-ROM, and its sentence transcript is “sa1.txt” in the same directory. The phonetic transcript file is “sa1.phn”, and full timings of phonemes are provided as well.
The whole corpus is divided into non-overlapping training and testing sets. We use core test set [25] in an evaluating performance of phoneme recognition. The core test data has a total of 24 speakers, more specifically two male and one female from each of the eight dialect regions. The number of phoneme tokens are 177,080 in the training set and 9098 in the testing set. The number of tokens for each of the five phoneme groups is shown in Table 5.
Table 5.
Phoneme token counts of the TIMIT train and core test sets, grouped by phoneme classes.
4.2. MFCC vs. Log Filter Bank Energy
We compared the performance of two commonly-used features in speech recognition. The first one is mel-frequency cepstral coefficients (MFCCs) and the other one is log filterbank energies. Figure 8 shows the performance differences of four phoneme groups according to the change of window sizes. Blue lines are MFCC results and orange lines are the results of log filter bank energy features [37,38,52]. In most cases, blue lines are below orange lines, showing less phoneme recognition errors. Based on these results, we chose MFCC in the phoneme group models and the overall model.
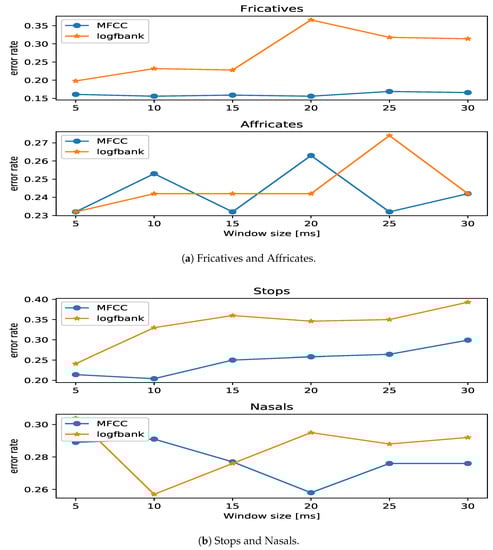
Figure 8.
The error rates using mel-frequency cepstral coefficients (MFCCs) and log filter bank energy according to change window size. (a) shows fricatives and afficates. (b) shows stops and nasals. In all phoneme groups, the error rate of MFCC is lower than that of log filter bank energy.
4.3. Various Window Sizes
In order to find the optimal window sizes for individual phoneme groups, we tried various window sizes in the MFCC feature extraction. Table 6 shows performance variations by choosing different window sizes with six phoneme group models. For fricatives and stops, 10 ms window size was the best, both 15 ms and 25 ms were the best for affricates ([jh] and [ch]) and 20 ms was the best for nasal. This is because fricative and stop sounds are very short consonants, and nasal sounds are voiced and close to vowel sounds. Generally, consonant models showed lower phoneme error rates with smaller window sizes because the actual vocalization length is shorter for consonants, so it is possible to obtain more information by using a small window length. Surprisingly, for vowel/semivowel and closes, window analysis size did not affect performance. Unlike consonants, they have very stable characteristics over time, so a change in analysis sizes made no difference. We used the best window sizes for each of the phoneme group models to maximize the performance of the proposed hierarchical phoneme classification model.
Table 6.
The results of overall model using MFCC with varying window sizes.
4.4. Phoneme Group Model Training
The baseline model uses MFCC features only. Clustering result showed that voiced and unvoiced phonemes are hard to distinguish. To overcome this problem, autocorrelation feature is added in phoneme group models because it shows very different values for voiced and unvoiced speech signals. Table 7 shows the performance of phoneme group models. This result shows that using autocorrelation is better than the MFCC alone. In addition, the performance of the three models was different for each phoneme group. Since the phoneme group has different characteristics, the optimal model structure is also different. Based on these results, we constructed a hierarchical model using phoneme group models.
Table 7.
The results that different window sizes in MFCC and MFCC with autocorrelation and a three feature ensemble model.
4.5. Performance of the Hierarchical Classification
We implemented a hierarchical phoneme classification model that combines all the phoneme group models with the optimal window sizes for the corresponding phoneme groups and evaluated the performance. We used the Adam optimizer, which adaptively adjusts the learning rate of the backpropagation learning algorithm for the artificial neural networks [53]. The initial learning rate of the Adam optimizer is set to be , and gradually lowered as the learning proceeds. Batch size 512 is used during training of each phoneme group model. Dropout [54] with a probability of 0.2 is added across the BLSTM layers. Table 8 represents the performance of the overall model. Compared with the baseline, models with different window sizes for phoneme groups had an improved performance. In addition, the overall model using the phoneme group model combining MFCC and autocorrelation showed better performance.
Table 8.
The results that baseline and integration phoneme group model.
5. Discussion
In this paper, we proposed a hierarchical speech recognition model based on phoneme clustering. The proposed model first classifies the entire phoneme by a baseline phoneme classifier without considering phoneme characteristics. Then the retrained phoneme group models are used using the initial phoneme classification results. A confusion matrix of baseline phoneme classification was used to group each phoneme with similar characteristics. The confusion matrix shows which phonemes are not well distinguished. An analysis of phoneme characteristics in the TIMIT database revealed the differences of the phonemes in terms of lengths and autocorrelation values, so they were used in constructing phoneme group-specific models. We extracted features using different window size and window shift optimized for each phoneme group, and used autocorrelation as a feature as well as MFCC to improve the performance of the phoneme group models. The results of the experiment of the four consonant phoneme group models showed that the phoneme groups have different characteristics, and thus, the suitable models are different. The hierarchical phoneme classification model consisting of the baseline model and the phoneme group model was evaluated. The result shows that the phoneme specific feature extraction method and classification model have an improved performance of phoneme classification and speech recognition. One drawback of the proposed hierarchical classification method is that it does not improve the vowel classification performance because the proposed autocorrelation features and varying window sizes only help consonant classification. The MFCC is well suited to vowel classification and almost optimal classification performance is achieved, so very little improvement is expected.
Author Contributions
Conceptualization, J.-S.P., J.-H.K., and G.-J.J.; methodology, D.O.; software, D.O.; validation, D.O. and G.-J.J.; formal analysis, J.-H.K. and J.-S.P.; investigation, J.-H.K.; resources, G.-J.J. and J.-H.K.; data curation, D.O.; writing–original draft preparation, D.O. and G.-J.J.; writing–review and editing, J.-S.P. and J.-H.K.; visualization, D.O.; supervision, G.-J.J.; project administration, G.-J.J.; funding acquisition, G.-J.J. All authors have read and agreed to the published version of the manuscript.
Funding
This work was supported by Institute for Information and Communications Technology Promotion (IITP) grant funded by the Korean government (MSIT) (No. R7124-16-0004, Development of Intelligent Interaction Technology Based on Context Awareness and Human Intention Understanding), by the National Research Foundation of Korea (NRF) grant funded by the Korea government (MSIP) (No. NRF-2017M3C1B6071400), and the BK21 Plus project funded by the Ministry of Education, Korea (21A20131600011).
Institutional Review Board Statement
Not applicable.
Informed Consent Statement
Not applicable.
Data Availability Statement
The TIMIT dataset can be obtained from the Linguistic Data Consortium (LDC), https://www.ldc.upenn.edu.
Conflicts of Interest
The authors declare no conflict of interest.
Abbreviations
The following abbreviations are used in this manuscript:
| ARPA | Advanced Research Projects Agency |
| ASR | Automatic Speech Recognition |
| BLSTM | Bi-directional Long Short-Term Memory |
| CNN | Convolutional Neural Network |
| IPA | International Phonetic Alphabet |
| LSTM | Long Short-Term Memory |
| MFCC | Mel-Frequency Cepstral Coefficient |
| NIST | National Institute of Standards and Technology |
| RNN | Recurrent Neural Network |
References
- Hinton, G.; Deng, L.; Yu, D.; Dahl, G.E.; Mohamed, A.R.; Jaitly, N.; Senior, A.; Vanhoucke, V.; Nguyen, P.; Sainath, T.N.; et al. Deep neural networks for acoustic modeling in speech recognition: The shared views of four research groups. IEEE Signal Process. Mag. 2012, 29, 82–97. [Google Scholar] [CrossRef]
- Yu, D.; Li, J. Recent progresses in deep learning based acoustic models. IEEE/CAA J. Autom. Sin. 2017, 4, 396–409. [Google Scholar] [CrossRef]
- Xiong, W.; Wu, L.; Alleva, F.; Droppo, J.; Huang, X.; Stolcke, A. The Microsoft 2017 conversational speech recognition system. In Proceedings of the 2018 IEEE International Conference on Acoustics, Speech and Signal Processing (ICASSP), Calgary, AB, Canada, 15–20 April 2018; pp. 5934–5938. [Google Scholar]
- Caterini, A.L.; Chang, D.E. Deep Neural Networks in a Mathematical Framework; Springer: New York, NY, USA, 2018. [Google Scholar] [CrossRef]
- Taylor, S.; Kim, T.; Yue, Y.; Mahler, M.; Krahe, J.; Rodriguez, A.G.; Hodgins, J.K.; Matthews, I.A. A deep learning approach for generalized speech animation. ACM Trans. Gr. 2017, 36, 1–11. [Google Scholar] [CrossRef]
- Graves, A. Sequence Transduction with Recurrent Neural Networks. arXiv 2012, arXiv:1211.3711. [Google Scholar]
- Graves, A.; Mohamed, A.R.; Hinton, G. Speech recognition with deep recurrent neural networks. In Proceedings of the 2013 IEEE International Conference on Acoustics, Speech and Signal Processing, Vancouver, BC, Canada, 26–31 May 2013; pp. 6645–6649. [Google Scholar]
- Zeyer, A.; Doetsch, P.; Voigtlaender, P.; Schlüter, R.; Ney, H. A Comprehensive Study of Deep Bidirectional LSTM RNNs for Acoustic Modeling in Speech Recognition. In Proceedings of the 2017 IEEE International Conference on Acoustics, Speech and Signal Processing (ICASSP), New Orleans, LA, USA, 5–9 May 2017; pp. 2462–2466. [Google Scholar]
- Abdel-Hamid, O.; Mohamed, A.R.; Jiang, H.; Deng, L.; Penn, G.; Yu, D. Convolutional neural networks for speech recognition. IEEE/ACM Trans. Audio Speech Lang. Process. 2014, 22, 1533–1545. [Google Scholar] [CrossRef]
- Tóth, L. Phone recognition with hierarchical convolutional deep maxout networks. EURASIP J. Audio Speech Music Process. 2015, 2015, 25. [Google Scholar] [CrossRef]
- Hannun, A.; Case, C.; Casper, J.; Catanzaro, B.; Diamos, G.; Elsen, E.; Prenger, R.; Satheesh, S.; Sengupta, S.; Coates, A.; et al. Deep speech: Scaling up end-to-end speech recognition. arXiv 2014, arXiv:1412.5567. [Google Scholar]
- Miao, Y.; Gowayyed, M.; Metze, F. EESEN: End-to-end speech recognition using deep RNN models and WFST-based decoding. In Proceedings of the 2015 IEEE Workshop on Automatic Speech Recognition and Understanding (ASRU), Scottsdale, AZ, USA, 13–17 December 2015; pp. 167–174. [Google Scholar]
- Bahdanau, D.; Chorowski, J.; Serdyuk, D.; Brakel, P.; Bengio, Y. End-to-end attention-based large vocabulary speech recognition. In Proceedings of the 2016 IEEE International Conference on Acoustics, Speech and Signal Processing (ICASSP), Shanghai, China, 20–25 March 2016; pp. 4945–4949. [Google Scholar]
- Zhang, Y.; Pezeshki, M.; Brakel, P.; Zhang, S.; Bengio, C.L.Y.; Courville, A. Towards end-to-end speech recognition with deep convolutional neural networks. arXiv 2017, arXiv:1701.02720. [Google Scholar]
- Battenberg, E.; Chen, J.; Child, R.; Coates, A.; Gaur, Y.; Li, Y.; Liu, H.; Satheesh, S.; Seetapun, D.; Sriram, A.; et al. Exploring Neural Transducers for End-to-End Speech Recognition. In Proceedings of the 2017 IEEE Automatic Speech Recognition and Understanding Workshop (ASRU), Okinawa, Japan, 16–20 December 2017. [Google Scholar]
- Chiu, C.C.; Sainath, T.N.; Wu, Y.; Prabhavalkar, R.; Nguyen, P.; Chen, Z.; Kannan, A.; Weiss, R.J.; Rao, K.; Gonina, E.; et al. State-of-the-art speech recognition with sequence-to-sequence models. In Proceedings of the 2018 IEEE International Conference on Acoustics, Speech and Signal Processing (ICASSP), Calgary, AB, Canada, 15–20 April 2018; pp. 4774–4778. [Google Scholar]
- Hochreiter, S.; Schmidhuber, J. Long short-term memory. Neural Comput. 1997, 9, 1735–1780. [Google Scholar] [CrossRef]
- Hayes, B. Introductory Phonology; Malden, M.A., Ed.; Wiley-Blackwell: Oxford, UK, 2009. [Google Scholar]
- Rabiner, L. On the use of autocorrelation analysis for pitch detection. IEEE Trans. Acoust. Speech Signal Process. 1977, 25, 24–33. [Google Scholar] [CrossRef]
- Hernández, M. A tutorial to extract the pitch in speech signals using autocorrelation. Open J. Technol. Eng. Discip. (OJTED) 2016, 2, 1–11. [Google Scholar]
- Klautau, A. ARPABET and the TIMIT Alphabet. 2001. [Google Scholar]
- International Youth Association TIP. Reproduction of The International Phonetic Alphabet; Cambridge University Press: London, UK, 2005. [Google Scholar]
- Gold, B.; Morgan, N.; Ellis, D. Speech and Audio Signal Processing: Processing and Perception of Speech and Music, 2nd ed.; Wiley: Hoboken, NJ, USA, 2011. [Google Scholar]
- Linguistic Data Consortium. Table of All the Phonemic and Phonetic Symbols Used in the Timit Lexicon; Linguistic Data Consortium: Philadelphia, PA, USA, 1990. [Google Scholar]
- Garofolo, J.; Lamel, L.; Fisher, W.; Fiscus, J.; Pallett, D. DARPA TIMIT acoustic-phonetic continous speech corpus CD-ROM. NIST speech disc 1-1.1. NASA STI/Recon Tech. Rep. N 1993, 93, 1–94. [Google Scholar]
- Ladefoged, P.; Disner, S.F. Vowels and Consonants; John Wiley & Sons: Hoboken, NJ, USA, 2012. [Google Scholar]
- Ades, A.E. Vowels, consonants, speech, and nonspeech. Psychol. Rev. 1977, 84, 524. [Google Scholar] [CrossRef]
- Stevens, K.N. Acoustic Phonetics; MIT Press: Cambridge, MA, USA, 2000; Volume 30. [Google Scholar]
- Miller, G.A.; Nicely, P.E. An analysis of perceptual confusions among some English consonants. J. Acoust. Soc. Am. 1955, 27, 338–352. [Google Scholar] [CrossRef]
- Halle, M.; Hughes, G.W.; Radley, J.P. Acoustic properties of stop consonants. J. Acoust. Soc. Am. 1957, 29, 107–116. [Google Scholar] [CrossRef]
- Shadle, C.H. The acoustics of fricative consonants. Tech. Rep. 1985, 1–200. [Google Scholar] [CrossRef]
- Fujimura, O. Analysis of nasal consonants. J. Acoust. Soc. Am. 1962, 34, 1865–1875. [Google Scholar] [CrossRef]
- Halberstadt, A.K. Heterogeneous Acoustic Measurements and Multiple Classifiers for Speech Recognition; Massachusetts Institute of Technology: Cambridge, MA, USA, 1999. [Google Scholar]
- Evangelopoulos, G.N. Efficient Hardware Mapping of Long Short-Term Memory Neural Networks for Automatic Speech Recognition. Master’s Thesis, KU Leuven, Leuven, Belgium, 2016. [Google Scholar]
- Ek, J.V.; Michálek, J.; Psutka, J. Recurrent DNNs and its Ensembles on the TIMIT Phone Recognition Task. arXiv 2018, arXiv:1806.07186. [Google Scholar]
- Michaálek, J.; Ek, J.V. A Survey of Recent DNN Architectures on the TIMIT Phone Recognition Task. arXiv 2018, arXiv:1806.07974. [Google Scholar]
- Han, W.; Chan, C.F.; Choy, C.S.; Pun, K.P. An efficient MFCC extraction method in speech recognition. In Proceedings of the 2006 IEEE International Symposium on Circuits and Systems, Island of Kos, Greece, 21–24 May 2006; p. 4. [Google Scholar]
- Muda, L.; Begam, M.; Elamvazuthi, I. Voice recognition algorithms using mel frequency cepstral coefficient (MFCC) and dynamic time warping (DTW) techniques. arXiv 2010, arXiv:1003.4083. [Google Scholar]
- Davis, J.; Goadrich, M. The relationship between Precision-Recall and ROC curves. In Proceedings of the 23rd International Conference on Machine Learning, Pittsburgh, PA, USA, 25–29 June 2006; pp. 233–240. [Google Scholar]
- Corpet, F. Multiple sequence alignment with hierarchical clustering. Nucl. Acids Res. 1988, 16, 10881–10890. [Google Scholar] [CrossRef] [PubMed]
- Wilks, D.S. Cluster analysis. In International Geophysics; Elsevier: Amsterdam, The Netherlands, 2011; Volume 100, pp. 603–616. [Google Scholar]
- Schuster, M.; Paliwal, K.K. Bidirectional recurrent neural networks. IEEE Trans. Signal Process. 1997, 45, 2673–2681. [Google Scholar] [CrossRef]
- Graves, A.; Schmidhuber, J. Framewise phoneme classification with bidirectional LSTM networks. In Proceedings of the 2005 IEEE International Joint Conference on Neural Networks, Montreal, QC, Canada, 31 July–4 August 2005; Volume 4, pp. 2047–2052. [Google Scholar]
- Hannun, A.Y.; Maas, A.L.; Jurafsky, D.; Ng, A.Y. First-pass large vocabulary continuous speech recognition using bi-directional recurrent DNNs. arXiv 2014, arXiv:1408.2873. [Google Scholar]
- Graves, A.; Fernández, S.; Schmidhuber, J. Bidirectional LSTM networks for improved phoneme classification and recognition. In International Conference on Artificial Neural Networks; Springer: New York, NY, USA, 2005; pp. 799–804. [Google Scholar]
- Caramazza, A.; Chialant, D.; Capasso, R.; Miceli, G. Separable processing of consonants and vowels. Nature 2000, 403, 428. [Google Scholar] [CrossRef] [PubMed]
- Rabiner, L.R.; Schafer, R.W. Digital Processing of Speech Signals; Pearson Publishing: NewYork, NY, USA, 1978; Volume 100. [Google Scholar]
- Chen, C.H. Signal Processing Handbook; CRC Press: Boca Raton, FL, USA, 1988; Volume 51. [Google Scholar]
- Furui, S.; Sondhi, M.M. Advances in Speech Signal Processing; Marcel Dekker, Inc.: New York, NY, 1991. [Google Scholar]
- Proakis, J.G. Digital Signal Processing: Principles Algorithms and Applications; Pearson Education India Services Pvt.: Chennai, India, 2001. [Google Scholar]
- Ngiam, J.; Khosla, A.; Kim, M.; Nam, J.; Lee, H.; Ng, A.Y. Multimodal deep learning. In Proceedings of the 28th International Conference On Machine Learning (ICML-11), Bellevue, WA, USA, 28 June–2 July 2011; pp. 689–696. [Google Scholar]
- Nadeu, C.; Hernando, J.; Gorricho, M. On the decorrelation of filter-bank energies in speech recognition. In Proceedings of the Fourth European Conference on Speech Communication and Technology, Madrid, Spain, 18–21 September 1995. [Google Scholar]
- Kingma, D.P.; Ba, J. Adam: A method for stochastic optimization. arXiv 2014, arXiv:1412.6980. [Google Scholar]
- Srivastava, N.; Hinton, G.; Krizhevsky, A.; Sutskever, I.; Salakhutdinov, R. Dropout: A simple way to prevent neural networks from overfitting. J. Mach. Learn. Res. 2014, 15, 1929–1958. [Google Scholar]
Publisher’s Note: MDPI stays neutral with regard to jurisdictional claims in published maps and institutional affiliations. |
© 2021 by the authors. Licensee MDPI, Basel, Switzerland. This article is an open access article distributed under the terms and conditions of the Creative Commons Attribution (CC BY) license (http://creativecommons.org/licenses/by/4.0/).